bayou corne 3d - 2013 corne 3d - 2013 summary of ... the 3d reflection seismic survey yielded 48,906...
TRANSCRIPT
Bayou Corne 3D - 2013
3d reflection seismic results in response to
LADNR DIRECTIVE 2a, FIFTH AMENDMENT TO THE
DECLARATION OF EMERGENCY AND DIRECTIVE
20 APRIL 2013
1
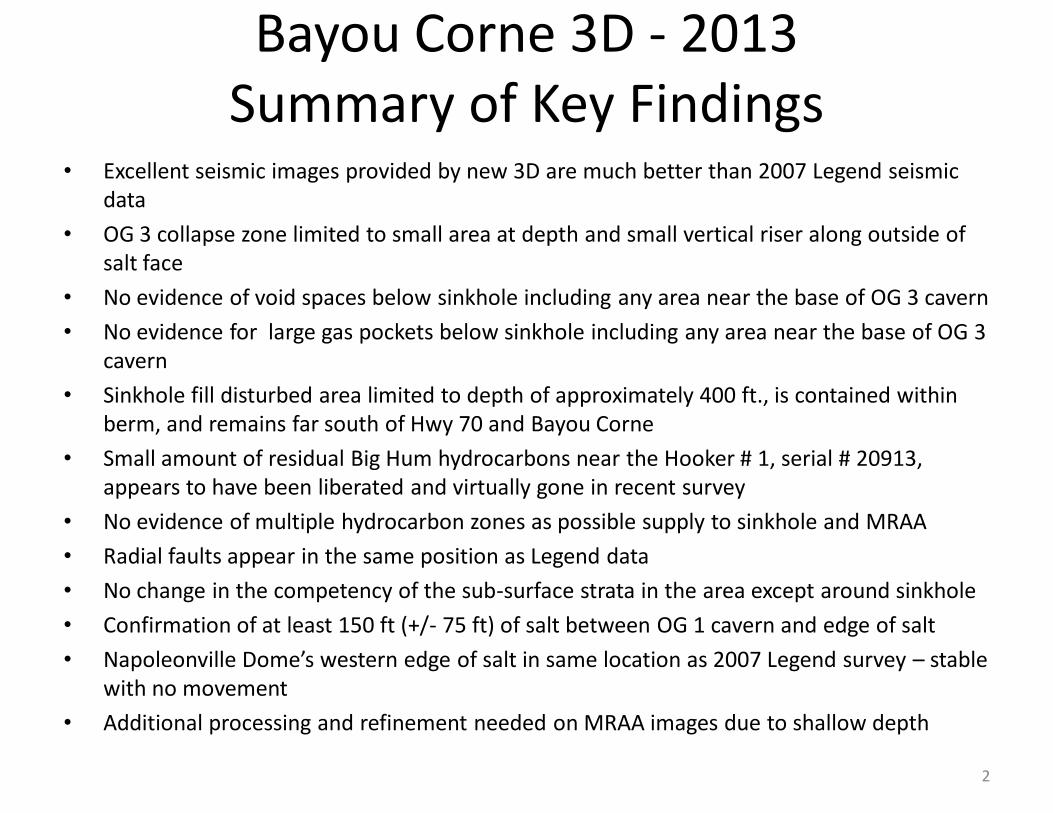
Bayou Corne 3D - 2013 Summary of Key Findings
• Excellent seismic images provided by new 3D are much better than 2007 Legend seismic data
• OG 3 collapse zone limited to small area at depth and small vertical riser along outside of salt face
• No evidence of void spaces below sinkhole including any area near the base of OG 3 cavern
• No evidence for large gas pockets below sinkhole including any area near the base of OG 3 cavern
• Sinkhole fill disturbed area limited to depth of approximately 400 ft., is contained within berm, and remains far south of Hwy 70 and Bayou Corne
• Small amount of residual Big Hum hydrocarbons near the Hooker # 1, serial # 20913, appears to have been liberated and virtually gone in recent survey
• No evidence of multiple hydrocarbon zones as possible supply to sinkhole and MRAA
• Radial faults appear in the same position as Legend data
• No change in the competency of the sub-surface strata in the area except around sinkhole
• Confirmation of at least 150 ft (+/- 75 ft) of salt between OG 1 cavern and edge of salt
• Napoleonville Dome’s western edge of salt in same location as 2007 Legend survey – stable with no movement
• Additional processing and refinement needed on MRAA images due to shallow depth
2
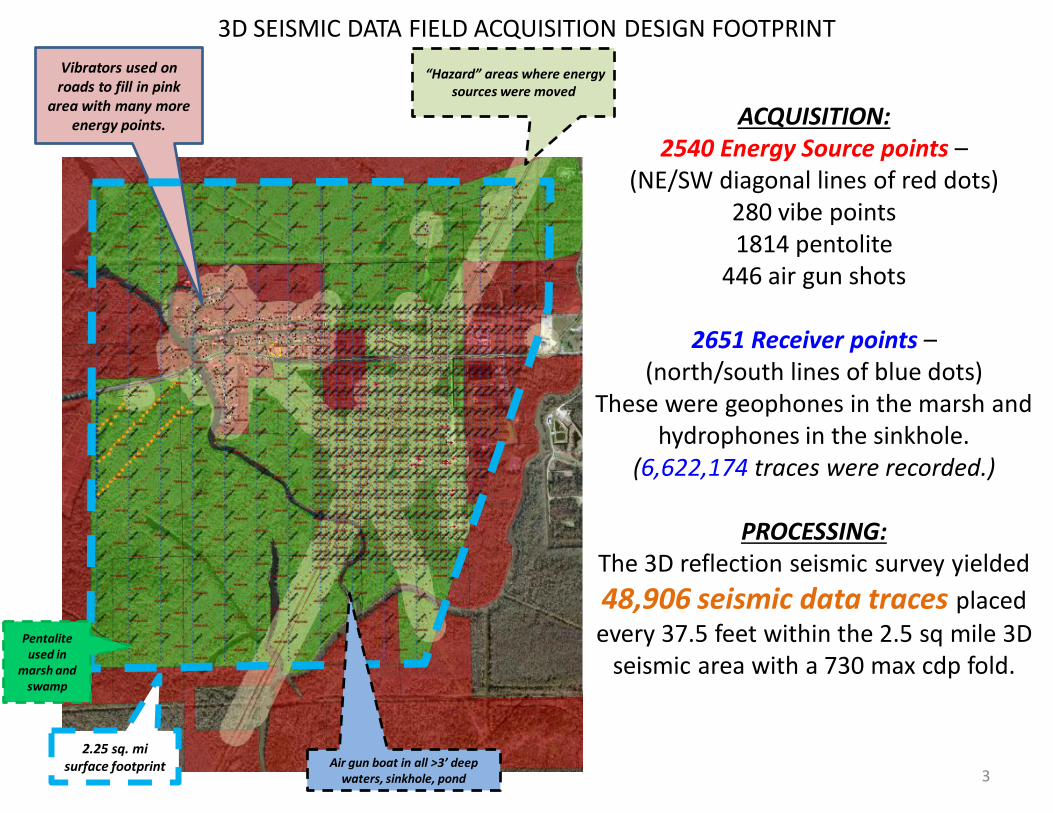
ACQUISITION: 2540 Energy Source points –
(NE/SW diagonal lines of red dots) 280 vibe points 1814 pentolite
446 air gun shots
2651 Receiver points – (north/south lines of blue dots)
These were geophones in the marsh and hydrophones in the sinkhole.
(6,622,174 traces were recorded.)
PROCESSING: The 3D reflection seismic survey yielded
48,906 seismic data traces placed
every 37.5 feet within the 2.5 sq mile 3D seismic area with a 730 max cdp fold.
2.25 sq. mi surface footprint
3D SEISMIC DATA FIELD ACQUISITION DESIGN FOOTPRINT
Vibrators used on roads to fill in pink
area with many more energy points.
“Hazard” areas where energy sources were moved
Pentalite used in
marsh and swamp
Air gun boat in all >3’ deep waters, sinkhole, pond 3
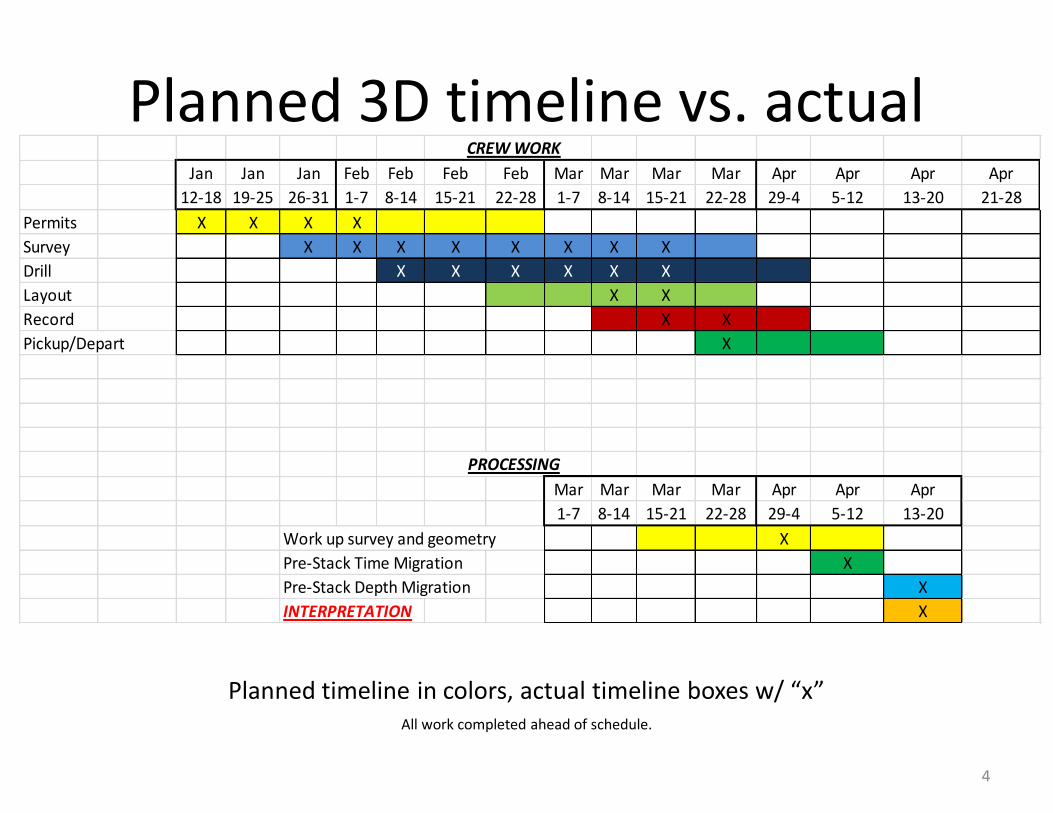
Planned 3D timeline vs. actual CREW WORK
Jan Jan Jan Feb Feb Feb Feb Mar Mar Mar Mar Apr Apr Apr Apr
12-18 19-25 26-31 1-7 8-14 15-21 22-28 1-7 8-14 15-21 22-28 29-4 5-12 13-20 21-28
Permits X X X X
Survey X X X X X X X X
Drill X X X X X X
Layout X X
Record X X
Pickup/Depart X
PROCESSING
Mar Mar Mar Mar Apr Apr Apr
1-7 8-14 15-21 22-28 29-4 5-12 13-20
Work up survey and geometry X
Pre-Stack Time Migration X
Pre-Stack Depth Migration X
INTERPRETATION X
Planned timeline in colors, actual timeline boxes w/ “x” All work completed ahead of schedule.
4
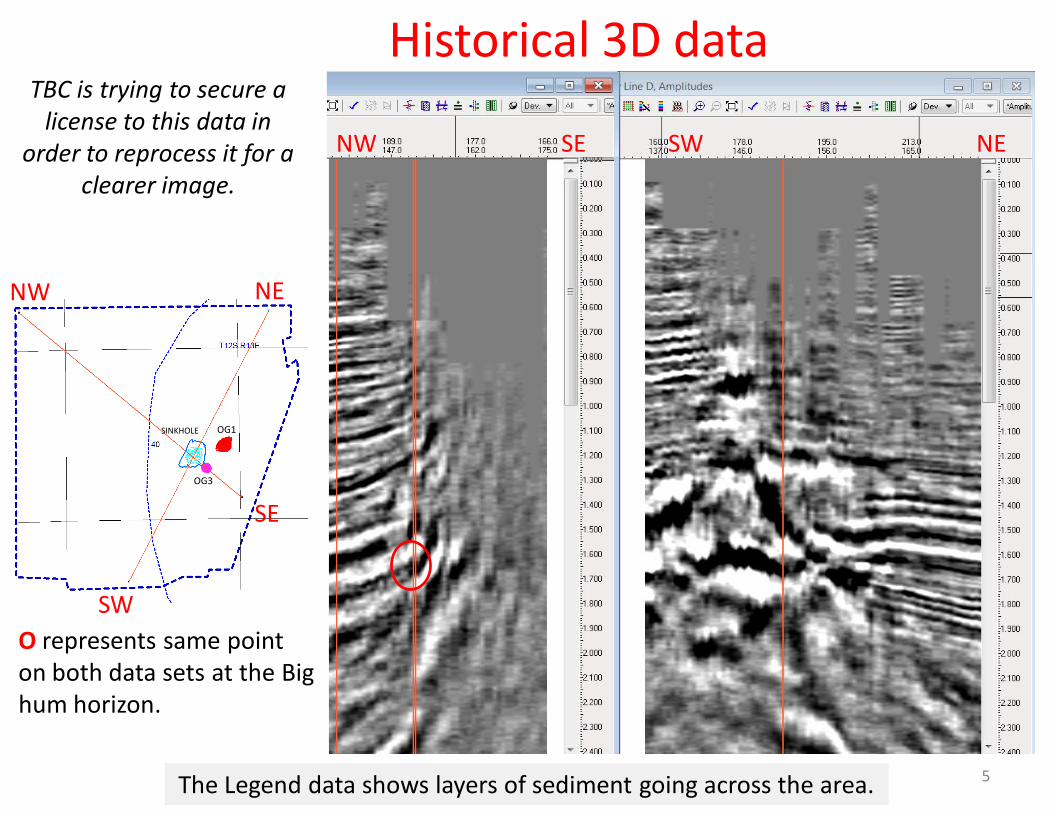
Historical 3D data
NW SE SW NE
NW NE
SE
SW
SINKHOLE OG1
OG3
5 The Legend data shows layers of sediment going across the area.
O represents same point on both data sets at the Big hum horizon.
TBC is trying to secure a license to this data in
order to reprocess it for a clearer image.
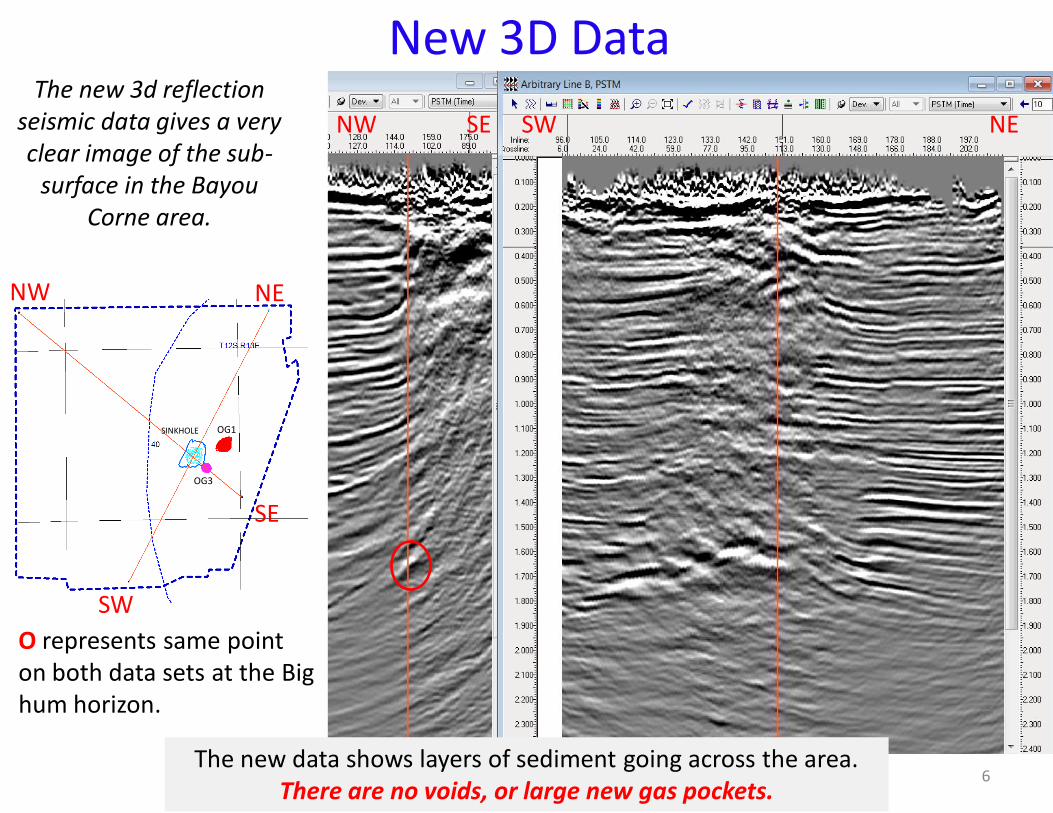
New 3D Data
NW SE SW NE
NW NE
SW
6
SE
SINKHOLE OG1
OG3
The new data shows layers of sediment going across the area. There are no voids, or large new gas pockets.
O represents same point on both data sets at the Big hum horizon.
The new 3d reflection seismic data gives a very clear image of the sub-
surface in the Bayou Corne area.
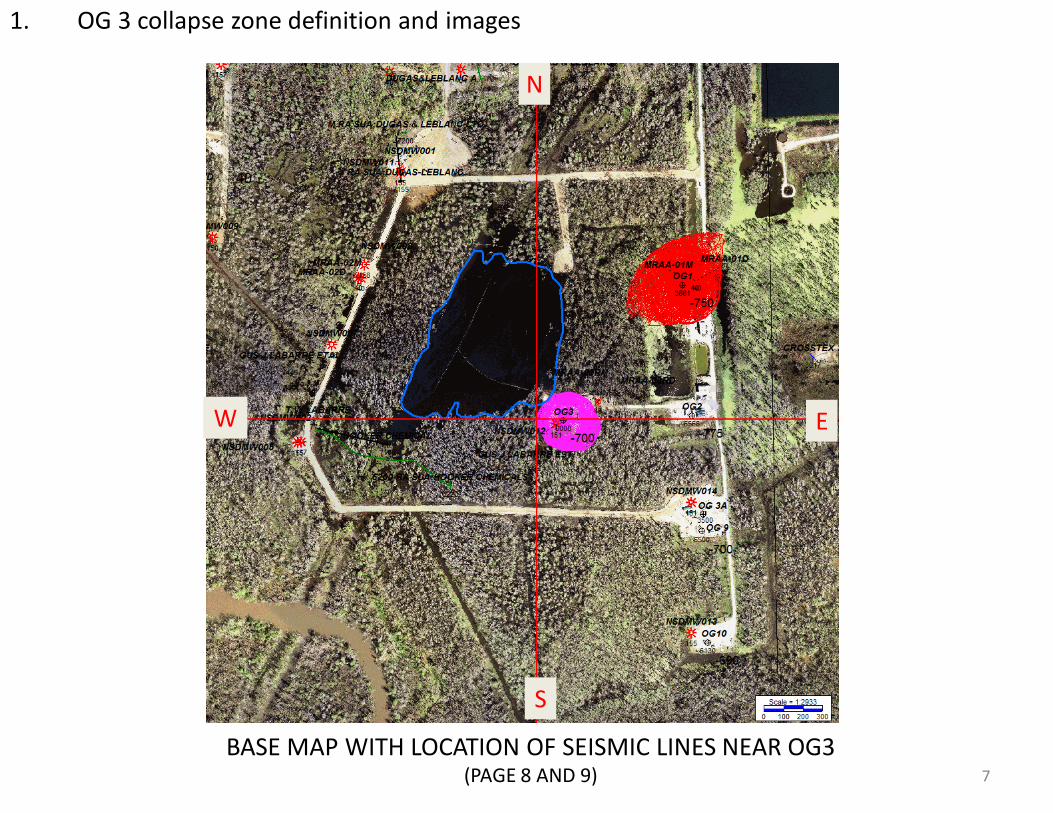
1. OG 3 collapse zone definition and images
W
N
S
E
BASE MAP WITH LOCATION OF SEISMIC LINES NEAR OG3 (PAGE 8 AND 9) 7
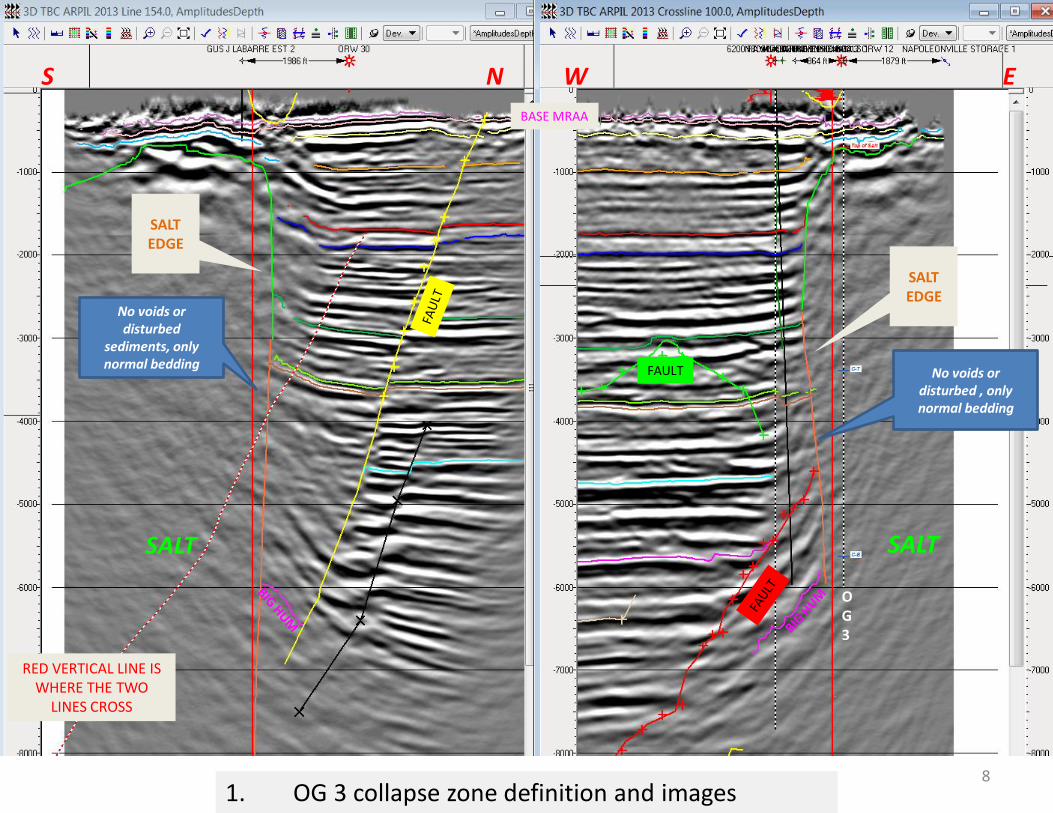
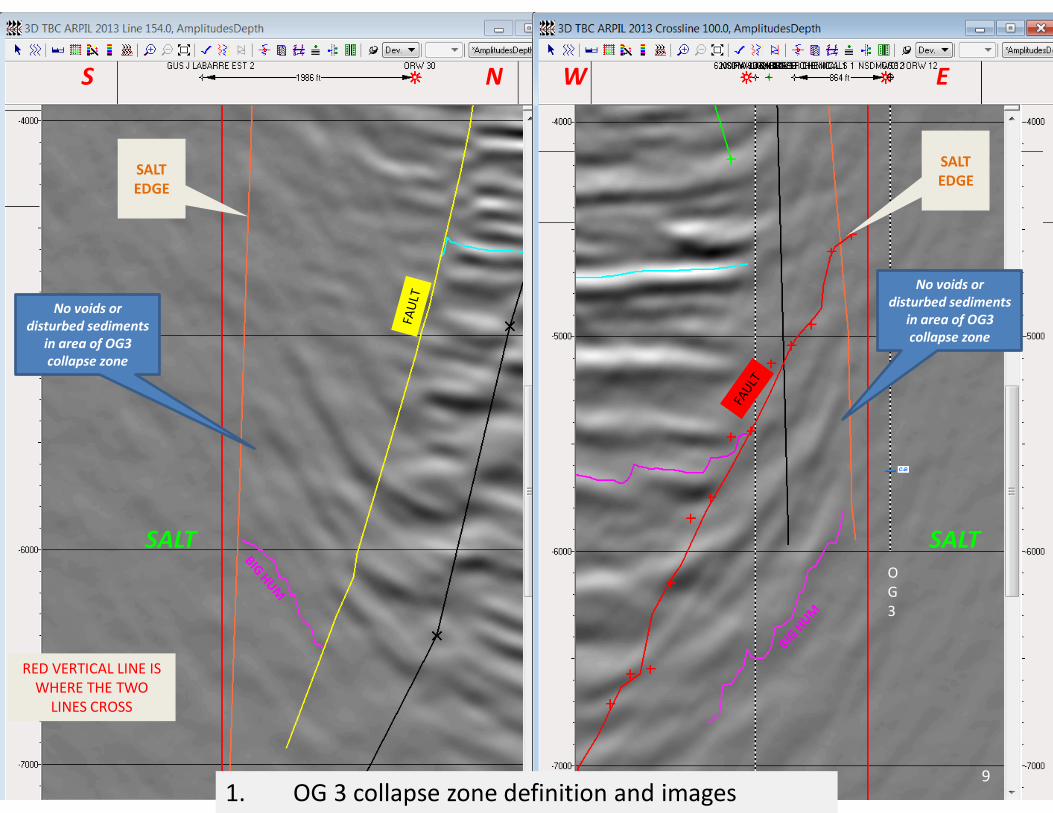
1. OG 3 collapse zone definition and images
S N W E
8
No voids or disturbed
sediments, only normal bedding
No voids or disturbed , only normal bedding
SALT EDGE
SALT EDGE
RED VERTICAL LINE IS WHERE THE TWO
LINES CROSS
SALT SALT
OG3
FAULT
BASE MRAA
S N W E
1. OG 3 collapse zone definition and images
No voids or disturbed sediments
in area of OG3 collapse zone
No voids or disturbed sediments
in area of OG3 collapse zone
SALT EDGE
SALT EDGE
RED VERTICAL LINE IS WHERE THE TWO
LINES CROSS
SALT SALT OG3
9
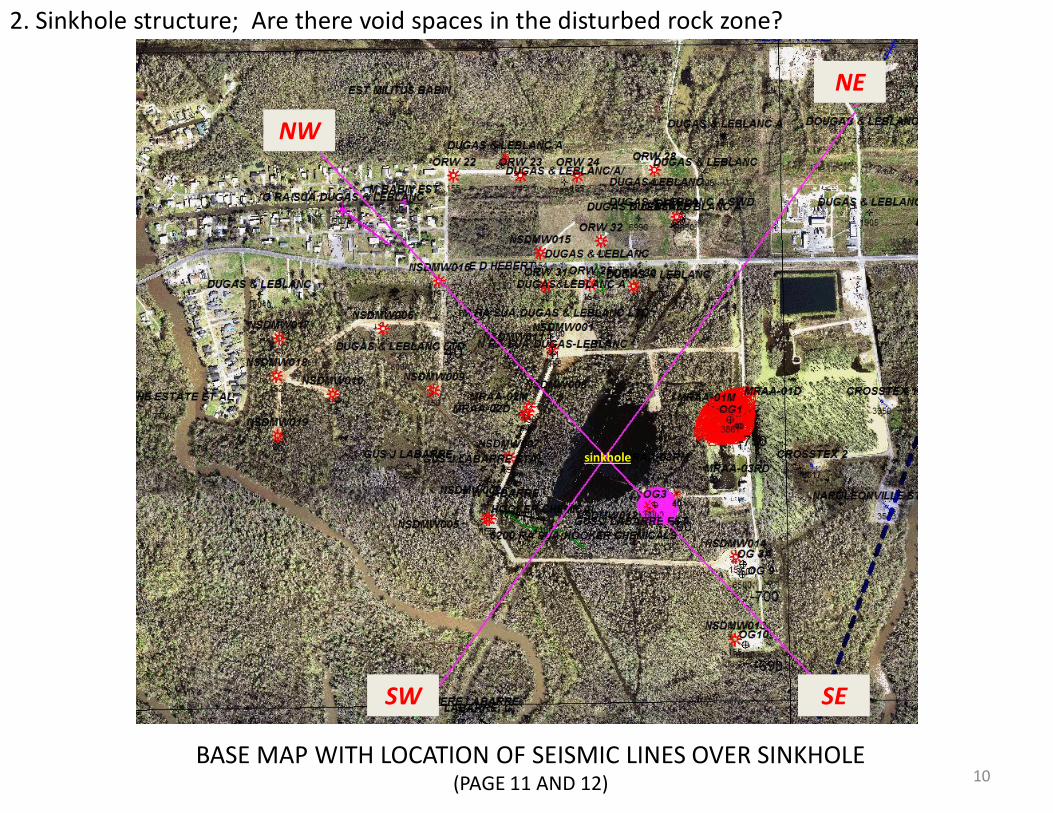
2. Sinkhole structure; Are there void spaces in the disturbed rock zone?
10
NW
NE
SW SE
BASE MAP WITH LOCATION OF SEISMIC LINES OVER SINKHOLE (PAGE 11 AND 12)
sinkhole
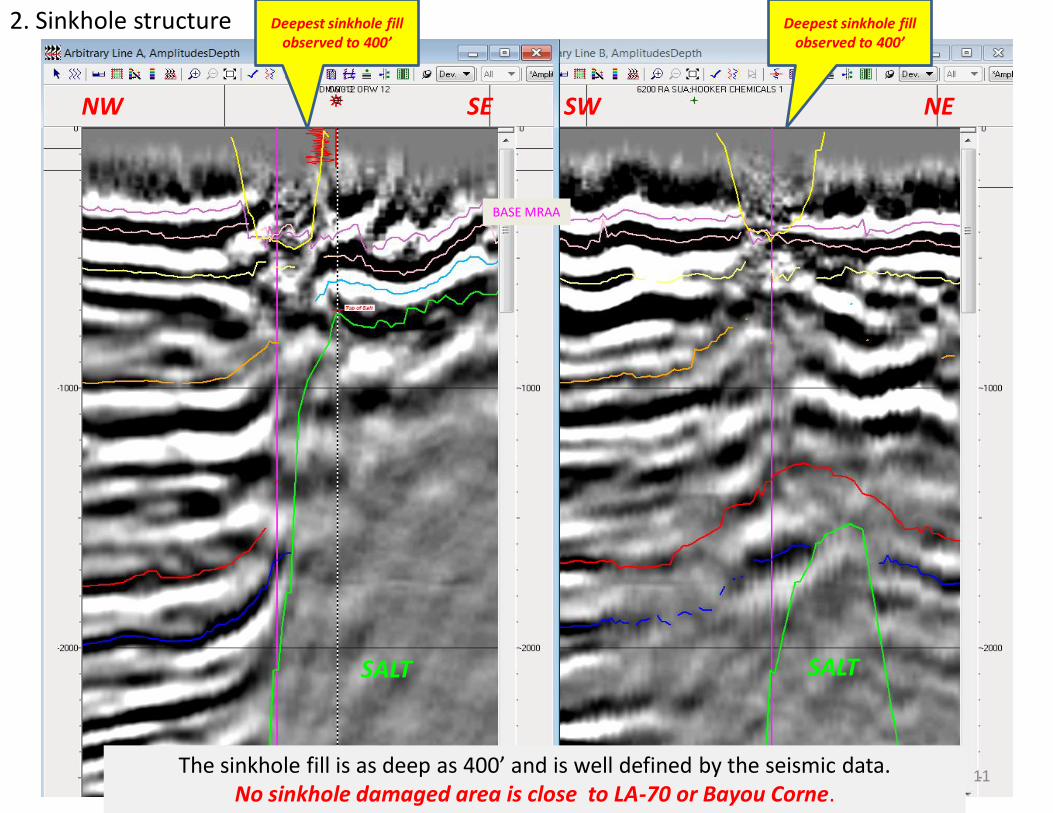
2. Sinkhole structure
NW SE SW NE
Deepest sinkhole fill observed to 400’
SALT SALT
Deepest sinkhole fill observed to 400’
The sinkhole fill is as deep as 400’ and is well defined by the seismic data. No sinkhole damaged area is close to LA-70 or Bayou Corne.
11
BASE MRAA
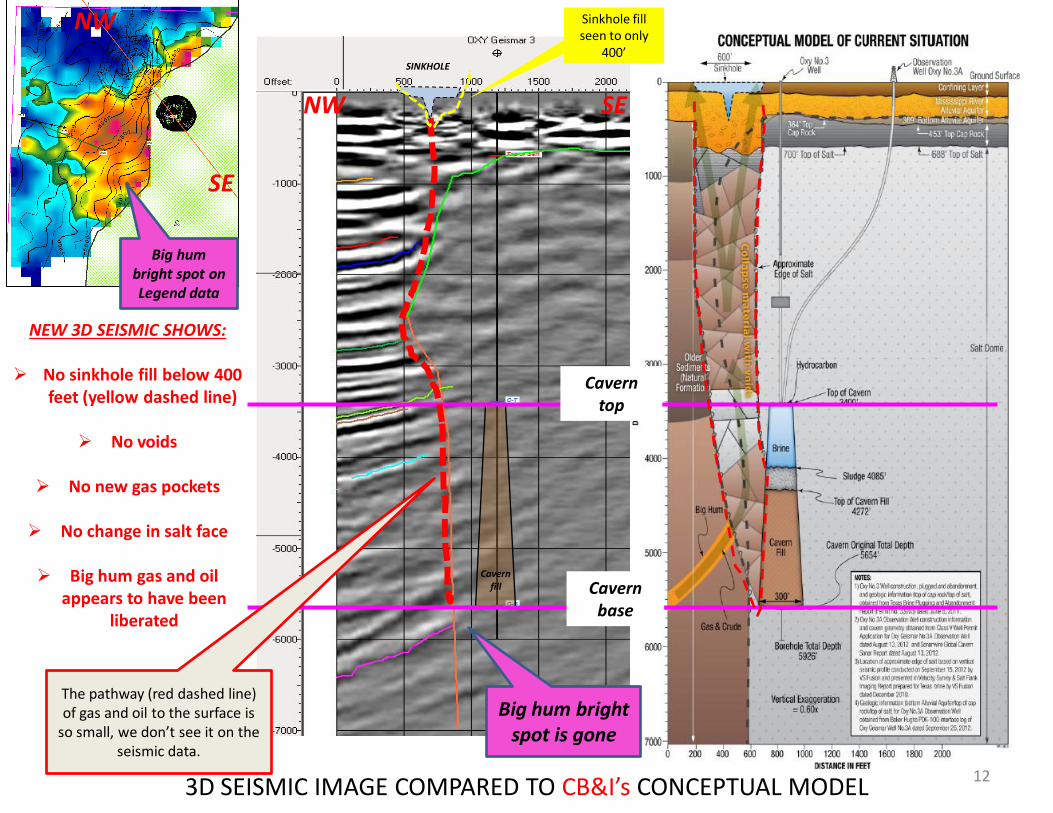
3D SEISMIC IMAGE COMPARED TO CB&I’s CONCEPTUAL MODEL
Cavern top
Cavern base
NEW 3D SEISMIC SHOWS:
No sinkhole fill below 400 feet (yellow dashed line)
No voids
No new gas pockets
No change in salt face
Big hum gas and oil
appears to have been liberated
Big hum bright spot is gone
12
The pathway (red dashed line) of gas and oil to the surface is
so small, we don’t see it on the seismic data.
SINKHOLE
Cavern fill
Sinkhole fill seen to only
400’
NW SE
NW
SE
Big hum bright spot on Legend data
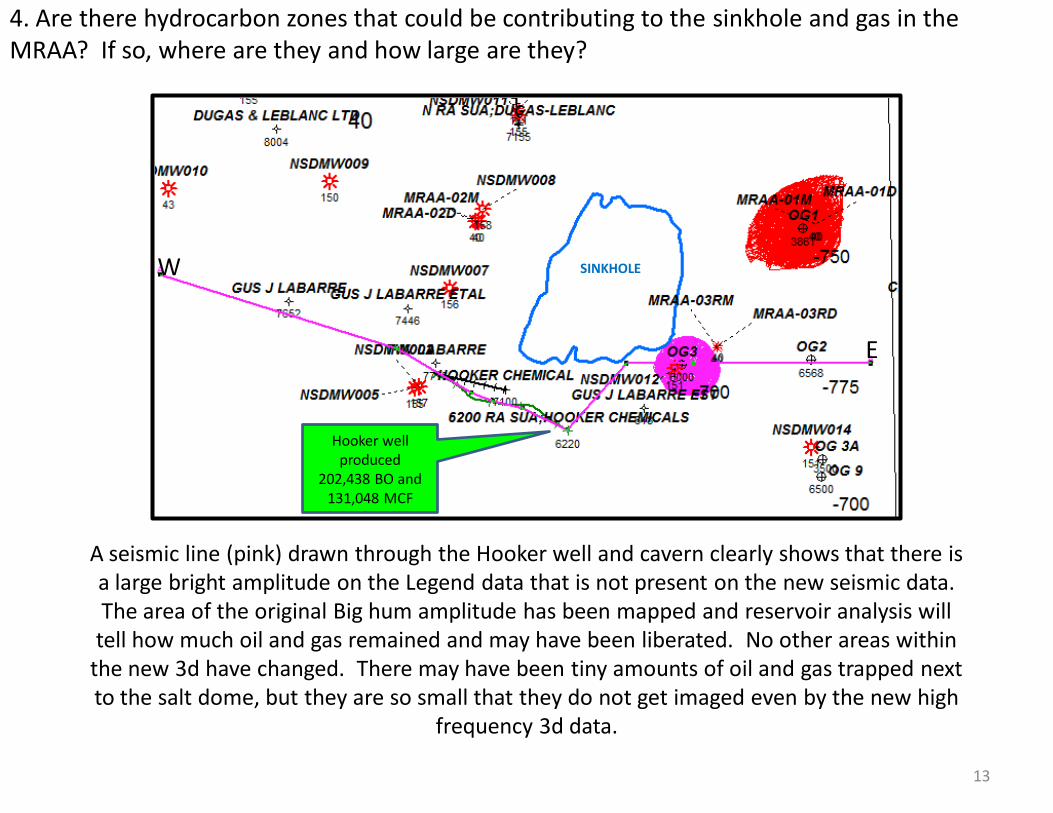
4. Are there hydrocarbon zones that could be contributing to the sinkhole and gas in the MRAA? If so, where are they and how large are they?
A seismic line (pink) drawn through the Hooker well and cavern clearly shows that there is a large bright amplitude on the Legend data that is not present on the new seismic data. The area of the original Big hum amplitude has been mapped and reservoir analysis will
tell how much oil and gas remained and may have been liberated. No other areas within the new 3d have changed. There may have been tiny amounts of oil and gas trapped next to the salt dome, but they are so small that they do not get imaged even by the new high
frequency 3d data.
Hooker well produced
202,438 BO and 131,048 MCF
13
W
E
SINKHOLE
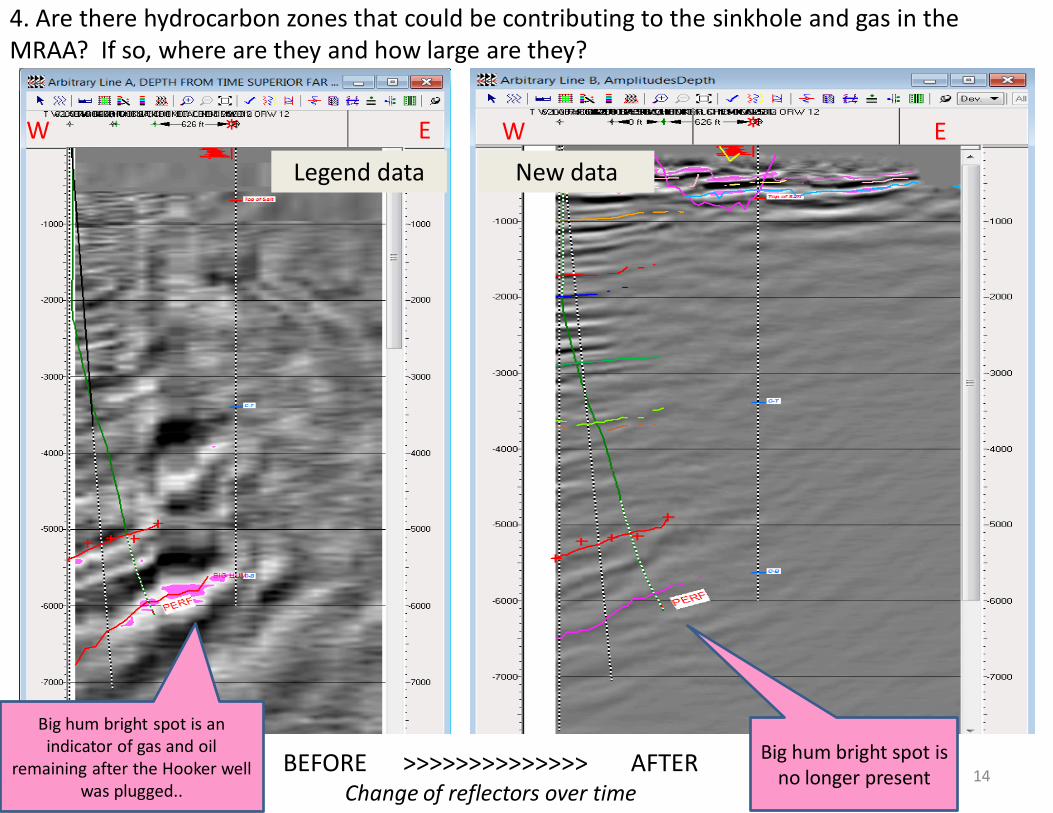
4. Are there hydrocarbon zones that could be contributing to the sinkhole and gas in the MRAA? If so, where are they and how large are they?
Big hum bright spot is an indicator of gas and oil
remaining after the Hooker well was plugged..
Big hum bright spot is no longer present
Legend data New data
14 BEFORE >>>>>>>>>>>>>> AFTER
Change of reflectors over time
W E W E
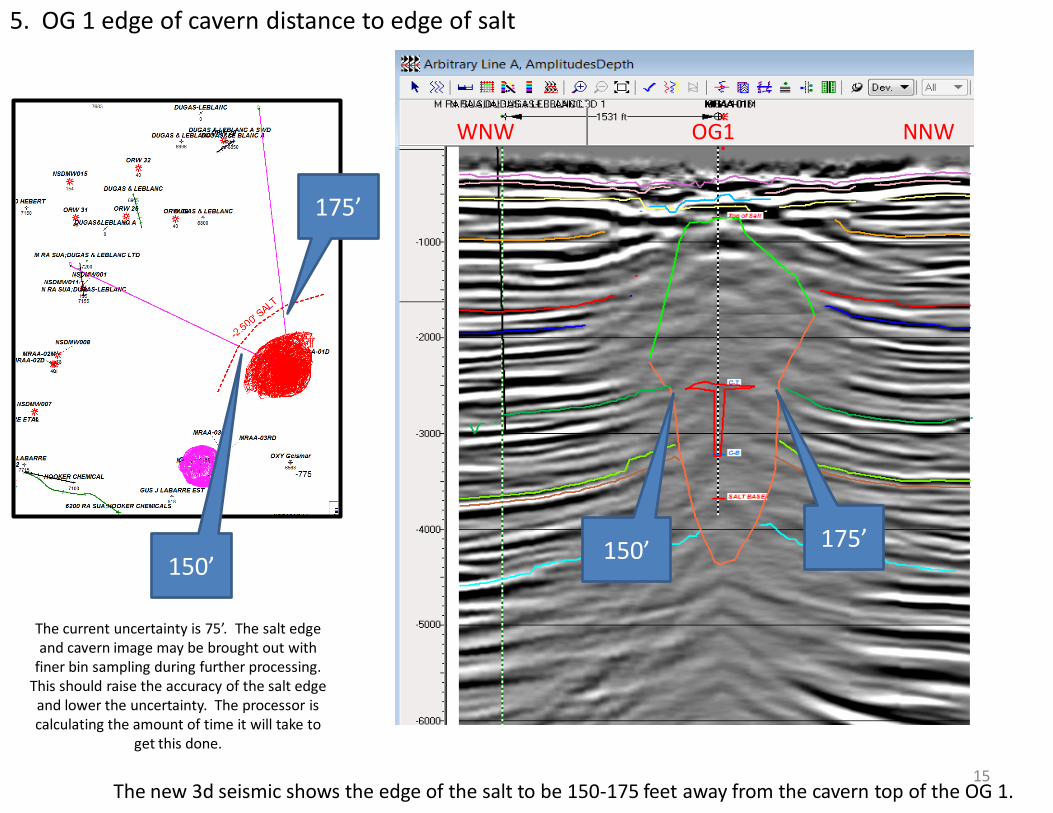
5. OG 1 edge of cavern distance to edge of salt
150’ 175’
The new 3d seismic shows the edge of the salt to be 150-175 feet away from the cavern top of the OG 1.
150’
175’
WNW OG1 NNW
The current uncertainty is 75’. The salt edge and cavern image may be brought out with
finer bin sampling during further processing. This should raise the accuracy of the salt edge and lower the uncertainty. The processor is calculating the amount of time it will take to
get this done.
15
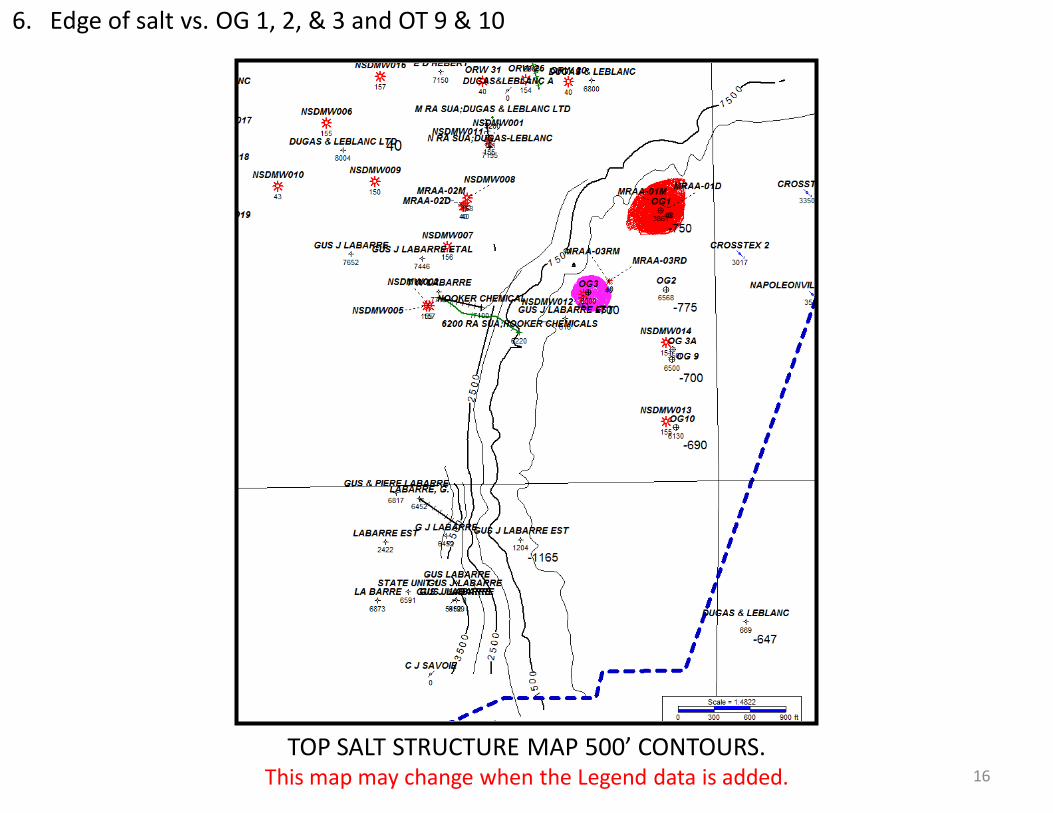
6. Edge of salt vs. OG 1, 2, & 3 and OT 9 & 10
TOP SALT STRUCTURE MAP 500’ CONTOURS. This map may change when the Legend data is added. 16
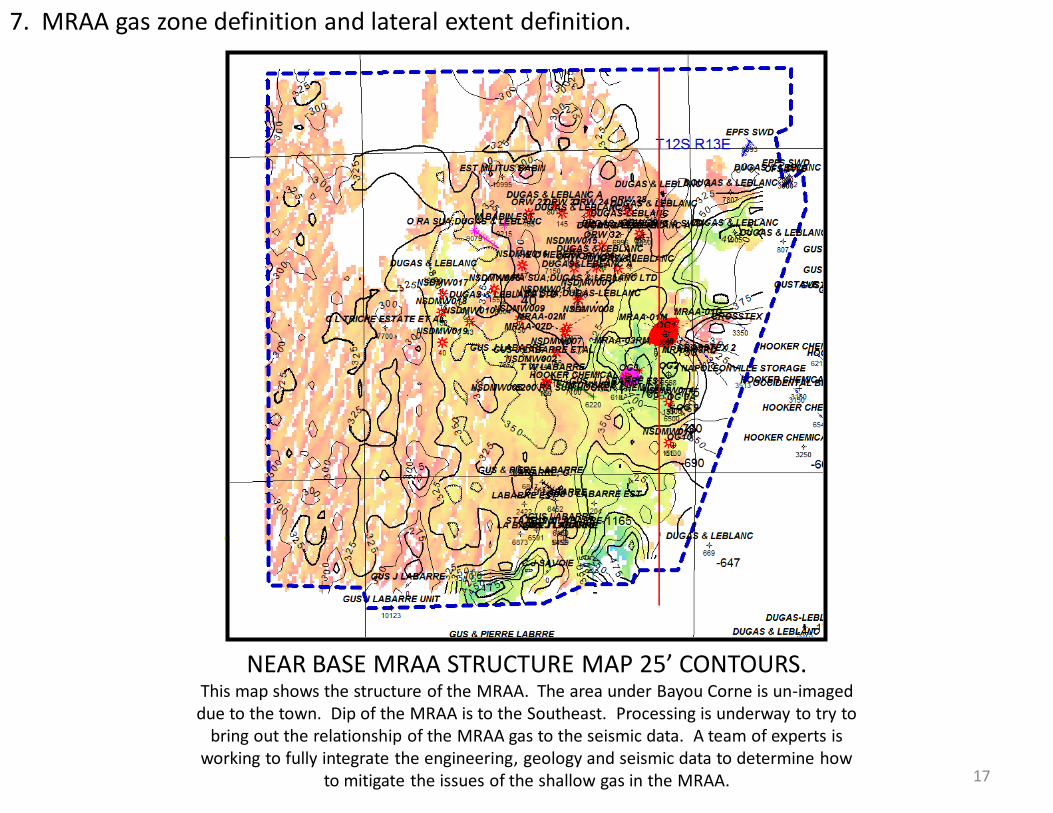
7. MRAA gas zone definition and lateral extent definition.
17
NEAR BASE MRAA STRUCTURE MAP 25’ CONTOURS. This map shows the structure of the MRAA. The area under Bayou Corne is un-imaged due to the town. Dip of the MRAA is to the Southeast. Processing is underway to try to
bring out the relationship of the MRAA gas to the seismic data. A team of experts is working to fully integrate the engineering, geology and seismic data to determine how
to mitigate the issues of the shallow gas in the MRAA.