sca digital ratings - october 2014
TRANSCRIPT

OCTOBER 2014
statistics sourced from:

SCA DIGITAL – OCTOBER DIGITAL RATINGS Slide 3 Commercial Radio Unique Audience (UA) - October Slide 4 Commercial Radio Unique Audience (UA) by Brand - October Slide 5 SCA Network October Digital Traffic Slide 6 Today Network October Digital Traffic Slide 7 Triple M Network October Digital Traffic ALL DEVICES Slide 9 Australian Publishers (All Devices) Slide 10 Multi-Category Entmt Brands (All Devices) Slide 11 Top Radio Brands (All devices) Slide 12 Radio Groups Online Daily Browsing- New South Wales Slide 13 Radio Groups Online Daily Browsing - Victoria Slide 14 Radio Groups Online Daily Browsing - Queensland Slide 15 Radio Groups Online Daily Browsing - Western Australia Slide 16 Radio Groups Online Daily Browsing - South Australia Slide 17 Radio Groups Online Daily Browsing - Australian Capital Territory Slide 18 Radio Groups Online Daily Browsing - Tasmania Slide 19 Radio Groups Online Daily Browsing - Northern Territory
Slide 20 TOP 10 Sydney Radio Stations Online Slide 21 TOP 10 Melbourne Radio Stations Online Slide 22 TOP 10 Brisbane Radio Stations Online Slide 23 TOP 10 Perth Radio Stations Online Slide 24 TOP 10 Adelaide Radio Stations Online MOBILE Slide 26 Mobile Publishers Slide 27 Multi-Category Entmt Mobile Brands Slide 28 Mobile Radio Brands in Australia Slide 29 Mobile Optimised Publishers in Australia Slide 30 Mobile Share of Daily SCA Radio Browsing DEMOGRAPHICS Slide 32 SCA Demographics Slide 33 Today Network Demographics Slide 34 Triple M Network Demographics


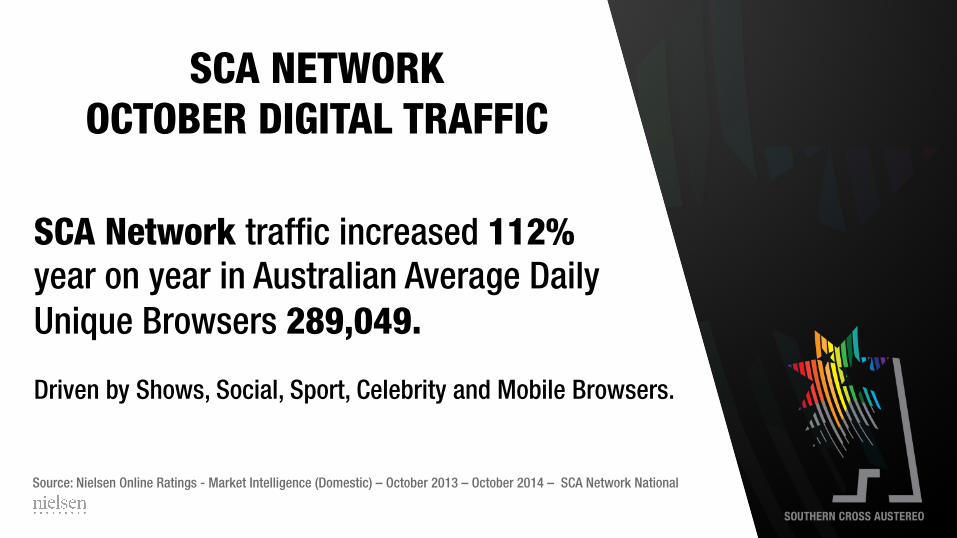
Source: Nielsen Online Ratings - Market Intelligence (Domestic) – October 2013 – October 2014 – SCA Network National
SCA Network traffic increased 112% year on year in Australian Average Daily Unique Browsers 289,049. Driven by Shows, Social, Sport, Celebrity and Mobile Browsers.
SCA NETWORK OCTOBER DIGITAL TRAFFIC

Source: Nielsen Online Ratings - Market Intelligence (Domestic) – October 2013 - October 2014 – Today Network National
Today Network traffic increased 117% year on year in Australian Average Daily Unique Browsers to 192,787 – Highest Ever ! Driven by Shows, Social, Celebrity and Mobile Browsers.
TODAY NETWORK OCTOBER DIGITAL TRAFFIC

Triple M Network traffic increased by 98% year on year in Australian Average Daily Unique Browsers to 85,751. Driven by AFL, NRL, Social and Mobile Browsers.
Source: Nielsen Online Ratings - Market Intelligence (Domestic) – October 2013 - October 2014 Triple M Network: Five Triple Ms & Triple M Classic Rock Digital
TRIPLE M NETWORK OCTOBER DIGITAL TRAFFIC

ALL DEVICES
statistics sourced from:


MOBILE
statistics sourced from:


DEMOGRAPHICS
statistics sourced from:


GLOSSARY OF DIGITAL TERMS
KEY REPORTING METRICS Average Daily Unique Browsers (ADUB): Key unique browser ranking metric that reports the average of the daily browsers form all devices and locations that visited a site within the selected reporting period. Unique Audience (UA): The total number of unique people (de-duplicated) that visited a site at least once during the specified reporting period. This metric has been estiamted and hybridised using tagged census data to capture access from locations and devices.
DEVICES TYPES Device reporting splits out domestic traffic by Mobile, Tablet, Computer and Others for key metrics. All Devices: all connected devices types Computer: connected device requiring a physical keyboard, mouse and display Mobile: any connected device larger the size of an average hand or similar (excluding tablets). Tablet: any connected device larger than an average hand GEO TARGETING In geo-targeted reports, reported data is filtered by state/territory.

Southern Cross Austereo (SCA) each month reports Australian digital ratings. Data solely sourced from Nielsen Online Ratings - Market Intelligence & Hybrid. SCA also reports ‘Brands’ as collated and approved by Nielsen and not ‘Ad Networks’, which are synthetically created by publishers for commercial scale purposes. Publication of this data is intended for personal use and should be seen as a reflection of business performance or forward looking statements that are always given to the market and shareholders first. Any comments in regards to this data or any claims of misreprestation should be addressed to [email protected]
statistics sourced from: