ricardo teles/vale vale’s performance in · pdf file3 vale’s performance in 2q17...
TRANSCRIPT

Vale’s Performance in 2Q17
Ricardo Teles/Vale

www.vale.com
App Vale Investors & Media
iOS: https://itunes.apple.com/us/app/vale-investor-media-portugues/id1087134066?ls=1&mt=8
Android: https://play.google.com/store/apps/details?id=com.theirapp.valeport
Tel.: (55 21) 3485-3900
Investor Relations Department
André Figueiredo
André Werner
Carla Albano Miller
Fernando Mascarenhas
Andrea Gutman
Bruno Siqueira
Claudia Rodrigues
Denise Caruncho
Mariano Szachtman
Renata Capanema
BM&F BOVESPA: VALE3, VALE5
NYSE: VALE, VALE.P
EURONEXT PARIS: VALE3, VALE5
LATIBEX: XVALO, XVALP
Except where otherwise indicated the operat ional and financial information in this release is based on the consolidated f igures
in accordance with IFRS and, with the exception of information on investments and behavior of markets, quarterly f inancial
statements are reviewed by the company’s independent auditors. The main subsidiaries that are consolidated are the following:
Mineração Corumbaense Reunida S.A., PT Vale Indonesia Tbk (formerly International Nickel Indonesia Tbk), Salobo Metais
S.A, Vale Australia Pty Ltd., Vale Internat ional Holdings GMBH, Vale Canada Limited (formerly Vale Inco Limited), Vale
Internat ional S.A., Vale Manganês S.A., Vale Moçambique S.A., Vale Nouvelle-Calédonie SAS, Vale Oman Pellet iz ing Company
LLC and Vale Shipping Holding PTE Ltd.

3
Vale’s performance in 2Q17
Strong free cash flow of US$ 2.151 billion in 2Q17, despite the sharp decrease of the Platts
IODEX and the payment of SUMIC put option on Vale New Caledonia, enabling dividend
distribution and net debt reduction of US$ 655 million in 2Q17. By the end of 2017, Vale will
reach a comfortable leverage level.
Adjusted EBITDA was US$ 2.729 billion in 2Q17, 36.7% lower than in 1Q17, mainly as a result
of the 26.6% reduction of the Platts IODEX. Adjusted EBITDA for Ferrous Minerals represented
82% of total adjusted EBITDA.
Costs and expenses totaled US$ 4.588 billion in 2Q17 increasing US$ 381 million vs. 1Q17,
mainly as a result of non-recurrent effects. In order to consolidate a systemic and sustainable
approach to cost management, Vale retained the services of Falconi consulting company to
conduct a pilot project in its pelletizing business that can then be expanded to the whole
company in the future.
Iron ore price realization decreased by US$ 24.4/t due to the US$ 22.7/t reduction in the Platts
IODEX. Vale’s significant premiums for its 65% iron ore were offset by large discounts on some
low grades/high silica material, which had to be sold directly without blending. “As a response
to such market conditions, Vale will from 2H17 onwards reduce its production of high silica
products by an annualized rate of 19 Mt to increase price realization, keeping the long term
production guidance limited to 400 Mtpa”, commented Mr. Peter Poppinga, Executive Officer
for Ferrous Minerals and Coal. “Rebalancing the portfolio according to market conditions
through product management and increasing offshore blending will continue to maximize our
margins”.
Iron ore and pellets shipments1 totaled 81.6 Mt in 2Q17 while iron ore fines sales volumes
reached 69.0 Mt leading to the build-up of 5.3 Mt of offshore inventories to further support higher
levels of blending activities, especially in 11 Chinese ports, in which we are already blending.
Iron ore C1 cash cost increased by 6.9% to R$ 49.3/t (USD 15.2/t), as a result of a one-off
railway tariff charge (MRS2), higher demurrage costs and seasonally higher maintenance costs.
Costs are expected to decrease to the range of R$ 46 - 47/t in 2H17, back to the BRL levels of
two years ago, due to the combination of higher production, seasonally lower maintenance
costs and productivity gains.
Adjusted EBITDA for Base Metals was US$ 386 million as the impact of lower nickel and copper
prices (US$ 112 million) was partially offset by lower expenses (US$ 34 million), higher volumes
1
Shipments from Brazil and Argentina. 2
Southern system third party railway.

4
(US$ 29 million), favorable exchange rate variation (US$ 11 million) and higher by-product
prices (US$ 10 million).
Nickel production guidance for 2017 was reduced to 295 kt, 7% lower than our Vale Day
guidance, as a result of actions to adjust our supply of nickel to a lower price environment
including placing non-competitive mines, such as Stobie in Sudbury and Birchtree in Manitoba,
on care and maintenance, and also reflecting lower than planned first half production in
Manitoba, New Caledonia and Indonesia.
Adjusted EBITDA for Coal was US$ 157 million in 2Q17, recording a positive result for a third
consecutive quarter on higher prices, higher volumes and lower costs at the mine and
processing plants, which decreased by 16% in 2Q17 vs. 1Q17, due to the successful ramp-up
of Moatize II and the strong performance of both processing plants.
Capital Expenditures were US$ 894 million in 2Q17, breaking through the sub US$ 1 billion
mark and the lowest for a quarter since 3Q06. “With the further reduction in S11D expenditures
and in other large sustaining investment programs such as the Nickel Atmospheric Emissions
Reduction – AER project in Sudbury, we can aim for further CAPEX reductions in 2018. This
means that Vale’s free cash flows can continue to increase even in an environment of lower
prices”, highlighted Chief Financial Officer Luciano Siani Pires. “This provides breathing space
while we tackle and reverse the recent increase in costs”.
Chief Executive Officer Fabio Schvartsman commented on the first results partially under his
oversight: “I feel there is a lot of energy in the company to take performance a step further, building
on the strengths of previous efforts. A strong focus on execution will continue to boost cash flows.
In the meantime, we are about to conclude our 60-day strategic diagnosis, which will guide us in
our implementation of important strategic initiatives aiming at results in the short-term.”
Market Overview
In the 2Q17, Platts IODEX 62% Fe averaged US$ 62.90/dmt, being 26.6% lower than in 1Q17.
Prices decelerated after peaking in February at US$ 95.05/dmt, as a result of the higher supply
driven by higher prices in the beginning of 2017. Despite lower prices, premiums for high grade3
averaged US$ 13.61/dmt, an all-time record, while discounts for the high silica product4 deepened
further to US$ 21.03/dmt, with the difference signaling the imbalance of supply between high and
low Fe grades.
The increase in iron ore supply was not entirely absorbed by demand, leading inventories at
Chinese ports to surge. Meanwhile, demand for steel remained resilient in 1H17, supported by fixed
asset investments in the infrastructure and manufacturing sectors. Steel demand from the housing
sector should improve in the near future as better than expected housing sales led housing
inventories to approach more regular levels in June.
Coking coal prices experienced high volatility in 2Q17. The quarter started just a week after tropical
Cyclone Debbie hit the world’s main coal exporting region in Australia, leading prices to peak at
nearly US$ 305/t in mid-April. From then onwards, prices receded bringing the 2Q17 average to
US$ 190.3/t, still 15% higher than 1Q17.
3
Difference between the 65% Fe Metal Bullet in index and the Platts IODEX 62% Fe. 4
Difference between the Platts IODEX 62% Fe and the 58% Fe Metal Bullet in index.

5
Coking coal demand from China drove imports to 30 Mt in the first five months of the year, on the
back of lower seaborne prices and a relatively healthy steel sector in the country. The coking coal
supply from Australia recovered in June to more regular loading levels with estimated losses of 12
Mt during 2Q17, mostly due to disruptions caused by Cyclone Debbie. Export losses from
Queensland supported an increase in exports from the United States and Mongolia with Chinese
domestic production making up for the balance.
LME nickel prices retreated 10.2% during 2Q17 to an average of US$ 9,225/t. The price decline
over the quarter can be attributed to two main reasons: weaker demand on account of lower
Chinese stainless steel production and continued uncertainty in nickel ore export volumes from
Indonesia.
Following the decision of the Indonesian government to allow exports for “low-grade” ore (<1.7%
Ni) from the country, the Indonesian government granted export licenses to three companies totaling
6 Mt of nickel ore for one year. The additional supply of Indonesian nickel ore into the market has
caused downward pressure on ore and nickel prices.
The average LME copper price dropped 3% in 2Q17 to US$ 5,662/t. Prices rebounded towards the
end of the quarter as inventories on the LME and SHFE decreased -41.5kt and -130.8 kt,
respectively vs. 1Q17 and demand for refined copper started to improve, particularly in China and
Northeast Asia.
On the supply side, global refined copper production was slightly up during 2Q17 as supply
disruptions have stabilized relative to 1Q17. Despite this effect, copper concentrate imports into
China increased approximately 2% in 5M17 vs. 5M16, reflecting demand associated with the
ongoing expansion of smelter capacity. Meanwhile, refined copper imports declined 28% over the
same period as scrap continued to displace refined material.
Selected financial indicators US$ million 2Q17 1Q17 2Q16
Net operating revenues 7,235 8,515 6,162
Total costs and expenses 5,492 5,115 4,764
Adjusted EBIT 1,743 3,400 1,398
Adjusted EBIT margin (%) 24.1 39.9 22.7
Adjusted EBITDA 2,729 4,308 2,351
Adjusted EBITDA margin (%) 37.7 50.6 38.2
Iron ore - Platts' 62% IODEX 62.9 85.6 55.7
Net income (loss) 16 2,490 1,106
Underlying earnings 949 2,098 784
Underlying earnings per share on a fully diluted basis (US$ / share) 0.18 0.41 0.15
Net debt 22,122 22,777 27,508
Capital expenditures 894 1,113 1,300
US$ million 1H17 1H16 %
Net operating revenues 15,750 11,497 37.0
Total costs and expenses 10,607 8,948 18.5
Adjusted EBIT 5,143 2,549 101.8
Adjusted EBIT margin (%) 32.7 22.2 47.3
Adjusted EBITDA 7,037 4,286 64.2
Adjusted EBITDA margin (%) 44.7 37.3 19.9
Net income (loss) 2,506 2,882 (13.0)
Underlying earnings 3,047 1,298 134.7
Underlying earnings per share on a fully diluted basis (US$ / share) 0.59 0.25 134.7
Capital expenditures 2,007 2,710 (25.9)
6
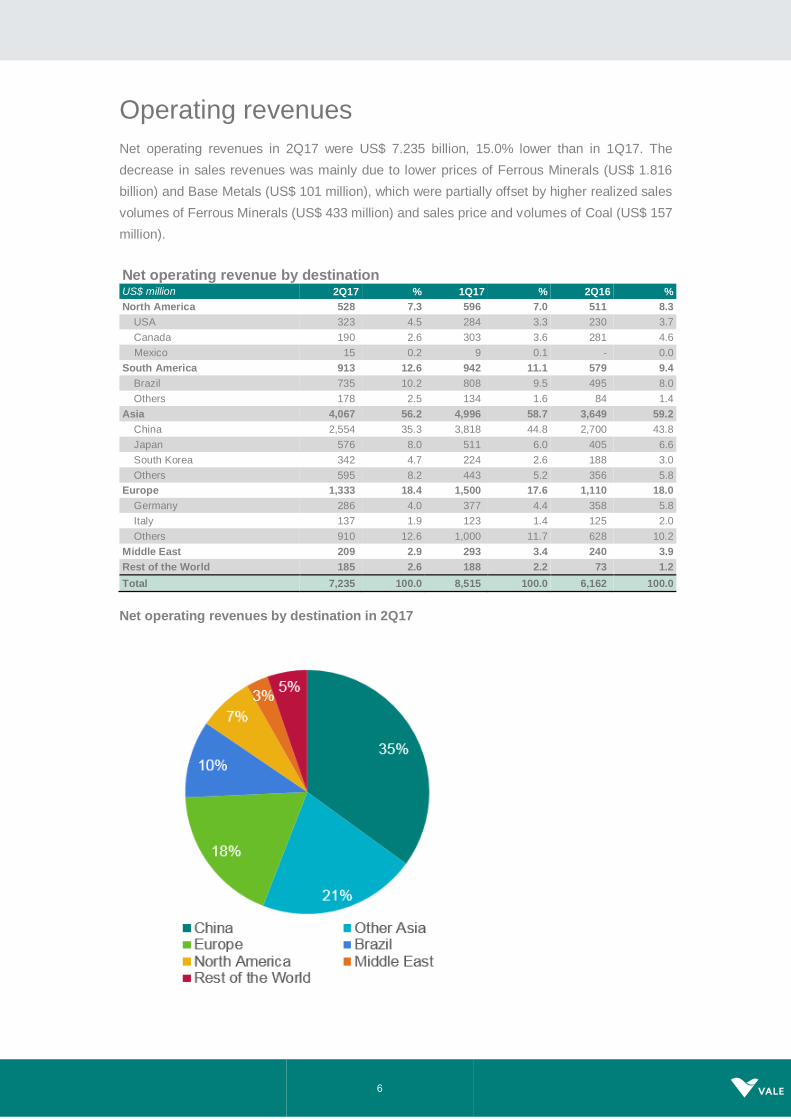
Operating revenues
Net operating revenues in 2Q17 were US$ 7.235 billion, 15.0% lower than in 1Q17. The
decrease in sales revenues was mainly due to lower prices of Ferrous Minerals (US$ 1.816
billion) and Base Metals (US$ 101 million), which were partially offset by higher realized sales
volumes of Ferrous Minerals (US$ 433 million) and sales price and volumes of Coal (US$ 157
million).
Net operating revenue by destination US$ million 2Q17 % 1Q17 % 2Q16 %
North America 528 7.3 596 7.0 511 8.3
USA 323 4.5 284 3.3 230 3.7
Canada 190 2.6 303 3.6 281 4.6
Mexico 15 0.2 9 0.1 - 0.0
South America 913 12.6 942 11.1 579 9.4
Brazil 735 10.2 808 9.5 495 8.0
Others 178 2.5 134 1.6 84 1.4
Asia 4,067 56.2 4,996 58.7 3,649 59.2
China 2,554 35.3 3,818 44.8 2,700 43.8
Japan 576 8.0 511 6.0 405 6.6
South Korea 342 4.7 224 2.6 188 3.0
Others 595 8.2 443 5.2 356 5.8
Europe 1,333 18.4 1,500 17.6 1,110 18.0
Germany 286 4.0 377 4.4 358 5.8
Italy 137 1.9 123 1.4 125 2.0
Others 910 12.6 1,000 11.7 628 10.2
Middle East 209 2.9 293 3.4 240 3.9
Rest of the World 185 2.6 188 2.2 73 1.2
Total 7,235 100.0 8,515 100.0 6,162 100.0
Net operating revenues by destination in 2Q17

7
Net operating revenue by business area US$ million 2Q17 % 1Q17 % 2Q16 %
Ferrous Minerals 5,114 70.7 6,497 76.3 4,541 73.7
Iron ore fines 3,544 49.0 4,826 56.7 3,508 56.9
ROM 8 0.1 15 0.2 5 0.1
Pellets 1,331 18.4 1,459 17.1 868 14.1
Manganese ore 71 1.0 43 0.5 36 0.6
Ferroalloys 46 0.6 43 0.5 25 0.4
Others 114 1.6 111 1.3 99 1.6
Coal 481 6.6 324 3.8 145 2.4
Metallurgical coal 414 5.7 254 3.0 77 1.2
Thermal coal 67 0.9 70 0.8 68 1.1
Base Metals 1,512 20.9 1,597 18.8 1,447 23.5
Nickel 686 9.5 760 8.9 710 11.5
Copper 535 7.4 568 6.7 443 7.2
PGMs 77 1.1 85 1.0 99 1.6
Gold as by-product 139 1.9 130 1.5 154 2.5
Silver as by-product 9 0.1 7 0.1 10 0.2
Others 66 0.9 47 0.5 31 0.5
Others 128 1.8 97 1.1 29 0.5
Total 7,235 100.0 8,515 100.0 6,162 100.0

8
Costs and expenses
COST OF GOODS SOLD (COGS)
COGS5 totaled US$ 5.102 billion in 2Q17, increasing US$ 368 million from the US$ 4.734 billion
recorded in 1Q17, as a result of higher sales volumes (US$ 243 million), higher freight costs in
iron ore fines and pellets (US$ 33 million), higher leasing costs from the pelletizing plants (US$
29 million) and higher services and material costs (US$ 78 million), which were partially offset
by exchange rate variations (US$ 58 million).
Further details regarding cost performance are provided in the “Performance of the Business
Segments” section.
COGS by business segment US$ million 2Q17 % 1Q17 % 2Q16 %
Ferrous Minerals 3,142 62 2,826 60 2,579 60
Base Metals 1,452 28 1,455 31 1,424 33
Coal 377 7 351 7 250 6
Other products 131 3 102 2 60 1
Total COGS 5,102 100 4,734 100 4,313 100
Depreciation 852 - 846 - 780 -
COGS, ex-depreciation 4,250 - 3,888 - 3,533 -
EXPENSES
Total expenses amounted to US$ 390 million in 2Q17, slightly higher than the US$ 381 million
in 1Q17, mainly due to higher R&D expenses (US$ 15 million), higher Other operating expenses
(US$ 11 million) and higher SG&A (US$ 8 million), which were partially offset by lower Pre-
operating and stoppage expenses (US$ 25 million).
SG&A totaled US$ 132 million in 2Q17, US$ 8 million higher than in 1Q17. SG&A, net of
depreciation, was US$ 110 million, increasing US$ 15 million in 2Q17 vs. 1Q17.
R&D expenses totaled US$ 80 million in 2Q17, increasing 23.1% from the US$ 65 million
recorded in 1Q17, following the usual seasonality of low disbursements in the first quarter.
Pre-operating and stoppage expenses totaled US$ 90 million in 2Q17, decreasing by 21.7%
from the US$ 115 million recorded in 1Q17, mainly due to the reduction of Long Harbour pre-
operating expenses. The refinery is successfully ramping up and, as a result, there will be no
additional pre-operating expenses charged to Long Harbour.
5 COGS currency exposure in 2Q17 was as follows: 53% BRL, 32% USD, 11% CAD, 3% EUR and 1% other currencies.
9
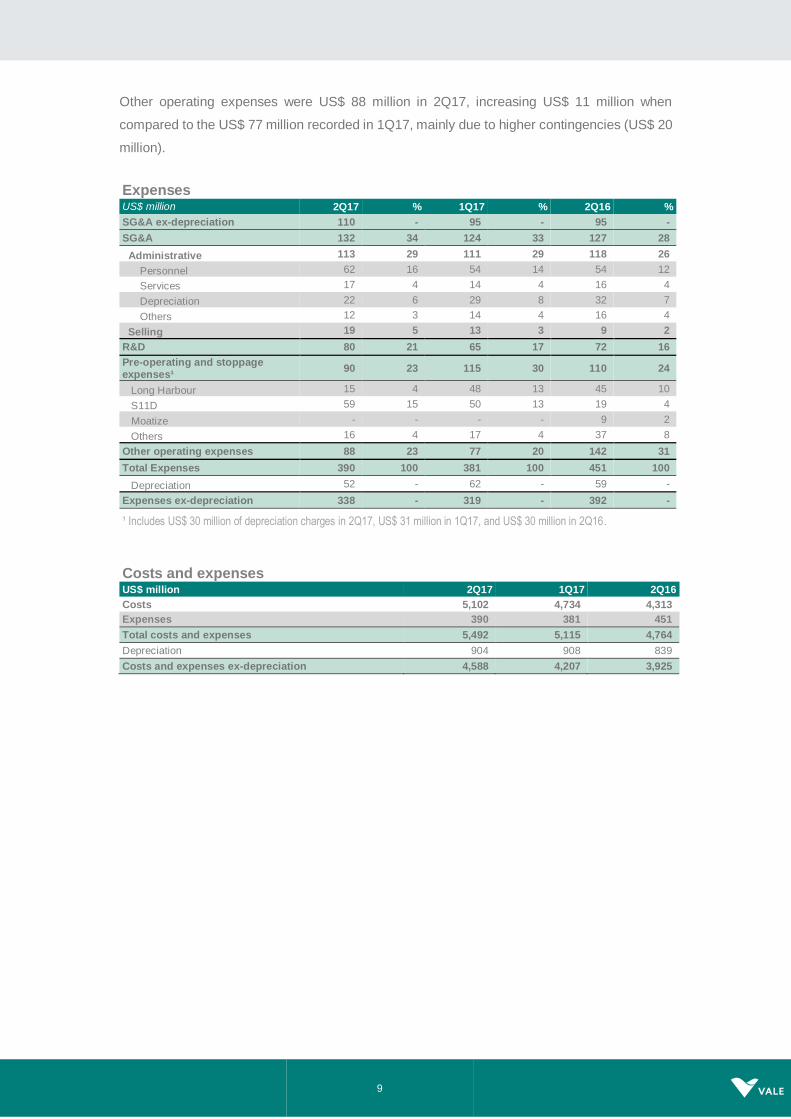
Other operating expenses were US$ 88 million in 2Q17, increasing US$ 11 million when
compared to the US$ 77 million recorded in 1Q17, mainly due to higher contingencies (US$ 20
million).
Expenses US$ million 2Q17 % 1Q17 % 2Q16 %
SG&A ex-depreciation 110 - 95 - 95 -
SG&A 132 34 124 33 127 28
Administrative 113 29 111 29 118 26
Personnel 62 16 54 14 54 12
Services 17 4 14 4 16 4
Depreciation 22 6 29 8 32 7
Others 12 3 14 4 16 4
Selling 19 5 13 3 9 2
R&D 80 21 65 17 72 16
Pre-operating and stoppage expenses¹
90 23 115 30 110 24
Long Harbour 15 4 48 13 45 10
S11D 59 15 50 13 19 4
Moatize - - - - 9 2
Others 16 4 17 4 37 8
Other operating expenses 88 23 77 20 142 31
Total Expenses 390 100 381 100 451 100
Depreciation 52 - 62 - 59 -
Expenses ex-depreciation 338 - 319 - 392 -
¹ Includes US$ 30 million of depreciation charges in 2Q17, US$ 31 million in 1Q17, and US$ 30 million in 2Q16.
Costs and expenses US$ million 2Q17 1Q17 2Q16
Costs 5,102 4,734 4,313
Expenses 390 381 451
Total costs and expenses 5,492 5,115 4,764
Depreciation 904 908 839
Costs and expenses ex-depreciation 4,588 4,207 3,925

10
Adjusted earnings before interest, taxes, depreciation and amortization
Adjusted EBITDA6
was US$ 2.729 billion in 2Q17, 36.7% lower than in 1Q17 mainly as a result
of the 26.6% reduction of the Platts IODEX (US$ 1.867 billion), which was partially offset by
higher sales volumes of Ferrous Minerals and Coal (US$ 356 million). Adjusted EBITDA margin
was 37.7% in 2Q17.
Adjusted EBIT was US$ 1.743 billion in 2Q17.
Adjusted EBITDA US$ million 2Q17 1Q17 2Q16
Net operating revenues 7,235 8,515 6,162
COGS (5,102) (4,734) (4,313)
SG&A (132) (124) (127)
Research and development (80) (65) (72)
Pre-operating and stoppage expenses (90) (115) (110)
Other operational expenses (88) (77) (142)
Adjusted EBIT 1,743 3,400 1,398
Depreciation, amortization & depletion 904 908 839
Dividends received 82 - 114
Adjusted EBITDA 2,729 4,308 2,351
Iron ore - Platts' 62% IODEX 62.9 85.6 55.7
Adjusted EBITDA by business area US$ million 2Q17 1Q17 2Q16
Ferrous Minerals 2,232 3,967 2,136
Coal 157 61 (110)
Base Metals 386 410 376
Others (46) (130) (51)
Total 2,729 4,308 2,351
Iron ore - Platts' 62% IODEX 62.9 85.6 55.7
6 Net revenues less costs and expenses net of depreciation plus dividends received.

11
Net income
Net income totaled US$ 16 million in 2Q17 vs. US$ 2.490 billion in 1Q17, decreasing by US$
2.474 billion, mainly as a result of the following impacts: (i) the 26.6% reduction of the Platts
IODEX (US$ 1.867 billion); (ii) non-cash gains on monetary and exchange rate variation in
1Q17 vs. non-cash losses in 2Q17 (US$ 820 million); and (iii) gains on the sale of 50% of Vale’s
stake in the Nacala Logistic Corridor, which positively impacted results in 1Q17 (US$ 504
million). z
Underlying earnings were a positive US$ 949 million in 2Q17 after excluding some negative
effects over net income, most importantly: (i) the negative impact of foreign exchange (US$ 610
million), related to the depreciation of the BRL against the USD, and (ii) the impairment on
assets and investments from discontinued operations (US$ 414 million), which comprises
mainly the mark-to-market of Mosaic shares (US$ 268 million), and the write-down of the
residual value of mining assets in Canada (US$ 133 million).
Underlying earnings US$ million 2Q17 1Q17 2Q16
Underlying earnings 949 2,098 784
Items excluded from basic earnings
Impairment on assets and investments (414) (111) -
Result on measurement or sale of non-current assets (72) 512 (66)
Impairment and others results in associates and joint ventures (34) (61) (1,113)
Shareholders Debentures (87) (412) (86)
Foreign Exchange (610) 239 1,960
Monetary variation 11 (6) (51)
Currency and interest rate swaps (96) 247 483
Other financial results (57) (48) (31)
Income tax over excluded items 426 32 (774)
Net Income (loss) 16 2,490 1,106
Net financial results showed a loss of US$ 1.339 billion in 2Q17 vs. a loss of US$ 613 million
in 1Q17. The decrease of US$ 726 million was mainly a result of non-cash gains on monetary
and exchange rate variation in 1Q17 vs. non-cash losses in 2Q17 (US$ 820 million). The main
components of net financial results were: (i) financial expenses (US$ 773 million); (ii) financial
revenues (US$ 116 million); (iii) foreign exchange and monetary losses (US$ 591 million); (iv)
currency and interest rate swap losses (US$ 96 million); and (v) gains on other derivatives (US$
5 million), despite losses on the mark-to-market of bunker oil derivatives (US$ 18 million).
The end-to-end depreciation of the BRL7 contributed to generate non-cash losses of US$ 698
million with negative effects from currency and interest rate swap (US$ 96 million) and foreign
exchange (US$ 602 million).
7 In 2Q17, from end-to-end, the Brazilian Real (BRL) depreciated 4.41% against the US Dollar (USD) from BRL 3.17/ USD as
of March 31st, 2017 to BRL 3.31/ USD as of June 30th, 2017. On a quarterly average, the exchange rate depreciated by
2.30%, from an average BRL 3.15/ USD in 1Q17 to an average BRL 3.22/ USD in 2Q17.
12
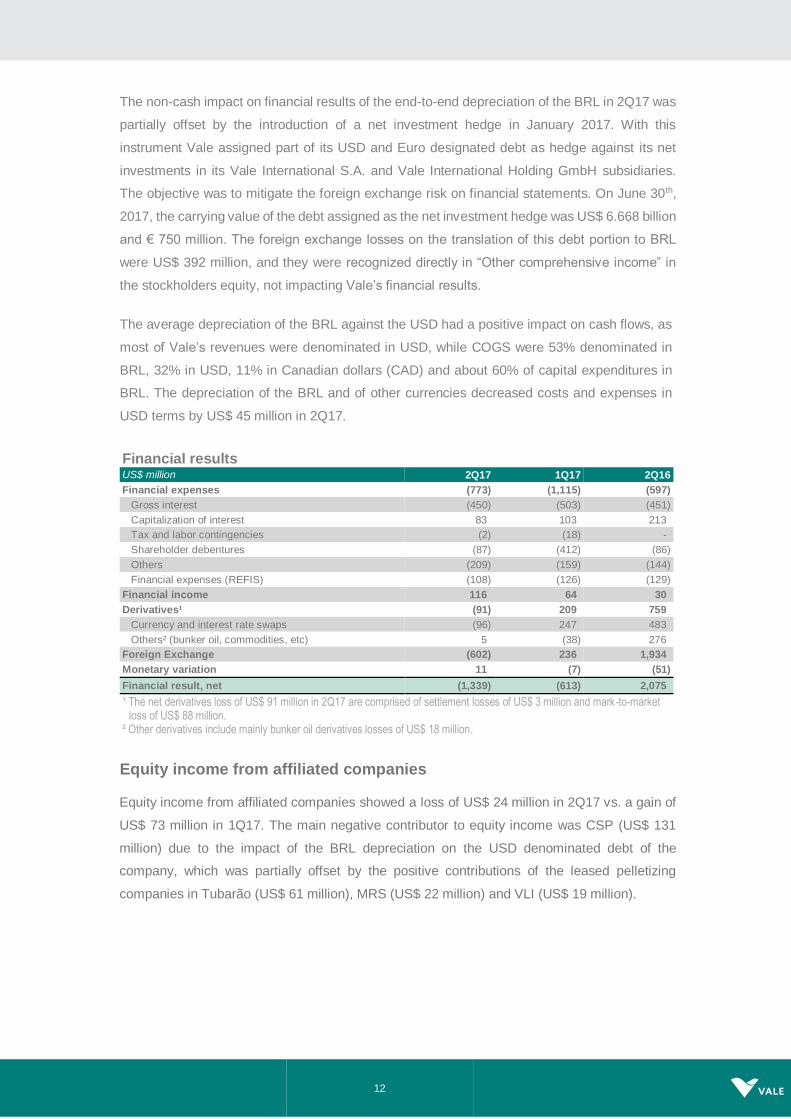
The non-cash impact on financial results of the end-to-end depreciation of the BRL in 2Q17 was
partially offset by the introduction of a net investment hedge in January 2017. With this
instrument Vale assigned part of its USD and Euro designated debt as hedge against its net
investments in its Vale International S.A. and Vale International Holding GmbH subsidiaries.
The objective was to mitigate the foreign exchange risk on financial statements. On June 30th,
2017, the carrying value of the debt assigned as the net investment hedge was US$ 6.668 billion
and € 750 million. The foreign exchange losses on the translation of this debt portion to BRL
were US$ 392 million, and they were recognized directly in “Other comprehensive income” in
the stockholders equity, not impacting Vale’s financial results.
The average depreciation of the BRL against the USD had a positive impact on cash flows, as
most of Vale’s revenues were denominated in USD, while COGS were 53% denominated in
BRL, 32% in USD, 11% in Canadian dollars (CAD) and about 60% of capital expenditures in
BRL. The depreciation of the BRL and of other currencies decreased costs and expenses in
USD terms by US$ 45 million in 2Q17.
Financial results US$ million 2Q17 1Q17 2Q16
Financial expenses (773) (1,115) (597)
Gross interest (450) (503) (451)
Capitalization of interest 83 103 213
Tax and labor contingencies (2) (18) -
Shareholder debentures (87) (412) (86)
Others (209) (159) (144)
Financial expenses (REFIS) (108) (126) (129)
Financial income 116 64 30
Derivatives¹ (91) 209 759
Currency and interest rate swaps (96) 247 483
Others² (bunker oil, commodities, etc) 5 (38) 276
Foreign Exchange (602) 236 1,934
Monetary variation 11 (7) (51)
Financial result, net (1,339) (613) 2,075
¹ The net derivatives loss of US$ 91 million in 2Q17 are comprised of settlement losses of US$ 3 million and mark-to-market loss of US$ 88 million.
² Other derivatives include mainly bunker oil derivatives losses of US$ 18 million.
Equity income from affiliated companies
Equity income from affiliated companies showed a loss of US$ 24 million in 2Q17 vs. a gain of
US$ 73 million in 1Q17. The main negative contributor to equity income was CSP (US$ 131
million) due to the impact of the BRL depreciation on the USD denominated debt of the
company, which was partially offset by the positive contributions of the leased pelletizing
companies in Tubarão (US$ 61 million), MRS (US$ 22 million) and VLI (US$ 19 million).

13
Investments8
Capital expenditures totaled US$ 894 million in 2Q17 with US$ 388 million in project execution
and US$ 507 million in sustaining capital. Capital expenditures decreased US$ 219 million vs.
the US$ 1.113 billion spent in 1Q17.
Project Execution and Sustaining by business area US$ million 2Q17 % 1Q17 % 2Q16 %
Ferrous Minerals 619 69.2 830 74.6 767 59.0
Coal 15 1.6 56 5.1 159 12.2
Base Metals 254 28.4 208 18.7 232 17.9
Power generation 6 0.6 14 1.2 16 1.2
Steel 2 0.2 5 0.5 126 9.7
Others 0 0.0 0 0.0 - -
Total 894 100.0 1,113 100.0 1,300 100.0
Project execution
Investment in project execution totaled US$ 388 million in 2Q17, decreasing 33.9% due to the
purchase of wagons and locomotives for the S11D project in 1Q17.
Ferrous Minerals accounted for about 95% of the total investment in project execution in 2Q17.
Project execution by business area US$ million 2Q17 % 1Q17 % 2Q16 %
Ferrous Minerals 370 95.4 528 89.9 608 68.2
Coal 7 1.7 32 5.4 140 15.7
Base Metals 5 1.3 10 1.6 1 0.2
Power generation 5 1.2 13 2.2 16 1.8
Steel 2 0.4 5 0.9 126 14.2
Total 388 100.0 587 100.0 891 100.0
FERROUS MINERALS
About 96% of the US$ 370 million invested in Ferrous Minerals in 2Q17 relates to the S11D
project and the expansion of its associated infrastructure (US$ 357 million).
8 Does not include Fertilizers investments

14
S11D Mine – Truckless system in operation
S11D (including mine, plant and associated logistics – CLN S11D) achieved a combined
physical progress of 90% in 2Q17 with 99% progress at the mine site and 83% at the logistic
infrastructure sites. The duplication of the railway reached 71% physical progress with 397 Km
duplicated.
S11D Logistics – Duplication of the railway
Railway bridge “Estreito dos Mosquitos” – segments 02-03

15
Description and status of main projects
Progress indicators9
Sustaining capex
Sustaining capital totaled US$ 507 million in 2Q17, decreasing 4% when compared to 1Q17.
The Ferrous Minerals and Base Metals business segments each accounted for 49% of the total
sustaining capex in 2Q17.
Sustaining capex in the Base Metals business segment was mainly dedicated to: (i)
operational improvements (US$ 191 million); (ii) improvement in the current standards of
health and safety and environmental protection (US$ 51 million); and (iii) maintenance
improvements and expansion of tailings dams (US$ 4 million). Base Metals sustaining capex
will be higher in 2017 due to the transition in Sudbury to a single furnace operation and the
investments for the Air Emission Reduction project (AER).
Sustaining capital for the Ferrous Minerals business segment included, among others: (i)
enhancement and replacement in operations (US$ 153 million); (ii) improvement in the current
standards of health and safety, social and environmental protection (US$ 40 million); and (iii)
maintenance, improvement and expansion of tailings dams (US$ 40 million). Maintenance of
railways and ports in Brazil and Malaysia accounted for US$ 64 million.
9 Pre-operating expenses were not included in the estimated capex for the year, although included in the total estimated capex
column, in line with Vale’s Board of Directors approvals. Estimated capex for the year is only reviewed once a year.
Project Description Capacity
(Mtpy) Status
Ferrous Minerals projects
CLN S11D Duplication of 570 km
railway, with construction of rail spur of 101 km,
acquisition of wagons, locomotives, onshore and offshore expansions at the
PDM maritime terminal.
(80)1 Duplication of the railway
reached 71% physical progress, totaling 397 Km delivered
Onshore expansion reached
90% physical progress
1 Net addit ional capacity .
Project Capacity
(Mtpy) Estimated start-up
Executed capex
(US$ million)
Estimated capex
(US$ million) Physical progress
2017 Total 2017 Total
Ferrous Minerals projects
CLN S11D 230 (80)a 1H14 to 2H19 568 6,230 962 7,850b 83%
a Net addit ional capacity. b Original capex budget of US$ 11.582 bill ion.

16
Vale approved the restart of the São Luis pellet plant with its start-up planned for the first half
of 2018. The project, which includes the revamp of the plant and the upgrade of its automation
system, will cost US$ 105 million and will be charged to sustaining investments.
Sustaining investments in iron ore fines (excluding sustaining investments in pellet plants)
amounted to US$ 185 million, equivalent to US$ 2.8/dmt of iron ore fines in 2Q17, vs. the US$
3.8/dmt in 1Q17, mainly due to the positive impact of the BRL depreciation against the USD in
2Q17, the dilution of disbursements on higher sales volumes and the carryover of payments of
mining equipment acquired in 2016, which were payed only in 1Q17. The last twelve months
average of sustaining capex for iron ore fines amounts to US$ 3.0/dmt.
Sustaining capex by type - 2Q17
US$ million Ferrous Minerals
Coal Base Metals TOTAL
Operations 154 3 191 348
Waste dumps and tailing dams 40 0 4 44
Health and Safety 31 3 8 42
CSR - Corporate Social Responsibility 10 1 42 53
Administrative & Others 15 1 3 18
Total 249 8 249 507
Sustaining capex by business area US$ million 2Q17 % 1Q17 % 2Q16 %
Ferrous Minerals 249 49.1 302 57.5 159 38.9
Coal 8 1.6 25 4.7 19 4.6
Base Metals 249 49.1 198 37.7 231 56.5
Power generation 1 0.2 1 0.1 0 0.0
Others 0 0.0 0 0.0 - -
Total 507 100.00 526 100.00 409 100.00
Corporate social responsibility
Investments in corporate social responsibility totaled US$ 127 million in 2Q17, of which US$
103 million dedicated to environmental protection and conservation and US$ 24 million
dedicated to social projects.

17
Free cash flow
Free cash flow was US$ 2.151 billion in 2Q17.
Cash generated from operations was US$ 4.085 billion in 2Q17 with a strong cash collection
from the 1Q17 sales, which positively influenced accounts receivables by US$ 1.528 billion.
The improvement in accounts receivables was partially offset by an increase in inventories
(US$ 223 million).
Free Cash Flow 2Q17
US$ million

18
Debt indicators Gross debt totaled US$ 27.852 billion as of June 30th, 2017, decreasing US$ 1.718 billion from
the US$ 29.570 billion as of March 31st, 2017, mainly due to our liability management program.
Despite the negative impact of 26.6% reduction of the Platts IODEX (US$ 1.867 billion), the
payments of Sumic put option (US$ 353 million) and dividends (US$ 1.459 billion), net debt
decreased by US$ 655 million compared to the end of the previous quarter, totaling US$ 22.122
billion based on a cash position of US$ 5.730 billion as of June 30th, 2017.
Debt position
Gross debt after currency and interest rate swaps was 92% denominated in USD, with 29%
based on floating and 71% based on fixed interest rates as of June 30th, 2017.

19
Average debt maturity increased slightly to 8.1 years on June 30th, 2017, against 8.0 years on
March 31st, 2017. Average cost of debt, after the abovementioned currency and interest rate
swaps, increased slightly, to 4.88% per annum on June 30th, 2017, against 4.71% per annum
on March 31st, 2017.
On June 9th, 2017, Vale completed a five-year US$ 2 billion syndicated revolving credit facility,
which replaced the US$ 2 billion facility signed in 2013. Vale’s current outstanding revolving
credit facilities total US$ 5 billion.
Interest coverage, measured by the ratio of LTM10 adjusted EBITDA to LTM gross interest,
improved to 7.9x in 2Q17 vs. 7.7x in 1Q17 and vs. 4.2x in 2Q16.
Leverage, measured by gross debt to LTM adjusted EBITDA decreased to 1.9x as of June 30th,
2017 from 2.1x as of March 31st, 2017 and from 4.4x as of June 30th, 2016.
Debt indicators US$ million 2Q17 1Q17 2Q16
Total debt 27,852 29,570 31,814
Net debt 22,122 22,777 27,508
Total debt / adjusted LTM EBITDA (x) 1.9 2.1 4.4
Adjusted LTM EBITDA / LTM gross interest (x) 7.9 7.7 4.2
10 Last twelve months.
20
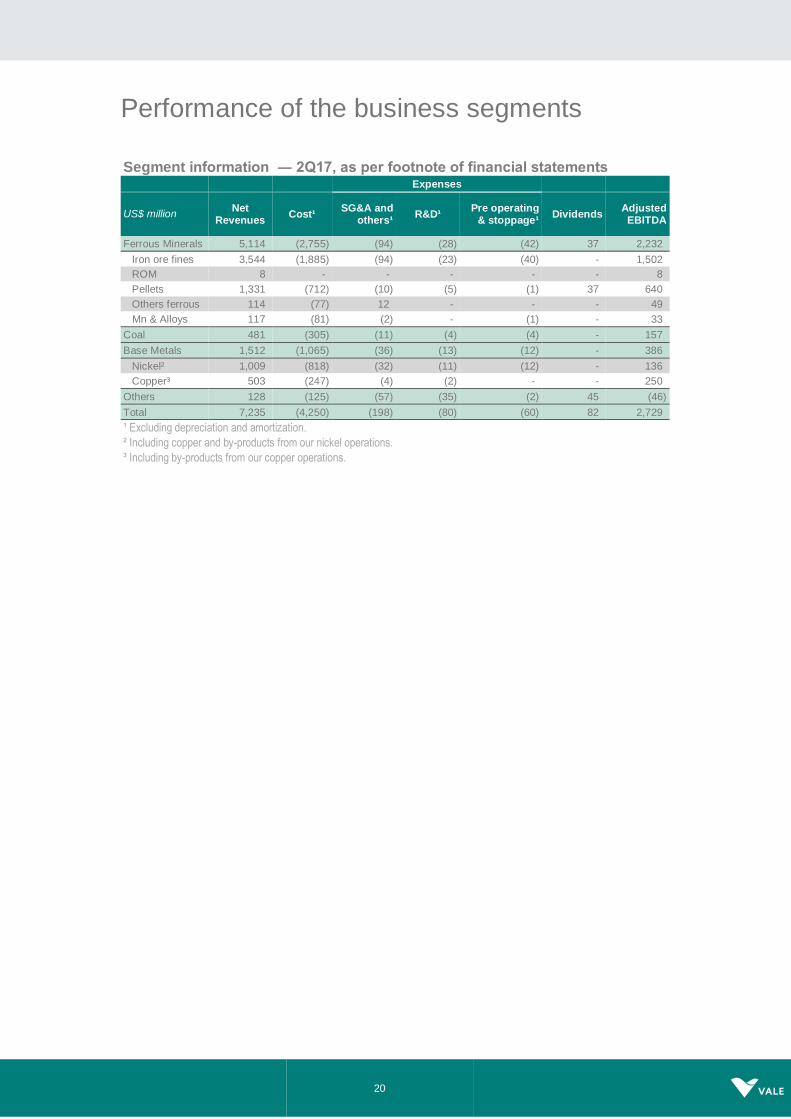
Performance of the business segments
Segment information ― 2Q17, as per footnote of financial statements Expenses
US$ million Net
Revenues Cost¹
SG&A and others¹
R&D¹ Pre operating
& stoppage¹ Dividends
Adjusted EBITDA
Ferrous Minerals 5,114 (2,755) (94) (28) (42) 37 2,232
Iron ore fines 3,544 (1,885) (94) (23) (40) - 1,502
ROM 8 - - - - - 8
Pellets 1,331 (712) (10) (5) (1) 37 640
Others ferrous 114 (77) 12 - - - 49
Mn & Alloys 117 (81) (2) - (1) - 33
Coal 481 (305) (11) (4) (4) - 157
Base Metals 1,512 (1,065) (36) (13) (12) - 386
Nickel² 1,009 (818) (32) (11) (12) - 136
Copper³ 503 (247) (4) (2) - - 250
Others 128 (125) (57) (35) (2) 45 (46)
Total 7,235 (4,250) (198) (80) (60) 82 2,729
¹ Excluding depreciation and amortization.
² Including copper and by-products from our nickel operations.
³ Including by-products from our copper operations.

21
Ferrous Minerals
Adjusted EBITDA of the Ferrous Minerals business segment was US$ 2.232 billion in 2Q17,
43.7% lower than in 1Q17, mainly as a result of the 26.6% reduction of the Platts IODEX (US$
1.867 billion) and higher costs (US$ 148 million), which were partially offset by higher sales
volumes (US$ 327 million).
EBITDA variation 1Q17 vs. 2Q17 – Ferrous Minerals business segment
Iron ore fines (excluding Pellets and ROM)
EBITDA
Adjusted EBITDA of iron ore fines was US$ 1.502 billion in 2Q17, 51.5% lower than in 1Q17,
mainly as a result of lower realized prices (US$ 1.686 billion), which were impacted by the
26.6% reduction of the Platts IODEX, and higher costs and expenses (US$ 173 million), being
partially offset by the positive impacts of higher sales volumes (US$ 265 million).
SALES REVENUES AND VOLUME
Net sales revenues of iron ore fines, excluding pellets and Run of Mine (ROM), amounted to
US$ 3.544 billion in 2Q17 vs. US$ 4.826 billion in 1Q17, as a result of lower iron ore fines
realized prices (US$ 1.686 billion), which were partially offset by higher sales volumes (US$
404 million).
Sales volumes of iron ore fines reached 69.0 Mt in 2Q17 vs. 63.7 Mt in 1Q17, 8.3% higher than
in 1Q17, due to the usual weather related seasonality in 1Q17 and the S11D ramp-up. Offshore
inventories increased 5.3 Mt in 2Q17 vs. 1Q17 to support the ongoing offshore blending

22
activities in Malaysia and at 11 ports in China. No further build-up of inventories is expected in
2017, as the required inventory levels have been achieved to support planned blending
volumes this year.
CFR sales of iron ore fines totaled 46.4 Mt in 2Q17, representing 67% of all iron ore fines sales
volumes in 2Q17 and in line with the share of CFR sales in 1Q17.
Net operating revenue by product US$ million 2Q17 1Q17 2Q16
Iron ore fines 3,544 4,826 3,508
ROM 8 15 5
Pellets 1,331 1,459 868
Manganese & Ferroalloys 117 86 61
Others 114 111 99
Total 5,114 6,497 4,541
Volume sold ‘000 metric tons 2Q17 1Q17 2Q16
Iron ore fines 69,019 63,682 72,678
ROM 240 1,636 405
Pellets 12,479 12,582 11,388
Manganese ore 392 196 354
Ferroalloys 36 30 36
REALIZED PRICES
Pricing system breakdown

23
Price realization – iron ore fines
Vale’s CFR dmt reference price for iron ore fines (ex-ROM) decreased by US$ 25.9/t from US$
86.7/t in 1Q17 to US$ 60.7/t in 2Q17, mainly as a result of the reduction in the IODEX (-US$
22.7/t).
Vale’s CFR/FOB wmt price for iron ore fines (ex-ROM) decreased 32.3% (US$ 24.4/t) from
US$ 75.8/t in 1Q17 to US$ 51.3/t in 2Q17, after adjusting for moisture and the effect of FOB
sales, which accounted for 33% of total sales volumes in 2Q17.
The negative US$ 0.2/t in ‘Premiums/Discounts and commercial conditions’ stems from higher
market discounts on high silica content. For that reason, Vale will reduce production of high
silica products by an annualized rate of 19 Mt from 2H17 onwards and will limit the silica (SiO2)
content of its Brazilian Blend Fines (BRBF) to 5%, reinforcing the use of the BRBF as a
baseload charge for blast furnace. Vale is the player with the highest flexibility in the market to
adjust its product quality output, by managing production of lower and/or higher quality ore,
according to market demand.
Price realization in 2Q17 was impacted by:
Provisional prices set at the end of 1Q17 at US$ 77.9/t, which were later adjusted
based on the price of delivery in 2Q17, and negatively impacted prices in 2Q17 by US$
4.2/t compared to a positive impact of US$ 4.1/t in 1Q17 as a result of the lower realized
prices in 2Q17.

24
Provisional prices set at the end of 2Q17 at US$ 62.1/t vs. the IODEX average of US$
62.9/t in 2Q17, which negatively impacted prices in 2Q17 by US$ 0.3/t compared to a
negative impact of US$ 3.2/t in 1Q17.
Quarter-lagged contracts, priced at US$ 83.3/t based on the average prices for Dec-
Jan-Feb, which positively impacted prices in 2Q17 by US$ 1.8/t compared to a
negative impact of US$ 2.1/t in 1Q17.
Iron ore sales of 25.5 Mt, or 37% of Vale’s sales mix, were recorded under the provisional
pricing system, which was set at the end of 2Q17 at US$ 62.1/t. The final prices of these sales
and the required adjustment to sales revenues will be determined and recorded in 3Q17.
Average prices US$/ metric ton 2Q17 1Q17 2Q16
Iron ore - Metal Bulletin 65% index 76.50 99.11 59.99
Iron ore - Platts' 62% IODEX 62.90 85.64 55.70
Iron ore fines CFR reference price (dmt) 60.70 86.70 56.30
Iron ore fines CFR/FOB realized price 51.35 75.78 48.30
ROM 34.23 9.17 12.35
Pellets CFR/FOB (wmt) 106.68 115.96 76.20
Manganese ore 180.08 219.39 103.13
Ferroalloys 1,265.31 1,433.33 690.36
COSTS
Costs for iron ore fines amounted to US$ 1.885 billion (or US$ 2.151 billion with depreciation
charges) in 2Q17. Costs increased US$ 91 million when compared to 1Q17, after adjusting for
the effects of higher sales volumes (US$ 139 million) and exchange rate variations (-US$ 22
million), mainly due to higher maritime freight costs, higher third party railway costs in the
Southern System (MRS), demurrage and seasonally higher maintenance costs.
IRON ORE COGS - 1Q17 x 2Q17
Variance drivers
US$ million 1Q17 Volume Exchange
Rate Others
Total
Variation 1Q17 x 2Q17
2Q17
Total costs before depreciation and amortization
1,677 139 (22) 91 208 1,885
Depreciation 253 21 (6) (2) 13 266
Total 1,930 160 (28) 89 221 2,151
Maritime freight costs, which are fully accrued as cost of goods sold, totaled US$ 690 million
in 2Q17, increasing US$ 82 million vs. 1Q17.
Unit maritime freight cost per iron ore metric ton was US$ 14.9/t in 2Q17, US$ 0.7/t higher than
in 1Q17, mainly due to the negative impacts of higher freight spot prices (US$ 1.1/t), which
have a lagged effect on Vale’s costs vs. the quarterly average of market spot indexes, and

25
partially offset by lower bunker oil prices (US$ 0.2/t) and other savings (US$ 0.2/t). Vale’s
average bunker oil price decreased from US$ 314/t in 1Q17 to US$ 306/t in 2Q17.
C1 CASH COST
C1 cash cost FOB port per metric ton for iron ore fines ex-royalties increased by US$ 0.5/t,
from the US$ 14.7 recorded in 1Q17 to US$ 15.2/t in 2Q17, as a result of higher railway tariff
(MRS11) on the Southern System (US$ 0.2/t), higher demurrage costs (US$ 0.2/t) and
maintenance costs (US$ 0.1/t) which were partially offset by the positive impact of the BRL
depreciation against the USD of 3.4% in 2Q17 (US$ 0.2/t).
C1 cash cost FOB port per metric ton of iron ore fines in BRL increased by 6.9% to R$ 49.3/t
(USD 15.2/t), as a result of a one-off railway tariff charge (MRS), higher demurrage costs and
seasonally higher maintenance costs. Costs are expected to decrease to the range of R$ 46
- 47/t in 2H17, back to the BRL levels of two years ago, due to the combination of higher
production, seasonally lower maintenance costs and productivity gains.
Iron Ore Fines Costs and Expenses in BRL R$/t 2Q17 1Q17 2Q16
Costs¹ 49.3 46.1 46.1
Expenses¹ 7.3 2.7 9.7
Total 56.5 48.8 55.8
¹ Net of depreciation.
Evolution of C1 Cash Cost¹ per ton in BRL
11 Southern system third party railway.

26
EXPENSES
Iron ore expenses, net of depreciation, amounted to US$ 157 million in 2Q17, 185% higher
than the US$ 55 million recorded in 1Q17. SG&A and other expenses totaled US$ 94 million
in 2Q17, increasing US$ 96 million mainly due to the positive effect of the recovery of the
insurance associated with the destruction of the “Fábrica Nova – Timbopeba” long distance
belt conveyor (US$ 85 million) in 1Q17. R&D amounted to US$ 23 million, increasing US$ 7
million vs. 1Q17, due to the usual seasonality of expenditures. Pre-operating and stoppage
expenses, net of depreciation, amounted to US$ 40 million, in line with 1Q17, mainly related to
S11D pre-operating expenses.
Iron ore fines cash cost and freight 2Q17 1Q17 2Q16
Costs (US$ million)
COGS, less depreciation and amortization 1,885 1,677 1,652
Distribution costs 33 25 30
Maritime freight costs 690 608 571
FOB at port costs (ex-ROM) 1,162 1,044 1,051
FOB at port costs (ex-ROM and ex-royalties) 1,051 937 958
Sales volumes (Mt)
Total iron ore volume sold 69.3 65.3 73.1
Total ROM volume sold 0.2 1.6 0.4
Volume sold (ex-ROM) 69.0 63.7 72.7
% of CFR sales 67% 67% 66%
% of FOB sales 33% 33% 34%
Vale's iron ore cash cost (ex-ROM, ex-royalties), FOB (US$ /t) 15.2 14.7 13.2
Freight
Volume CFR (Mt) 46.4 42.8 48.2
Vale's iron ore unit freight cost (US$/t) 14.9 14.2 11.8
Evolution of iron ore fines cash cost, freight and expenses

27
Evolution of iron ore fines sustaining per ton
Iron ore pellets
Adjusted EBITDA for pellets in 2Q17 was US$ 640 million, 19.1% lower than the US$ 791
million recorded in 1Q17. The decrease of US$ 151 million was a result of lower sales prices
(US$ 116 million) and higher costs and expenses12 (US$ 65 million), which were partially offset
by higher dividends received13 (US$ 37 million).
Net sales revenues for pellets amounted to US$ 1.331 billion in 2Q17, decreasing US$ 128
million from the US$ 1.459 billion recorded in 1Q17 as a result of lower realized sales prices
(US$ 116 million), which decreased from an average of US$ 116.0 per ton in 1Q17 to US$
106.7 per ton in 2Q17. Sales volumes were 12.5 Mt, in line with the 12.6 Mt sold in 1Q17.
CFR pellet sales of 2.7 Mt in 2Q17 represented 21% of total pellet sales, in line with the 22%
recorded in 1Q17. FOB pellet sales amounted to 9.8 Mt, in line with the 10.0 Mt in 1Q17.
Pellet CFR/FOB prices decreased by US$ 9.3/t to US$ 106.7/t in 2Q17, whereas the Platts
IODEX iron ore reference price (CFR China) decreased by US$ 22.7/t in the quarter, mainly as
a result of the positive impact of contracts with lagged prices and higher pellet premiums.
Pellet costs totaled US$ 712 million (or US$ 800 million with depreciation charges) in 2Q17.
After adjusting for the effects of exchange rate variations (-US$ 9 million), costs increased by
US$ 68 million vs. 1Q17 mainly due to the higher leasing costs of the pelletizing plants which
are based on a predetermined formula linked to pellet premiums.
12 After adjusting for the effects of lower volumes and exchange rate variations. 13 Dividends from leased pelletizing plants, which are usually paid every 6 months (in 2Q and 4Q).

28
Pre-operating and stoppage expenses for pellets were US$ 1 million in 2Q17, in line with 1Q17.
SG&A and other expenses totaled US$ 10 million, a decreasing of US$ 2 million when
compared to 1Q17.
EBITDA unit margin for pellets was US$ 51.3/t in 2Q17, 18.4% lower than in 1Q17 mainly due
to higher costs and lower realized prices as mentioned above.
Pellets - EBITDA ex-Samarco
2Q17 1Q17
US$
million US$/wmt
US$ million
US$/wmt
Net Revenues / Realized Price 1,331 106.7 1,459 116.0
Dividends Received (Leased pelletizing plants) ex-Samarco 37 3.0 0 0.0
Cash Costs (Iron ore, leasing, freight, overhead, energy and other) (712) (57.1) (652) (51.8)
Expenses (SG&A, R&D and other) (16) (1.3) (16) (1.3)
EBITDA ex-Samarco 640 51.3 791 62.8
Iron ore fines and pellets cash break-even
Quarterly iron ore fines and pellets EBITDA break-even, measured by unit cash costs and
expenses on a landed-in-China basis (and adjusted for quality, pellets margins differential and
moisture, excluding ROM), increased US$ 4.2/t when compared to 1Q17, totaling US$
34.7/dmt in 2Q17, with the abovementioned increase in costs, expenses and freight, partially
offset by the exchange rate variation.
Quarterly iron ore and pellets cash break-even on a landed-in-China basis, including sustaining
capex per ton of US$ 2.8/dmt, increased from US$ 34.4/dmt in 1Q17 to US$ 37.5/dmt in 2Q17.
Iron ore and pellets cash break-even landed in China¹ US$/t 2Q17 1Q17 2Q16
Vale's iron ore cash cost (ex-ROM, ex-royalties), FOB (US$ /t) 15.2 14.7 13.2
Iron ore fines freight cost (ex-bunker oil hedge) 14.9 14.2 11.8
Iron ore fines distribution cost 0.7 0.6 0.6
Iron ore fines expenses² & royalties 3.9 2.6 4.0
Iron ore fines moisture adjustment 3.1 2.9 2.6
Iron ore fines quality adjustment (1.2) (2.4) (1.6)
Iron ore fines EBITDA break-even (US$/dmt) 36.6 32.6 30.7
Iron ore fines pellet adjustment (1.9) (2.1) (2.2)
Iron ore fines and pellets EBITDA break-even (US$/dmt) 34.7 30.5 28.5
Iron ore fines sustaining investments 2.8 3.8 1.8
Iron ore fines and pellets cash break-even landed in China (US$/dmt) 37.5 34.4 30.3
¹ Measured by unit cost + expenses + sustaining investment adjusted for quality. ² Net of depreciation.

29
Manganese and ferroalloys
Adjusted EBITDA of manganese ore and ferroalloys was US$ 33 million in 2Q17, US$ 4 million
lower than the US$ 37 million in 1Q17, mainly due to the impact of higher costs and expenses14
(US$ 35 million), which were partly offset by higher sales volumes (US$ 29 million).
Net sales revenues for manganese ore increased to US$ 71 million in 2Q17 from US$ 43 million
in 1Q17 mainly due to higher sales volumes (US$ 45 million), which were partially offset by
lower sales prices (US$ 18 million) in 2Q17. Volumes sold of manganese ore reached 392,000
t in 2Q17 vs. 196,000 t in 1Q17.
Net sales revenues for ferroalloys increased to US$ 46 million in 2Q17 from the US$ 43 million
in 1Q17, mainly due to higher sales volumes (US$ 9 million), which were partially offset by
lower sales prices (US$ 6 million). Volumes sold of ferroalloys increased to 36,000 t in 2Q17
from the 30,000 t recorded in 1Q17.
Manganese ore and ferroalloys costs totaled US$ 81 million (or US$ 86 million with
depreciation charges) in 2Q17. Costs increased 22.7% when compared to 1Q17 after adjusting
for the effect of higher volumes (US$ 27 million), mainly due to higher energy tariffs and
corrective maintenance.
Volume sold by destination – Iron ore and pellets ‘000 metric tons 2Q17 1Q17 2Q16
Americas 9,229 11,974 8,054
Brazil 6,493 10,100 6,291
Others 2,736 1,874 1,763
Asia 56,747 54,158 60,568
China 46,511 44,199 48,176
Japan 5,516 6,283 7,778
Others 4,720 3,676 4,614
Europe 12,802 8,971 12,893
Germany 5,270 3,988 5,160
France 2,117 936 1,799
Others 5,415 4,047 5,934
Middle East 1,686 1,901 2,231
Rest of the World 1,274 896 725
Total 81,738 77,900 84,471
``
14 After adjusting for the effects of lower volumes and exchange rates.

30
Selected financial indicators – Ferrous Minerals US$ million 2Q17 1Q17 2Q16
Net Revenues 5,114 6,497 4,541
Costs¹ (2,755) (2,449) (2,227)
Expenses¹ (94) (16) (171)
Pre-operating and stoppage expenses¹ (42) (45) (47)
R&D expenses (28) (20) (20)
Dividends received 37 - 60
Adjusted EBITDA 2,232 3,967 2,136
Depreciation and amortization (427) (416) (381)
Adjusted EBIT 1,768 3,551 1,695
Adjusted EBIT margin (%) 34.6 54.7 37.3
¹ Net of depreciation and amortization
Selected financial indicators – Iron ore fines
- 2Q17 1Q17 2Q16
Adjusted EBITDA (US$ million) 1,502 3,094 1,656
Volume Sold (Mt) 69.0 63.7 72.7
Adjusted EBITDA (US$/t) 21.8 48.6 22.8
Selected financial indicators – Pellets (excluding Samarco)
- 2Q17 1Q17 2Q16
Adjusted EBITDA (US$ million) 640 791 437
Volume Sold (Mt) 12.5 12.6 11.4
Adjusted EBITDA (US$/t) 51.3 62.9 38.4
Selected financial indicators – Iron ore fines and Pellets
- 2Q17 1Q17 2Q16
Adjusted EBITDA (US$ million) 2,142 3,885 2,093
Volume Sold (Mt) 81.5 76.3 84.1
Adjusted EBITDA (US$/t) 26.3 50.9 24.9

31
Base Metals
Adjusted EBITDA was US$ 386 million in 2Q17, decreasing US$ 24 million vs. 1Q17, mainly
as a result of lower nickel and copper realized prices (US$ 112 million), which were partially
offset by lower expenses (US$ 34 million), favourable volume impacts (US$ 29 million),
favourable exchange rate variation (US$ 11 million), higher by-product prices (US$ 10 million)
and lower costs (US$ 4 million).
SALES REVENUES AND VOLUMES
Nickel sales revenues were US$ 686 million in 2Q17, decreasing US$ 74 million vs. 1Q17 as
a result of the impact of lower realized nickel prices in 2Q17 (US$ 57 million) and lower sales
volumes and mix of products (US$ 17 million). Sales volumes totaled 71 kt, 1 kt lower than in
1Q17.
Copper sales revenues were US$ 535 million in 2Q17, decreasing US$ 33 million vs. 1Q17 as
a result of lower realized copper prices in 2Q17 (US$ 54 million), which was partially offset by
higher sales volumes (US$ 21 million). Sales volumes were 103 kt in 2Q17, 3 kt higher than in
1Q17.
PGMs (platinum group metals) sales revenues totaled US$ 77 million in 2Q17, decreasing US$
8 million vs. 1Q17. Sales volumes were 93,000 oz in 2Q17 vs. 104,000 oz in 1Q17. The PGMs
sales volume decrease was mainly due to the lower production of palladium and platinum.
Sales revenues from gold contained as a by-product in nickel and copper concentrates
amounted to US$ 139 million in 2Q17, increasing by US$ 9 million vs. 1Q17 mainly as a result
of increased Salobo deliveries in 2Q17, partially offset by lower Sudbury deliveries due to lower
production. Sales volumes of gold as a by-product amounted to 117,000 oz in 2Q17, 9,000 oz
higher than in 1Q17.
Net operating revenue by product US$ million 2Q17 1Q17 2Q16
Nickel 686 760 710
Copper 535 568 443
PGMs 77 85 99
Gold as by-product 139 130 154
Silver as by-product 9 7 10
Others 66 47 31
Total 1,512 1,597 1,447
32
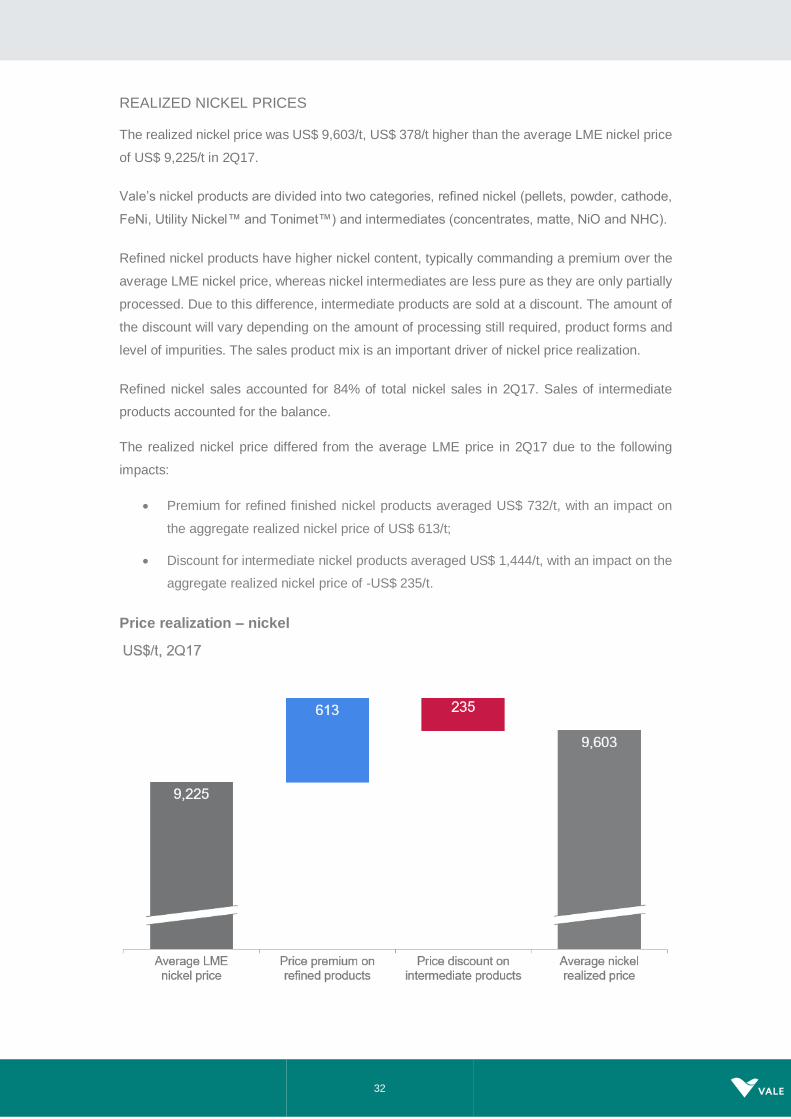
REALIZED NICKEL PRICES
The realized nickel price was US$ 9,603/t, US$ 378/t higher than the average LME nickel price
of US$ 9,225/t in 2Q17.
Vale’s nickel products are divided into two categories, refined nickel (pellets, powder, cathode,
FeNi, Utility Nickel™ and Tonimet™) and intermediates (concentrates, matte, NiO and NHC).
Refined nickel products have higher nickel content, typically commanding a premium over the
average LME nickel price, whereas nickel intermediates are less pure as they are only partially
processed. Due to this difference, intermediate products are sold at a discount. The amount of
the discount will vary depending on the amount of processing still required, product forms and
level of impurities. The sales product mix is an important driver of nickel price realization.
Refined nickel sales accounted for 84% of total nickel sales in 2Q17. Sales of intermediate
products accounted for the balance.
The realized nickel price differed from the average LME price in 2Q17 due to the following
impacts:
Premium for refined finished nickel products averaged US$ 732/t, with an impact on
the aggregate realized nickel price of US$ 613/t;
Discount for intermediate nickel products averaged US$ 1,444/t, with an impact on the
aggregate realized nickel price of -US$ 235/t.
Price realization – nickel

33
REALIZED COPPER PRICES
The realized copper price was US$ 5,200/t, US$ 462/t lower than the average LME copper
price of US$ 5,662/t in 2Q17. Vale’s copper products are mostly intermediate forms of copper,
predominantly in the form of concentrate, which is sold at a discount to the LME price. These
products are sold on a provisional pricing basis during the quarter with final prices determined
in a future period, generally one to four months forward15.
The realized copper price differed from the average LME price in 2Q17 due to the following
impacts:
Current period price adjustments: mark-to-market of invoices still open in the quarter
based on the copper price forward curve16 at the end of the quarter (US$ 171/t);
Prior period price adjustment: variance between the price used in final invoices (and in
the mark-to-market of invoices from previous quarters still open at the end of the
quarter) and the provisional prices used for sales in previous quarters (-US$ 80/t);
TC/RCs, penalties, premiums and discounts for intermediate products (-US$ 553/t).
Price realization – copper
15 On June 30th, 2017, Vale had provisionally priced copper sales totaling 102,198 tons valued at a LME forward price of US$
5,934/t, subject to final pricing over the next several months.
16 Includes a small number of final invoices that were provisionally priced and settled within the quarter.
34
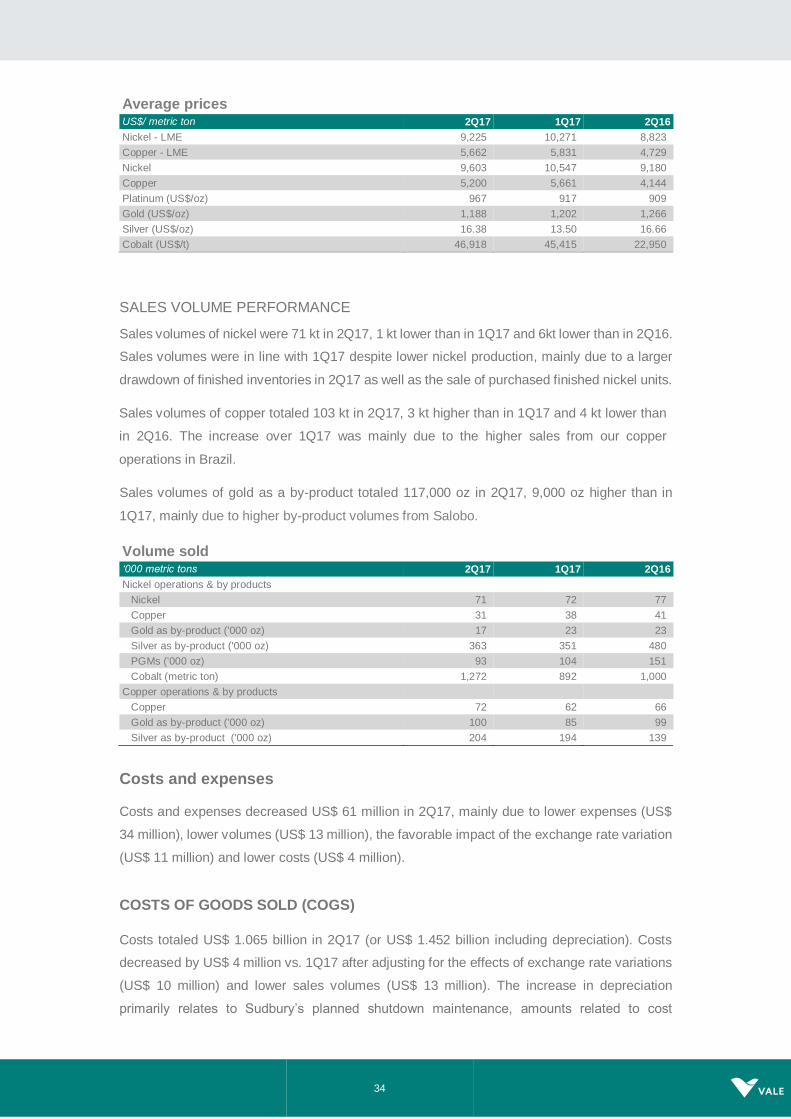
Average prices US$/ metric ton 2Q17 1Q17 2Q16
Nickel - LME 9,225 10,271 8,823
Copper - LME 5,662 5,831 4,729
Nickel 9,603 10,547 9,180
Copper 5,200 5,661 4,144
Platinum (US$/oz) 967 917 909
Gold (US$/oz) 1,188 1,202 1,266
Silver (US$/oz) 16.38 13.50 16.66
Cobalt (US$/t) 46,918 45,415 22,950
SALES VOLUME PERFORMANCE
Sales volumes of nickel were 71 kt in 2Q17, 1 kt lower than in 1Q17 and 6kt lower than in 2Q16.
Sales volumes were in line with 1Q17 despite lower nickel production, mainly due to a larger
drawdown of finished inventories in 2Q17 as well as the sale of purchased finished nickel units.
Sales volumes of copper totaled 103 kt in 2Q17, 3 kt higher than in 1Q17 and 4 kt lower than
in 2Q16. The increase over 1Q17 was mainly due to the higher sales from our copper
operations in Brazil.
Sales volumes of gold as a by-product totaled 117,000 oz in 2Q17, 9,000 oz higher than in
1Q17, mainly due to higher by-product volumes from Salobo.
Volume sold ‘000 metric tons 2Q17 1Q17 2Q16
Nickel operations & by products
Nickel 71 72 77
Copper 31 38 41
Gold as by-product ('000 oz) 17 23 23
Silver as by-product ('000 oz) 363 351 480
PGMs ('000 oz) 93 104 151
Cobalt (metric ton) 1,272 892 1,000
Copper operations & by products
Copper 72 62 66
Gold as by-product ('000 oz) 100 85 99
Silver as by-product ('000 oz) 204 194 139
Costs and expenses
Costs and expenses decreased US$ 61 million in 2Q17, mainly due to lower expenses (US$
34 million), lower volumes (US$ 13 million), the favorable impact of the exchange rate variation
(US$ 11 million) and lower costs (US$ 4 million).
COSTS OF GOODS SOLD (COGS)
Costs totaled US$ 1.065 billion in 2Q17 (or US$ 1.452 billion including depreciation). Costs
decreased by US$ 4 million vs. 1Q17 after adjusting for the effects of exchange rate variations
(US$ 10 million) and lower sales volumes (US$ 13 million). The increase in depreciation
primarily relates to Sudbury’s planned shutdown maintenance, amounts related to cost

35
normalization adjustments and the cessation of the allocation of part of Long Harbour's
production costs to pre-operating expenses.
BASE METALS COGS - 1Q17 x 2Q17
Variance drivers
US$ million 1Q17 Volume Exchange
Rate Others
Total Variation 1Q17 x 2Q17
2Q17
Total costs before
depreciation and amortization
1,092 (13) (10) (4) (27) 1,065
Depreciation 363 (4) (4) 32 24 387
Total 1,455 (17) (14) 28 (3) 1,452
UNIT CASH COST
North Atlantic operations unit cash cost decreased from the US$ 6,699/t recorded in 1Q17 to
US$ 5,388/t in 2Q17 mainly due to lower costs for purchased intermediate feed given declining
metal prices and the favourable impact of by-product revenues spread over 21% fewer nickel
deliveries, which was offset by planned shutdown maintenance costs in Sudbury.
PTVI unit cash cost was in line with 1Q17.
VNC unit cost net of by-product credits was in line with 1Q17.
Onça Puma unit cash cost increased from the US$ 9,341/t recorded in 1Q17 to US$ 10,164/t
in 2Q17, mainly due to the unfavorable impact of lower production volumes on unit costs.
Sossego unit cost decreased primarily due to higher by-product volumes and prices, and the
dilution of fixed costs caused by higher feed grades and higher mill productivity in 2Q17.
Salobo unit costs decreased mainly due to the dilution of fixed costs caused by higher sales
volume.
Base Metals – unit cash cost of sales per operation, net of by-product credits¹
US$ / t 2Q17 1Q17 2Q164
NICKEL
North Atlantic Operations2 5,388 6,699 4,632
PTVI2 6,827 6,821 4,680
VNC)3 11,222 11,232 11,879
Onça Puma 10,164 9,341 7,804
COPPER
Sossego 2,611 2,941 2,809
Salobo 1,274 1,406 954
1 North Atlantic figures includes Clydach and Acton refining costs. 2 Prior periods restated to include royalties, freight and other period costs. 3 Unit cash cost restated for periods prior to 1Q17 to exclude pre-operating and other operating expenses. 4 We realigned our unit cash cost of sales methodology in 1Q17 to include all freight, royalty and other costs reported as cost of goods sold and to exclude other operating expenses and pre-operating expenses for certain operations. Considering the previous criteria, the unit cash cost figures would be as follows: North Atlantic, US$ 3,582/t in 2Q16; PTVI, US$ 5,825/t in 2Q16, and; VNC, US$ 12,208/t in 2Q16.
36
EXPENSES
SG&A and other expenses, excluding depreciation, totaled US$ 36 million, a decrease of US$
10 million when compared to the US$ 46 million in 1Q17.
Pre-operating and stoppage expenses, net of depreciation, decreased significantly to US$ 12
million, all related to the Long Harbour operation as the refinery is successfully ramping up.
Long Harbour costs are no longer recorded as pre-operating expenses as of June 2017.
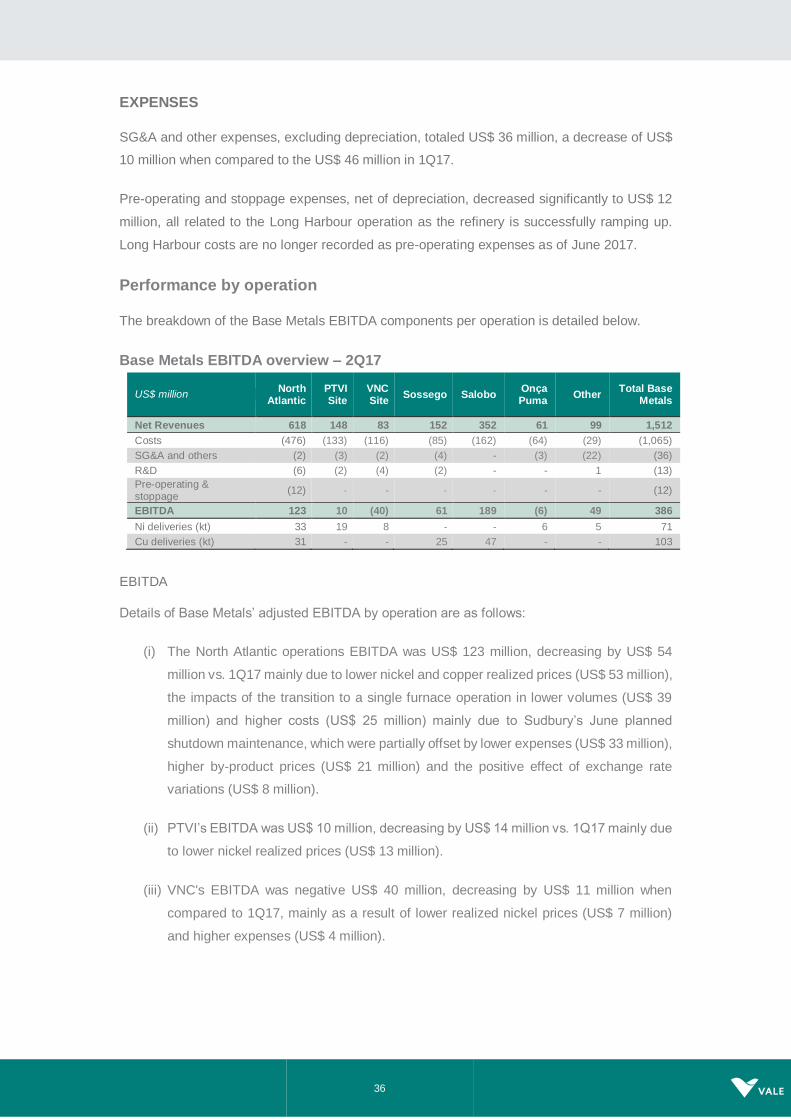
Performance by operation
The breakdown of the Base Metals EBITDA components per operation is detailed below.
Base Metals EBITDA overview – 2Q17
US$ million North
Atlantic PTVI Site
VNC Site
Sossego Salobo Onça Puma
Other Total Base
Metals
Net Revenues 618 148 83 152 352 61 99 1,512
Costs (476) (133) (116) (85) (162) (64) (29) (1,065)
SG&A and others (2) (3) (2) (4) - (3) (22) (36)
R&D (6) (2) (4) (2) - - 1 (13)
Pre-operating & stoppage
(12) - - - - - - (12)
EBITDA 123 10 (40) 61 189 (6) 49 386
Ni deliveries (kt) 33 19 8 - - 6 5 71
Cu deliveries (kt) 31 - - 25 47 - - 103
EBITDA
Details of Base Metals’ adjusted EBITDA by operation are as follows:
(i) The North Atlantic operations EBITDA was US$ 123 million, decreasing by US$ 54
million vs. 1Q17 mainly due to lower nickel and copper realized prices (US$ 53 million),
the impacts of the transition to a single furnace operation in lower volumes (US$ 39
million) and higher costs (US$ 25 million) mainly due to Sudbury’s June planned
shutdown maintenance, which were partially offset by lower expenses (US$ 33 million),
higher by-product prices (US$ 21 million) and the positive effect of exchange rate
variations (US$ 8 million).
(ii) PTVI’s EBITDA was US$ 10 million, decreasing by US$ 14 million vs. 1Q17 mainly due
to lower nickel realized prices (US$ 13 million).
(iii) VNC's EBITDA was negative US$ 40 million, decreasing by US$ 11 million when
compared to 1Q17, mainly as a result of lower realized nickel prices (US$ 7 million)
and higher expenses (US$ 4 million).

37
(iv) Onça Puma’s EBITDA was negative US$ 6 million, decreasing US$ 8 million vs. 1Q17,
mainly as a result of higher costs (US$ 6 million) and lower realized nickel prices (US$
4 million).
(v) Sossego’s EBITDA was US$ 61 million, in line with 1Q17 despite lower realized copper
prices (US$ 10 million), which were offset by higher volumes (US$ 4 million), lower
costs (US$ 2 million) and the positive effect of exchange rate variations (US$ 2 million).
(vi) Salobo’s EBITDA was US$ 189 million, increasing US$ 20 million vs. 1Q17, mainly as
a result of higher volumes (US$ 36 million) and lower costs (US$ 14 million), partially
offset by lower realized copper prices (US$ 29 million).
Base Metals – EBITDA by operation
Selected financial indicators - Base Metals
US$ million 2Q17 1Q17 2Q16
Net Revenues 1,512 1,597 1,447
Costs¹ (1,065) (1,092) (1,013)
Expenses¹ (36) (46) (11)
Pre-operating and stoppage expenses¹ (12) (38) (25)
R&D expenses (13) (11) (22)
Dividends received - - -
Adjusted EBITDA 386 410 376
Depreciation and amortization (397) (382) (438)
Adjusted EBIT (11) 28 (62)
Adjusted EBIT margin (%) (0.7) 1.8 (4.3)
¹ Net of depreciation and amortization
US$ million 2Q17 1Q17 2Q16
North Atlantic operation1, 3 123 177 233
PTVI 10 24 26
VNC (40) (29) (50)
Onça Puma (6) 2 31
Sossego2 61 61 30
Salobo 189 169 122
Others2, 3 49 6 (16)
Total 386 410 376
1 Includes the operations in Canada and in the United Kingdom.
2 Includes the PTVI and VNC off-takes, intercompany sales, purchase of finished nickel and corporate center allocation for
Base Metals.
3 Reflecting a realignment of our reporting for the North Atlantic operations and unit cash cost methodology for Q1, the EBITDA
in previous periods would change: North Atlantic would be US$ 259 million in 2Q16; Others would be -US$ 56 million in
2Q16.

38
Coal
EBITDA
Adjusted EBITDA for the Coal business segment was US$ 157 million in 2Q17, US$ 96 million
higher than the US$ 61 million recorded in 1Q17, mainly due to higher sales prices (US$ 69
million) and higher sales volumes (US$ 29 million).
Adjusted EBITDA from sales from the Nacala port was US$ 182 million and from sales from the
Beira port was a negative US$ 24 million, with general cargo accounting for the balance.
SALES REVENUES AND VOLUMES
Net sales revenues of metallurgical coal increased to US$ 414 million in 2Q17 from US$ 254
million in 1Q17, as a result of higher sales prices (US$ 74 million) and higher sales volumes
(US$ 85 million). Net sales revenues of thermal coal decreased to US$ 67 million in 2Q17 from
US$ 70 million in 1Q17 mainly as a result of lower sales prices (US$ 5 million).
Sales volumes of metallurgical coal totaled 2.057 Mt in 2Q17, increasing 33.8% vs. 1Q17, as a
result of the ramp-up of Moatize Coal Handling and Preparation Plant II (CHPP2) and the
improved performance of Coal Handling and Preparation Plant I (CHPP1). Sales volumes of
thermal coal totaled 1.064 Mt in 2Q17, 3.2% higher than in 1Q17. The sales mix in 2Q17 was
composed of 66% metallurgical coal and 34% thermal coal.
Production at Moatize amounted to 3.0 Mt in 2Q17, a quarterly production record, driven by
successive monthly records in the two Coal Handling and Preparation Plants (CHPP1 and
CHPP2).
REALIZED PRICES
Metallurgical coal
In 2Q17, metallurgical coal sales were priced as follows: (i) 79% based on index lagged prices;
and (ii) 21% based on fixed prices (spot shipments and trial cargos).
The metallurgical coal realized price increased 22%, from US$ 165.2/t in 1Q17 to US$ 201.2/t
in 2Q17, following the premium low vol HCC FOB Australia spot index, which increased 13%,
from US$ 168.2/t in 1Q17 to US$ 190.3/t.
Metallurgical coal prices US$ / metric ton 2Q17 1Q17 2Q16
Premium Low Vol HCC index price1 190.3 168.2 170.3
HCC benchmark price n.a. 285 84
Vale’s metallurgical coal realized price 201.2 165.2 77.5
1 Platts Premium Low Vol Hard Coking Coal FOB Australia.

39
Price realization in 2Q17 for metallurgical coal from Mozambique was impacted by:
Quality adjustment over the index reference price due to different product
characteristics as well as value in use adjustments associated with trial shipments of
our new premium and temporary sale of non-premium coking coal products, which
negatively impacted prices in 2Q17 by US$ 4.6/t.
Sales not evenly spread across the quarter, which positively impacted prices by US$
2.1/t.
Sales using fixed price (spot shipments and trial cargos), quarterly benchmark and
lagged index prices which positively impacted prices in 2Q17 by US$ 7.2/t, as index
prices were higher in 1Q17 and at the beginning of 2Q17.
Sales from the previous quarter with provisional prices adjusted in 2Q17, which
positively impacted prices by US$ 9.3/t as prices were above the average at the
beginning of 2Q17.
Freight differentials which negatively impacted prices in 2Q17 by US$ 0.2/t, mainly due
to differentials between Vale’s freight rates contracted from Mozambique to the delivery
ports and the freight rates set in the sales contracts, which are determined considering
delivery from the index reference port.
Other adjustments, including penalties and trial cargos incentives associated with the
new products or testing campaigns as part of the marketing development plans, which
negatively impacted prices in 2Q17 by US$ 3.0/t.

40
Price realization – Metallurgical coal from Mozambique
US$/t 2Q17
Thermal coal
In 2Q17, thermal coal sales were priced as follow: (i) 95% based on index prices and (ii) 5%
based on fixed prices.
The realized price of thermal coal was US$ 63.4/t in 2Q17, 7.0% lower than in 1Q17, and in
line with the 7.8% reduction of the index in the period.
Price realization in 2Q17 for thermal coal was impacted by:
Quality adjustment against the reference index given our lower calorific values and
higher ash levels, which negatively impacted prices by US$ 11.1/t.
Sales not evenly spread across the quarter, which negatively impacted prices by US$
4.5/t
Fixed price and lagged index pricing shipments, which positively impacted prices by
US$ 2.8/t.
Sales made in the previous quarter with provisional prices adjusted in 2Q17, which
negatively impacted prices by US$ 0.6/t as prices decreased in 2Q17 compared to
1Q17.

41
Freight differentials which positively impacted prices in 2Q17 by US$ 0.2/t, mainly due
to differentials between Vale’s freight rates contracted from Mozambique to the delivery
ports and the freight rates set in the sales contracts, which are determined considering
delivery from the index reference port
Other adjustments, mainly commercial premiums/discounts that positively impacted
prices by US$ 0.7/t.
Price realization – Thermal coal from Mozambique
US$/t, 2Q17
COSTS AND EXPENSES
Coal costs and expenses totaled US$ 324 million in 2Q17 (or US$ 398 million with depreciation
charges), increasing US$ 61 million against the US$ 263 million recorded in 1Q17. After
adjusting for higher sales volumes (US$ 59 million), costs and expenses remained practically
in line with 1Q17.
Costs at the mine and processing plants decreased by 16% in 2Q17 vs. 1Q17, as a result of
the successful ramp-up of Moatize CHPP2 and the strong performance of CHPP1.
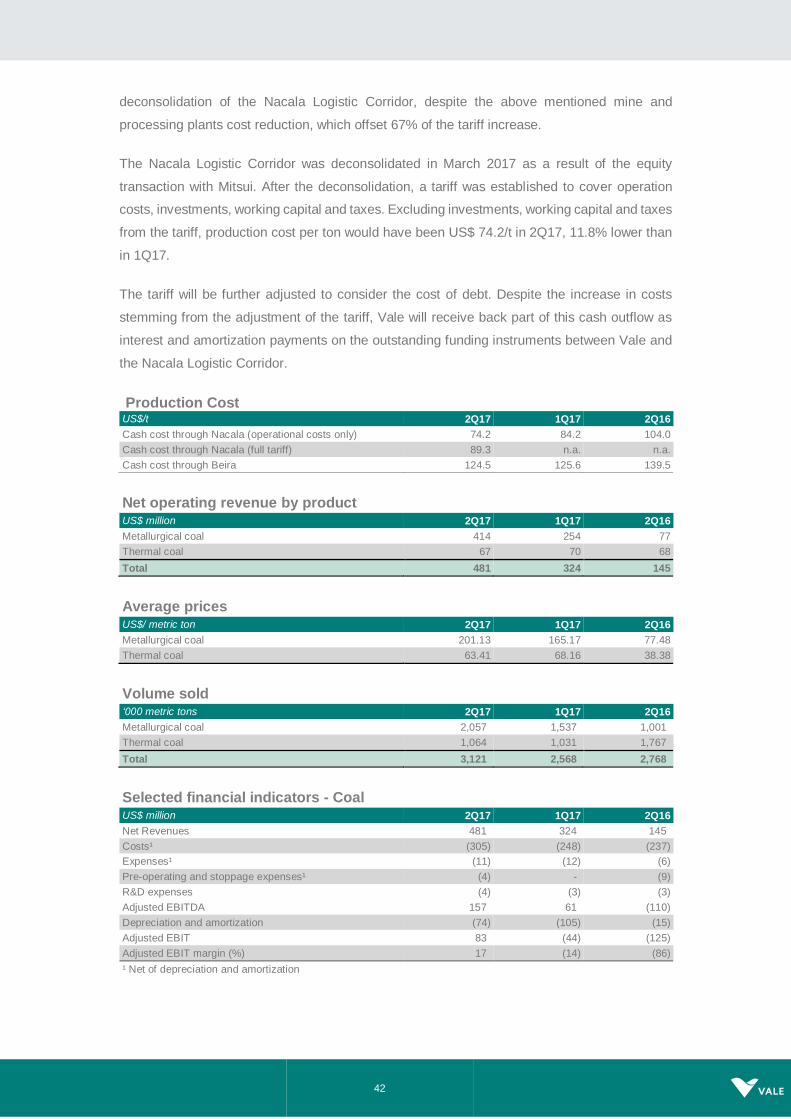
Production cost per ton of coal shipped through the Nacala port17 increased by 6% to US$ 89.3/t
in 2Q17 from US$ 84.2/t in 1Q17, due to the impact of the logistics tariff applied after the
17 FOB cash cost at the port (mine, plant, railroad and port) ex-royalties and demurrage costs
42
deconsolidation of the Nacala Logistic Corridor, despite the above mentioned mine and
processing plants cost reduction, which offset 67% of the tariff increase.
The Nacala Logistic Corridor was deconsolidated in March 2017 as a result of the equity
transaction with Mitsui. After the deconsolidation, a tariff was established to cover operation
costs, investments, working capital and taxes. Excluding investments, working capital and taxes
from the tariff, production cost per ton would have been US$ 74.2/t in 2Q17, 11.8% lower than
in 1Q17.
The tariff will be further adjusted to consider the cost of debt. Despite the increase in costs
stemming from the adjustment of the tariff, Vale will receive back part of this cash outflow as
interest and amortization payments on the outstanding funding instruments between Vale and
the Nacala Logistic Corridor.
Production Cost US$/t 2Q17 1Q17 2Q16
Cash cost through Nacala (operational costs only) 74.2 84.2 104.0
Cash cost through Nacala (full tariff) 89.3 n.a. n.a.
Cash cost through Beira 124.5 125.6 139.5
Net operating revenue by product US$ million 2Q17 1Q17 2Q16
Metallurgical coal 414 254 77
Thermal coal 67 70 68
Total 481 324 145
`
Average prices US$/ metric ton 2Q17 1Q17 2Q16
Metallurgical coal 201.13 165.17 77.48
Thermal coal 63.41 68.16 38.38
`
Volume sold ‘000 metric tons 2Q17 1Q17 2Q16
Metallurgical coal 2,057 1,537 1,001
Thermal coal 1,064 1,031 1,767
Total 3,121 2,568 2,768
`
Selected financial indicators - Coal US$ million 2Q17 1Q17 2Q16
Net Revenues 481 324 145
Costs¹ (305) (248) (237)
Expenses¹ (11) (12) (6)
Pre-operating and stoppage expenses¹ (4) - (9)
R&D expenses (4) (3) (3)
Adjusted EBITDA 157 61 (110)
Depreciation and amortization (74) (105) (15)
Adjusted EBIT 83 (44) (125)
Adjusted EBIT margin (%) 17 (14) (86)
¹ Net of depreciation and amortization

43
Financial indicators of non-consolidated companies
For selected financial indicators of the main non-consolidated companies, see our quarterly
financial statements on www.vale.com / investors / information to the market / financial
statements.
Conference call and webcast
Vale will host two conference calls and webcasts on Thursday, July 27th, 2017. The first, in
Portuguese (non-translated), will start at 10:00 a.m. Rio de Janeiro time. The second, in
English, will start at 12:00 p.m. Rio de Janeiro time (11:00 a.m. US Eastern Daylight Time and
4:00 p.m. British Standard Time)
Information on Dial-in to conference calls/webcasts:
In Portuguese:
Participants from Brazil: (55 11) 3193-1001 or (55 11) 2820-4001
Participants from the US: (1 888) 700-0802
Participants from other countries: (1 786) 924-6977
Access code: VALE
In English:
Participants from Brazil: (55 11) 3193-1001 or (55 11) 2820-4001
Participants from the U.S: (1 866) 262-4553
Participants from other countries: (1 412) 317-6029
Access code: VALE
Instructions for participation will be available on the website: www.vale.com/investors. A
podcast will be available on Vale’s Investor Relations website.
This press release may include statements that present Vale’s expectations about future events or results. All statements, when based upon
expectations about the future, involve various risks and uncertainties. Vale cannot guarantee that such statements will prove correct. These
risks and uncertainties include factors related to the following: (a) the countries where we operate, especially Brazil and Canada; (b) the global
economy; (c) the capital markets; (d) the mining and metals prices and their dependence on global industrial production, which is cyclical by
nature; and (e) global competition in the markets in which Vale operates. To obtain further information on factors that may lead to results
different from those forecast by Vale, please consult the reports Vale files with the U.S. Securities and Exchange Commission (SEC), the
Brazilian Comissão de Valores Mobiliários (CVM) and the French Autorité des Marchés Financiers (AMF), and in particular the factors discussed
under “Forward-Looking Statements” and “Risk Factors” in Vale’s annual report on Form 20-F.

44
ANNEX 1 – SIMPLIFIED FINANCIAL STATEMENTS
Income statement US$ million 2Q17 1Q17 2Q16
Net operating revenue 7,235 8,515 6,162
Cost of goods sold (5,102) (4,734) (4,313)
Gross profit 2,133 3,781 1,849
Gross margin (%) 29.5 44.4 30.0
Selling, general and administrative expenses (132) (124) (127)
Research and development expenses (80) (65) (72)
Pre-operating and stoppage expenses (90) (115) (110)
Other operational expenses (88) (77) (142)
Impairment and others results in non-current assets (220) 512 (66)
Operating profit 1,523 3,912 1,332
Financial revenues 116 64 30
Financial expenses (773) (1,115) (597)
Gains (losses) on derivatives, net (91) 209 759
Monetary and exchange variation (591) 229 1,883
Equity results in associates and joint ventures (24) 73 190
Impairment and others results in associates and joint
ventures (34) (61) (1,113)
Income (loss) before taxes 126 3,311 2,484
Current tax (69) (501) (413)
Deferred tax 118 (222) (929)
Net Earnings (loss) from continuing operations 175 2,588 1,142
Loss attributable to noncontrolling interest (31) (15) (15)
Gain (loss) from discontinued operations (128) (83) (21)
Net earnings (attributable to the Company's
stockholders) 16 2,490 1,106
Earnings (loss) per share (attributable to the Company's stockholders - US$)
0.00 0.48 0.21
Diluted earnings (loss) per share (attributable to the Company's stockholders - US$)
0.00 0.48 0.21
Equity income (loss) by business segment US$ million 2Q17 % 1Q17 % 2Q16 %
Ferrous Minerals 99 (412.5) 57 78.1 37 19.4
Coal 6 (25.0) 10 13.7 - -
Base Metals - 0.0 1 1.4 - -
Logistics - 0.0 - - - -
Steel (114) 475.0 (1) (1.4) 121 63.4
Others (15) 62.5 6 8.2 33 17.3
Total (24) 100.0 73 100.0 191 100.0

45
Balance sheet US$ million 6/30/2017 3/31/2017 6/30/2016
Assets
Current assets 19,862 22,421 18,274
Cash and cash equivalents 5,720 6,716 4,168
Accounts receivable 1,709 3,237 2,452
Other financial assets 2,193 2,196 342
Inventories 3,864 3,641 3,866
Prepaid income taxes 217 73 299
Recoverable taxes 1,302 1,553 1,781
Others 427 486 708
Non-current assets held for sale and discontinued
operation 4,430 4,519 4,658
Non-current assets 12,968 13,125 10,861
Judicial deposits 939 990 1,090
Other financial assets 3,334 3,379 679
Recoverable income taxes 548 538 513
Recoverable taxes 733 767 619
Deferred income taxes 7,095 7,127 7,289
Others 319 324 671
Fixed assets 65,475 67,462 71,835
Total assets 98,305 103,008 100,970
Liabilities
Current liabilities 10,582 11,825 11,546
Suppliers and contractors 3,746 3,647 3,891
Loans and borrowing 2,063 2,407 3,153
Other financial liabilities 876 1,358 1,610
Taxes payable 641 687 704
Provision for income taxes 257 120 120
Provisions 834 651 671
Dividends and interest on capital - 821 -
Liabilities related to associates and joint ventures 295 284 289
Others 781 811 1,028
Liabilities directly associated with non-current assets held for sale and discontinued operations
1,089 1,039 80
Non-current liabilities 45,822 47,612 47,941
Loans and borrowing 25,789 27,163 28,661
Other financial liabilities 3,144 3,194 1,962
Taxes payable 4,862 5,098 5,013
Deferred income taxes 1,565 1,677 1,739
Provisions 6,053 5,938 6,186
Liabilities related to associates and joint ventures 724 787 874
Gold stream transaction 1,984 2,032 1,666
Others 1,701 1,723 1,840
Total liabilities 56,404 59,437 59,487
Stockholders' equity 41,901 43,571 41,483
Total liabilities and stockholders' equity 98,305 103,008 100,970

46
Cash flow US$ million 2Q17 1Q17 2Q16
Cash flows from operating activities:
Net income (loss) before taxes on income 126 3,311 2,484
Adjustments to reconcile
Depreciation, depletion and amortization 904 908 839
Equity Income 24 (73) (190)
Other items from non-current assets 220 (512) 66
Impairment on assets and investments 34 61 1,113
Items of the financial result 1,339 613 (2,075)
Variation of assets and liabilities
Accounts receivable 1,380 298 78
Inventories (223) (221) 28
Suppliers and contractors 244 82 342
Payroll and related charges 199 (242) 39
Tax assets and liabilities, net 56 7 (3)
Goldstream transaction 0 0 0
Others (218) (176) 314
Net cash provided by operations 4,085 4,056 3,035
Interest on loans and financing (412) (515) (362)
Derivatives received (paid), net (3) (107) (353)
Remuneration paid to debentures (70) 0 (37)
Income taxes (37) (368) (114)
Income taxes - settlement program (120) (121) (100)
Net cash provided by operating activities 3,443 2,945 2,069
Cash flows from investing activities:
Additions to investments (361) (9) (136)
Acquisition of subsidiary 0 0 0
Additions to property, plant and equipment (890) (1,107) (1,164)
Proceeds from disposal of assets and investments 8 515 12
Dividends and interest on capital received from joint ventures and associates 82 0 114
Proceeds from goldstream transaction 0 0 0
Others (85) (199) (133)
Net cash used in investing activities (1,246) (800) (1,307)
Cash flows from financing activities:
Loans and financing
Additions 300 1,150 1,433
Repayments (1,852) (1,118) (1,808)
Payments to shareholders: 0 0 0
Dividends and interest on capital (1,454) 0 0
Dividends and interest on capital attributed to noncontrolling interest (5) (3) (71)
Other transactions with noncontrolling interest 0 255 0
Net cash provided by (used in) financing activities (3,011) 284 (446)
Increase (decrease) in cash and cash equivalents (859) 2,424 304
Cash and cash equivalents in the beginning of the period 6,716 4,262 3,779
Effect of exchange rate changes on cash and cash equivalents (137) 44 47
Cash of subsidiaries disposed 0 (14) 0
Cash and cash equivalents, end of period 5,720 6,716 4,130
Non-cash transactions:
Additions to property, plant and equipment - interest capitalization 83 103 213

47
ANNEX 2 – VOLUMES SOLD, PRICES AND MARGINS
Volume sold - Minerals and metals ‘000 metric tons 2Q17 1Q17 2Q16
Iron ore fines 69,019 63,682 72,678
ROM 240 1,636 405
Pellets 12,479 12,582 11,388
Manganese ore 392 196 354
Ferroalloys 36 30 36
Thermal coal 1,064 1,031 1,767
Metallurgical coal 2,057 1,537 1,001
Nickel 71 72 77
Copper 103 100 106
Gold as by-product ('000 oz) 117 108 122
Silver as by-product ('000 oz) 567 545 619
PGMs ('000 oz) 93 104 151
Cobalt (metric ton) 1,272 892 1,000
Average prices US$/ton 2Q17 1Q17 2Q16
Iron ore fines CFR reference price (dmt) 60.70 86.70 56.30
Iron ore fines CFR/FOB realized price 51.35 75.78 48.30
ROM 34.23 9.17 12.35
Pellets CFR/FOB (wmt) 106.68 115.96 76.20
Manganese ore 180.08 219.39 103.13
Ferroalloys 1,265.31 1,433.33 690.36
Thermal coal 63.41 68.16 38.38
Metallurgical coal 201.13 165.17 77.48
Nickel 9,603 10,547 9,180
Copper 5,200 5,661 4,144
Platinum (US$/oz) 967 917 909
Gold (US$/oz) 1,188 1,202 1,266
Silver (US$/oz) 16.38 13.50 16.66
Cobalt (US$/t) 46,918 45,415 22,950
Operating margin by segment (EBIT adjusted margin)
% 2Q17 1Q17 2Q16
Ferrous Minerals 34.6 54.7 37.3
Coal 17.3 (13.6) (86.2)
Base Metals (0.7) 1.8 (4.3)
Total¹ 24.1 39.9 22.7
¹ Excluding non-recurring effects

48
Annex 3 – reconciliation of IFRS and “NON-GAAP” information (a) Adjusted EBIT¹
US$ million 2Q17 1Q17 2Q16
Net operating revenues 7,235 8,515 6,162
COGS (5,102) (4,734) (4,313)
SG&A (132) (124) (127)
Research and development (80) (65) (72)
Pre-operating and stoppage expenses (90) (115) (110)
Other operational expenses (88) (77) (142)
Adjusted EBIT 1,743 3,400 1,398
¹ Excluding non-recurring effects.
(b) Adjusted EBITDA
EBITDA defines profit or loss before interest, tax, depreciation and amortization. Vale uses the term adjusted EBITDA to reflect exclusion of gains and/or losses on sale of assets, non-recurring expenses and the inclusion of dividends received from non-consolidated affiliates. However our adjusted EBITDA is not the
measure defined as EBITDA under IFRS, and may possibly not be comparable with indicators with the same name reported by other companies. Adjusted EBITDA should not be considered as a substitute for operational profit or as a better measure of liquidity than operational cash flow, which are calculated in
accordance with IFRS. Vale provides its adjusted EBITDA to give additional information about its capacity to pay debt, carry out investments and cover working capital needs. The following table shows the reconciliation between adjusted EBITDA and operational cash flow, in accordance with its statement of
changes in financial position:
Reconciliation between adjusted EBITDA and operational cash flow US$ million 2Q17 1Q17 2Q16
Adjusted EBITDA 2,729 4,308 2,351
Working capital:
Accounts receivable 1,380 298 78
Inventories (223) (221) 28
Suppliers 244 82 342
Payroll and related charges 199 (242) 39
Others (162) (169) 311
Adjustment for non-recurring items and other effects (82) - (114)
Cash provided from operations 4,085 4,056 3,035
Income taxes paid - current (37) (368) (114)
Income taxes paid - settlement program (120) (121) (100)
Interest paid for third parties (412) (515) (362)
Participative stockholders' debentures paid (70) - (37)
Derivatives received (paid), net (3) (107) (353)
Net cash provided by (used in) operating activities 3,443 2,945 2,069
(c) Net debt US$ million 2Q17 1Q17 2Q16
Total debt 27,852 29,570 31,814
Cash and cash equivalents¹ 5,730 6,793 4,306
Net debt 22,122 22,777 27,508
¹ Including financial investments
(d) Total debt / LTM Adjusted EBITDA
US$ million 2Q17 1Q17 2Q16
Total debt / LTM Adjusted EBITDA (x) 1.9 2.1 4.4
Total debt / LTM operational cash flow (x) 2.5 3.0 7.0
(e) LTM Adjusted EBITDA / LTM interest payments
US$ million 2Q17 1Q17 2Q16
Adjusted LTM EBITDA / LTM gross interest (x) 7.9 7.7 4.2
LTM adjusted EBITDA / LTM interest payments (x) 8.3 8.3 4.8
LTM operational profit / LTM interest payments (x) 5.5 5.4 (3.8)