2q17 highlights - nos e... · 2q17 highlights 2q16 2q17 2q17 / 2q16 1h16 1h17 1h17 / 1h16. 4 ......
TRANSCRIPT

2
Strong year over year Revenue and Cash Flow growth in 2Q17 led by solid operational
performance with growth still coming through in core RGUs;
+ 99.1 thousand RGU net adds of which:
+ 4.9 thousand pay TV, +6.2 thousand fixed, -1.3 thousand DTH;
+ 13.1 thousand fixed voice;
+ 18.5 thousand fixed broadband;
+ 62.0 thousand mobile.
+ 4.2% growth in Consolidated Revenues; 388.4 million euros
+5.4% growth in Consolidated EBITDA; 156.7 million euros
+ 52.5% yoy in Net Income; 40.4 million euros
+ 49% EBITDA–CAPEX; 71.1 million euros
Free Cash Flow 43.9 million euros; +3x
Consolidated CAPEX – 15.1%; 85.7 million euros
2Q17 Highlights
3
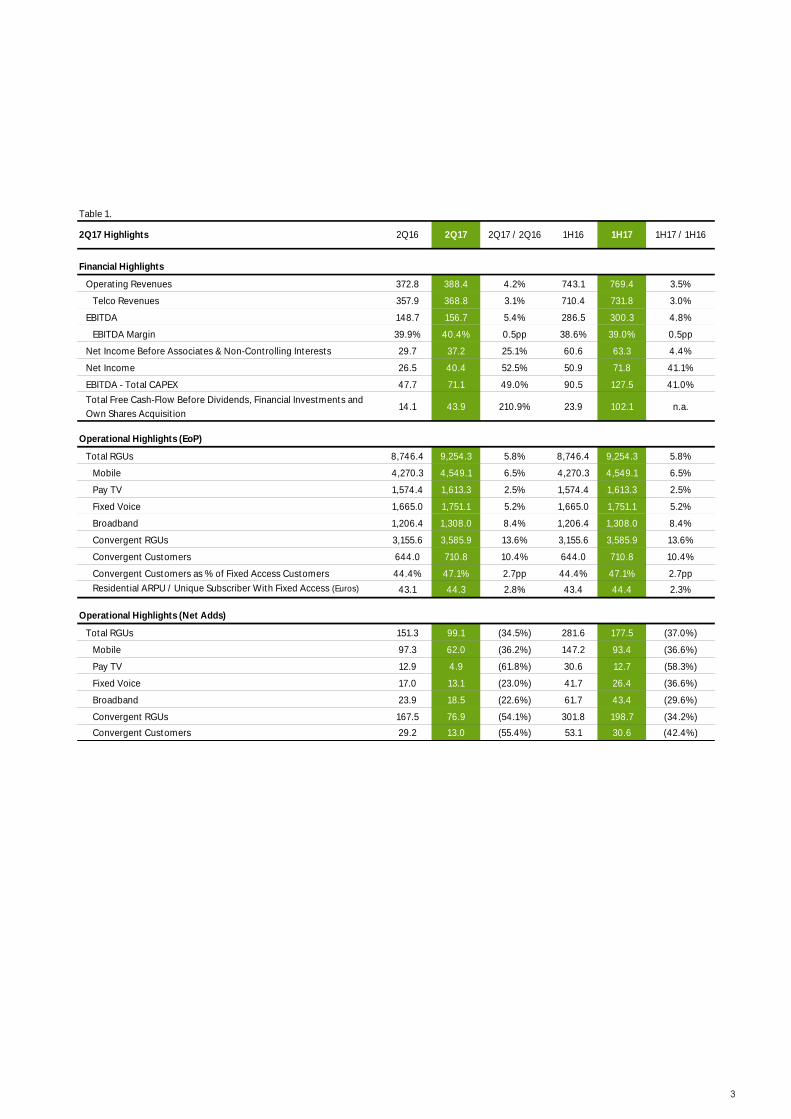
Table 1.
Financial Highlights
Operating Revenues 372.8 388.4 4.2% 743.1 769.4 3.5%
Telco Revenues 357.9 368.8 3.1% 710.4 731.8 3.0%
EBITDA 148.7 156.7 5.4% 286.5 300.3 4.8%
EBITDA Margin 39.9% 40.4% 0.5pp 38.6% 39.0% 0.5pp
Net Income Before Associates & Non-Controlling Interests 29.7 37.2 25.1% 60.6 63.3 4.4%
Net Income 26.5 40.4 52.5% 50.9 71.8 41.1%
EBITDA - Total CAPEX 47.7 71.1 49.0% 90.5 127.5 41.0%
Total Free Cash-Flow Before Dividends, Financial Investments and
Own Shares Acquisition14.1 43.9 210.9% 23.9 102.1 n.a.
Operational Highlights (EoP)
Total RGUs 8,746.4 9,254.3 5.8% 8,746.4 9,254.3 5.8%
Mobile 4,270.3 4,549.1 6.5% 4,270.3 4,549.1 6.5%
Pay TV 1,574.4 1,613.3 2.5% 1,574.4 1,613.3 2.5%
Fixed Voice 1,665.0 1,751.1 5.2% 1,665.0 1,751.1 5.2%
Broadband 1,206.4 1,308.0 8.4% 1,206.4 1,308.0 8.4%
Convergent RGUs 3,155.6 3,585.9 13.6% 3,155.6 3,585.9 13.6%
Convergent Customers 644.0 710.8 10.4% 644.0 710.8 10.4%
Convergent Customers as % of Fixed Access Customers 44.4% 47.1% 2.7pp 44.4% 47.1% 2.7pp
Residential ARPU / Unique Subscriber With Fixed Access (Euros) 43.1 44.3 2.8% 43.4 44.4 2.3%
Operational Highlights (Net Adds)
Total RGUs 151.3 99.1 (34.5%) 281.6 177.5 (37.0%)
Mobile 97.3 62.0 (36.2%) 147.2 93.4 (36.6%)
Pay TV 12.9 4.9 (61.8%) 30.6 12.7 (58.3%)
Fixed Voice 17.0 13.1 (23.0%) 41.7 26.4 (36.6%)
Broadband 23.9 18.5 (22.6%) 61.7 43.4 (29.6%)
Convergent RGUs 167.5 76.9 (54.1%) 301.8 198.7 (34.2%)
Convergent Customers 29.2 13.0 (55.4%) 53.1 30.6 (42.4%)
1H17 1H17 / 1H162Q17 / 2Q162Q172Q17 Highlights 2Q16 1H16
4
NOS continues to strengthen market share in almost all of its core services as reflected in the most recent
data published by ANACOM for end 1Q17. NOS´ share of mobile subscribers was 24.4%, 1.6 pp greater
than last year. Share of fixed internet and voice services grew by 0.8pp and 1.6pp to 37.7% and 35.1%,
respectively whilst pay TV market share remained stable at 43.5%.
Total RGUs grew by 5.8% yoy to 9.25 million services with net adds of 99.1 thousand in 2Q17. The primary
source of RGU growth for NOS is the network expansion project that NOS initiated in 2014, together with
marginal growth in the HFC footprint. By the end of 2Q17 NOS covered a total of 3.787 million households
with its fixed network, of which 449 thousand with FttH and the remaining 3.338 million with its Docsis 3.0
HFC network. NOS covered an additional 14.9 thousand households in 2Q17.
The Pay TV base continued to post healthy growth to 1,613 thousand subscribers, +2.5% yoy. During 2Q17,
fixed access customers grew by 6.2 thousand subscribers to 1.282 million, representing 34% penetration of
NOS’ total network coverage. In new network geographies covered since the merger, customer
penetration now stands at 24%, with some locations reaching close to 50%1.
Fixed network rollout of own and competitors’ ftth networks in areas previously covered only by satellite is,
as anticipated, starting to reflect on the DTH customer base, with NOS posting negative net adds of 1.3
thousand in 2Q17. Offers based on DTH are more vulnerable to fixed NGN solutions given their higher
Internet speeds and quality and interactivity of TV solutions. This is a trend that is set to continue although
mitigated by customer migration wherever possible to NOS’ own fixed network. NOS’ net losses of DTH
customers were compensated almost entirely by migrations to NOS’ FttH access.
Customers continue to take up convergent solutions, albeit at a slower pace due to the already high
level of penetration at 47.1% of the fixed network and 44.1% of the total customer base. Progressively
more households are upgrading to the higher end UMA interface with its more sophisticated features
amongst which its voice controled remote, advanced search functionalities, NOS’ cloud sharing service
and 4K viewing capabilities amongst others, acting as key differentiators versus other offers in the market.
Fixed Broadband and Voice services continued to post good growth of 18.5 thousand RGUs and 13.1
thousand RGUs respectively. By the end of 2Q17, penetration of fixed broadband services measured as a
proportion of the fixed customer base was 76.7% and penetration of fixed voice services was 86.7%,
reflecting the maturity of the market in terms of bundled offers.
1 The penetration rate refers to customer activations in new FttH geographies.
2Q17 Consolidated Results
5
Growth in convergence, stand-alone mobile segment and B2B services are the main drivers of mobile
RGU growth with an additional 62 thousand net adds during the quarter. Demand for speed and higher
data allowances increases quarter after quarter with the growth in the number of smartphones, 72% at
the end of 2Q17, and particularly of 4G enabled devices which stood at 59%. Monthly average data
usage on smartphones has grown by 70% to 1,603MB and by 61% to 1,960MB for 4G enabled devices.
Residential fixed access revenues per user (ARPU) grew by 2.8% yoy to 44.3 euros, reflecting continued
growth in average RGUs per account, increased traffic revenues and primarily the annual price increase
implemented at the end of 2016. Somewhat dampening these positive effects, ARPU comparison with
the previous year was impacted primarily by lower termination rates (this effect will no longer be material
going forward), lower revenues from discretionary subscription to premium services and lower
contribution of VoD, amongst others. Adjusting for these impacts, base ARPU would have grown by 3.9%
yoy.
RGU yoy growth in B2B was 8.0% in 2Q17 reaching 1.453 million services. NOS’ strategy for the business
segment is to continue to acquire its fair share of new accounts coming to the market whilst at the same
time seeking to protect the value of legacy accounts and increase share of wallet of telecom and IT
spend in existing accounts with full service solutions for the various subsegments. Although still a relatively
small source of business revenues, yoy growth in IT service revenues has been very strong at close to 20%.
A number of transformational projects are being implemented which are supportive of more value driven
growth albeit slower than in previous years. The operational model in B2B sub segments has been
revisited to guarantee that NOS is present in the most margin relevant stages of the customer relationship,
becoming a producer rather than a pure reseller of services where relevant. NOS is well positioned to
capture value from innovative services developing technological solutions supported by leading network
assets and service platforms and strong institutional partnerships when appropriate. Continuous and
open product and service innovation and excellence in service delivery are the foundations upon which
NOS differentiates itself in the market. Total B2B and Wholesale revenues posted a 5.6% increase yoy.
Business customer revenues posted growth of 3.0% and revenues from wholesale improved yoy by 9.3%.
The Wholesale business has a different revenue and margin profile from the Corporate and Mass Business
Segment, tending to present material volatility over the course of the year. A source of revenues that has
been diminishing in past quarters is Mass Calling Services (MCS) due to the marketwide decline of this
business, however solid growth in voice and data traffic and also roaming with the increase in tourism to
Portugal is helping to mitigate the negative impact of MCS.
6
Cinemas and Audiovisuals
Table 2.
Cinema (1)
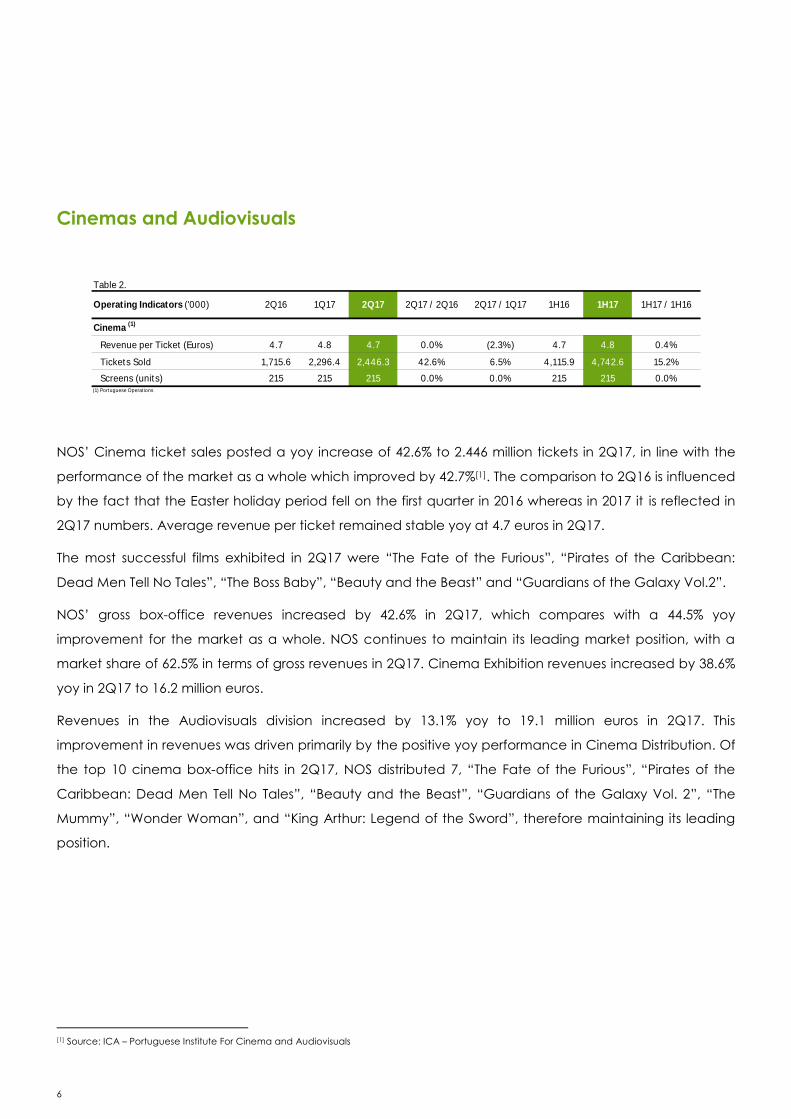
Revenue per Ticket (Euros) 4.7 4.8 4.7 0.0% (2.3%) 4.7 4.8 0.4%
Tickets Sold 1,715.6 2,296.4 2,446.3 42.6% 6.5% 4,115.9 4,742.6 15.2%
Screens (units) 215 215 215 0.0% 0.0% 215 215 0.0%(1) Portuguese Operations
1H17 / 1H16Operating Indicators ('000) 2Q16 2Q17 1H16 1H172Q17 / 2Q161Q17 2Q17 / 1Q17
NOS’ Cinema ticket sales posted a yoy increase of 42.6% to 2.446 million tickets in 2Q17, in line with the
performance of the market as a whole which improved by 42.7%[1]. The comparison to 2Q16 is influenced
by the fact that the Easter holiday period fell on the first quarter in 2016 whereas in 2017 it is reflected in
2Q17 numbers. Average revenue per ticket remained stable yoy at 4.7 euros in 2Q17.
The most successful films exhibited in 2Q17 were “The Fate of the Furious”, “Pirates of the Caribbean:
Dead Men Tell No Tales”, “The Boss Baby”, “Beauty and the Beast” and “Guardians of the Galaxy Vol.2”.
NOS’ gross box-office revenues increased by 42.6% in 2Q17, which compares with a 44.5% yoy
improvement for the market as a whole. NOS continues to maintain its leading market position, with a
market share of 62.5% in terms of gross revenues in 2Q17. Cinema Exhibition revenues increased by 38.6%
yoy in 2Q17 to 16.2 million euros.
Revenues in the Audiovisuals division increased by 13.1% yoy to 19.1 million euros in 2Q17. This
improvement in revenues was driven primarily by the positive yoy performance in Cinema Distribution. Of
the top 10 cinema box-office hits in 2Q17, NOS distributed 7, “The Fate of the Furious”, “Pirates of the
Caribbean: Dead Men Tell No Tales”, “Beauty and the Beast”, “Guardians of the Galaxy Vol. 2”, “The
Mummy”, “Wonder Woman”, and “King Arthur: Legend of the Sword”, therefore maintaining its leading
position.
[1] Source: ICA – Portuguese Institute For Cinema and Audiovisuals
7
The following Consolidated Financial Statements have been subject to limited review.
Consolidated Income Statement
Table 3.
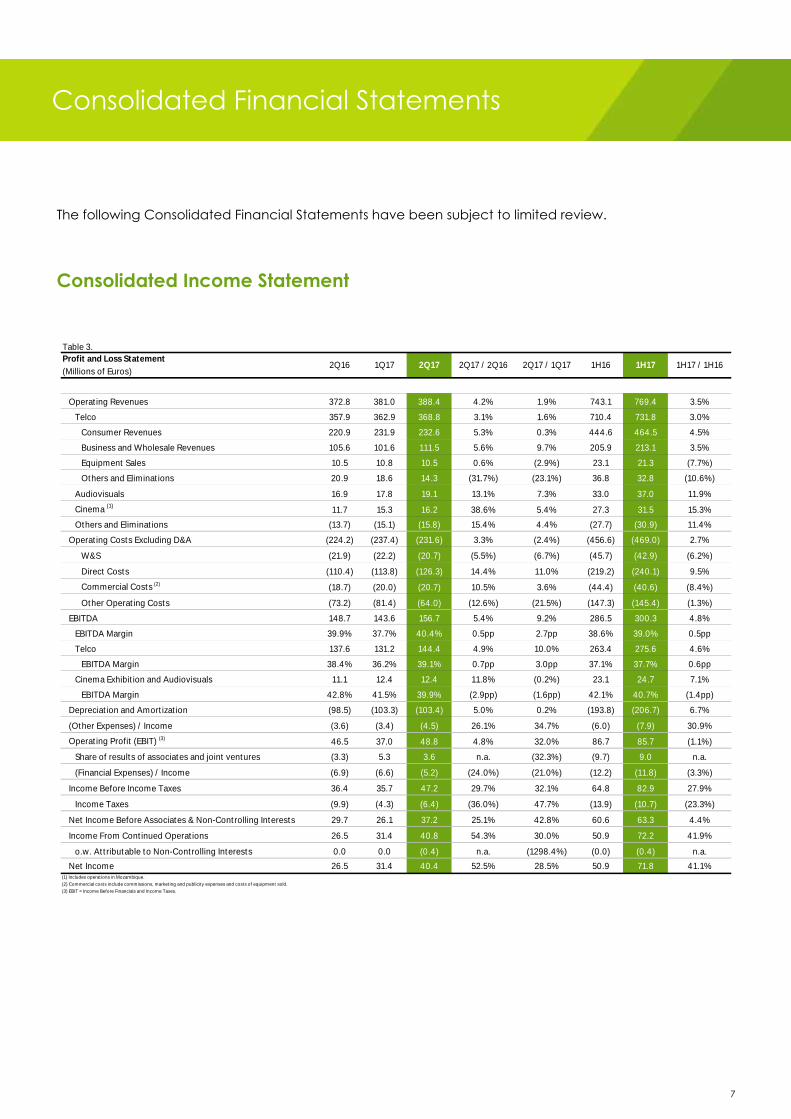
Operating Revenues 372.8 381.0 388.4 4.2% 1.9% 743.1 769.4 3.5%
Telco 357.9 362.9 368.8 3.1% 1.6% 710.4 731.8 3.0%
Consumer Revenues 220.9 231.9 232.6 5.3% 0.3% 444.6 464.5 4.5%
Business and Wholesale Revenues 105.6 101.6 111.5 5.6% 9.7% 205.9 213.1 3.5%
Equipment Sales 10.5 10.8 10.5 0.6% (2.9%) 23.1 21.3 (7.7%)
Others and Eliminations 20.9 18.6 14.3 (31.7%) (23.1%) 36.8 32.8 (10.6%)
Audiovisuals 16.9 17.8 19.1 13.1% 7.3% 33.0 37.0 11.9%
Cinema (1)11.7 15.3 16.2 38.6% 5.4% 27.3 31.5 15.3%
Others and Eliminations (13.7) (15.1) (15.8) 15.4% 4.4% (27.7) (30.9) 11.4%
Operating Costs Excluding D&A (224.2) (237.4) (231.6) 3.3% (2.4%) (456.6) (469.0) 2.7%
W&S (21.9) (22.2) (20.7) (5.5%) (6.7%) (45.7) (42.9) (6.2%)
Direct Costs (110.4) (113.8) (126.3) 14.4% 11.0% (219.2) (240.1) 9.5%
Commercial Costs (2)(18.7) (20.0) (20.7) 10.5% 3.6% (44.4) (40.6) (8.4%)
Other Operating Costs (73.2) (81.4) (64.0) (12.6%) (21.5%) (147.3) (145.4) (1.3%)
EBITDA 148.7 143.6 156.7 5.4% 9.2% 286.5 300.3 4.8%
EBITDA Margin 39.9% 37.7% 40.4% 0.5pp 2.7pp 38.6% 39.0% 0.5pp
Telco 137.6 131.2 144.4 4.9% 10.0% 263.4 275.6 4.6%
EBITDA Margin 38.4% 36.2% 39.1% 0.7pp 3.0pp 37.1% 37.7% 0.6pp
Cinema Exhibition and Audiovisuals 11.1 12.4 12.4 11.8% (0.2%) 23.1 24.7 7.1%
EBITDA Margin 42.8% 41.5% 39.9% (2.9pp) (1.6pp) 42.1% 40.7% (1.4pp)
Depreciation and Amortization (98.5) (103.3) (103.4) 5.0% 0.2% (193.8) (206.7) 6.7%
(Other Expenses) / Income (3.6) (3.4) (4.5) 26.1% 34.7% (6.0) (7.9) 30.9%
Operating Profit (EBIT) (3) 46.5 37.0 48.8 4.8% 32.0% 86.7 85.7 (1.1%)
Share of results of associates and joint ventures (3.3) 5.3 3.6 n.a. (32.3%) (9.7) 9.0 n.a.
(Financial Expenses) / Income (6.9) (6.6) (5.2) (24.0%) (21.0%) (12.2) (11.8) (3.3%)
Income Before Income Taxes 36.4 35.7 47.2 29.7% 32.1% 64.8 82.9 27.9%
Income Taxes (9.9) (4.3) (6.4) (36.0%) 47.7% (13.9) (10.7) (23.3%)
Net Income Before Associates & Non-Controlling Interests 29.7 26.1 37.2 25.1% 42.8% 60.6 63.3 4.4%
Income From Continued Operations 26.5 31.4 40.8 54.3% 30.0% 50.9 72.2 41.9%
o.w. Attributable to Non-Controlling Interests 0.0 0.0 (0.4) n.a. (1298.4%) (0.0) (0.4) n.a.
Net Income 26.5 31.4 40.4 52.5% 28.5% 50.9 71.8 41.1%(1) Includes operations in Mozambique.
(2) Commercial costs include commissions, marketing and publicity expenses and costs of equipment sold.
(3) EBIT = Income Before Financials and Income Taxes.
1H17 / 1H161H162Q17 2Q17 / 2Q16 1H17Profit and Loss Statement
(Millions of Euros)2Q16 1Q17 2Q17 / 1Q17
Consolidated Financial Statements
8
Operating Revenues
Consolidated Operating Revenues grew by 4.2% yoy to 388.4 million euros, with telco revenues growing
by 3.1%, Audiovisuals by 13.1% and Cinema revenues by 38.6%.
In the telco operation, Consumer Revenues grew by 5.3% in 2Q17 to 232.6 million euros, reflecting a
combination of higher growth in Residential revenues driven by continued take-up of convergent
bundles and the full quarterly impact of the price increases and a pick-up in the pace of growth of stand
alone personal revenues that have consolidated the inflexion of the negative growth trend of past
quarters reflecting less migration to integrated bundles with the slowdown in convergent take-up and the
impact of the price increases.
Business and Wholesale Revenues grew by 5.6% yoy to 111.5 million euros. Excluding Wholesale revenues,
Business revenues grew by 3.3%, driven by good RGU performance, acquisition of new accounts and the
price increase at the start of the year. Wholesale Revenues posted growth of more than 9% yoy due to
strong performance of wholesale voice, data and roaming traffic volumes, offsetting in full the continued
decline of the low margin mass calling service business which represented just 2% of total Business and
Wholesale Revenues in 2Q17, compared with almost 4% in 2Q16.
Year on year telco revenue comparisons should be adjusted to reflect the regulatory impacts of lower
MTRs which have been progressively coming down over the past years. The last relevant cut ocurred in
April 2016 when SMS MTRs declined 32.5% to €0.0083. The most recent cut to voice MTRs occurred already
at the start of July 2017 with a reduction of 7.4% to €0.0075 per minute. Adjusting for MTR cuts in yoy telco
revenue comparison in 2Q17, growth would have been 3.3%. In addition, midway through 1Q17, and as
a result of the implementation of a remedy imposed at the time of the merger, NOS sold Optimus’ FttH
network to Vodafone, and consequently has ceased to receive a wholesale revenue stream.
Cinema revenue growth was particularly strong in 2Q17 primarily due to the fact that Easter fell in the
second quarter this year whereas last year it had fallen in the first, an effect that also benefitted the
audiovisuals division. Movie going has been very strong yoy in 2017 to date, with revenues for the first six
months up by 15.3% in the cinema business and by 11.9% in the audiovisuals division.
9
Operating Costs
Total Operating Costs increased by 3.3% to 231.6 million euros in 2Q17, representing 59.6% of Total
Revenues, down 0.5 p.p. in comparison with 2Q16 despite the significant yoy increase in premium sports
content costs, and by 2.7 pp in comparison with 1Q17.
Excluding Direct Costs, Operating Costs were down 7% yoy reflecting a combination of operating
leverage from topline growth, efficiencies being achieved across the board and the release of a
provision as explained below.
The 5.5% decline in 2Q17 Wages and Salaries is explained essentially by differences in employee variable
remuneration as was the case of the decline in 1Q17 and by a temporary reduction in headcount.
Direct costs posted a significant increase of 14.4% yoy to 126.3 million euros due to higher programming
costs as a result of more expensive premium sports content and the revision of the Sport TV distribution
model from the start of the new football season in 2H16. In addition, wholesale traffic related costs
increased significantly yoy along with the higher volume of activity over last year and the costs
associated with movie royalties was also higher yoy due to the Easter effect mentioned above.
Commercial costs grew by 10.5% to 20.7 million euros, reflecting a combination of higher advertising costs
due to more advertising activity in the quarter and a lower level of equipment costs driven by fewer
handsets sold, as reflected in the level of revenues generated and due to a lower yoy level of non-
capitalized commissions.
The 12.6% decline of other operating costs is explained almost entirely by the release of a provision of
close to 7 million euros after the courts decided in favour of NOS in 2Q17 in a pending legal dispute
regarding fixed termination terms with ANACOM.
Consolidated EBITDA posted yoy growth of 5.4% yoy to 156.7 million euros representing an EBITDA margin
of 40.4% compared with 39.9% in 2Q16 and despite the aforementioned increase in premium sports
content costs as from 2H16.
Telco EBITDA recorded growth of 4.9% to 144.4 milion euros representing an EBITDA margin as a
percentage of revenues of 39.1%, up 0.7 pp over 2Q16. Audiovisuals and Cinemas EBITDA grew by 11.8%
yoy to 12.4 million euros led by the strong revenue growth of the quarter as explained above.
10
Net Income
Net Income grew by 52.5% in 2Q17 to 40.4 million euros.
In addition to the EBITDA growth described above, the most material contribution to the yoy variation
remains the more positive contribution to results from NOS’ share of Associates and Joint Ventures which
grew to 3.6 million euros in 2Q17 compared with negative 3.3 million euros in 2Q16. This improvement in
quarterly contribution is the result of a combination of the better exchange rate environment at ZAP
together with a price increase and cost savings that helped drive improved results of the operation and
also due to the change to the distribution model in 2H16 in Sport TV driving more positive financial results.
The increase in Depreciations and Amortizations is explained, as in previous quarters, primarily by the
large investments made in network assets and customer acquisition costs and also by write-offs driven by
investment in network renewal. Although average cost of debt continued to decline to 2.1% in 2Q17
compared with 2.3% in 2Q16, net funding costs were slightly higher due primarily to a temporary increase
in the average level of gross debt in the quarter to pay FY16 dividends of 102.6 million euros and despite
the reversal of outstanding interest related with a pending legal case for which NOS reached a
settlement in 2Q17. Income Tax provision amounted to 6.4 million euros in 2Q17 representing an effective
tax rate of 13.5%. The volatility in quarterly tax rate varies due to a combination of factors of which the
most relevant being accounting of deferred taxes and the contribution of the Share of Associates and
Joint Ventures line. Adjusting for the contribution of Associates, effective tax rate would have been 14.6%.
11
CAPEX
Table 4.
Telco 92.7 77.7 77.6 (16.3%) (0.1%) 177.6 155.3 (12.6%)
o.w. Technical CAPEX 45.8 36.0 42.4 (7.5%) 17.9% 87.8 78.4 (10.7%)
% of Telco Revenues 12.8% 9.9% 11.5% (1.3pp) 1.6pp 12.4% 10.7% (1.6pp)
Baseline Telco 34.9 26.8 35.9 3.0% 33.7% 62.4 62.8 0.5%
Network Expansion / Substitution and
Integration Projects and Others11.0 9.1 6.5 (40.9%) (28.8%) 25.4 15.6 (38.4%)
o.w. Customer Related CAPEX 46.9 41.7 35.2 (24.9%) (15.7%) 89.8 76.9 (14.4%)
% of Telco Revenues 13.1% 11.5% 9.5% (3.6pp) (2.0pp) 12.6% 10.5% (0.2pp)
Audiovisuals and Cinema Exhibition 8.2 9.4 8.1 (1.8%) (14.3%) 18.4 17.5 (5.0%)
Total Group CAPEX 101.0 87.1 85.7 (15.1%) (1.7%) 196.1 172.8 (11.9%)
% of Total Group Revenues 27.1% 22.9% 22.1% (5.0pp) (0.8pp) 26.4% 22.5% (0.1pp)
CAPEX (Millions of Euros) 2Q16 2Q17 2Q17 / 2Q16 1H17 / 1H161H16 1H171Q17 2Q17 / 1Q17
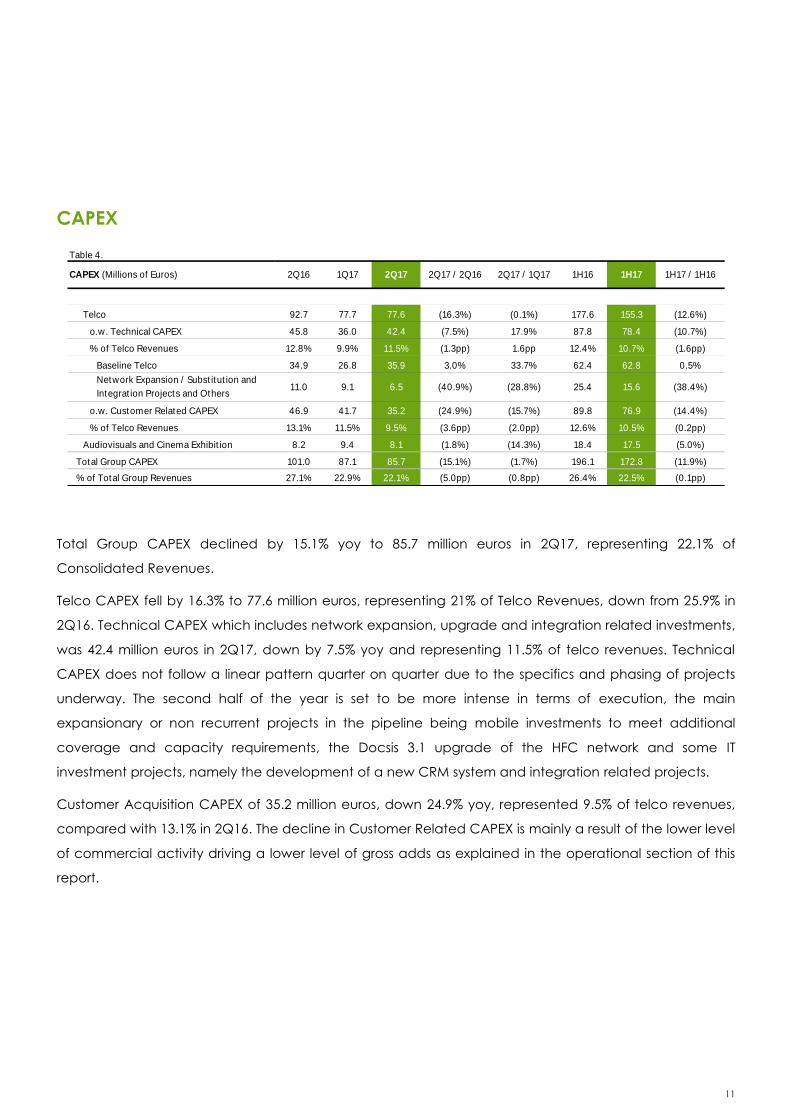
Total Group CAPEX declined by 15.1% yoy to 85.7 million euros in 2Q17, representing 22.1% of
Consolidated Revenues.
Telco CAPEX fell by 16.3% to 77.6 million euros, representing 21% of Telco Revenues, down from 25.9% in
2Q16. Technical CAPEX which includes network expansion, upgrade and integration related investments,
was 42.4 million euros in 2Q17, down by 7.5% yoy and representing 11.5% of telco revenues. Technical
CAPEX does not follow a linear pattern quarter on quarter due to the specifics and phasing of projects
underway. The second half of the year is set to be more intense in terms of execution, the main
expansionary or non recurrent projects in the pipeline being mobile investments to meet additional
coverage and capacity requirements, the Docsis 3.1 upgrade of the HFC network and some IT
investment projects, namely the development of a new CRM system and integration related projects.
Customer Acquisition CAPEX of 35.2 million euros, down 24.9% yoy, represented 9.5% of telco revenues,
compared with 13.1% in 2Q16. The decline in Customer Related CAPEX is mainly a result of the lower level
of commercial activity driving a lower level of gross adds as explained in the operational section of this
report.
12
Cash Flow
Table 5.
EBITDA 148.7 143.6 156.7 5.4% 9.2% 286.5 300.3 4.8%
Total CAPEX (101.0) (87.1) (85.7) (15.1%) (1.7%) (196.1) (172.8) (11.9%)
EBITDA - Total CAPEX 47.7 56.5 71.1 49.0% 25.8% 90.5 127.5 41.0%
% of Revenues 12.8% 14.8% 18.3% 5.5pp 3.5pp 12.2% 16.6% 4.4pp
Non-Cash Items Included in EBITDA - CAPEX and Change in
Working Capital (18.9) (7.7) (13.2) (30.3%) 72.0% (38.8) (20.9) (46.2%)
Operating Cash Flow 28.8 48.8 57.9 101.2% 18.6% 51.7 106.7 106.3%
Long Term Contracts (4.4) (2.9) (3.8) n.a. n.a. (8.3) (6.7) (19.0%)
Cash Restructuring Payments (2.3) (5.3) (5.9) 158.0% 11.8% (5.7) (11.3) 96.2%
Interest Paid (4.2) (6.7) (4.9) 17.8% (26.2%) (9.7) (11.6) 20.4%
Income Taxes Paid (4.5) (0.3) (0.0) n.a. n.a. (5.4) (0.3) n.a.
Disposals 0.4 24.6 0.7 73.6% (97.1%) 0.8 25.3 n.a.
Other Cash Movements 0.4 (0.0) 0.0 (100.0%) n.a. 0.4 0.0 (100.0%)
Total Free Cash-Flow Before Dividends, Financial Investments
and Own Shares Acquisition14.1 58.2 43.9 210.9% (24.5%) 23.9 102.1 n.a.
Acquisition of Own Shares (13.3) 0.0 0.0 (100.0%) n.a. (20.7) 0.0 (100.0%)
Dividends (82.1) 0.0 (102.6) 25.0% n.a. (82.1) (102.6) 25.0%
Free Cash Flow (81.3) 58.2 (58.7) (27.8%) n.a. (78.9) (0.5) (99.3%)
Debt Variation Through Financial Leasing, Accruals &
Deferrals & Others(7.2) 0.8 (2.2) (69.4%) n.a. (8.9) (1.4) (84.3%)
Change in Net Financial Debt 88.5 (59.0) 60.9 (31.2%) n.a. 87.8 1.9 (97.8%)
2Q17 1H16 1H17 / 1H16Cash Flow (Millions of Euros) 2Q16 2Q17 / 2Q16 1H171Q17 2Q17 / 1Q17
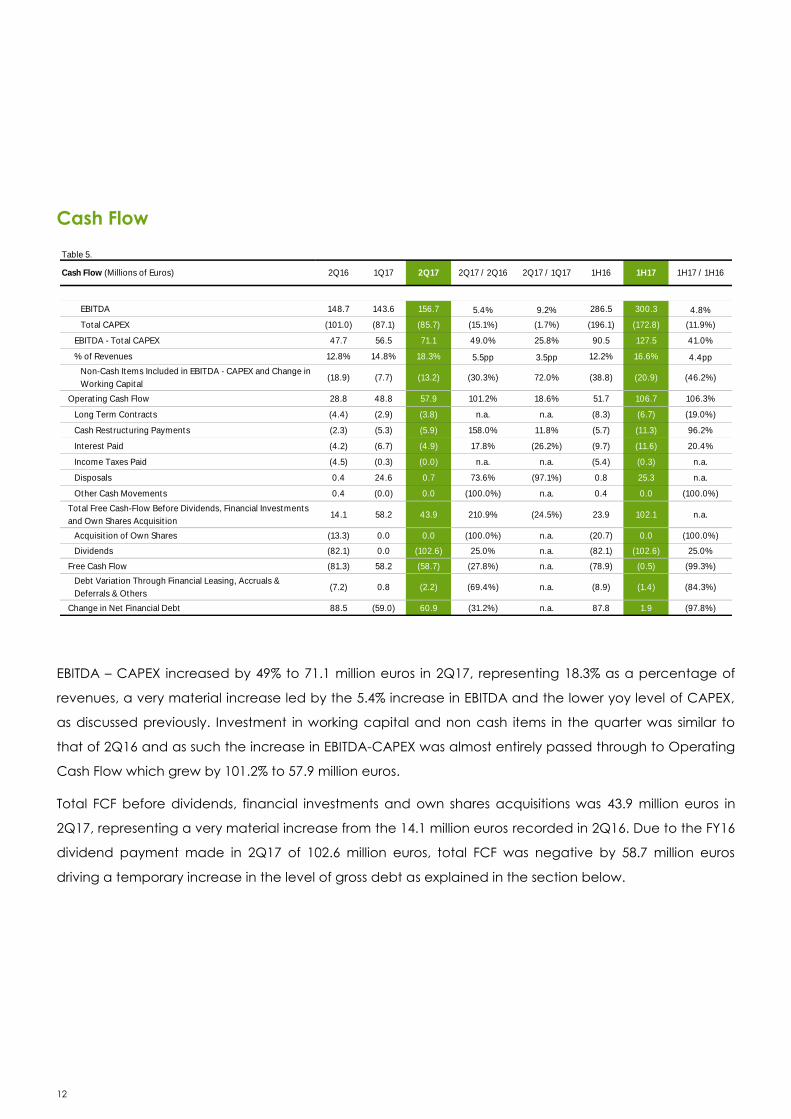
EBITDA – CAPEX increased by 49% to 71.1 million euros in 2Q17, representing 18.3% as a percentage of
revenues, a very material increase led by the 5.4% increase in EBITDA and the lower yoy level of CAPEX,
as discussed previously. Investment in working capital and non cash items in the quarter was similar to
that of 2Q16 and as such the increase in EBITDA-CAPEX was almost entirely passed through to Operating
Cash Flow which grew by 101.2% to 57.9 million euros.
Total FCF before dividends, financial investments and own shares acquisitions was 43.9 million euros in
2Q17, representing a very material increase from the 14.1 million euros recorded in 2Q16. Due to the FY16
dividend payment made in 2Q17 of 102.6 million euros, total FCF was negative by 58.7 million euros
driving a temporary increase in the level of gross debt as explained in the section below.
13
Consolidated Balance Sheet
Table 6.
Non-current Assets 2,453.0 2,425.8
Current Assets 529.6 496.3
Total Assets 2,982.6 2,922.1
Total Shareholders' Equity 1,053.1 1,025.8
Non-current Liabilities 1,168.7 1,210.5
Current Liabilities 760.8 685.8
Total Liabilities 1,929.5 1,896.3
Total Liabilities and Shareholders' Equity 2,982.6 2,922.1
Balance Sheet (Millions of Euros) 2016 2Q17
Capital Structure
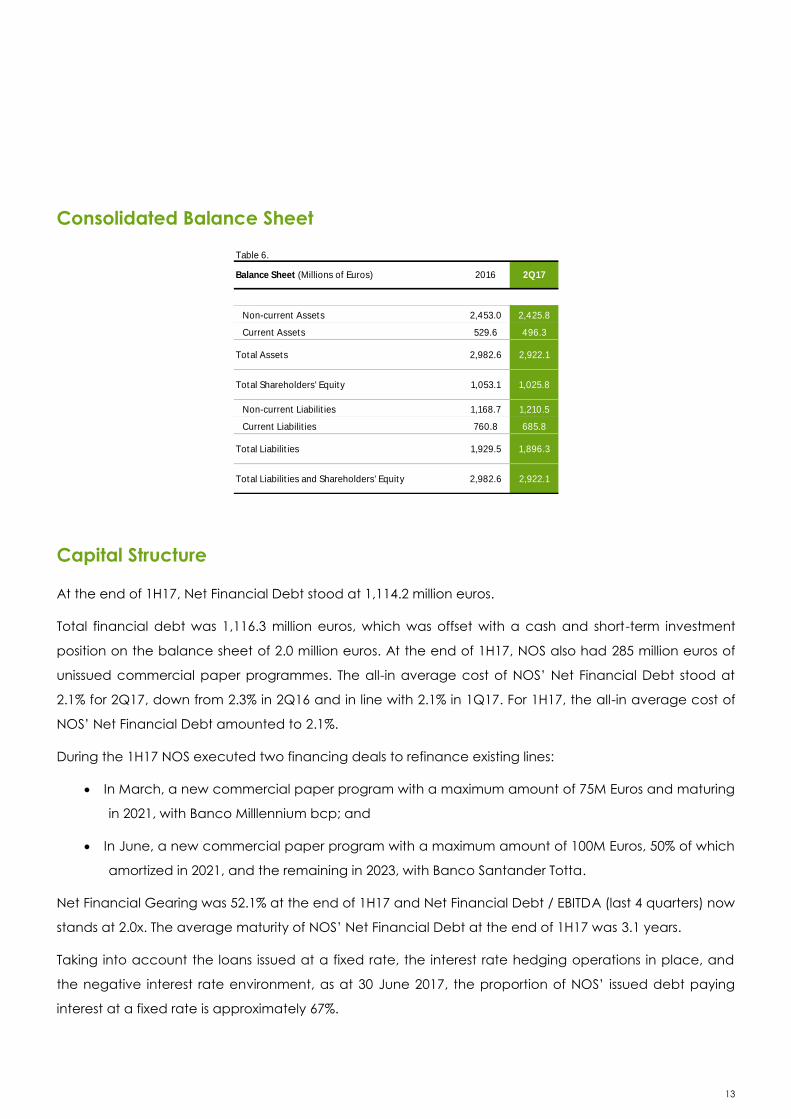
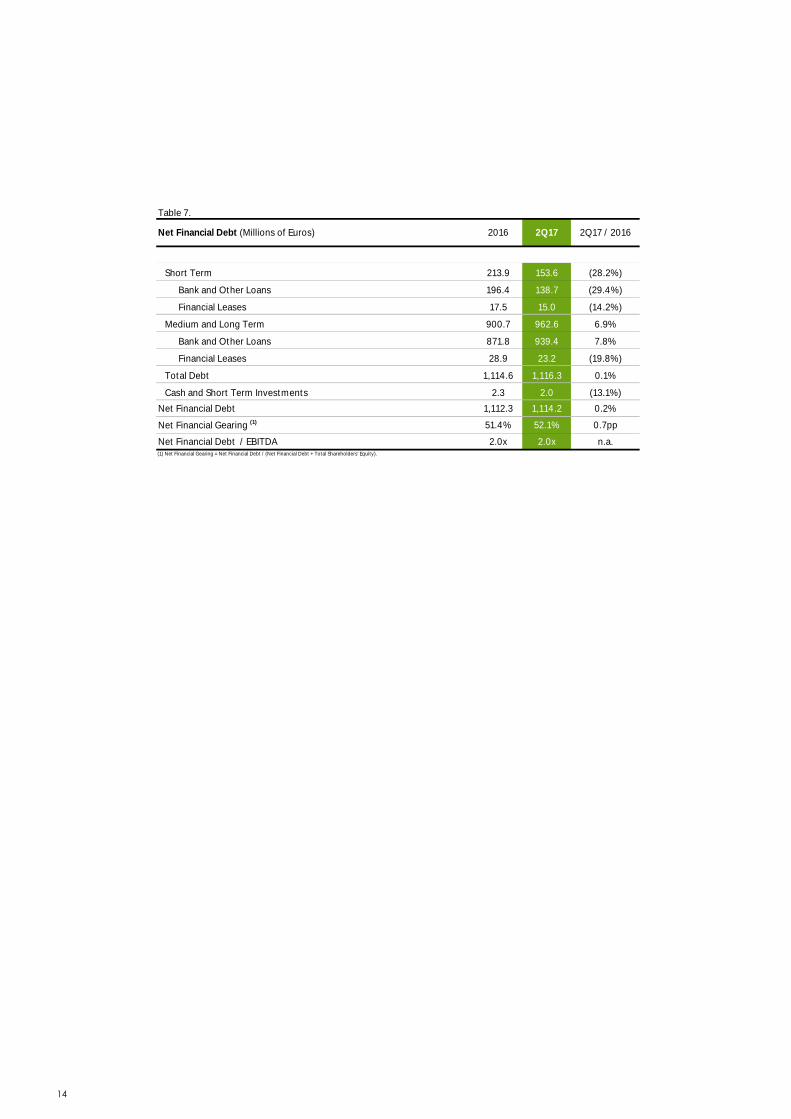
At the end of 1H17, Net Financial Debt stood at 1,114.2 million euros.
Total financial debt was 1,116.3 million euros, which was offset with a cash and short-term investment
position on the balance sheet of 2.0 million euros. At the end of 1H17, NOS also had 285 million euros of
unissued commercial paper programmes. The all-in average cost of NOS’ Net Financial Debt stood at
2.1% for 2Q17, down from 2.3% in 2Q16 and in line with 2.1% in 1Q17. For 1H17, the all-in average cost of
NOS’ Net Financial Debt amounted to 2.1%.
During the 1H17 NOS executed two financing deals to refinance existing lines:
In March, a new commercial paper program with a maximum amount of 75M Euros and maturing
in 2021, with Banco Milllennium bcp; and
In June, a new commercial paper program with a maximum amount of 100M Euros, 50% of which
amortized in 2021, and the remaining in 2023, with Banco Santander Totta.
Net Financial Gearing was 52.1% at the end of 1H17 and Net Financial Debt / EBITDA (last 4 quarters) now
stands at 2.0x. The average maturity of NOS’ Net Financial Debt at the end of 1H17 was 3.1 years.
Taking into account the loans issued at a fixed rate, the interest rate hedging operations in place, and
the negative interest rate environment, as at 30 June 2017, the proportion of NOS’ issued debt paying
interest at a fixed rate is approximately 67%.
14
Table 7.
Short Term 213.9 153.6 (28.2%)
Bank and Other Loans 196.4 138.7 (29.4%)
Financial Leases 17.5 15.0 (14.2%)
Medium and Long Term 900.7 962.6 6.9%
Bank and Other Loans 871.8 939.4 7.8%
Financial Leases 28.9 23.2 (19.8%)
Total Debt 1,114.6 1,116.3 0.1%
Cash and Short Term Investments 2.3 2.0 (13.1%)
Net Financial Debt 1,112.3 1,114.2 0.2%
Net Financial Gearing (1) 51.4% 52.1% 0.7pp
Net Financial Debt / EBITDA 2.0x 2.0x n.a.(1) Net Financial Gearing = Net Financial Debt / (Net Financial Debt + Total Shareholders' Equity).
Net Financial Debt (Millions of Euros) 2016 2Q17 / 20162Q17
15
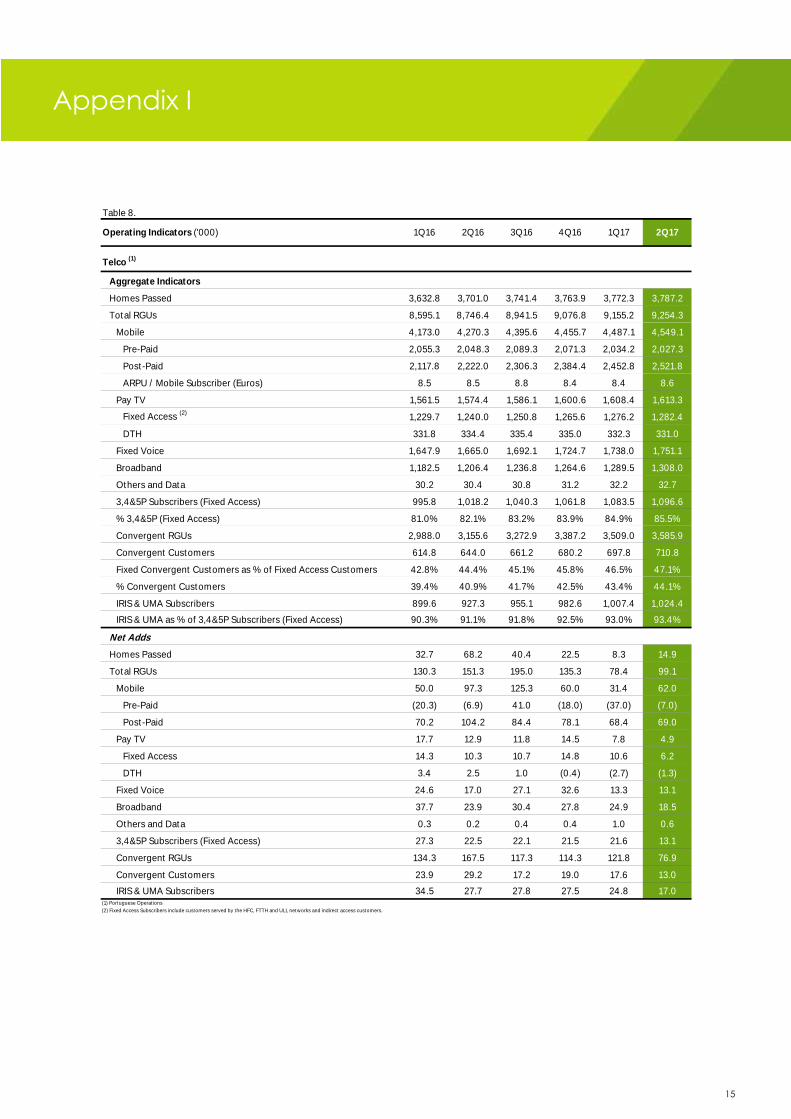
Table 8.
Telco (1)
Aggregate Indicators
Homes Passed 3,632.8 3,701.0 3,741.4 3,763.9 3,772.3 3,787.2
Total RGUs 8,595.1 8,746.4 8,941.5 9,076.8 9,155.2 9,254.3
Mobile 4,173.0 4,270.3 4,395.6 4,455.7 4,487.1 4,549.1
Pre-Paid 2,055.3 2,048.3 2,089.3 2,071.3 2,034.2 2,027.3
Post-Paid 2,117.8 2,222.0 2,306.3 2,384.4 2,452.8 2,521.8
ARPU / Mobile Subscriber (Euros) 8.5 8.5 8.8 8.4 8.4 8.6
Pay TV 1,561.5 1,574.4 1,586.1 1,600.6 1,608.4 1,613.3
Fixed Access (2)1,229.7 1,240.0 1,250.8 1,265.6 1,276.2 1,282.4
DTH 331.8 334.4 335.4 335.0 332.3 331.0
Fixed Voice 1,647.9 1,665.0 1,692.1 1,724.7 1,738.0 1,751.1
Broadband 1,182.5 1,206.4 1,236.8 1,264.6 1,289.5 1,308.0
Others and Data 30.2 30.4 30.8 31.2 32.2 32.7
3,4&5P Subscribers (Fixed Access) 995.8 1,018.2 1,040.3 1,061.8 1,083.5 1,096.6
% 3,4&5P (Fixed Access) 81.0% 82.1% 83.2% 83.9% 84.9% 85.5%
Convergent RGUs 2,988.0 3,155.6 3,272.9 3,387.2 3,509.0 3,585.9
Convergent Customers 614.8 644.0 661.2 680.2 697.8 710.8
Fixed Convergent Customers as % of Fixed Access Customers 42.8% 44.4% 45.1% 45.8% 46.5% 47.1%
% Convergent Customers 39.4% 40.9% 41.7% 42.5% 43.4% 44.1%
IRIS & UMA Subscribers 899.6 927.3 955.1 982.6 1,007.4 1,024.4
IRIS & UMA as % of 3,4&5P Subscribers (Fixed Access) 90.3% 91.1% 91.8% 92.5% 93.0% 93.4%
Net Adds
Homes Passed 32.7 68.2 40.4 22.5 8.3 14.9
Total RGUs 130.3 151.3 195.0 135.3 78.4 99.1
Mobile 50.0 97.3 125.3 60.0 31.4 62.0
Pre-Paid (20.3) (6.9) 41.0 (18.0) (37.0) (7.0)
Post-Paid 70.2 104.2 84.4 78.1 68.4 69.0
Pay TV 17.7 12.9 11.8 14.5 7.8 4.9
Fixed Access 14.3 10.3 10.7 14.8 10.6 6.2
DTH 3.4 2.5 1.0 (0.4) (2.7) (1.3)
Fixed Voice 24.6 17.0 27.1 32.6 13.3 13.1
Broadband 37.7 23.9 30.4 27.8 24.9 18.5
Others and Data 0.3 0.2 0.4 0.4 1.0 0.6
3,4&5P Subscribers (Fixed Access) 27.3 22.5 22.1 21.5 21.6 13.1
Convergent RGUs 134.3 167.5 117.3 114.3 121.8 76.9
Convergent Customers 23.9 29.2 17.2 19.0 17.6 13.0
IRIS & UMA Subscribers 34.5 27.7 27.8 27.5 24.8 17.0(1) Portuguese Operations
(2) Fixed Access Subscribers include customers served by the HFC, FTTH and ULL networks and indirect access customers.
Operating Indicators ('000) 2Q171Q174Q163Q162Q161Q16
Appendix I
16
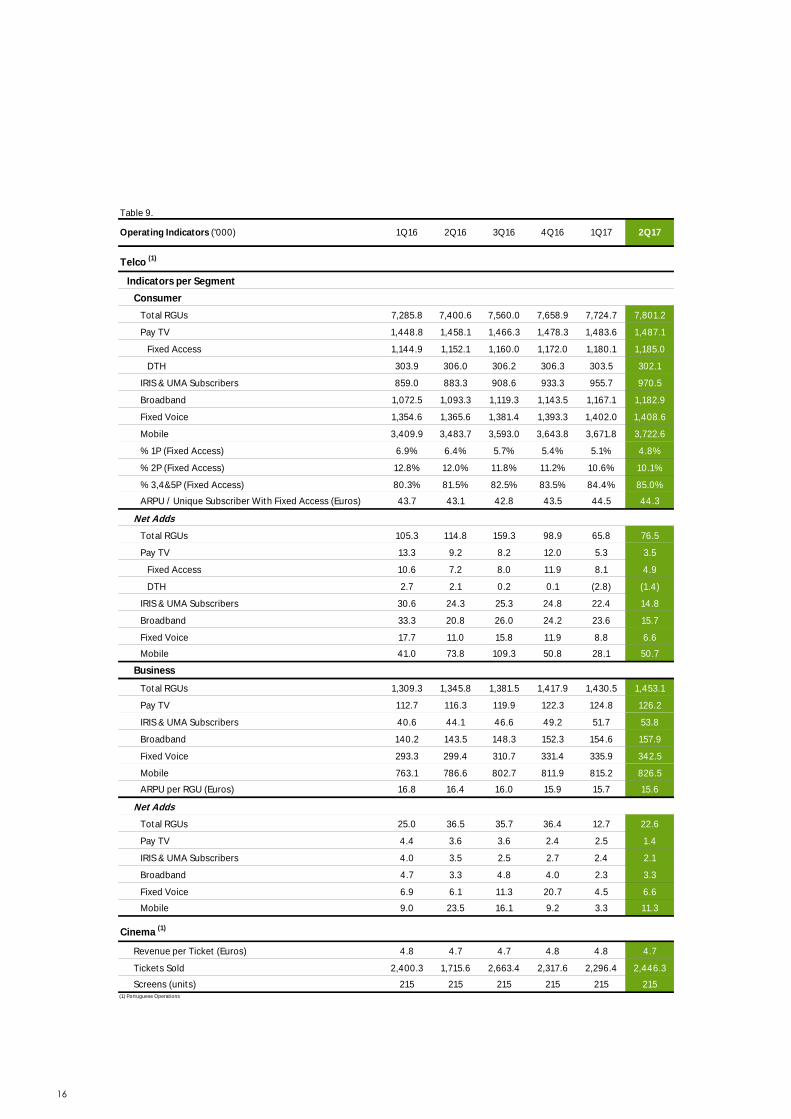
Table 9.
Telco (1)
Indicators per Segment
Consumer
Total RGUs 7,285.8 7,400.6 7,560.0 7,658.9 7,724.7 7,801.2
Pay TV 1,448.8 1,458.1 1,466.3 1,478.3 1,483.6 1,487.1
Fixed Access 1,144.9 1,152.1 1,160.0 1,172.0 1,180.1 1,185.0
DTH 303.9 306.0 306.2 306.3 303.5 302.1
IRIS & UMA Subscribers 859.0 883.3 908.6 933.3 955.7 970.5
Broadband 1,072.5 1,093.3 1,119.3 1,143.5 1,167.1 1,182.9
Fixed Voice 1,354.6 1,365.6 1,381.4 1,393.3 1,402.0 1,408.6
Mobile 3,409.9 3,483.7 3,593.0 3,643.8 3,671.8 3,722.6
% 1P (Fixed Access) 6.9% 6.4% 5.7% 5.4% 5.1% 4.8%
% 2P (Fixed Access) 12.8% 12.0% 11.8% 11.2% 10.6% 10.1%
% 3,4&5P (Fixed Access) 80.3% 81.5% 82.5% 83.5% 84.4% 85.0%
ARPU / Unique Subscriber With Fixed Access (Euros) 43.7 43.1 42.8 43.5 44.5 44.3
Net Adds
Total RGUs 105.3 114.8 159.3 98.9 65.8 76.5
Pay TV 13.3 9.2 8.2 12.0 5.3 3.5
Fixed Access 10.6 7.2 8.0 11.9 8.1 4.9
DTH 2.7 2.1 0.2 0.1 (2.8) (1.4)
IRIS & UMA Subscribers 30.6 24.3 25.3 24.8 22.4 14.8
Broadband 33.3 20.8 26.0 24.2 23.6 15.7
Fixed Voice 17.7 11.0 15.8 11.9 8.8 6.6
Mobile 41.0 73.8 109.3 50.8 28.1 50.7
Business
Total RGUs 1,309.3 1,345.8 1,381.5 1,417.9 1,430.5 1,453.1
Pay TV 112.7 116.3 119.9 122.3 124.8 126.2
IRIS & UMA Subscribers 40.6 44.1 46.6 49.2 51.7 53.8
Broadband 140.2 143.5 148.3 152.3 154.6 157.9
Fixed Voice 293.3 299.4 310.7 331.4 335.9 342.5
Mobile 763.1 786.6 802.7 811.9 815.2 826.5
ARPU per RGU (Euros) 16.8 16.4 16.0 15.9 15.7 15.6
Net Adds
Total RGUs 25.0 36.5 35.7 36.4 12.7 22.6
Pay TV 4.4 3.6 3.6 2.4 2.5 1.4
IRIS & UMA Subscribers 4.0 3.5 2.5 2.7 2.4 2.1
Broadband 4.7 3.3 4.8 4.0 2.3 3.3
Fixed Voice 6.9 6.1 11.3 20.7 4.5 6.6
Mobile 9.0 23.5 16.1 9.2 3.3 11.3
Cinema (1)
Revenue per Ticket (Euros) 4.8 4.7 4.7 4.8 4.8 4.7
Tickets Sold 2,400.3 1,715.6 2,663.4 2,317.6 2,296.4 2,446.3
Screens (units) 215 215 215 215 215 215(1) Portuguese Operations
2Q171Q174Q163Q16Operating Indicators ('000) 2Q161Q16
17
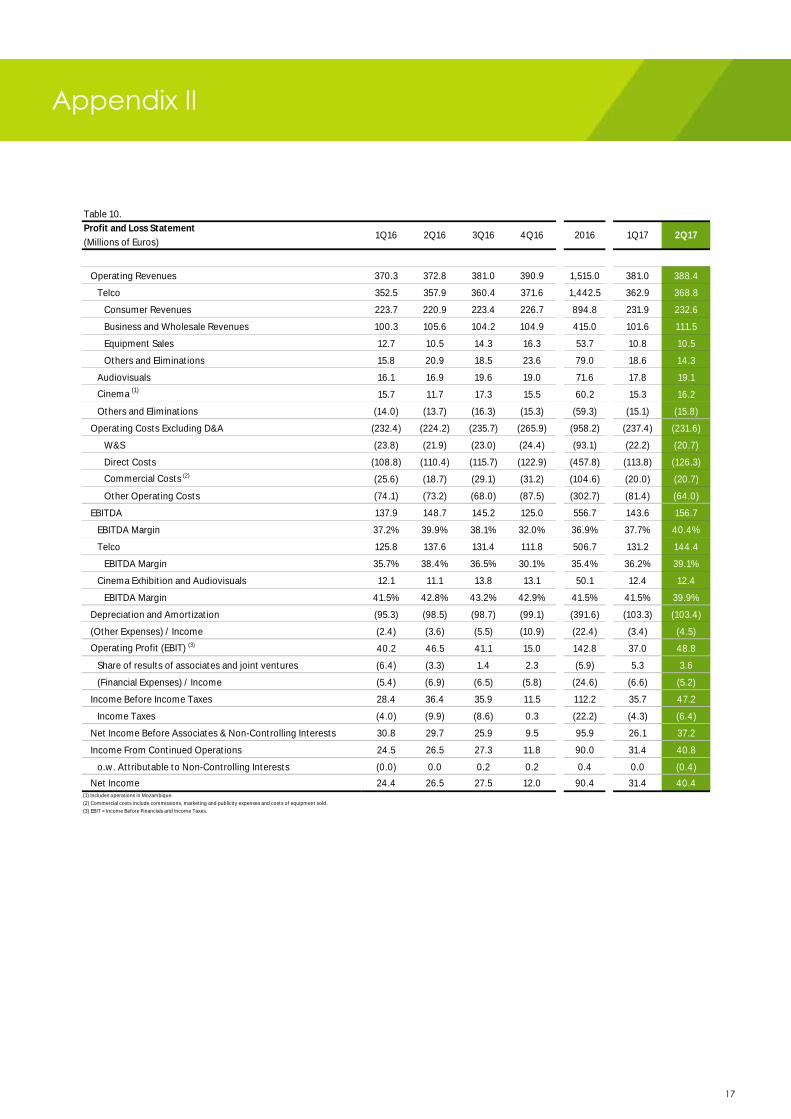
Table 10.
Operating Revenues 370.3 372.8 381.0 390.9 1,515.0 381.0 388.4
Telco 352.5 357.9 360.4 371.6 1,442.5 362.9 368.8
Consumer Revenues 223.7 220.9 223.4 226.7 894.8 231.9 232.6
Business and Wholesale Revenues 100.3 105.6 104.2 104.9 415.0 101.6 111.5
Equipment Sales 12.7 10.5 14.3 16.3 53.7 10.8 10.5
Others and Eliminations 15.8 20.9 18.5 23.6 79.0 18.6 14.3
Audiovisuals 16.1 16.9 19.6 19.0 71.6 17.8 19.1
Cinema (1)15.7 11.7 17.3 15.5 60.2 15.3 16.2
Others and Eliminations (14.0) (13.7) (16.3) (15.3) (59.3) (15.1) (15.8)
Operating Costs Excluding D&A (232.4) (224.2) (235.7) (265.9) (958.2) (237.4) (231.6)
W&S (23.8) (21.9) (23.0) (24.4) (93.1) (22.2) (20.7)
Direct Costs (108.8) (110.4) (115.7) (122.9) (457.8) (113.8) (126.3)
Commercial Costs (2) (25.6) (18.7) (29.1) (31.2) (104.6) (20.0) (20.7)
Other Operating Costs (74.1) (73.2) (68.0) (87.5) (302.7) (81.4) (64.0)
EBITDA 137.9 148.7 145.2 125.0 556.7 143.6 156.7
EBITDA Margin 37.2% 39.9% 38.1% 32.0% 36.9% 37.7% 40.4%
Telco 125.8 137.6 131.4 111.8 506.7 131.2 144.4
EBITDA Margin 35.7% 38.4% 36.5% 30.1% 35.4% 36.2% 39.1%
Cinema Exhibition and Audiovisuals 12.1 11.1 13.8 13.1 50.1 12.4 12.4
EBITDA Margin 41.5% 42.8% 43.2% 42.9% 41.5% 41.5% 39.9%
Depreciation and Amortization (95.3) (98.5) (98.7) (99.1) (391.6) (103.3) (103.4)
(Other Expenses) / Income (2.4) (3.6) (5.5) (10.9) (22.4) (3.4) (4.5)
Operating Profit (EBIT) (3) 40.2 46.5 41.1 15.0 142.8 37.0 48.8
Share of results of associates and joint ventures (6.4) (3.3) 1.4 2.3 (5.9) 5.3 3.6
(Financial Expenses) / Income (5.4) (6.9) (6.5) (5.8) (24.6) (6.6) (5.2)
Income Before Income Taxes 28.4 36.4 35.9 11.5 112.2 35.7 47.2
Income Taxes (4.0) (9.9) (8.6) 0.3 (22.2) (4.3) (6.4)
Net Income Before Associates & Non-Controlling Interests 30.8 29.7 25.9 9.5 95.9 26.1 37.2
Income From Continued Operations 24.5 26.5 27.3 11.8 90.0 31.4 40.8
o.w. Attributable to Non-Controlling Interests (0.0) 0.0 0.2 0.2 0.4 0.0 (0.4)
Net Income 24.4 26.5 27.5 12.0 90.4 31.4 40.4(1) Includes operations in Mozambique.
(2) Commercial costs include commissions, marketing and publicity expenses and costs of equipment sold.
(3) EBIT = Income Before Financials and Income Taxes.
Profit and Loss Statement
(Millions of Euros)1Q16 2Q174Q16 20163Q162Q16 1Q17
Appendix II
18
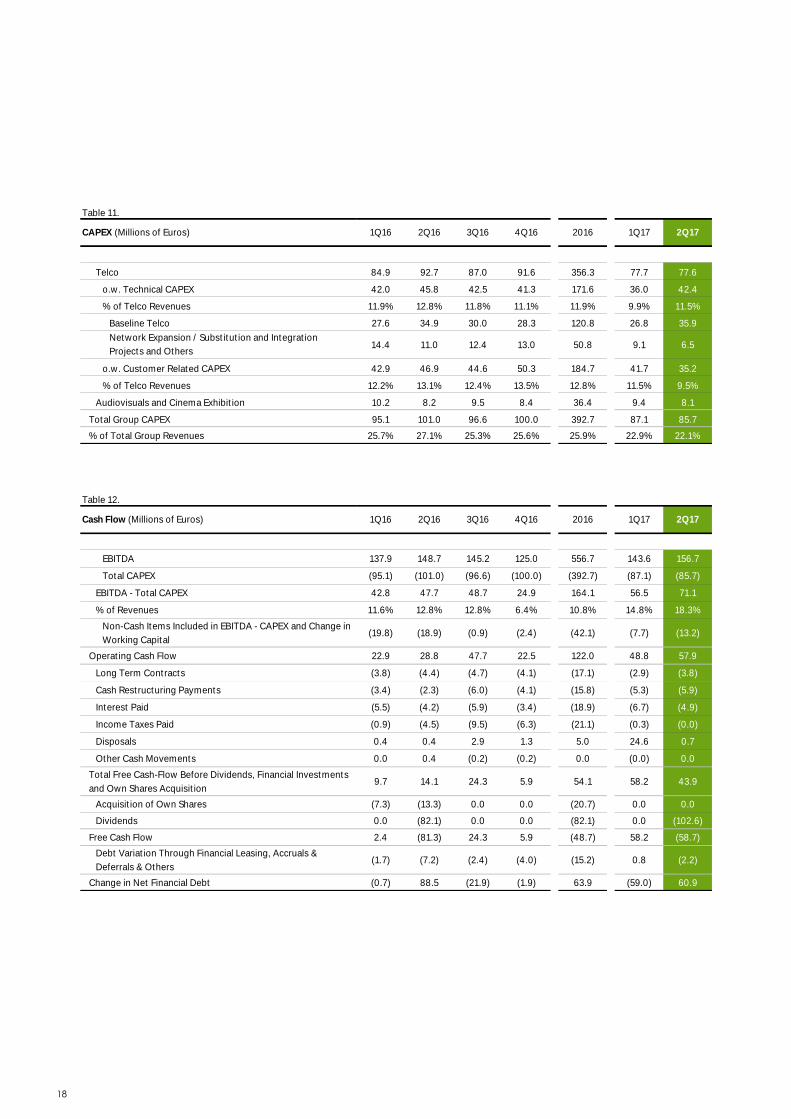
Table 11.
Telco 84.9 92.7 87.0 91.6 356.3 77.7 77.6
o.w. Technical CAPEX 42.0 45.8 42.5 41.3 171.6 36.0 42.4
% of Telco Revenues 11.9% 12.8% 11.8% 11.1% 11.9% 9.9% 11.5%
Baseline Telco 27.6 34.9 30.0 28.3 120.8 26.8 35.9
Network Expansion / Substitution and Integration
Projects and Others14.4 11.0 12.4 13.0 50.8 9.1 6.5
o.w. Customer Related CAPEX 42.9 46.9 44.6 50.3 184.7 41.7 35.2
% of Telco Revenues 12.2% 13.1% 12.4% 13.5% 12.8% 11.5% 9.5%
Audiovisuals and Cinema Exhibition 10.2 8.2 9.5 8.4 36.4 9.4 8.1
Total Group CAPEX 95.1 101.0 96.6 100.0 392.7 87.1 85.7
% of Total Group Revenues 25.7% 27.1% 25.3% 25.6% 25.9% 22.9% 22.1%
CAPEX (Millions of Euros) 1Q16 2Q172Q16 3Q16 4Q16 2016 1Q17
Table 12.
EBITDA 137.9 148.7 145.2 125.0 556.7 143.6 156.7
Total CAPEX (95.1) (101.0) (96.6) (100.0) (392.7) (87.1) (85.7)
EBITDA - Total CAPEX 42.8 47.7 48.7 24.9 164.1 56.5 71.1
% of Revenues 11.6% 12.8% 12.8% 6.4% 10.8% 14.8% 18.3%
Non-Cash Items Included in EBITDA - CAPEX and Change in
Working Capital (19.8) (18.9) (0.9) (2.4) (42.1) (7.7) (13.2)
Operating Cash Flow 22.9 28.8 47.7 22.5 122.0 48.8 57.9
Long Term Contracts (3.8) (4.4) (4.7) (4.1) (17.1) (2.9) (3.8)
Cash Restructuring Payments (3.4) (2.3) (6.0) (4.1) (15.8) (5.3) (5.9)
Interest Paid (5.5) (4.2) (5.9) (3.4) (18.9) (6.7) (4.9)
Income Taxes Paid (0.9) (4.5) (9.5) (6.3) (21.1) (0.3) (0.0)
Disposals 0.4 0.4 2.9 1.3 5.0 24.6 0.7
Other Cash Movements 0.0 0.4 (0.2) (0.2) 0.0 (0.0) 0.0
Total Free Cash-Flow Before Dividends, Financial Investments
and Own Shares Acquisition9.7 14.1 24.3 5.9 54.1 58.2 43.9
Acquisition of Own Shares (7.3) (13.3) 0.0 0.0 (20.7) 0.0 0.0
Dividends 0.0 (82.1) 0.0 0.0 (82.1) 0.0 (102.6)
Free Cash Flow 2.4 (81.3) 24.3 5.9 (48.7) 58.2 (58.7)
Debt Variation Through Financial Leasing, Accruals &
Deferrals & Others(1.7) (7.2) (2.4) (4.0) (15.2) 0.8 (2.2)
Change in Net Financial Debt (0.7) 88.5 (21.9) (1.9) 63.9 (59.0) 60.9
2Q1720162Q16 3Q16Cash Flow (Millions of Euros) 1Q16 4Q16 1Q17
19
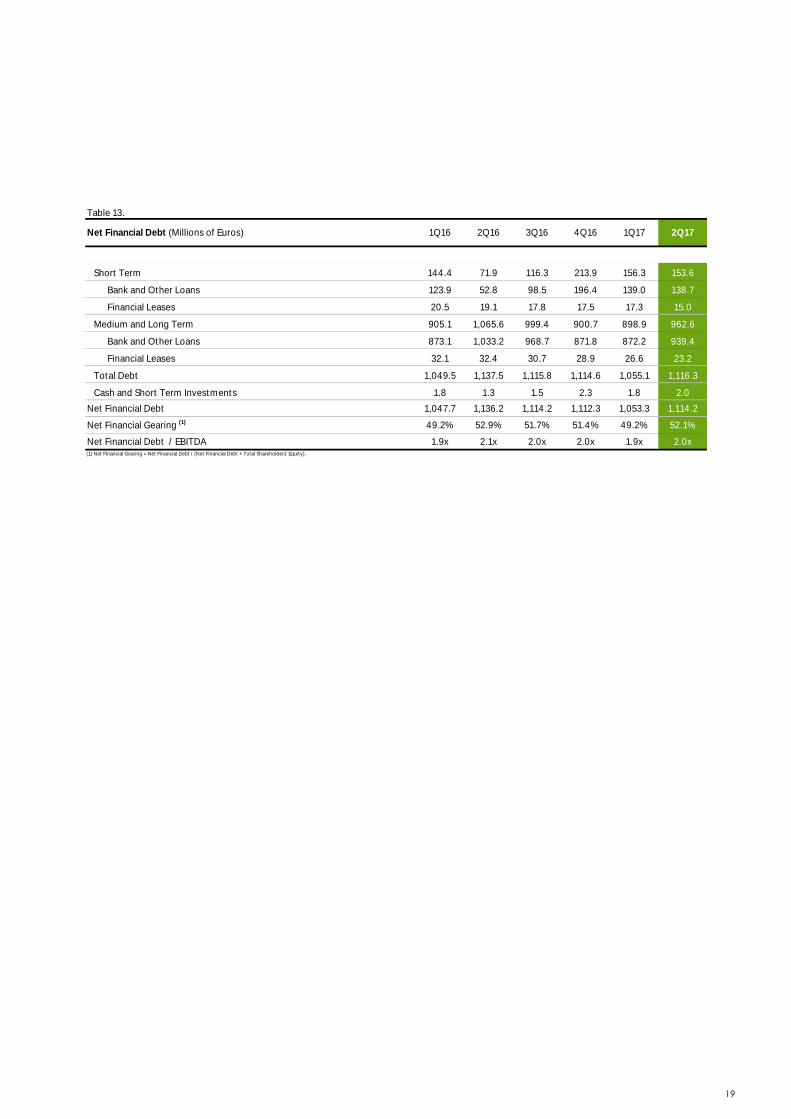
Table 13.
Short Term 144.4 71.9 116.3 213.9 156.3 153.6
Bank and Other Loans 123.9 52.8 98.5 196.4 139.0 138.7
Financial Leases 20.5 19.1 17.8 17.5 17.3 15.0
Medium and Long Term 905.1 1,065.6 999.4 900.7 898.9 962.6
Bank and Other Loans 873.1 1,033.2 968.7 871.8 872.2 939.4
Financial Leases 32.1 32.4 30.7 28.9 26.6 23.2
Total Debt 1,049.5 1,137.5 1,115.8 1,114.6 1,055.1 1,116.3
Cash and Short Term Investments 1.8 1.3 1.5 2.3 1.8 2.0
Net Financial Debt 1,047.7 1,136.2 1,114.2 1,112.3 1,053.3 1,114.2
Net Financial Gearing (1) 49.2% 52.9% 51.7% 51.4% 49.2% 52.1%
Net Financial Debt / EBITDA 1.9x 2.1x 2.0x 2.0x 1.9x 2.0x
2Q17Net Financial Debt (Millions of Euros) 4Q16 1Q17
(1) Net Financial Gearing = Net Financial Debt / (Net Financial Debt + Total Shareholders' Equity).
1Q16 2Q16 3Q16
20
This presentation contains forward looking information, including statements which constitute forward
looking statements within the meaning of the U.S. Private Securities Litigation Reform Act of 1995. These
statements are based on the current beliefs and assumptions of our management and on information
available to management only as of the date such statements were made. Forward-looking statements
include: (a) information concerning strategy, possible or assumed future results of our operations,
earnings, industry conditions, demand and pricing for our products and other aspects of our business,
possible or future payment of dividends and share buyback program; and (b) statements that are
preceded by, followed by or include the words “believes”, “expects”, “anticipates”, “intends”, “is
confident”, “plans”, “estimates”, “may”, “might”, “could”, “would”, and the negatives of such terms or
similar expressions. These statements are not guarantees of future performance and are subject to factors,
risks and uncertainties that could cause the assumptions and beliefs upon which the forwarding looking
statements were based to substantially differ from the expectation predicted herein. These factors, risks
and uncertainties include, but are not limited to, changes in demand for the company’s services,
technological changes, the effects of competition, telecommunications sector conditions, changes in
regulation and economic conditions. Further, certain forward looking statements are based upon
assumptions as to future events that may not prove to be accurate. Therefore, actual outcomes and
results may differ materially from the plans, strategy, objectives, expectations, estimates and intentions
expressed or implied in such forward-looking statements. Forward-looking statements speak only as of the
date they are made, and we do not undertake any obligation to update them in light of new
information or future developments or to provide reasons why actual results may differ. You are
cautioned not to place undue reliance on any forward-looking statements. NOS is exempt from filing
periodic reports with the United States Securities and Exchange Commission (“SEC”) pursuant to Rule
12g3-2(b) under the Securities Exchange Act of 1934, as amended. Under this exemption, NOS is required
to post on its website English language translations of certain information that it has made or is required
to make public in Portugal, has filed or is required to file with the regulated market Eurolist by Euronext
Lisbon or has distributed or is required to distribute to its security holders. This document is not an offer to
sell or a solicitation of an offer to buy any securities.
Disclaimer
21
Chief Financial Officer: José Pedro Pereira da Costa
Phone: (+351) 21 799 88 19
Analysts/Investors: Maria João Carrapato
Phone: (+351) 21 782 47 25 / E-mail: [email protected]
Press: Isabel Borgas / Irene Luis
Phone: (+351) 21 782 48 07 / E-mail: [email protected]
Enquiries
Conference call scheduled for 12.00 (GMT+1) on 21 July 2017
Conference ID: 50691608
Portugal Dial-in: +351 800 812 040
Standard International Dial-In: +44 (0) 207 192 80 00
UK Dial-in: +44 (0) 800 376 79 22
US Dial-in: +1 866 966 13 96
Encore Replay Access #: 50691608
International Encore Dial In: +44 1452 550 000

22
Rua Ator António Silva, 9
1600-404 Lisboa
Portugal