2q17 quarterly supplement - wells fargowells fargo 2q17 supplement 1 2q17 highlights wells fargo net...
TRANSCRIPT

2Q17 Quarterly Supplement
July 14, 2017
© 2017 Wells Fargo & Company. All rights reserved.
Table of contents
2Q17 Results 2Q17 Highlights Page 2 Year-over-year results 3
Balance Sheet and credit overview (linked quarter) 4 Income Statement overview (linked quarter) 5
Loans 6
Commercial loan trends 7 Consumer loan trends 8
Deposits 9Net interest income 10 Noninterest income 11 Trading-related net interest income & noninterest income 12 Noninterest expense and efficiency ratio 13 Noninterest expense analysis (reference for slides 15 &16)14
Noninterest expense – linked quarter 15 Noninterest expense – year over year 16
Targeting $2 billion expense reduction by YE18 17-18 Community Banking 19 Community Banking metrics 20-21 Wholesale Banking 22 Wealth and Investment Management 23 Credit quality 24
Capital 25
2Q17 Summary 26
Appendix Real estate 1-4 family mortgage portfolio 28 Consumer credit card portfolio 29
Auto portfolios 30
Student lending portfolio 31
Common Equity Tier 1 (Fully Phased-In) 32
Return on average tangible common equity (ROTCE) 33
Forward-looking statements and additional information 34
Final financial results and other disclosures will be reported in our Quarterly Report on Form 10-Q for the quarter ended June 30, 2017, and may differ materially from the results and disclosures in this document due to, among other things, the completion of final review procedures, the occurrence of subsequent events, or the discovery of additional information.
Wells Fargo 2Q17 Supplement 1
2Q17 Highlights
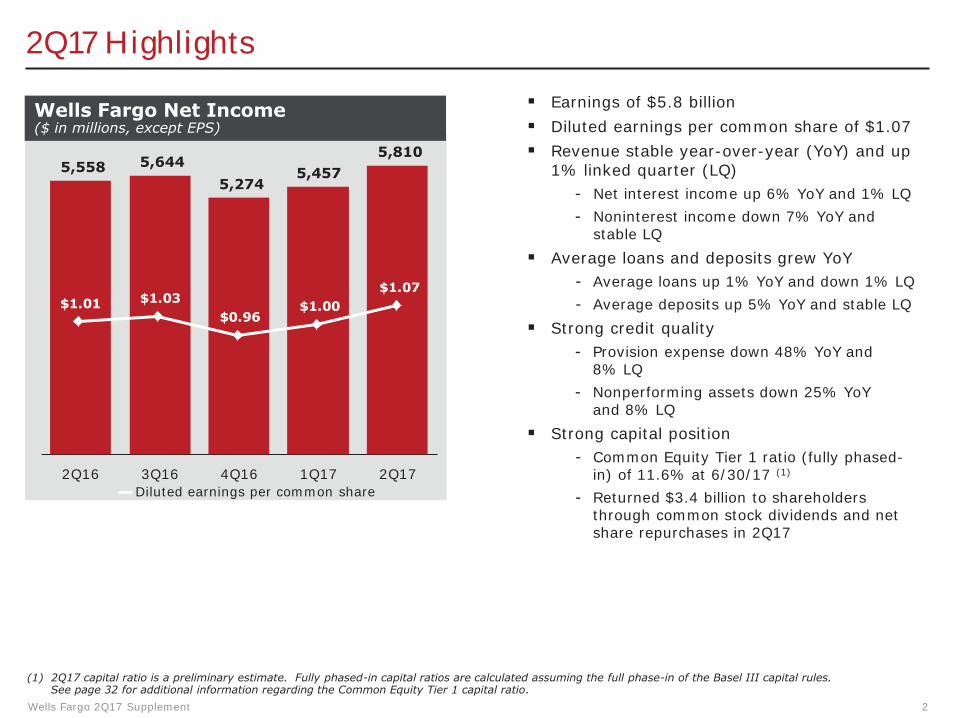
Wells Fargo Net Income ($ in millions, except EPS)
5,810 5,6445,558
$1.03
5,457
$1.01
5,274
$1.07
$0.96 $1.00
2Q16 3Q16 4Q16 1Q17 2Q17 Diluted earnings per common share
� Earnings of $5.8 billion � Diluted earnings per common share of $1.07 � Revenue stable year-over-year (YoY) and up
1% linked quarter (LQ) - Net interest income up 6% YoY and 1% LQ - Noninterest income down 7% YoY and
stable LQ � Average loans and deposits grew YoY
- Average loans up 1% YoY and down 1% LQ - Average deposits up 5% YoY and stable LQ
� Strong credit quality - Provision expense down 48% YoY and
8% LQ - Nonperforming assets down 25% YoY
and 8% LQ � Strong capital position
- Common Equity Tier 1 ratio (fully phased-in) of 11.6% at 6/30/17 (1)
- Returned $3.4 billion to shareholders through common stock dividends and net share repurchases in 2Q17
(1) 2Q17 capital ratio is a preliminary estimate. Fully phased-in capital ratios are calculated assuming the full phase-in of the Basel III capital rules. See page 32 for additional information regarding the Common Equity Tier 1 capital ratio.
Wells Fargo 2Q17 Supplement 2
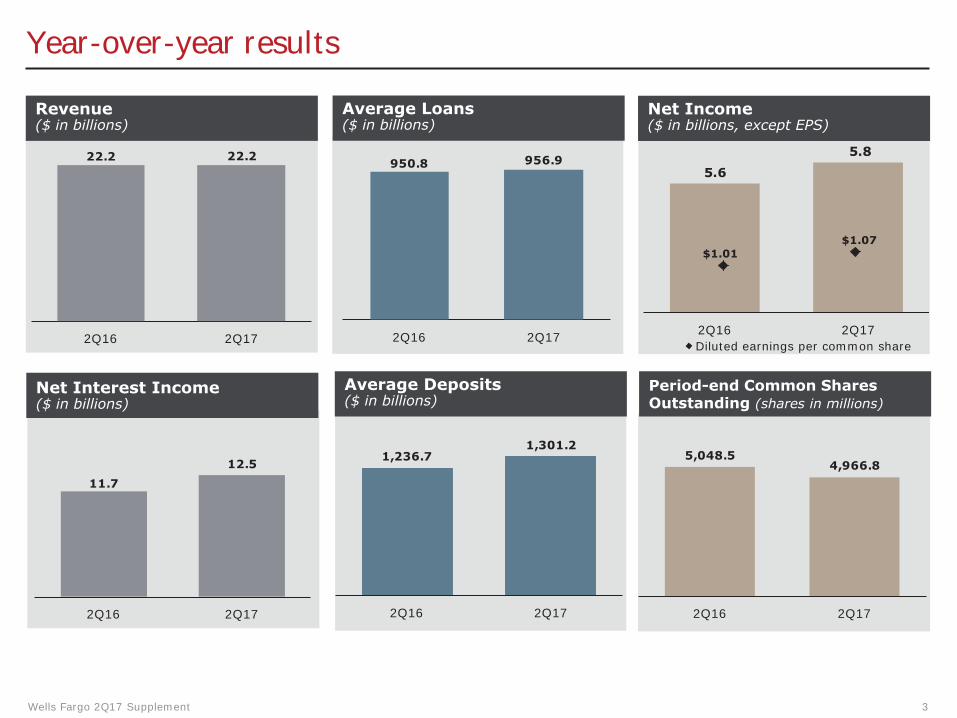
Year-over-year results
Net Income ($ in billions, except EPS)
Revenue ($ in billions)
Average Loans ($ in billions)
22.2 22.2 956.9 950.8
2Q16 2Q17 2Q16 2Q17
5.6 5.8
2Q16 2Q17 Diluted earnings per common share
$1.01 $1.07
Average DepositsNet Interest Income ($ in billions)($ in billions)
1,301.2 5,048.5 1,236.7 12.5 4,966.8
11.7
2Q16 2Q17 2Q16 2Q17 2Q16 2Q17
Wells Fargo 2Q17 Supplement 3
Period-end Common Shares Outstanding (shares in millions)
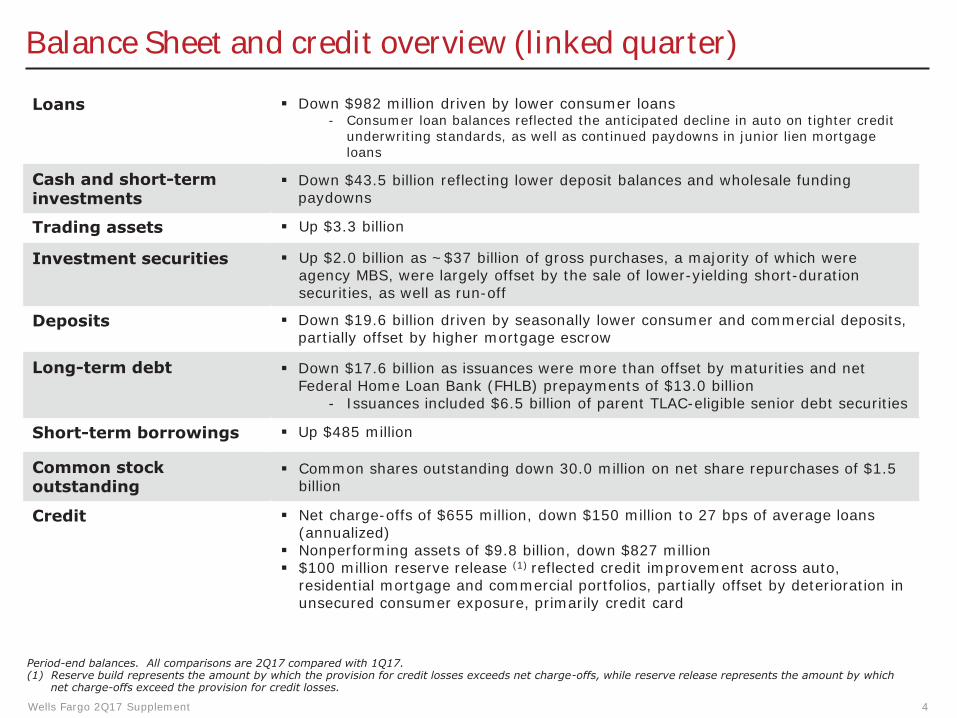
Balance Sheet and credit overview (linked quarter)
Loans
Cash and short-term investments
Trading assets
� Down $43.5 billion reflecting lower deposit balances and wholesale funding paydowns
� Down $982 million driven by lower consumer loans - Consumer loan balances reflected the anticipated decline in auto on tighter credit
underwriting standards, as well as continued paydowns in junior lien mortgage loans
� Up $3.3 billion
� Up $2.0 billion as ~$37 billion of gross purchases, a majority of which were agency MBS, were largely offset by the sale of lower-yielding short-duration securities, as well as run-off
Investment securities
� Down $19.6 billion driven by seasonally lower consumer and commercial deposits, partially offset by higher mortgage escrow
Deposits
Long-term debt � Down $17.6 billion as issuances were more than offset by maturities and net Federal Home Loan Bank (FHLB) prepayments of $13.0 billion
- Issuances included $6.5 billion of parent TLAC-eligible senior debt securities
� Up $485 million Short-term borrowings
Common stock � Common shares outstanding down 30.0 million on net share repurchases of $1.5 billion outstanding
� Net charge-offs of $655 million, down $150 million to 27 bps of average loans (annualized)
Credit
� Nonperforming assets of $9.8 billion, down $827 million � $100 million reserve release (1) reflected credit improvement across auto,
residential mortgage and commercial portfolios, partially offset by deterioration in unsecured consumer exposure, primarily credit card
Period-end balances. All comparisons are 2Q17 compared with 1Q17. (1) Reserve build represents the amount by which the provision for credit losses exceeds net charge-offs, while reserve release represents the amount by which
net charge-offs exceed the provision for credit losses.
Wells Fargo 2Q17 Supplement 4
Income Statement overview (linked quarter)
Net interest income
Noninterest income
Noncontrolling interest (reduces net income)
Noninterest expense
Income tax expense
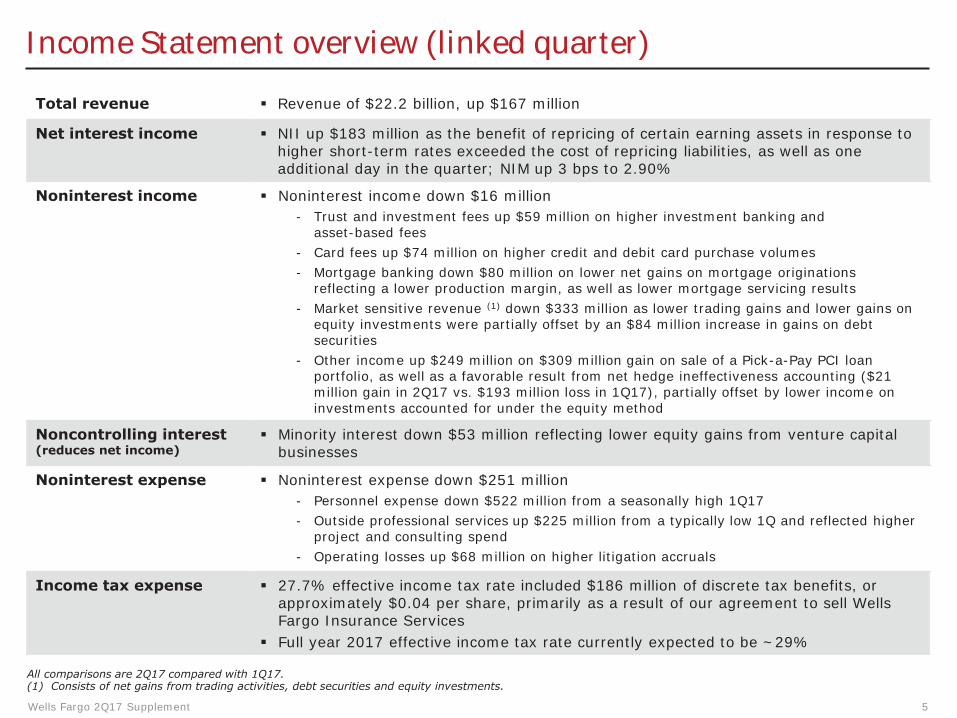
� Noninterest expense down $251 million - Personnel expense down $522 million from a seasonally high 1Q17 - Outside professional services up $225 million from a typically low 1Q and reflected higher
project and consulting spend - Operating losses up $68 million on higher litigation accruals
� 27.7% effective income tax rate included $186 million of discrete tax benefits, or approximately $0.04 per share, primarily as a result of our agreement to sell Wells Fargo Insurance Services
� Full year 2017 effective income tax rate currently expected to be ~29%
Total revenue � Revenue of $22.2 billion, up $167 million
� NII up $183 million as the benefit of repricing of certain earning assets in response to higher short-term rates exceeded the cost of repricing liabilities, as well as one additional day in the quarter; NIM up 3 bps to 2.90%
� Noninterest income down $16 million - Trust and investment fees up $59 million on higher investment banking and
asset-based fees - Card fees up $74 million on higher credit and debit card purchase volumes - Mortgage banking down $80 million on lower net gains on mortgage originations
reflecting a lower production margin, as well as lower mortgage servicing results - Market sensitive revenue (1) down $333 million as lower trading gains and lower gains on
equity investments were partially offset by an $84 million increase in gains on debt securities
- Other income up $249 million on $309 million gain on sale of a Pick-a-Pay PCI loan portfolio, as well as a favorable result from net hedge ineffectiveness accounting ($21 million gain in 2Q17 vs. $193 million loss in 1Q17), partially offset by lower income on investments accounted for under the equity method
� Minority interest down $53 million reflecting lower equity gains from venture capital businesses
All comparisons are 2Q17 compared with 1Q17. (1) Consists of net gains from trading activities, debt securities and equity investments.
Wells Fargo 2Q17 Supplement 5
Loans
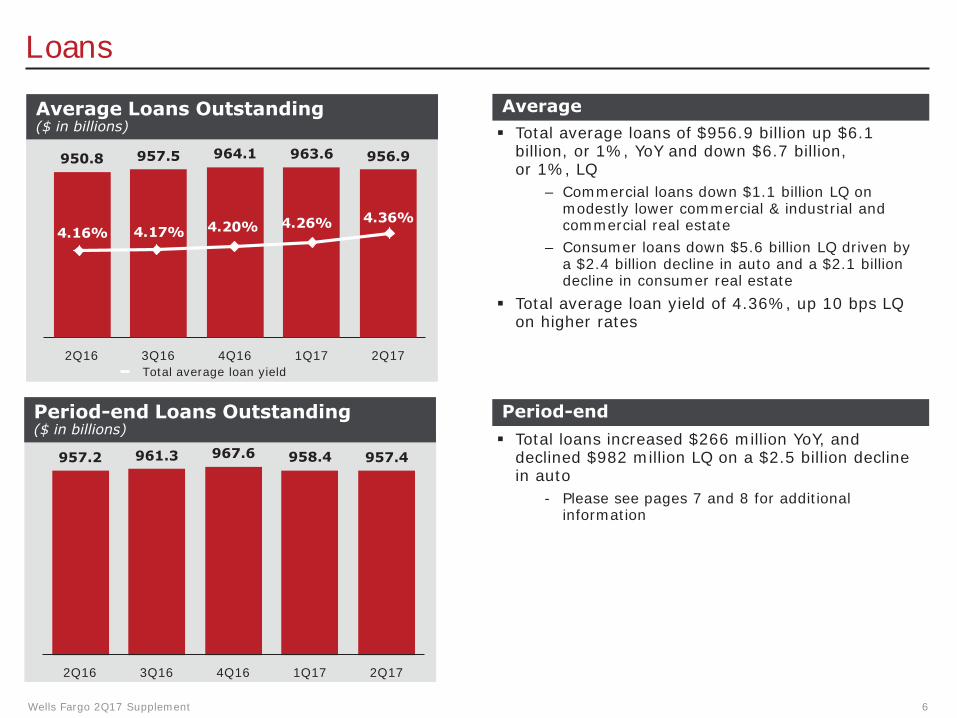
Average Loans Outstanding ($ in billions)
Average
964.1 963.6 950.8 957.5 956.9
4.16% 4.17% 4.20% 4.26% 4.36%
2Q16 3Q16 4Q16 1Q17 2Q17 Total average loan yield
Period-end Loans Outstanding ($ in billions)
967.6957.2 961.3 958.4 957.4
� Total average loans of $956.9 billion up $6.1 billion, or 1%, YoY and down $6.7 billion, or 1%, LQ
– Commercial loans down $1.1 billion LQ on modestly lower commercial & industrial and commercial real estate
– Consumer loans down $5.6 billion LQ driven by a $2.4 billion decline in auto and a $2.1 billion decline in consumer real estate
� Total average loan yield of 4.36%, up 10 bps LQ on higher rates
� Total loans increased $266 million YoY, and declined $982 million LQ on a $2.5 billion decline in auto
- Please see pages 7 and 8 for additional information
2Q16 3Q16 4Q16 1Q17 2Q17
Wells Fargo 2Q17 Supplement 6
Period-end
Commercial loan trends
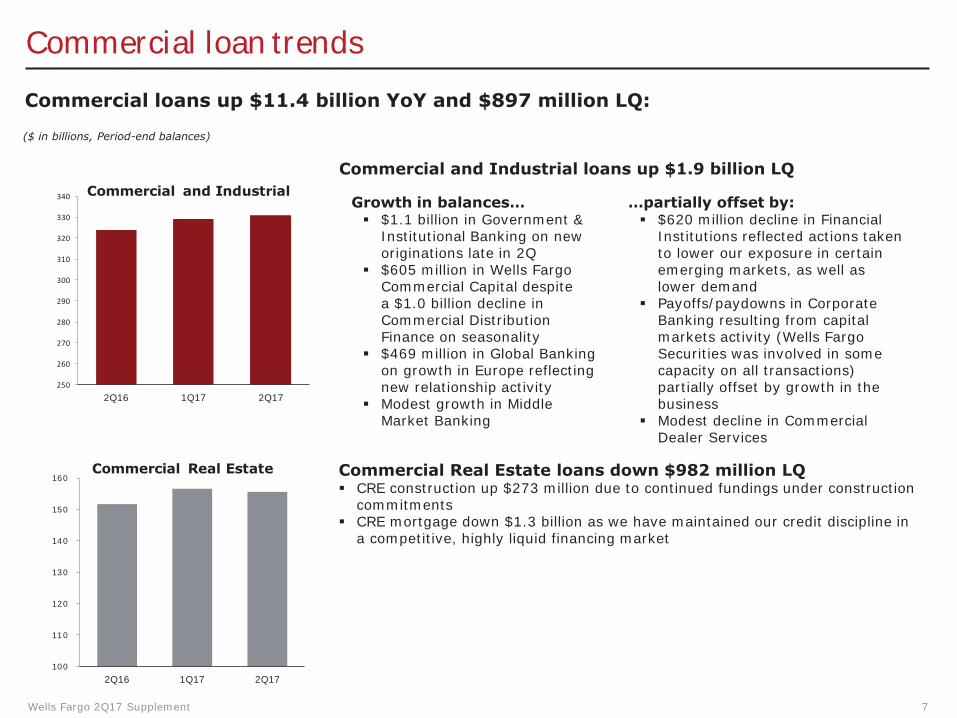
Commercial loans up $11.4 billion YoY and $897 million LQ:
($ in billions, Period-end balances)
Commercial and Industrial loans up $1.9 billion LQ 340
330
320
310
300
290
280
270
260
250
160
150
140
130
120
110
100
2Q16 1Q17 2Q17
Commercial and Industrial Growth in balances… � $1.1 billion in Government &
Institutional Banking on new originations late in 2Q
� $605 million in Wells Fargo Commercial Capital despite a $1.0 billion decline in Commercial Distribution Finance on seasonality
� $469 million in Global Banking on growth in Europe reflecting new relationship activity
� Modest growth in Middle Market Banking
…partially offset by: � $620 million decline in Financial
Institutions reflected actions taken to lower our exposure in certain emerging markets, as well as lower demand
� Payoffs/paydowns in Corporate Banking resulting from capital markets activity (Wells Fargo Securities was involved in some capacity on all transactions) partially offset by growth in the business
� Modest decline in Commercial Dealer Services
2Q16 1Q17 2Q17
Commercial Real Estate Commercial Real Estate loans down $982 million LQ � CRE construction up $273 million due to continued fundings under construction
commitments � CRE mortgage down $1.3 billion as we have maintained our credit discipline in
a competitive, highly liquid financing market
Wells Fargo 2Q17 Supplement 7
Consumer loan trends
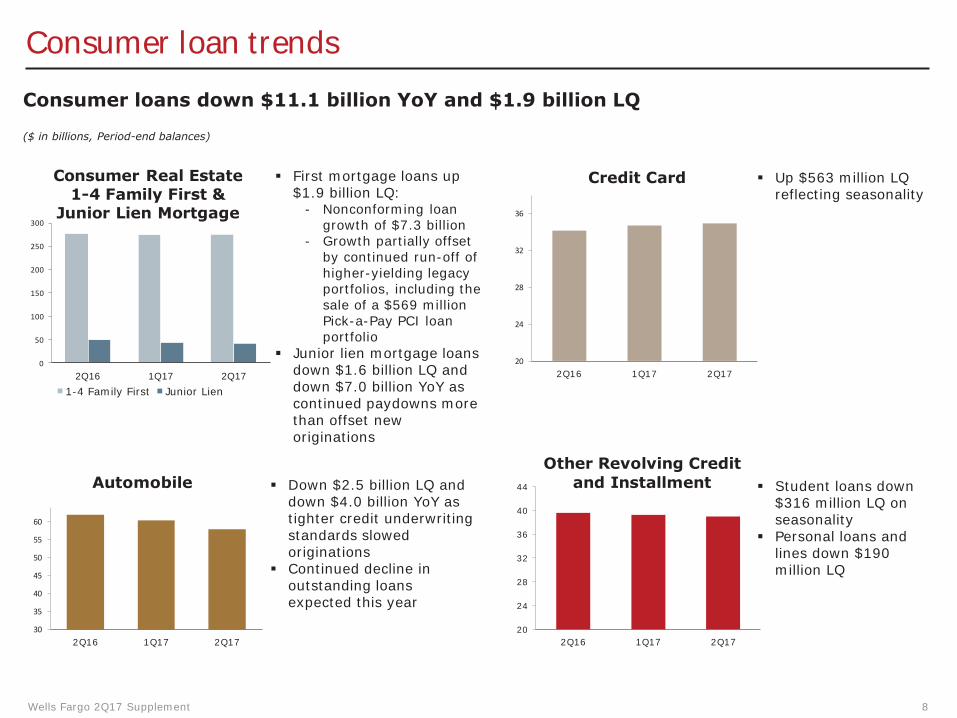
Consumer loans down $11.1 billion YoY and $1.9 billion LQ
($ in billions, Period-end balances)
300
250
200
150
100
50
0
60
55
50
45
40
35
30
Consumer Real Estate � First mortgage loans up 1-4 Family First & $1.9 billion LQ:
- Nonconforming loan 36Junior Lien Mortgage growth of $7.3 billion
- Growth partially offset by continued run-off of 32
higher-yielding legacy portfolios, including the 28
sale of a $569 million Pick-a-Pay PCI loan 24
portfolio � Junior lien mortgage loans
20down $1.6 billion LQ and 2Q16 1Q17 2Q17 down $7.0 billion YoY as 1-4 Family First Junior Lien continued paydowns more than offset new originations
Automobile � Down $2.5 billion LQ and 44
down $4.0 billion YoY as tighter credit underwriting 40
standards slowed 36
originations 32 � Continued decline in
outstanding loans 28
expected this year 24
20 2Q16 1Q17 2Q17
Credit Card � Up $563 million LQ reflecting seasonality
2Q16 1Q17 2Q17
Other Revolving Credit and Installment � Student loans down
$316 million LQ on seasonality
� Personal loans and lines down $190 million LQ
2Q16 1Q17 2Q17
Wells Fargo 2Q17 Supplement 8
Deposits
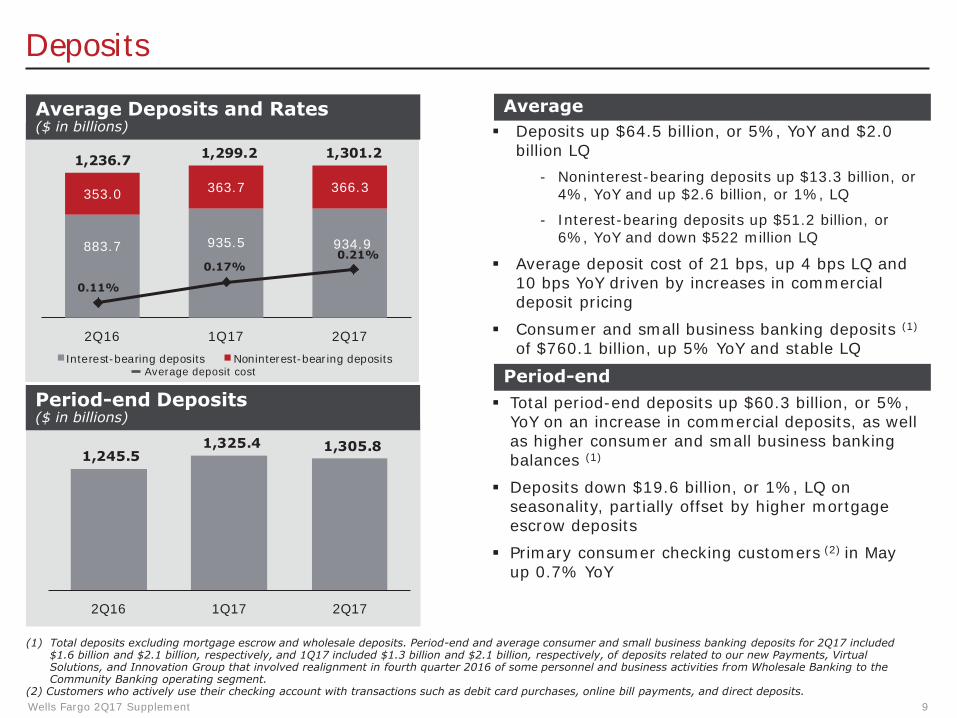
Average Deposits and Rates ($ in billions)
Average
1,299.2 1,301.2 1,236.7
883.7 935.5 934.9
353.0 363.7 366.3
0.11%
0.17% 0.21%
2Q16 1Q17 2Q17 Interest-bearing deposits Noninterest-bearing deposits
Average deposit cost
1,245.5 1,325.4 1,305.8
2Q16 1Q17 2Q17
Period-end Deposits($ in billions)
� Deposits up $64.5 billion, or 5%, YoY and $2.0 billion LQ
- Noninterest-bearing deposits up $13.3 billion, or 4%, YoY and up $2.6 billion, or 1%, LQ
- Interest-bearing deposits up $51.2 billion, or 6%, YoY and down $522 million LQ
� Average deposit cost of 21 bps, up 4 bps LQ and 10 bps YoY driven by increases in commercial deposit pricing
� Consumer and small business banking deposits (1)
of $760.1 billion, up 5% YoY and stable LQ
� Total period-end deposits up $60.3 billion, or 5%, YoY on an increase in commercial deposits, as well as higher consumer and small business banking balances (1)
� Deposits down $19.6 billion, or 1%, LQ on seasonality, partially offset by higher mortgage escrow deposits
� Primary consumer checking customers (2) in May up 0.7% YoY
(1) Total deposits excluding mortgage escrow and wholesale deposits. Period-end and average consumer and small business banking deposits for 2Q17 included $1.6 billion and $2.1 billion, respectively, and 1Q17 included $1.3 billion and $2.1 billion, respectively, of deposits related to our new Payments, Virtual Solutions, and Innovation Group that involved realignment in fourth quarter 2016 of some personnel and business activities from Wholesale Banking to the Community Banking operating segment.
(2) Customers who actively use their checking account with transactions such as debit card purchases, online bill payments, and direct deposits. Wells Fargo 2Q17 Supplement 9
Period-end
Net interest income
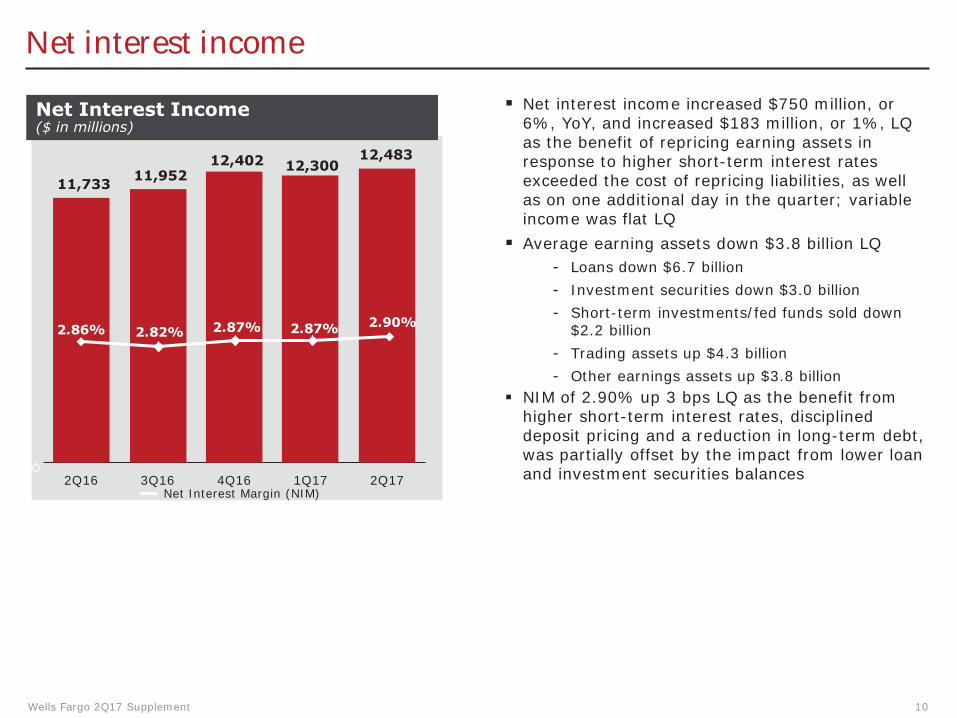
Net Interest Income ($ in millions)
2.86% 2.82%
12,483 12,402
2.87%
12,300 11,952 11,733
2.87% 2.90%
2Q16 3Q16 4Q16 1Q17 2Q17 Net Interest Margin (NIM)
� Net interest income increased $750 million, or 6%, YoY, and increased $183 million, or 1%, LQ as the benefit of repricing earning assets in response to higher short-term interest rates exceeded the cost of repricing liabilities, as well as on one additional day in the quarter; variable income was flat LQ � Average earning assets down $3.8 billion LQ
- Loans down $6.7 billion - Investment securities down $3.0 billion - Short-term investments/fed funds sold down
$2.2 billion - Trading assets up $4.3 billion - Other earnings assets up $3.8 billion
� NIM of 2.90% up 3 bps LQ as the benefit from higher short-term interest rates, disciplined deposit pricing and a reduction in long-term debt, was partially offset by the impact from lower loan and investment securities balances
Wells Fargo 2Q17 Supplement 10
Noninterest income
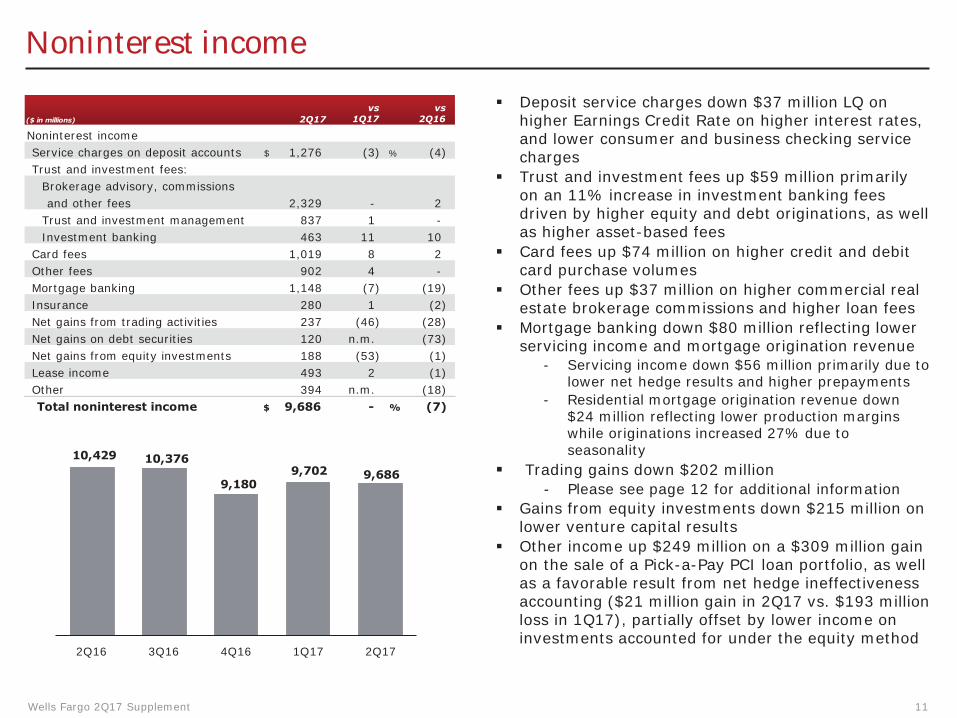
� Deposit service charges down $37 million LQ on
Noninterest income Service charges on deposit accounts Trust and investment fees:
$ 1,276 (3) % (4)
�
�
higher Earnings Credit Rate on higher interest rates, and lower consumer and business checking service charges Trust and investment fees up $59 million primarily on an 11% increase in investment banking fees driven by higher equity and debt originations, as well as higher asset-based fees Card fees up $74 million on higher credit and debit card purchase volumes
�
�
Other fees up $37 million on higher commercial real estate brokerage commissions and higher loan fees Mortgage banking down $80 million reflecting lower servicing income and mortgage origination revenue
- Servicing income down $56 million primarily due to lower net hedge results and higher prepayments
- Residential mortgage origination revenue down $24 million reflecting lower production margins while originations increased 27% due to
10,429 10,376 �
seasonality Trading gains down $202 million
- Please see page 12 for additional information � Gains from equity investments down $215 million on
lower venture capital results � Other income up $249 million on a $309 million gain
on the sale of a Pick-a-Pay PCI loan portfolio, as well as a favorable result from net hedge ineffectiveness accounting ($21 million gain in 2Q17 vs. $193 million loss in 1Q17), partially offset by lower income on
2Q16 3Q16 4Q16 1Q17 2Q17 investments accounted for under the equity method
Wells Fargo 2Q17 Supplement 11
($ in millions) 2Q17 vs
1Q17 vs
2Q16
Brokerage advisory, commissions and other fees 2,329 - 2
Trust and investment management 837 1 -Investment banking 463 11 10
Card fees 1,019 8 2 Other fees 902 4 -Mortgage banking 1,148 (7) (19) Insurance 280 1 (2) Net gains from trading activities 237 (46) (28) Net gains on debt securities 120 n.m. (73) Net gains from equity investments 188 (53) (1) Lease income 493 2 (1) Other 394 n.m. (18) Total noninterest income $ 9,686 - % (7)
9,180 9,702 9,686
-
Trading-related net interest income and noninterest income
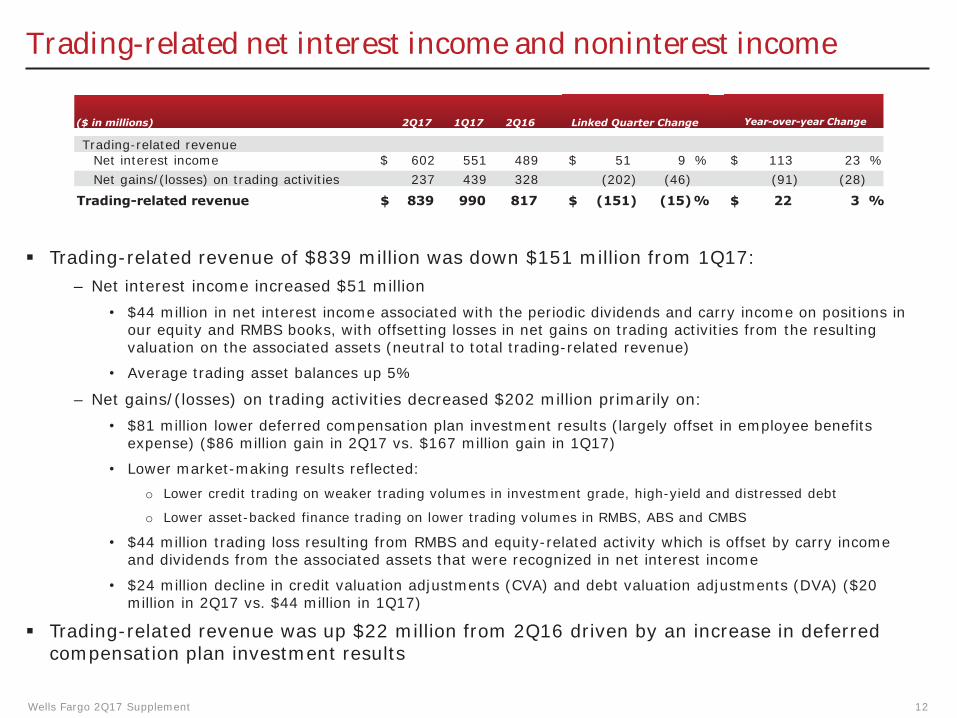
($ in millions) 2Q17 1Q17 2Q16
Trading-related revenue
Linked Quarter Change
Net interest income $ 602 551 489 $ 51 9 % $ 113 23 % Net gains/(losses) on trading activities 237 439 328 (202) (46) (91) (28)
Trading-related revenue $ 839 990 817 $ (151) (15) % $ 22 3 %
� Trading-related revenue of $839 million was down $151 million from 1Q17: – Net interest income increased $51 million
• $44 million in net interest income associated with the periodic dividends and carry income on positions in our equity and RMBS books, with offsetting losses in net gains on trading activities from the resulting valuation on the associated assets (neutral to total trading-related revenue)
• Average trading asset balances up 5%
– Net gains/(losses) on trading activities decreased $202 million primarily on: • $81 million lower deferred compensation plan investment results (largely offset in employee benefits
expense) ($86 million gain in 2Q17 vs. $167 million gain in 1Q17)
• Lower market-making results reflected: o Lower credit trading on weaker trading volumes in investment grade, high-yield and distressed debt
o Lower asset-backed finance trading on lower trading volumes in RMBS, ABS and CMBS
• $44 million trading loss resulting from RMBS and equity-related activity which is offset by carry income and dividends from the associated assets that were recognized in net interest income
• $24 million decline in credit valuation adjustments (CVA) and debt valuation adjustments (DVA) ($20 million in 2Q17 vs. $44 million in 1Q17)
� Trading-related revenue was up $22 million from 2Q16 driven by an increase in deferred compensation plan investment results
Wells Fargo 2Q17 Supplement 12
Year-over-year Change
Noninterest expense and efficiency ratio (1)
($ in millions) 2Q17 vs
1Q17 vs
2Q16
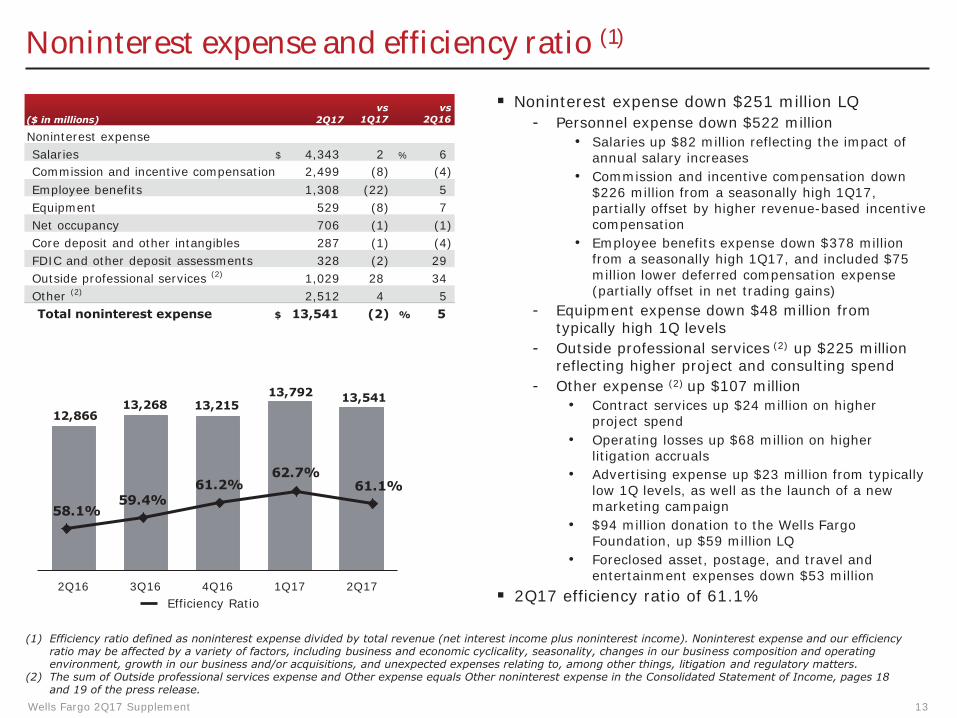
Noninterest expense Salaries $ 4,343 2 % 6 Commission and incentive compensation 2,499 (8) (4) Employee benefits 1,308 (22) 5 Equipment 529 (8) 7 Net occupancy 706 (1) (1) Core deposit and other intangibles 287 (1) (4) FDIC and other deposit assessments 328 (2) 29 Outside professional services (2) 1,029 28 34 Other (2) 2,512 4 5 Total noninterest expense $ 13,541 (2) % 5
13,792 13,541
Efficiency Ratio
12,866 13,268 13,215
2Q16 3Q16 4Q16 1Q17 2Q17
58.1% 59.4%
61.2% 62.7%
61.1%
� Noninterest expense down $251 million LQ - Personnel expense down $522 million
• Salaries up $82 million reflecting the impact of annual salary increases
• Commission and incentive compensation down $226 million from a seasonally high 1Q17, partially offset by higher revenue-based incentive compensation
• Employee benefits expense down $378 million from a seasonally high 1Q17, and included $75 million lower deferred compensation expense (partially offset in net trading gains)
- Equipment expense down $48 million from typically high 1Q levels
- Outside professional services (2) up $225 million reflecting higher project and consulting spend
- Other expense (2) up $107 million • Contract services up $24 million on higher
project spend • Operating losses up $68 million on higher
litigation accruals • Advertising expense up $23 million from typically
low 1Q levels, as well as the launch of a new marketing campaign
• $94 million donation to the Wells Fargo Foundation, up $59 million LQ
• Foreclosed asset, postage, and travel and entertainment expenses down $53 million
� 2Q17 efficiency ratio of 61.1%
(1) Efficiency ratio defined as noninterest expense divided by total revenue (net interest income plus noninterest income). Noninterest expense and our efficiency ratio may be affected by a variety of factors, including business and economic cyclicality, seasonality, changes in our business composition and operating environment, growth in our business and/or acquisitions, and unexpected expenses relating to, among other things, litigation and regulatory matters.
(2) The sum of Outside professional services expense and Other expense equals Other noninterest expense in the Consolidated Statement of Income, pages 18 and 19 of the press release.
Wells Fargo 2Q17 Supplement 13
Noninterest expense analysis (reference for slides 15 and 16)
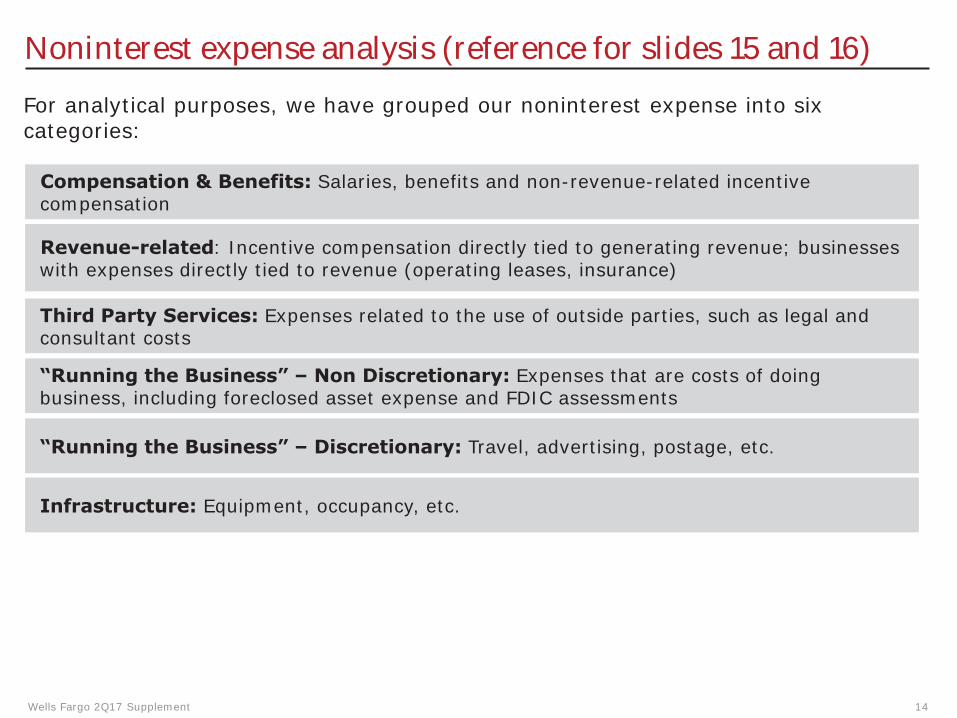
For analytical purposes, we have grouped our noninterest expense into six categories:
Compensation & Benefits: Salaries, benefits and non-revenue-related incentive compensation
Revenue-related: Incentive compensation directly tied to generating revenue; businesses with expenses directly tied to revenue (operating leases, insurance)
Third Party Services: Expenses related to the use of outside parties, such as legal and consultant costs
“Running the Business” – Non Discretionary: Expenses that are costs of doing business, including foreclosed asset expense and FDIC assessments
“Running the Business” – Discretionary: Travel, advertising, postage, etc.
Infrastructure: Equipment, occupancy, etc.
Wells Fargo 2Q17 Supplement 14
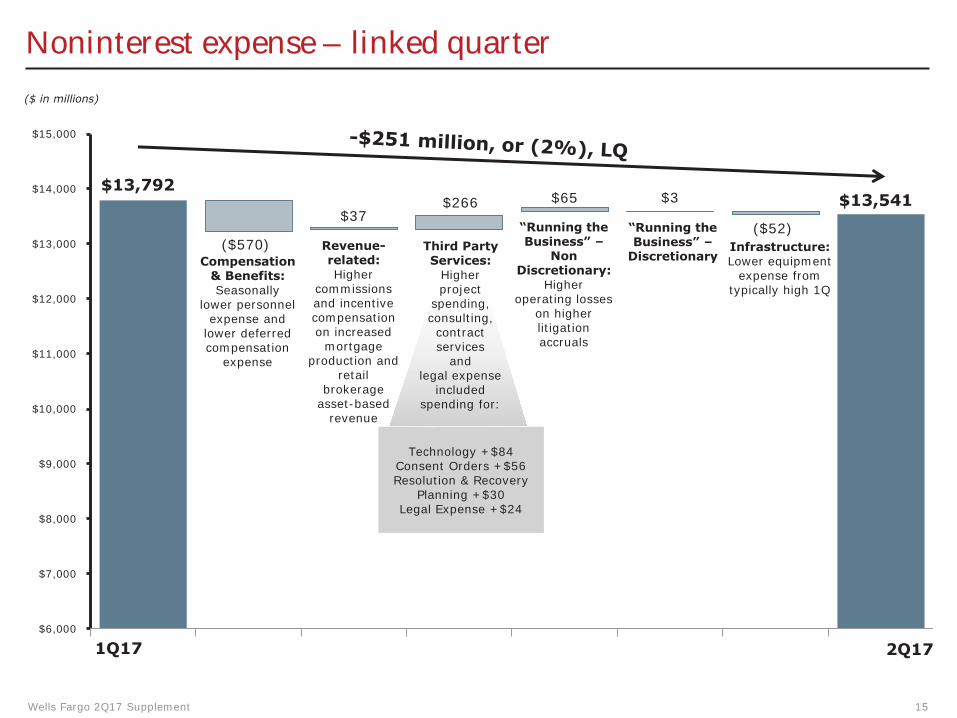
Noninterest expense – linked quarter
($ in millions)
$15,000
$13,792$14,000
$37
$13,000 ($570) Revenue-Compensation related:
& Benefits: Higher Seasonally commissions
$12,000 lower personnel and incentive expense and compensation
lower deferred on increased compensation mortgage $11,000
expense production and retail
brokerage asset-based $10,000
revenue
$9,000
$8,000
$7,000
$6,000
project spending, consulting, contract services
and legal expense
included spending for:
Technology +$84 Consent Orders +$56 Resolution & Recovery
Planning +$30 Legal Expense +$24
$266
Third Party Services:
Higher
$65 $3 $13,541 “Running the “Running the ($52)Business” – Business” – Infrastructure:
Non Discretionary Lower equipment Discretionary: expense from
Higher typically high 1Q operating losses
on higher litigation accruals
1Q17 2Q17
Wells Fargo 2Q17 Supplement 15
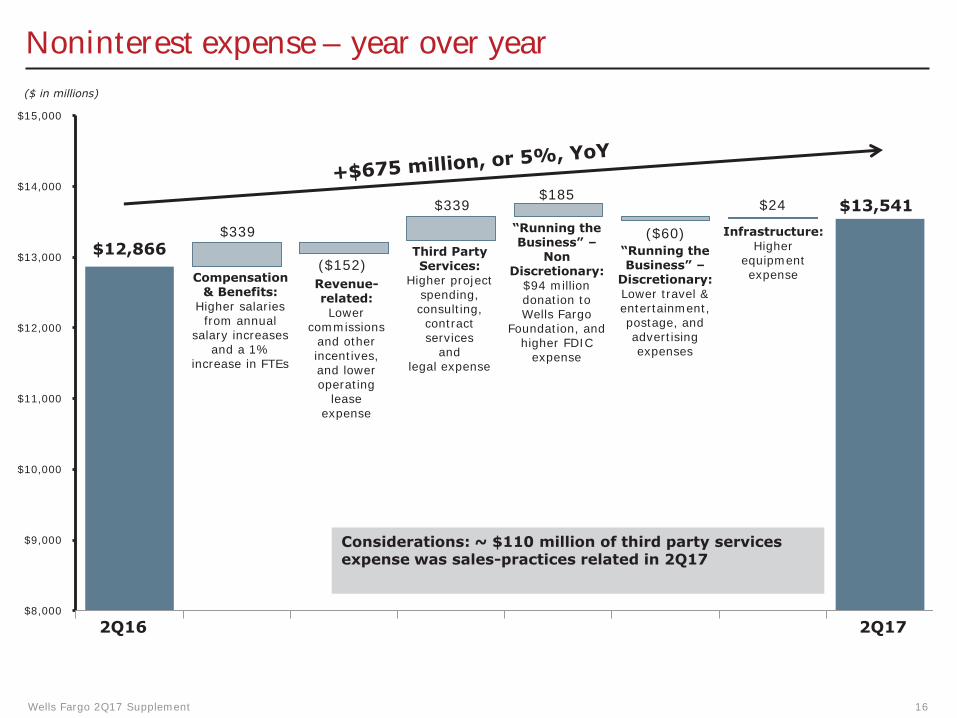
Noninterest expense – year over year ($ in millions)
$15,000
$14,000
$13,000
$12,000
$11,000
$10,000
$9,000
$8,000
$185$339 $24 $13,541
“Running the Infrastructure: $339 ($60)Business” – Higher $12,866 Third Party “Running the Non equipment ($152) Services: Business” – Discretionary: expense Compensation Higher project Discretionary: Revenue- $94 million& Benefits: spending, Lower travel & related: donation to Higher salaries consulting, entertainment, Lower Wells Fargo from annual contract postage, and commissions Foundation, and salary increases services advertising and other higher FDIC and a 1% and expenses incentives, expense increase in FTEs legal expense and lower
operating lease
expense
Considerations: ~ $110 million of third party services expense was sales-practices related in 2Q17
2Q16 2Q17
Wells Fargo 2Q17 Supplement 16
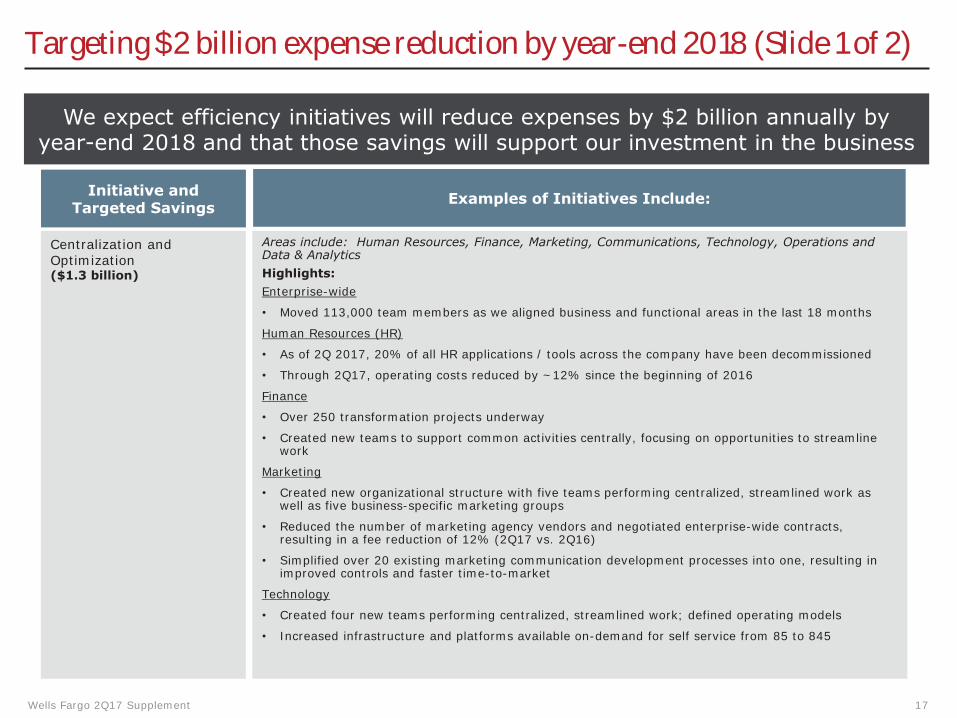
Targeting $2 billion expense reduction by year-end 2018 (Slide 1 of 2)
Initiative and Targeted Savings Examples of Initiatives Include:
Centralization and Optimization ($1.3 billion)
Areas include: Human Resources, Finance, Marketing, Communications, Technology, Operations and Data & Analytics Highlights: Enterprise-wide
• Moved 113,000 team members as we aligned business and functional areas in the last 18 months
Human Resources (HR)
• As of 2Q 2017, 20% of all HR applications / tools across the company have been decommissioned
• Through 2Q17, operating costs reduced by ~12% since the beginning of 2016
Finance
• Over 250 transformation projects underway
• Created new teams to support common activities centrally, focusing on opportunities to streamline work
Marketing
• Created new organizational structure with five teams performing centralized, streamlined work as well as five business-specific marketing groups
• Reduced the number of marketing agency vendors and negotiated enterprise-wide contracts, resulting in a fee reduction of 12% (2Q17 vs. 2Q16)
• Simplified over 20 existing marketing communication development processes into one, resulting in improved controls and faster time-to-market
Technology
• Created four new teams performing centralized, streamlined work; defined operating models
• Increased infrastructure and platforms available on-demand for self service from 85 to 845
Wells Fargo 2Q17 Supplement 17
We expect efficiency initiatives will reduce expenses by $2 billion annually by year-end 2018 and that those savings will support our investment in the business

Targeting $2 billion expense reduction by year-end 2018 (Slide 2 of 2)
Initiative and Targeted Savings Examples of Initiatives Include:
Professional Services and Third Party Expenses ($200 million)
Branch Optimization ($170 million)
Facilities ($150 million)
Travel ($100 million)
Risk ($100 million)
• Appointed dedicated relationship manager for largest consulting engagements, and began in-depth review process
• Operating monthly governance process to approve new consulting engagements • Adding internal capabilities and capacity to replace more expensive consulting firms where
appropriate
Plan to close ~450 branches in 2017–2018 to eliminate overlap and improve performance of the network
- 93 branches closed YTD 2017 through June
Anticipate $130MM in 2017 savings from gains on building dispositions and workforce optimization with an additional $20MM in 2018
Reduction in non-customer facing travel and expenses with focused efforts on virtual conferences and telepresence, as well as leveraging internal meeting spaces and services
Capturing efficiencies as the corporate risk structure matures
We expect an additional $2 billion in annual expense reductions by the end of 2019; these savings are projected to go to the “bottom line”
Wells Fargo 2Q17 Supplement 18
We expect efficiency initiatives will reduce expenses by $2 billion annually by year-end 2018 and that those savings will support our investment in the business
Community Banking
($ in millions) 2Q17 vs
1Q17 vs
2Q16
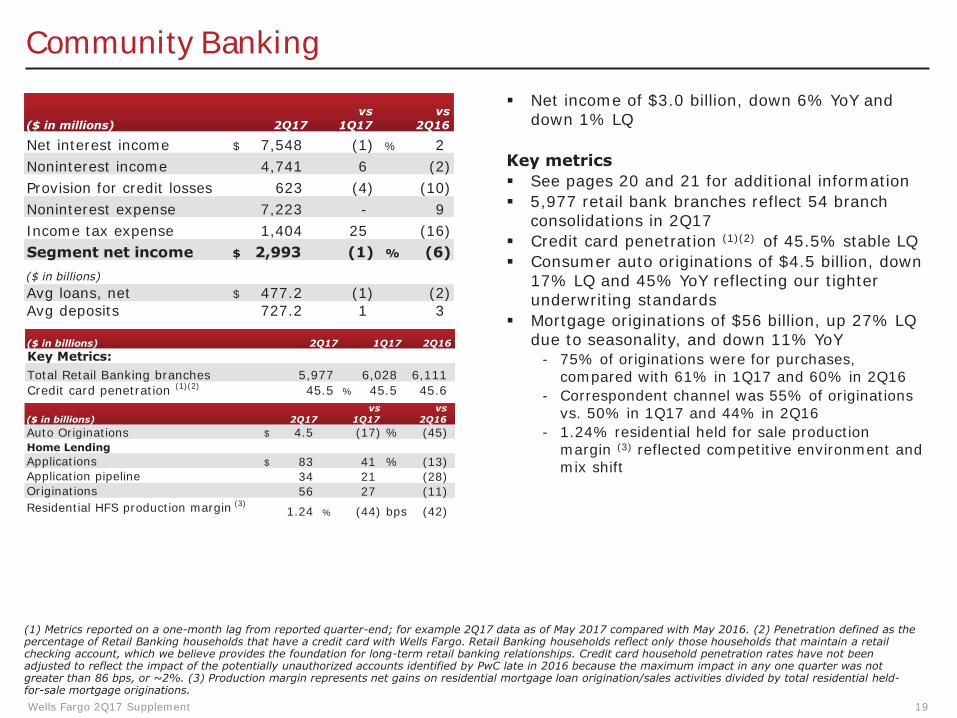
� Net income of $3.0 billion, down 6% YoY and down 1% LQ
Net interest income $
Noninterest income Provision for credit losses Noninterest expense Income tax expense Segment net income $
(1) % 2 6 (2)
(4) (10) - 9
25 (16) (1) % (6)
($ in billions) Avg loans, net $ Avg deposits
($ in billions) 2Q17 1Q17 2Q16 Key Metrics: Total Retail Banking branches Credit card penetration (1)(2)
($ in billions) 2Q17 1Q17 2Q16 vs vs
Auto Originations Home Lending Applications Application pipeline Originations Residential HFS production margin (3)
7,548
4,741
623
7,223
1,404
2,993
477.2 727.2
5,977 45.5
$ 4.5
$ 83 34 56
1.24 %
(1) (2) 1 3
6,028 6,111 % 45.5 45.6
(17) % (45)
41 % (13) 21 (28) 27 (11)
(44) bps (42)
Key metrics � See pages 20 and 21 for additional information � 5,977 retail bank branches reflect 54 branch
consolidations in 2Q17 � Credit card penetration (1)(2) of 45.5% stable LQ � Consumer auto originations of $4.5 billion, down
17% LQ and 45% YoY reflecting our tighter underwriting standards
� Mortgage originations of $56 billion, up 27% LQ due to seasonality, and down 11% YoY
- 75% of originations were for purchases, compared with 61% in 1Q17 and 60% in 2Q16
- Correspondent channel was 55% of originations vs. 50% in 1Q17 and 44% in 2Q16
- 1.24% residential held for sale production margin (3) reflected competitive environment and mix shift
(1) Metrics reported on a one-month lag from reported quarter-end; for example 2Q17 data as of May 2017 compared with May 2016. (2) Penetration defined as the percentage of Retail Banking households that have a credit card with Wells Fargo. Retail Banking households reflect only those households that maintain a retail checking account, which we believe provides the foundation for long-term retail banking relationships. Credit card household penetration rates have not been adjusted to reflect the impact of the potentially unauthorized accounts identified by PwC late in 2016 because the maximum impact in any one quarter was not greater than 86 bps, or ~2%. (3) Production margin represents net gains on residential mortgage loan origination/sales activities divided by total residential held-for-sale mortgage originations. Wells Fargo 2Q17 Supplement 19
Community Banking metrics
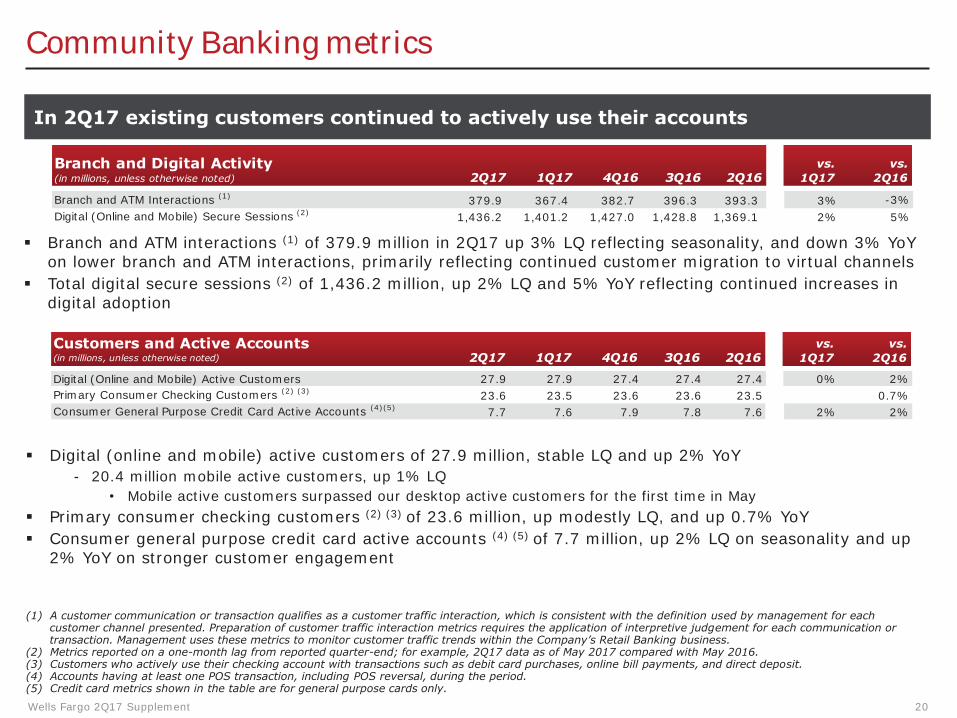
In 2Q17 existing customers continued to actively use their accounts
Branch and Digital Activity (in millions, unless otherwise noted) 2Q17 1Q17 4Q16 3Q16 2Q16
vs. 1Q17
vs. 2Q16
Branch and ATM Interactions (1) 379.9 367.4 382.7 396.3 393.3 3% -3% Digital (Online and Mobile) Secure Sessions (2) 1,436.2 1,401.2 1,427.0 1,428.8 1,369.1 2% 5%
� Branch and ATM interactions (1) of 379.9 million in 2Q17 up 3% LQ reflecting seasonality, and down 3% YoY on lower branch and ATM interactions, primarily reflecting continued customer migration to virtual channels
� Total digital secure sessions (2) of 1,436.2 million, up 2% LQ and 5% YoY reflecting continued increases in digital adoption
Customers and Active Accounts (in millions, unless otherwise noted) 2Q17 1Q17 4Q16 3Q16 2Q16
vs. 1Q17
vs. 2Q16
Digital (Online and Mobile) Active Customers 27.9 27.9 27.4 27.4 27.4 0% 2% Primary Consumer Checking Customers (2) (3) 23.6 23.5 23.6 23.6 23.5 0.7% Consumer General Purpose Credit Card Active Accounts (4)(5) 7.7 7.6 7.9 7.8 7.6 2% 2%
� Digital (online and mobile) active customers of 27.9 million, stable LQ and up 2% YoY - 20.4 million mobile active customers, up 1% LQ
• Mobile active customers surpassed our desktop active customers for the first time in May � Primary consumer checking customers (2) (3) of 23.6 million, up modestly LQ, and up 0.7% YoY � Consumer general purpose credit card active accounts (4) (5) of 7.7 million, up 2% LQ on seasonality and up
2% YoY on stronger customer engagement
(1) A customer communication or transaction qualifies as a customer traffic interaction, which is consistent with the definition used by management for each customer channel presented. Preparation of customer traffic interaction metrics requires the application of interpretive judgement for each communication or transaction. Management uses these metrics to monitor customer traffic trends within the Company’s Retail Banking business.
(2) Metrics reported on a one-month lag from reported quarter-end; for example, 2Q17 data as of May 2017 compared with May 2016. (3) Customers who actively use their checking account with transactions such as debit card purchases, online bill payments, and direct deposit. (4) Accounts having at least one POS transaction, including POS reversal, during the period. (5) Credit card metrics shown in the table are for general purpose cards only.
Wells Fargo 2Q17 Supplement 20

-
Community Banking metrics
Balances and Activity (in millions, unless otherwise noted) 2Q17 1Q17 4Q16 3Q16 2Q16
vs. 1Q17
vs. 2Q16
Deposits ($ in billions) Consumer and Small Business Banking Deposits (1)
$(Average)
Debit Cards (2)
POS Transactions 2,101 1,964 2,040 2,030 2,018 7% 4% POS Purchase Volume (billions) $ 80.6 75.7 78.4 76.0 76.4 6% 6%
Consumer General Purpose Credit Cards (3) ($ in billions) POS Purchase Volume $ 17.9 16.2 18.0 17.4 17.2 11% 4% Outstandings (Average) 27.1 27.3 27.1 26.4 25.3 -1% 7%
� Average consumer and small business banking deposit balances (1) stable LQ and up 5% YoY � Debit cards (2) and consumer general purpose credit cards (3):
- Point-of-sale debit card transactions up 7% LQ on seasonality and up 4% YoY on stronger POS usage per account - Point-of-sale debit card purchase volume up 6% LQ on seasonality and up 6% YoY on stronger usage per account and
a modest increase in the average transaction amount - Point-of-sale consumer general purpose credit card purchase volume up 11% LQ on seasonality and up 4% YoY on
active account growth and increased spend per account - Consumer general purpose credit card average balances of $27.1 billion down 1% LQ, and up 7% YoY on higher spend
per active account and higher transaction volume
760.1 758.8 749.9 739.1 726.4 0% 5%
Customer Experience Survey Scores with Branch (period end) 2Q17 1Q17 4Q16 3Q16 2Q16
vs. 1Q17
vs. 2Q16
Customer Loyalty 58.8% 57.9% 55.5% 57.7% 62.3% 80 bps (358) Overall Satisfaction with Most Recent Visit 77.8% 77.6% 76.4% 75.7% 77.7% 12 10
� With over 400,000 branch customer experience surveys completed during the second quarter, ‘Overall Satisfaction with Most Recent Visit’ and ‘Loyalty’ scores in June reached highest levels since August 2016
(1) Average consumer and small business banking deposits for each of 2Q17, 1Q17 and 4Q16 included $2.1 billion of deposits related to our new Payments, Virtual Solutions, and Innovation Group that involved realignment in fourth quarter 2016 of some personnel and business activities from Wholesale Banking to the Community Banking operating segment.
(2) Combined consumer and business debit card activity. (3) Credit card metrics shown in the table are for general purpose cards only.
Wells Fargo 2Q17 Supplement 21
Wholesale Banking
($ in millions) 2Q17 vs
1Q17 vs
2Q16
Net interest income $ 4,278 3 % 9
Noninterest income 2,673 (8) (21)
Provision for credit losses (65) 51 n.m. Noninterest expense 4,078 (3) 1
Income tax expense 559 (25) (30)
Segment net income $ 2,388 13 % 15
($ in billions) Avg loans, net $ 464.9 - 3 Avg deposits 463.0 (1) 9
Key Metrics: Commercial card spend volume (1) $ 7.6 6 % 15 U.S. investment banking market share (2) 3.6 %
($ in billions) 2Q17 vs
1Q17 vs
2Q16
(1) Includes commercial card volume for the entire company. (2) Year to date (YTD) through June. Source: Dealogic U.S. investment banking
fee market share. Wells Fargo 2Q17 Supplement
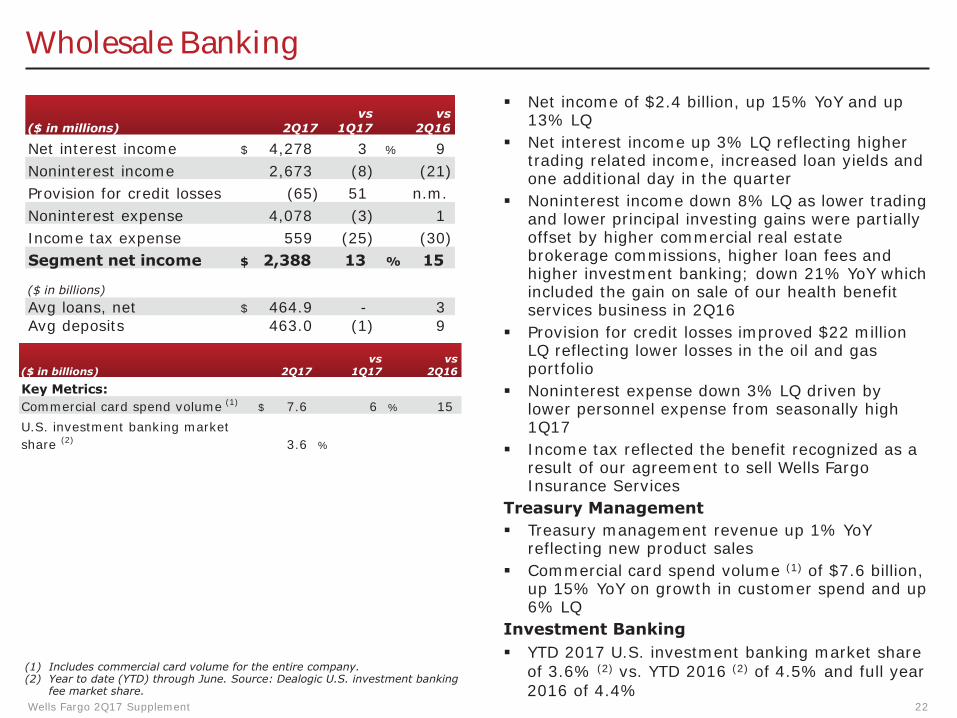
� Net income of $2.4 billion, up 15% YoY and up 13% LQ
� Net interest income up 3% LQ reflecting higher trading related income, increased loan yields and one additional day in the quarter
� Noninterest income down 8% LQ as lower trading and lower principal investing gains were partially offset by higher commercial real estate brokerage commissions, higher loan fees and higher investment banking; down 21% YoY which included the gain on sale of our health benefit services business in 2Q16
� Provision for credit losses improved $22 million LQ reflecting lower losses in the oil and gas portfolio
� Noninterest expense down 3% LQ driven by lower personnel expense from seasonally high 1Q17
� Income tax reflected the benefit recognized as a result of our agreement to sell Wells Fargo Insurance Services
Treasury Management � Treasury management revenue up 1% YoY
reflecting new product sales � Commercial card spend volume (1) of $7.6 billion,
up 15% YoY on growth in customer spend and up 6% LQ
Investment Banking � YTD 2017 U.S. investment banking market share
of 3.6% (2) vs. YTD 2016 (2) of 4.5% and full year 2016 of 4.4%
22
Wealth and Investment Management
($ in millions) 2Q17 vs
1Q17 vs
2Q16
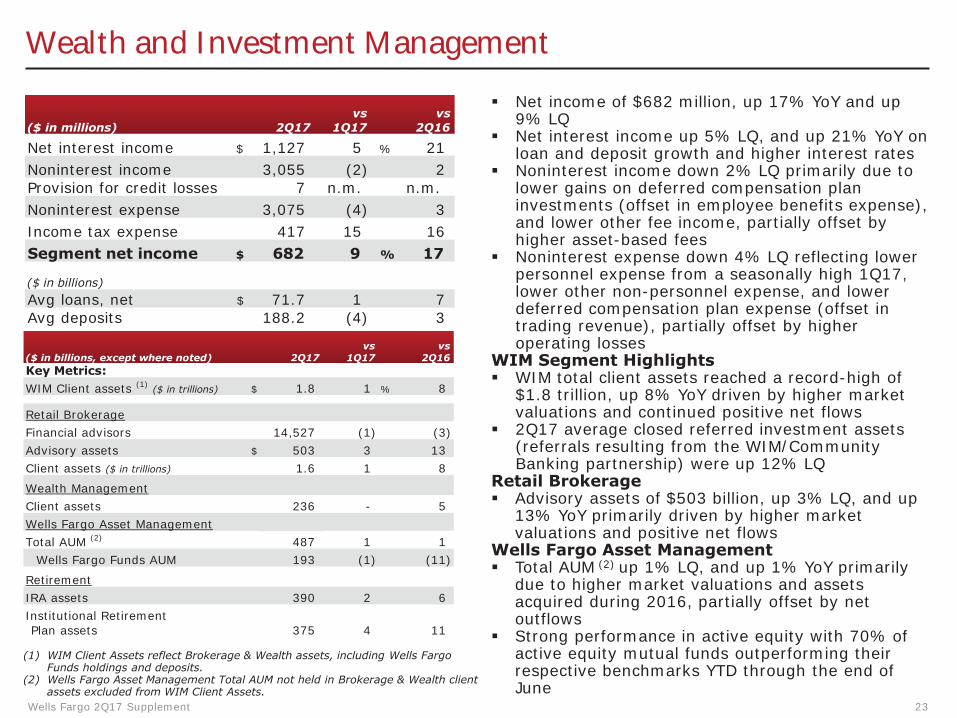
Net interest income $ 1,127 5 % 21 Noninterest income 3,055 (2) 2 Provision for credit losses 7 n.m. n.m. Noninterest expense 3,075 (4) 3 Income tax expense 417 15 16 Segment net income $ 682 9 % 17
($ in billions) Avg loans, net $ 71.7 1 7 Avg deposits 188.2 (4) 3
($ in billions, except where noted) 2Q17 vs
1Q17 vs
2Q16 Key Metrics: WIM Client assets (1) ($ in trillions) $ 1.8 1 % 8
Retail Brokerage Financial advisors 14,527 (1) (3) Advisory assets $ 503 3 13 Client assets ($ in trillions) 1.6 1 8
Wealth Management Client assets 236 - 5 Wells Fargo Asset Management Total AUM (2) 487 1 1
Wells Fargo Funds AUM 193 (1) (11)
Retirement IRA assets 390 2 6 Institutional Retirement Plan assets 375 4 11
(1) WIM Client Assets reflect Brokerage & Wealth assets, including Wells Fargo Funds holdings and deposits.
(2) Wells Fargo Asset Management Total AUM not held in Brokerage & Wealth client assets excluded from WIM Client Assets.
� Net income of $682 million, up 17% YoY and up 9% LQ
� Net interest income up 5% LQ, and up 21% YoY on loan and deposit growth and higher interest rates
� Noninterest income down 2% LQ primarily due to lower gains on deferred compensation plan investments (offset in employee benefits expense), and lower other fee income, partially offset by higher asset-based fees
� Noninterest expense down 4% LQ reflecting lower personnel expense from a seasonally high 1Q17, lower other non-personnel expense, and lower deferred compensation plan expense (offset in trading revenue), partially offset by higher operating losses
WIM Segment Highlights � WIM total client assets reached a record-high of
$1.8 trillion, up 8% YoY driven by higher market valuations and continued positive net flows
� 2Q17 average closed referred investment assets (referrals resulting from the WIM/Community Banking partnership) were up 12% LQ
Retail Brokerage � Advisory assets of $503 billion, up 3% LQ, and up
13% YoY primarily driven by higher market valuations and positive net flows
Wells Fargo Asset Management � Total AUM (2) up 1% LQ, and up 1% YoY primarily
due to higher market valuations and assets acquired during 2016, partially offset by net outflows
� Strong performance in active equity with 70% of active equity mutual funds outperforming their respective benchmarks YTD through the end of June
Wells Fargo 2Q17 Supplement 23

Credit quality
Provision Expense and Net Charge-offs ($ in millions)
1,074
805 805
605 555
924
805 905
805
655
0.39% 0.33% 0.37% 0.34% 0.27%
2Q16 3Q16 4Q16 1Q17 2Q17 Provision Expense Net Charge-offs Net Charge-off Rate
Nonperforming Assets ($ in billions)
13.1 12.0
12.0 11.0 10.4 9.8 9.1
1.1 1.0 1.0 0.9 0.8
11.4 10.7
9.8
2Q16 3Q16 4Q16 1Q17 2Q17 Nonaccrual loans Foreclosed assets
Wells Fargo 2Q17 Supplement
� Net charge-offs of $655 million, down $150 million, or 19%, LQ
� $100 million reserve release reflected credit improvement across auto, residential mortgage and commercial portfolios, partially offset by deterioration in unsecured consumer exposure, primarily credit card
� 0.27% net charge-off rate - Commercial losses of 6 bps, down 5 bps LQ on
lower losses in the oil and gas portfolio - Consumer losses of 51 bps, down 8 bps LQ
driven by lower auto losses and consumer real estate recoveries
� NPAs decreased $827 million LQ - Nonaccrual loans decreased $703 million on a
$321 million decline in commercial nonaccruals and a $382 million decline in consumer nonaccruals
- Foreclosed assets declined $124 million � Allowance for credit losses = $12.1 billion
- Allowance covered 4.6x annualized 2Q17 net charge-offs
� Oil and gas loan portfolio of $12.7 billion, stable LQ and down 25% YoY
- $20 million of net charge-offs in 2Q17, down $81 million LQ
- Nonaccrual loans of $1.8 billion, down $232 million LQ
- Criticized loans of $4.6 billion, down $559 million, or 11% LQ
- Allowance for credit losses allocated for the oil and gas portfolio = 7.5% of total oil and gas loans outstanding
24

Capital
Capital PositionCommon Equity Tier 1 Ratio (Fully Phased-In) (1)
11.6%
11.2% 10.8% 10.7%10.6%
2Q16 3Q16 4Q16 1Q17 2Q17 Estimated
(1) 2Q17 capital ratio is a preliminary estimate. Fully phased-in capital ratios are calculated assuming the full phase-in of the Basel III capital rules. See page 32 for additional information regarding capital ratios.
(2) Net payout ratio means the ratio of (i) common stock dividends and share repurchases less issuances and stock compensation-related items, divided by (ii) net income applicable to common stock.
Wells Fargo 2Q17 Supplement
� Common Equity Tier 1 ratio well above the regulatory minimum and our internal target
- Common Equity Tier 1 ratio (fully phased-in) of 11.6% at 6/30/17 (1) increased LQ primarily due to higher Common Equity Tier 1 and lower risk-weighted assets
Capital Return � Received a non-objection to our 2017 Capital
Plan from the Federal Reserve � Period-end common shares outstanding down
30.0 million LQ - Settled 43.0 million common share
repurchases - Issued 13.0 million common shares
� Strong capital levels allowed us to continue to return capital to shareholders
- Returned $3.4 billion to shareholders in 2Q17
- Net payout ratio (2) of 63% in 2Q17
Total Loss Absorbing Capacity (TLAC) Update � As of 6/30/2017, we estimate that our eligible
external TLAC as a percentage of total risk-weighted assets was 23.0% compared with an expected 1/1/2019 required minimum of 22.0%
25
2Q17 Summary
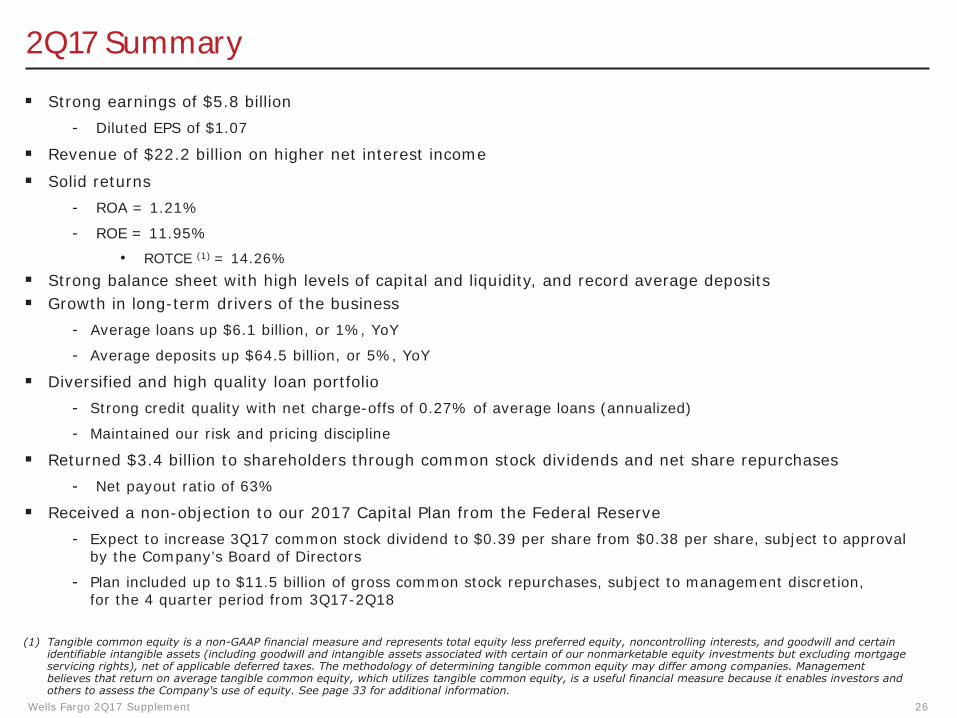
� Strong earnings of $5.8 billion - Diluted EPS of $1.07
� Revenue of $22.2 billion on higher net interest income
� Solid returns - ROA = 1.21%
- ROE = 11.95%
• ROTCE (1) = 14.26% � Strong balance sheet with high levels of capital and liquidity, and record average deposits � Growth in long-term drivers of the business
- Average loans up $6.1 billion, or 1%, YoY
- Average deposits up $64.5 billion, or 5%, YoY
� Diversified and high quality loan portfolio - Strong credit quality with net charge-offs of 0.27% of average loans (annualized)
- Maintained our risk and pricing discipline
� Returned $3.4 billion to shareholders through common stock dividends and net share repurchases - Net payout ratio of 63%
� Received a non-objection to our 2017 Capital Plan from the Federal Reserve - Expect to increase 3Q17 common stock dividend to $0.39 per share from $0.38 per share, subject to approval
by the Company’s Board of Directors
- Plan included up to $11.5 billion of gross common stock repurchases, subject to management discretion, for the 4 quarter period from 3Q17-2Q18
(1) Tangible common equity is a non-GAAP financial measure and represents total equity less preferred equity, noncontrolling interests, and goodwill and certain identifiable intangible assets (including goodwill and intangible assets associated with certain of our nonmarketable equity investments but excluding mortgage servicing rights), net of applicable deferred taxes. The methodology of determining tangible common equity may differ among companies. Management believes that return on average tangible common equity, which utilizes tangible common equity, is a useful financial measure because it enables investors and others to assess the Company's use of equity. See page 33 for additional information.
Wells Fargo 2Q17 Supplement 26

Appendix
Real estate 1-4 family mortgage portfolio
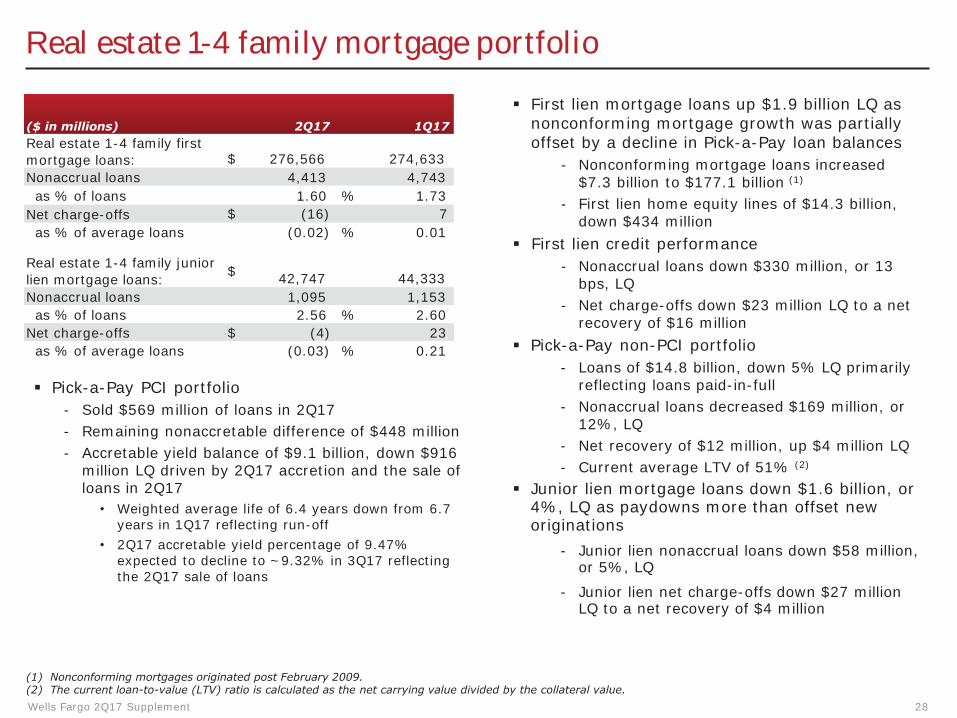
($ in millions) 2Q17 1Q17 Real estate 1-4 family first mortgage loans: $ 276,566 274,633 Nonaccrual loans 4,413 4,743 as % of loans 1.60 % 1.73 Net charge-offs $ (16) 7 as % of average loans (0.02) % 0.01
Real estate 1-4 family junior $lien mortgage loans: 42,747 44,333 Nonaccrual loans 1,095 1,153 as % of loans 2.56 % 2.60 Net charge-offs $ (4) 23 as % of average loans (0.03) % 0.21
� Pick-a-Pay PCI portfolio - Sold $569 million of loans in 2Q17 - Remaining nonaccretable difference of $448 million - Accretable yield balance of $9.1 billion, down $916
million LQ driven by 2Q17 accretion and the sale of loans in 2Q17 • Weighted average life of 6.4 years down from 6.7
years in 1Q17 reflecting run-off • 2Q17 accretable yield percentage of 9.47%
expected to decline to ~9.32% in 3Q17 reflecting the 2Q17 sale of loans
� First lien mortgage loans up $1.9 billion LQ as nonconforming mortgage growth was partially offset by a decline in Pick-a-Pay loan balances
- Nonconforming mortgage loans increased $7.3 billion to $177.1 billion (1)
- First lien home equity lines of $14.3 billion, down $434 million
� First lien credit performance - Nonaccrual loans down $330 million, or 13
bps, LQ - Net charge-offs down $23 million LQ to a net
recovery of $16 million � Pick-a-Pay non-PCI portfolio
- Loans of $14.8 billion, down 5% LQ primarily reflecting loans paid-in-full
- Nonaccrual loans decreased $169 million, or 12%, LQ
- Net recovery of $12 million, up $4 million LQ - Current average LTV of 51% (2)
� Junior lien mortgage loans down $1.6 billion, or 4%, LQ as paydowns more than offset new originations
- Junior lien nonaccrual loans down $58 million, or 5%, LQ
- Junior lien net charge-offs down $27 million LQ to a net recovery of $4 million
(1) Nonconforming mortgages originated post February 2009. (2) The current loan-to-value (LTV) ratio is calculated as the net carrying value divided by the collateral value. Wells Fargo 2Q17 Supplement 28
Consumer credit card portfolio
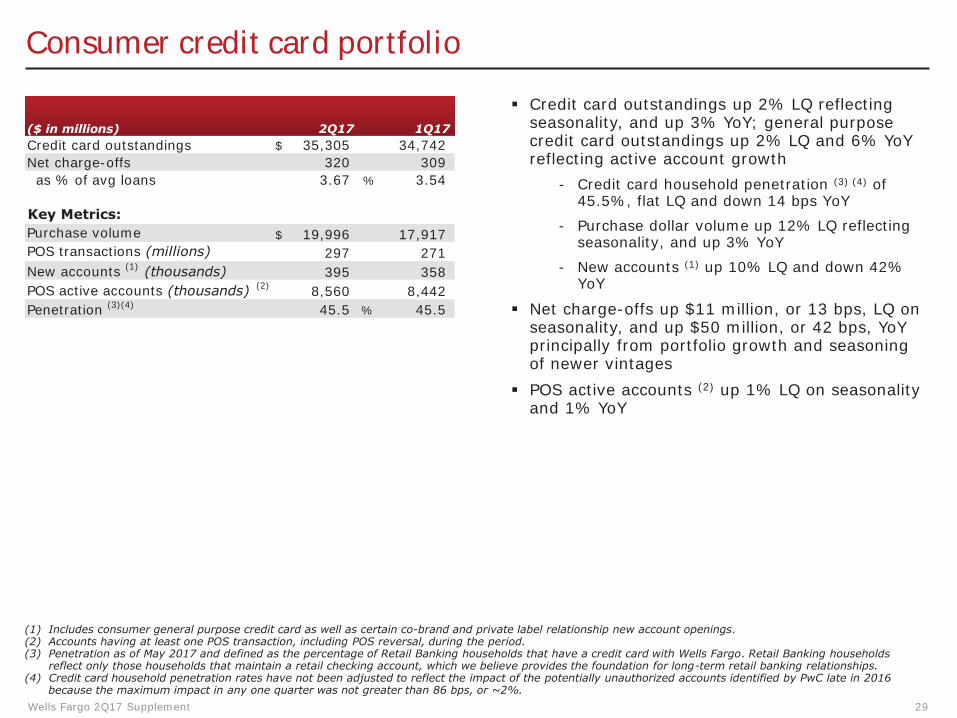
($ in millions) 2Q17 1Q17 Credit card outstandings $ 35,305 34,742 Net charge-offs 320 309 as % of avg loans 3.67 % 3.54
Key Metrics: Purchase volume $ 19,996 17,917 POS transactions (millions) 297 271 New accounts (1) (thousands) 395 358 POS active accounts (thousands) (2) 8,560 8,442 Penetration (3)(4) 45.5 % 45.5
� Credit card outstandings up 2% LQ reflecting seasonality, and up 3% YoY; general purpose credit card outstandings up 2% LQ and 6% YoY reflecting active account growth
- Credit card household penetration (3) (4) of 45.5%, flat LQ and down 14 bps YoY
- Purchase dollar volume up 12% LQ reflecting seasonality, and up 3% YoY
- New accounts (1) up 10% LQ and down 42% YoY
� Net charge-offs up $11 million, or 13 bps, LQ on seasonality, and up $50 million, or 42 bps, YoY principally from portfolio growth and seasoning of newer vintages
� POS active accounts (2) up 1% LQ on seasonality and 1% YoY
(1) Includes consumer general purpose credit card as well as certain co-brand and private label relationship new account openings. (2) Accounts having at least one POS transaction, including POS reversal, during the period. (3) Penetration as of May 2017 and defined as the percentage of Retail Banking households that have a credit card with Wells Fargo. Retail Banking households
reflect only those households that maintain a retail checking account, which we believe provides the foundation for long-term retail banking relationships. (4) Credit card household penetration rates have not been adjusted to reflect the impact of the potentially unauthorized accounts identified by PwC late in 2016
because the maximum impact in any one quarter was not greater than 86 bps, or ~2%. Wells Fargo 2Q17 Supplement 29
Auto portfolios
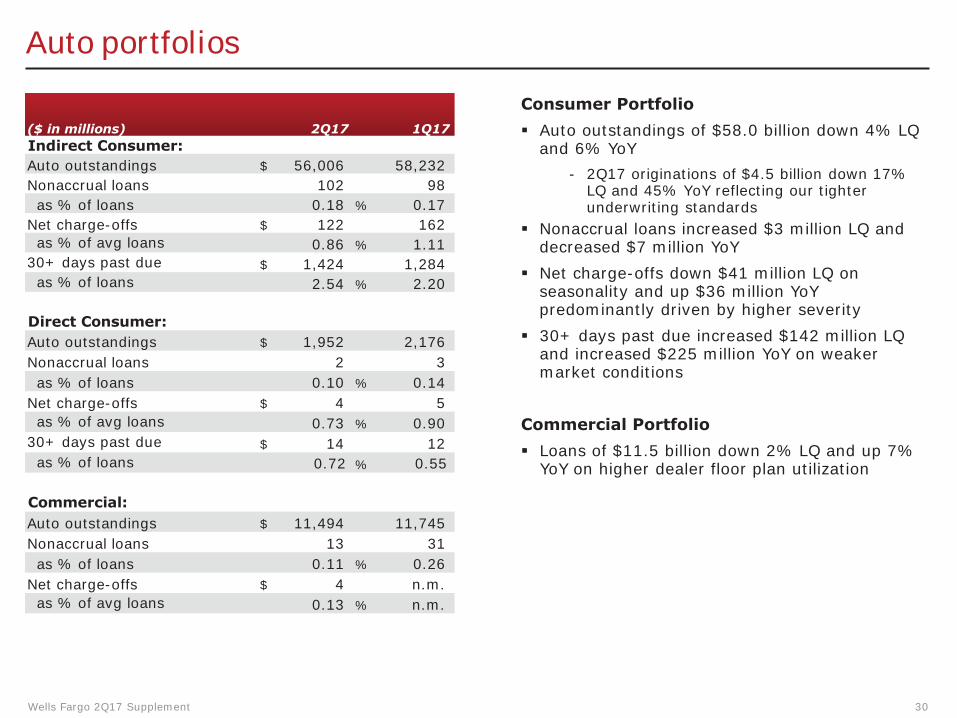
($ in millions) 2Q17 1Q17
Auto outstandings $ 56,006 58,232 Nonaccrual loans 102 98 as % of loans 0.18 % 0.17 Net charge-offs $ 122 162 as % of avg loans 0.86 % 1.11 30+ days past due $ 1,424 1,284 as % of loans 2.54 % 2.20
Auto outstandings $ 1,952 2,176 Nonaccrual loans 2 3 as % of loans 0.10 % 0.14 Net charge-offs $ 4 5 as % of avg loans 0.73 % 0.90 30+ days past due $ 14 12 as % of loans 0.72 % 0.55
Commercial: Auto outstandings $ 11,494 11,745 Nonaccrual loans 13 31 as % of loans 0.11 % 0.26 Net charge-offs $ 4 n.m. as % of avg loans 0.13 % n.m.
Indirect Consumer:
Direct Consumer:
Wells Fargo 2Q17 Supplement
Consumer Portfolio � Auto outstandings of $58.0 billion down 4% LQ
and 6% YoY - 2Q17 originations of $4.5 billion down 17%
LQ and 45% YoY reflecting our tighter underwriting standards
� Nonaccrual loans increased $3 million LQ and decreased $7 million YoY
� Net charge-offs down $41 million LQ on seasonality and up $36 million YoY predominantly driven by higher severity
� 30+ days past due increased $142 million LQ and increased $225 million YoY on weaker market conditions
Commercial Portfolio � Loans of $11.5 billion down 2% LQ and up 7%
YoY on higher dealer floor plan utilization
30
Student lending portfolio
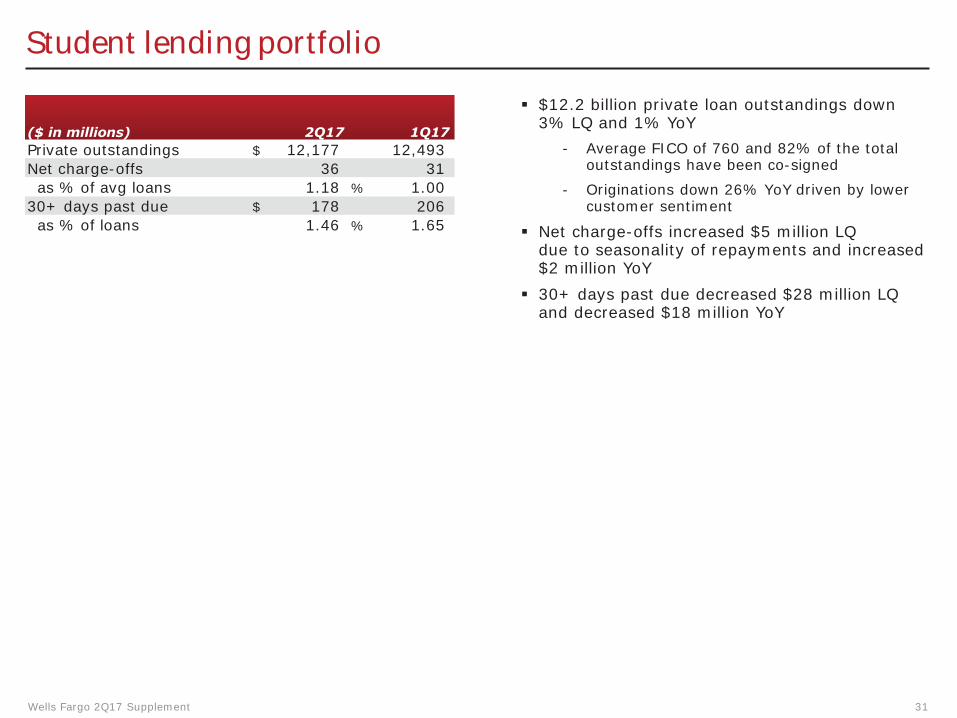
($ in millions) 2Q17 1Q17
� $12.2 billion private loan outstandings down 3% LQ and 1% YoY
Private outstandings $ 12,177 12,493 - Average FICO of 760 and 82% of the total outstandings have been co-signed Net charge-offs 36 31
as % of avg loans 1.18 % 1.00 - Originations down 26% YoY driven by lower 30+ days past due $ 178 206 customer sentiment as % of loans 1.46 % 1.65 � Net charge-offs increased $5 million LQ
due to seasonality of repayments and increased $2 million YoY
� 30+ days past due decreased $28 million LQ and decreased $18 million YoY
Wells Fargo 2Q17 Supplement 31
Common Equity Tier 1 (Fully Phased-In)
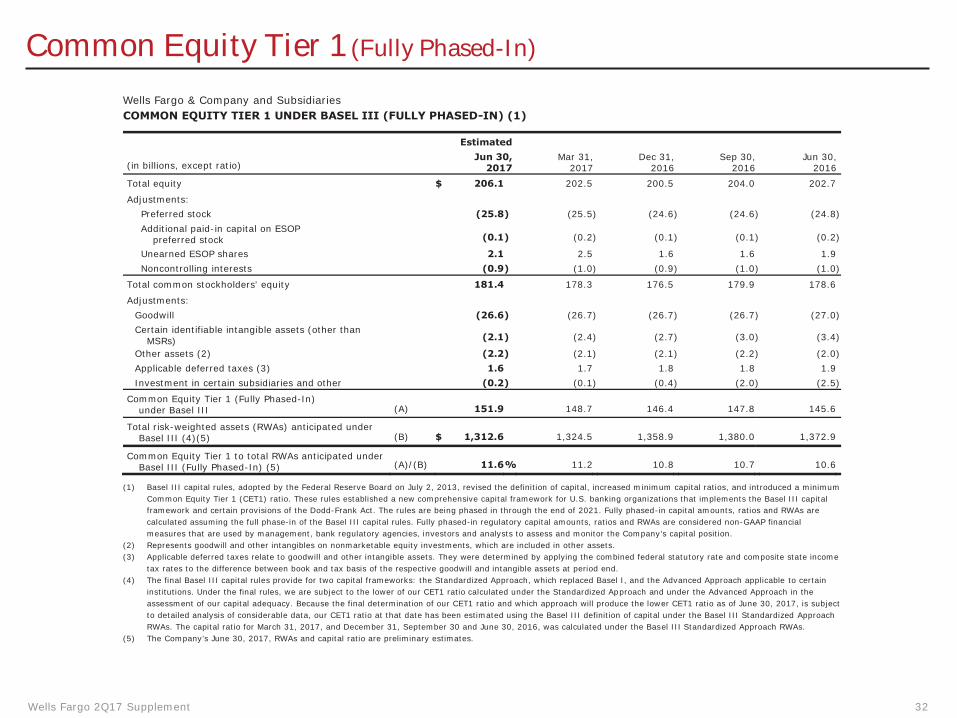
Wells Fargo & Company and Subsidiaries COMMON EQUITY TIER 1 UNDER BASEL III (FULLY PHASED-IN) (1)
Estimated Jun 30, Mar 31, Dec 31, Sep 30, Jun 30,
(in billions, except ratio) 2017 2017 2016 2016 2016 Total equity $ 206.1 202.5 200.5 204.0 202.7
Adjustments: Preferred stock (25.8) (25.5) (24.6) (24.6) (24.8) Additional paid-in capital on ESOP
preferred stock (0.1) (0.2) (0.1) (0.1) (0.2)
Unearned ESOP shares 2.1 2.5 1.6 1.6 1.9 Noncontrolling interests (0.9) (1.0) (0.9) (1.0) (1.0)
Total common stockholders' equity 181.4 178.3 176.5 179.9 178.6
Adjustments: Goodwill (26.6) (26.7) (26.7) (26.7) (27.0) Certain identifiable intangible assets (other than
(2.1) (2.4) (2.7) (3.0) (3.4)MSRs) Other assets (2) (2.2) (2.1) (2.1) (2.2) (2.0) Applicable deferred taxes (3) 1.6 1.7 1.8 1.8 1.9 Investment in certain subsidiaries and other (0.2) (0.1) (0.4) (2.0) (2.5)
Common Equity Tier 1 (Fully Phased-In) under Basel III (A) 151.9 148.7 146.4 147.8 145.6
Total risk-weighted assets (RWAs) anticipated under Basel III (4)(5) (B) $ 1,312.6 1,324.5 1,358.9 1,380.0 1,372.9
Common Equity Tier 1 to total RWAs anticipated under Basel III (Fully Phased-In) (5) (A)/(B) 11.6% 11.2 10.8 10.7 10.6
(1) Basel III capital rules, adopted by the Federal Reserve Board on July 2, 2013, revised the definition of capital, increased minimum capital ratios, and introduced a minimum Common Equity Tier 1 (CET1) ratio. These rules established a new comprehensive capital framework for U.S. banking organizations that implements the Basel III capital framework and certain provisions of the Dodd-Frank Act. The rules are being phased in through the end of 2021. Fully phased-in capital amounts, ratios and RWAs are calculated assuming the full phase-in of the Basel III capital rules. Fully phased-in regulatory capital amounts, ratios and RWAs are considered non-GAAP financial measures that are used by management, bank regulatory agencies, investors and analysts to assess and monitor the Company’s capital position.
(2) Represents goodwill and other intangibles on nonmarketable equity investments, which are included in other assets. (3) Applicable deferred taxes relate to goodwill and other intangible assets. They were determined by applying the combined federal statutory rate and composite state income
tax rates to the difference between book and tax basis of the respective goodwill and intangible assets at period end. (4) The final Basel III capital rules provide for two capital frameworks: the Standardized Approach, which replaced Basel I, and the Advanced Approach applicable to certain
institutions. Under the final rules, we are subject to the lower of our CET1 ratio calculated under the Standardized Approach and under the Advanced Approach in the assessment of our capital adequacy. Because the final determination of our CET1 ratio and which approach will produce the lower CET1 ratio as of June 30, 2017, is subject to detailed analysis of considerable data, our CET1 ratio at that date has been estimated using the Basel III definition of capital under the Basel III Standardized Approach RWAs. The capital ratio for March 31, 2017, and December 31, September 30 and June 30, 2016, was calculated under the Basel III Standardized Approach RWAs.
(5) The Company’s June 30, 2017, RWAs and capital ratio are preliminary estimates.
Wells Fargo 2Q17 Supplement 32
Return on average tangible common equity (ROTCE)
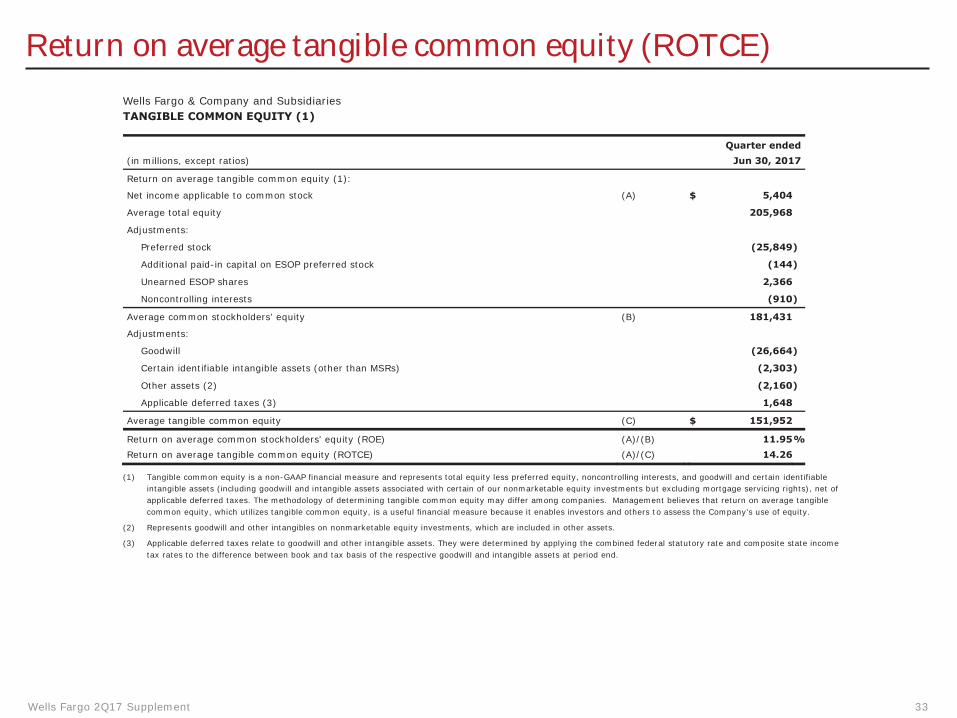
Wells Fargo & Company and Subsidiaries TANGIBLE COMMON EQUITY (1)
Quarter ended (in millions, except ratios) Jun 30, 2017
Return on average tangible common equity (1):
Net income applicable to common stock (A) $ 5,404
Average total equity 205,968
Adjustments:
Preferred stock (25,849)
Additional paid-in capital on ESOP preferred stock (144)
Unearned ESOP shares 2,366
Noncontrolling interests (910)
Average common stockholders’ equity (B) 181,431
Adjustments:
Goodwill (26,664)
Certain identifiable intangible assets (other than MSRs) (2,303)
Other assets (2) (2,160)
Applicable deferred taxes (3) 1,648
Average tangible common equity (C) $ 151,952
Return on average common stockholders' equity (ROE) (A)/(B) 11.95% Return on average tangible common equity (ROTCE) (A)/(C) 14.26
(1) Tangible common equity is a non-GAAP financial measure and represents total equity less preferred equity, noncontrolling interests, and goodwill and certain identifiable intangible assets (including goodwill and intangible assets associated with certain of our nonmarketable equity investments but excluding mortgage servicing rights), net of applicable deferred taxes. The methodology of determining tangible common equity may differ among companies. Management believes that return on average tangible common equity, which utilizes tangible common equity, is a useful financial measure because it enables investors and others to assess the Company's use of equity.
(2) Represents goodwill and other intangibles on nonmarketable equity investments, which are included in other assets.
(3) Applicable deferred taxes relate to goodwill and other intangible assets. They were determined by applying the combined federal statutory rate and composite state income tax rates to the difference between book and tax basis of the respective goodwill and intangible assets at period end.
Wells Fargo 2Q17 Supplement 33
Forward-looking statements and additional information
Forward-looking statements: This document contains “forward-looking statements” within the meaning of the Private Securities Litigation Reform Act of 1995. In addition, we may make forward-looking statements in our other documents filed or furnished with the SEC, and our management may make forward-looking statements orally to analysts, investors, representatives of the media and others. Forward-looking statements can be identified by words such as “anticipates,” “intends,” “plans,” “seeks,” “believes,” “estimates,” “expects,” “target,” “projects,” “outlook,” “forecast,” “will,” “may,” “could,” “should,” “can” and similar references to future periods. In particular, forward-looking statements include, but are not limited to, statements we make about: (i) the future operating or financial performance of the Company, including our outlook for future growth; (ii) our noninterest expense and efficiency ratio; (iii) future credit quality and performance, including our expectations regarding future loan losses and allowance levels; (iv) the appropriateness of the allowance for credit losses; (v) our expectations regarding net interest income and net interest margin; (vi) loan growth or the reduction or mitigation of risk in our loan portfolios; (vii) future capital or liquidity levels or targets and our estimated Common Equity Tier 1 ratio under Basel III capital standards; (viii) the performance of our mortgage business and any related exposures; (ix) the expected outcome and impact of legal, regulatory and legislative developments, as well as our expectations regarding compliance therewith; (x) future common stock dividends, common share repurchases and other uses of capital; (xi) our targeted range for return on assets and return on equity; (xii) the outcome of contingencies, such as legal proceedings; and (xiii) the Company’s plans, objectives and strategies. Forward-looking statements are not based on historical facts but instead represent ourcurrent expectations and assumptions regarding our business, the economy and other future conditions. Investors are urged to not undulyrely on forward-looking statements as actual results could differ materially from expectations. Forward-looking statements speak only as ofthe date made, and we do not undertake to update them to reflect changes or events that occur after that date. For more information aboutfactors that could cause actual results to differ materially from expectations, refer to the “Forward-Looking Statements” discussion in WellsFargo’s press release announcing our second quarter 2017 results and in our most recent Quarterly Report on Form 10-Q, as well as to WellsFargo’s other reports filed with the Securities and Exchange Commission, including the discussion under “Risk Factors” in our Annual Reporton Form 10-K for the year ended December 31, 2016.
Purchased credit-impaired loan portfolios: Loans acquired that were considered credit impaired at acquisition were written down at that date in purchase accounting to an amount estimated to be collectible and the related allowance for loan losses was not carried over to Wells Fargo’s allowance. In addition, such purchased credit-impaired loans are not classified as nonaccrual or nonperforming, and are not included in loans that were contractually 90+ days past due and still accruing. Any losses on such loans are charged against the nonaccretable difference established in purchase accounting and are not reported as charge-offs (until such difference is fully utilized). As a result of accounting for purchased loans with evidence of credit deterioration, certain ratios of Wells Fargo are not comparable to a portfolio that does not include purchased credit-impaired loans.
In certain cases, the purchased credit-impaired loans may affect portfolio credit ratios and trends. Management believes that the presentation of information adjusted to exclude the purchased credit-impaired loans provides useful disclosure regarding the credit quality of the non-impaired loan portfolio. Accordingly, certain of the loan balances and credit ratios in this document have been adjusted to exclude the purchased credit-impaired loans. References in this document to impaired loans mean the purchased credit-impaired loans. Please see page 31 of the press release announcing our 2Q17 results for additional information regarding the purchased credit-impaired loans.
Wells Fargo 2Q17 Supplement . 34