renewable energy training for latin america energy training for latin america ... hydro or wind...
TRANSCRIPT

© OECD/IEA 2015
Renewable Energy Training for Latin America Day 1
IEA Training and Capacity Building - Latin America, Santiago de Chile, 19-23 Oct 2015
Simon Müller
Analyst – System Integration of Renewables

© OECD/IEA 2014
Day 1 – The Integration Challenge and International Experience: Session 1: Integration of renewable energy into power grids
Session 2 & 3: International context - Successes and failures (EU and USA)
Country presentations: Mexico (Markets & Policies), Uruguay (System operation)
Course overview
© OECD/IEA 2014 2

© OECD/IEA 2014
Session 1: Integration of renewable energy systems into power grids
1. Basic concepts of power systems and integration
2. Detailed discussion of the technical properties of VRE and what integration effects they cause
3. Relevant properties of power systems that shape degree of flexibility
Exercise 1: Constructing net load for different shares of wind and PV
Integration effects depending on penetration rate and country context
Session agenda
© OECD/IEA 2014 3

© OECD/IEA 2014
Grid based power systems have historically been organised into generation, transmission and distribution
This is still main paradigm for most systems
Grid based power systems
© OECD/IEA 2014 4

© OECD/IEA 2014
Power demand varies by region, season and daytime
© OECD/IEA 2014 5

© OECD/IEA 2014
Why is it challenging to balance supply and demand of electricity? What are relevant time scales?
© OECD/IEA 2014 6
© OECD/IEA 2014
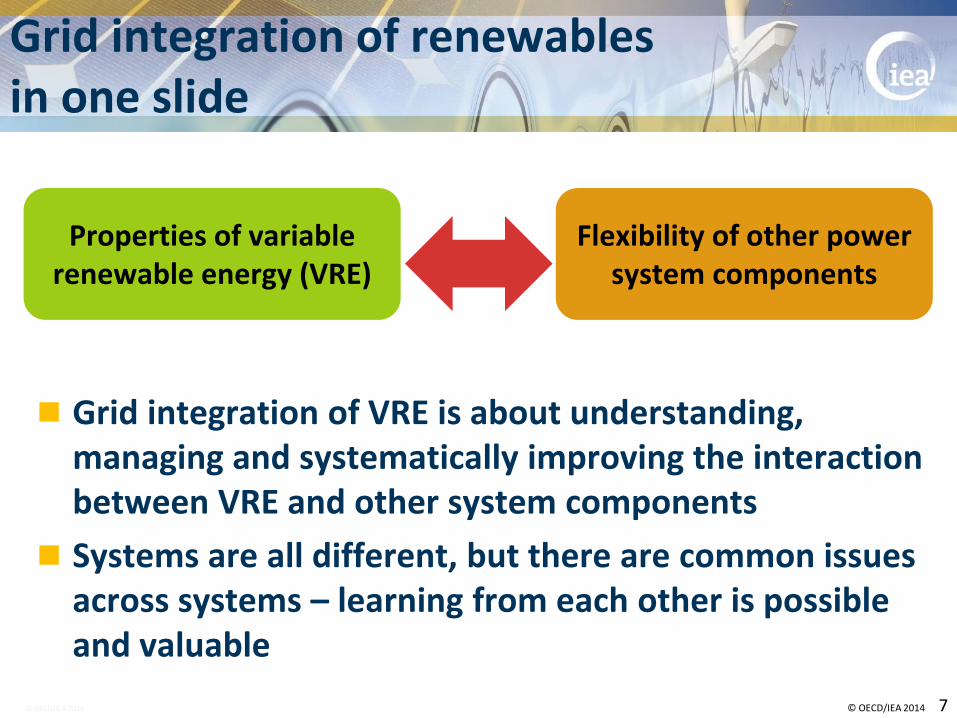
Grid integration of renewables in one slide
Properties of variable renewable energy (VRE)
Flexibility of other power system components
© OECD/IEA 2014 7
Grid integration of VRE is about understanding, managing and systematically improving the interaction between VRE and other system components
Systems are all different, but there are common issues across systems – learning from each other is possible and valuable

© OECD/IEA 2014
Properties of VRE
© OECD/IEA 2014 8

© OECD/IEA 2014
The 6 VRE properties that matter
Variable Maximum output varies depending on wind and sunlight
Uncertain No perfect forecast for wind and sunlight available
Non-synchronous technologies VRE connect to grid via power electronics, have little or no
rotating mass
Location constrained resource is not equally good in all locations and cannot be
transported
Modularity Wide range of sizes and may be much smaller than other options
Low short-run cost Once built, VRE generate power almost for free
sec
yrs
1km
100s km
© OECD/IEA 2014 9

© OECD/IEA 2014
Netload = Load - VRE
Note: Load data and wind data from Germany 10 to 16 November 2010, wind generation scaled, actual share 7.3%. Scaling may overestimate the impact of variability; combined effect of wind and solar may be lower, illustration only.
© OECD/IEA 2014 10
0
10
20
30
40
50
60
70
80
1 10 20 30 40 50 60 70 80 90 100 110 120 130 140 Hours
Net
load
(G
W)
0.0% 2.5% 5.0% 10.0% 20.0%
Illustration of netload at different VRE shares

© OECD/IEA 2014
Variability: Examples of solar PV and wind
© OECD/IEA 2014 11

© OECD/IEA 2014
Variability: Examples of solar PV and wind
© OECD/IEA 2014 12

© OECD/IEA 2014
A typical week of solar (top) and wind (bottom) generation in summer 2011 in Spain.
© OECD/IEA 2014 13

© OECD/IEA 2014
Geographic smoothing within a wind plant with 15 turbines (red) and 200 turbines (blue)
© OECD/IEA 2014 14 Source: NREL ,2009
© OECD/IEA 2014
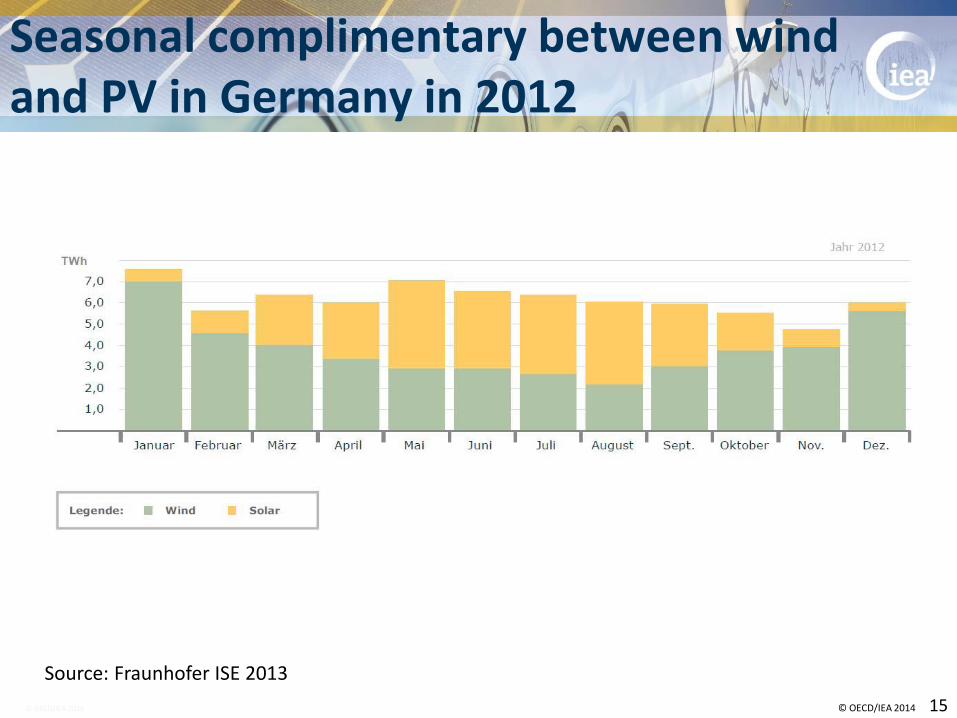
Seasonal complimentary between wind and PV in Germany in 2012
© OECD/IEA 2014 15
Source: Fraunhofer ISE 2013

© OECD/IEA 2014
Uncertainty reduces dramatically with shorter horizon
Real-time generation data key for short-term accuracy
Forecasts generally more mature for wind than for PV
Uncertainty
© OECD/IEA 2014 16
0%
5%
10%
15%
20%
25%
1 5 9 13 17 21 25 29 33 37 41 45
Mea
n a
bso
lute
err
or
/ av
erag
e p
rod
uct
ion
Forecast horizon (Hours before real-time)
2008 2009
2010 2011
2012
Accuracy of wind forecasts in Spain
Source: REE

© OECD/IEA 2014
Uncertainty: Problems with extreme weather
Source: SHORT-TERM PREDICTION OF SOLAR,PHOTOVOLTAIC POWER, Detlev Heinemann, Elke Lorenz, University of Oldenburg, Germany,Institute of Physics,Energy Meteorology Group, International Conference Energy & Meteorology (ICEM), 10 November 2011, Gold Coast, Australia

© OECD/IEA 2014
Location constraints
© OECD/IEA 2014 18
Brazil: Wind Power Density (W/m2) and population density (persons per km2)
Source: GPW, 2002

© OECD/IEA 2014
Location constraints
© OECD/IEA 2014 19
Japan: Wind Power Density (W/m2) and population density (persons per km2)
Sources: http://www.stat.go.jp/english/dat
a/handbook/pdf/c02cont.pdf
Sources: 2012-12-5 RE2012展示(縮小版).pdf
© OECD/IEA 2014
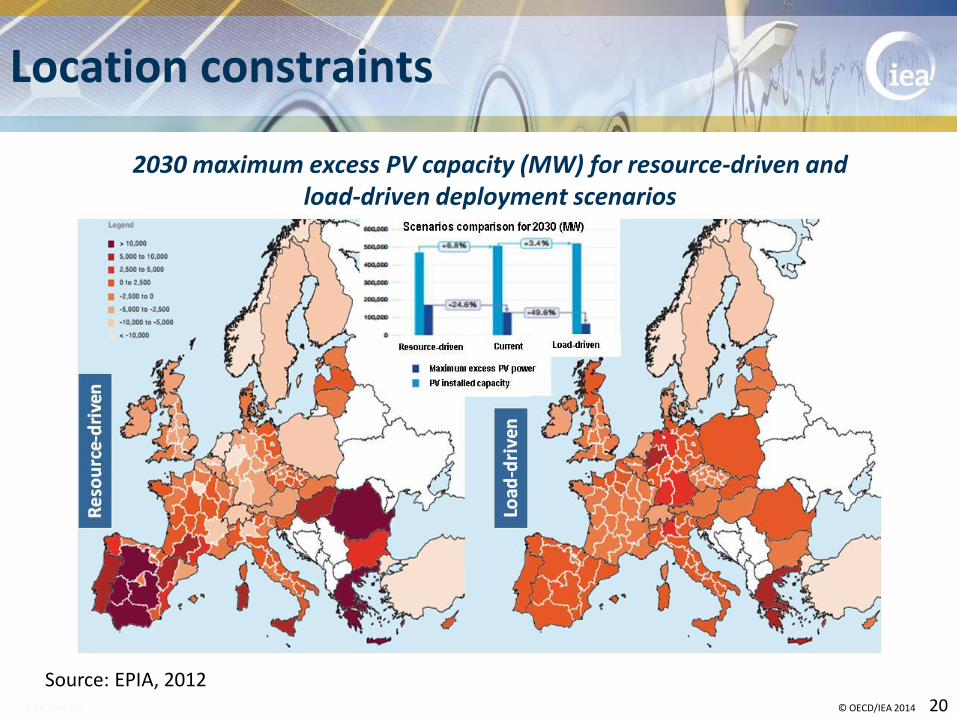
Location constraints
© OECD/IEA 2014 20
2030 maximum excess PV capacity (MW) for resource-driven and load-driven deployment scenarios
Source: EPIA, 2012

© OECD/IEA 2014
Modularity: German case
© OECD/IEA 2014 21

© OECD/IEA 2014
Modularity: Example of high solar PV capacities in Wolkshausen, Germany
© OECD/IEA 2014 22

© OECD/IEA 2014
Modularity: Danish case
© OECD/IEA 2014 23

© OECD/IEA 2014
Non-synchronous generation
Source: Integrating Wind in Ireland: Experience and Studies Mark O’Malley Director, MIT Wind Week January 21th 2011
PV: non-synchronous, non-mechanical generation
Wind: non-synchronous, mechanical generation

© OECD/IEA 2014
Synchronous vs non sychronous
SOURCE: IEC-White paper Grid integration of large-capacity Renewable Energy sources ,October 2013

© OECD/IEA 2014
Relevant integration effects
© OECD/IEA 2014 26

© OECD/IEA 2014
Germany, 1993, 0.1% wind power in total generation
“Renewable energies such as sun, hydro or wind cannot cover more than 4% of our electricity consumption – even in the long run” Joint statement by German power utilities, published in Die Zeit, 30 July 1993, page 10
Ireland, 2003, 2% wind power in annual generation
“This amount of wind generation does, however, pose an increased risk to the security and stability of the power system which the transmission system operator feels exceeds the level normally likely to be accepted by a prudent system operator.“
Kieran O'Brien, Managing Director of ESB National Grid, Ireland, 1 December 2003
2014, 20% wind power in annual generation
2020, target, 37% wind power in annual generation
VRE and initial concerns
© OECD/IEA 2015 27

© OECD/IEA 2014
VRE break an old ‘golden rule’ of system operation: “We cannot control load, so we must control generation to keep the lights on. VRE are not controllable, so we cannot use them.” Think of VRE as negative load at low shares. This will solve many issues.
VRE challenge operational patterns of existing assets: “The majority of our generation assets are technically incapable of changing their output to follow wind and solar power.” Critically assess technical performance characteristics, targeted upgrades
including better monitoring equipment and training of operating crews.
VRE may be incompatible with existing contract frameworks: Obligations to feed-in flat generation profile
Obligations to report schedules far ahead of time with no way of changing
Guaranteed operating hours of technically flexible plants constrain operations
Review and possibly change contractual framework.
Main barriers at low shares
© OECD/IEA 2015 28

© OECD/IEA 2014
When VRE are added to a system with adequate capacity:
Situations of low load and high VRE generation VRE curtailment if flexibility insufficient
Negative market prices due to inflexible generation and VRE support mechanisms
Grid bottlenecks in regions with high VRE density Limitations feeding production from the distribution to the
transmission grid
Insufficient evacuation capacity in regions with rapid build out of new VRE capacity
Main short-term challenges
© OECD/IEA 2014 29

© OECD/IEA 2014
Power systems already deal with a vast demand variability Can use existing flexibility for VRE integration
No problem at low shares, because …
© OECD/IEA 2014 30
Exceptionally high variability in Brazil, 28 June 2010

© OECD/IEA 2014
Main market impacts
Reduced market prices (merit order effect)
Reduced operating hours (utilisation effect)
Displacement effect mainly due to
low short-run cost of VRE and
reinforced by support policies
influenced by variability, in particular PV
Shift in German spot market price structure
© OECD/IEA 2014 31

© OECD/IEA 2014
Seconds Years 100km 1km
Low short run cost
Non synchro-
nous
Stability
Uncertainty
Reserves
Variability
Short term changes
Asset
utilisation
Abundance Scarcity
Location constrained
Trans-mission
grid
Modularity
Distribution grid
Properties of variable renewables and impact groups
Systems are different – impacts will vary too
But common groups of effects
© OECD/IEA 2014 32
Balancing Profile / Utilisation Location Stability
© OECD/IEA 2014
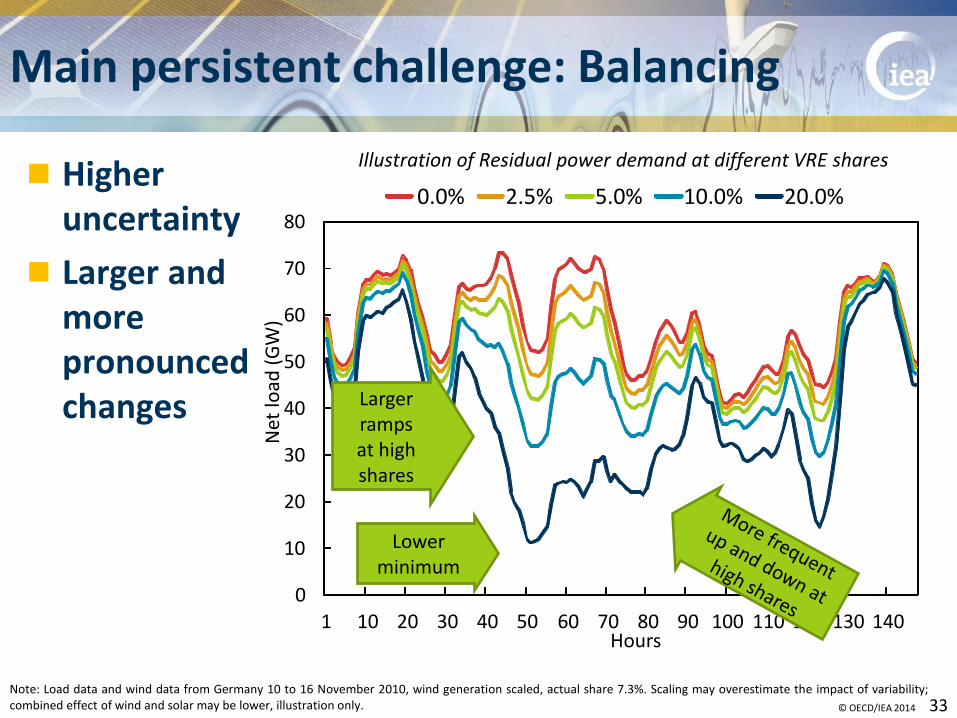
Main persistent challenge: Balancing
Note: Load data and wind data from Germany 10 to 16 November 2010, wind generation scaled, actual share 7.3%. Scaling may overestimate the impact of variability; combined effect of wind and solar may be lower, illustration only.
© OECD/IEA 2014 33
0
10
20
30
40
50
60
70
80
1 10 20 30 40 50 60 70 80 90 100 110 120 130 140 Hours
Net
load
(G
W)
0.0% 2.5% 5.0% 10.0% 20.0%
Larger ramps at high shares
Higher uncertainty
Larger and more pronounced changes
Illustration of Residual power demand at different VRE shares
Lower minimum
© OECD/IEA 2014
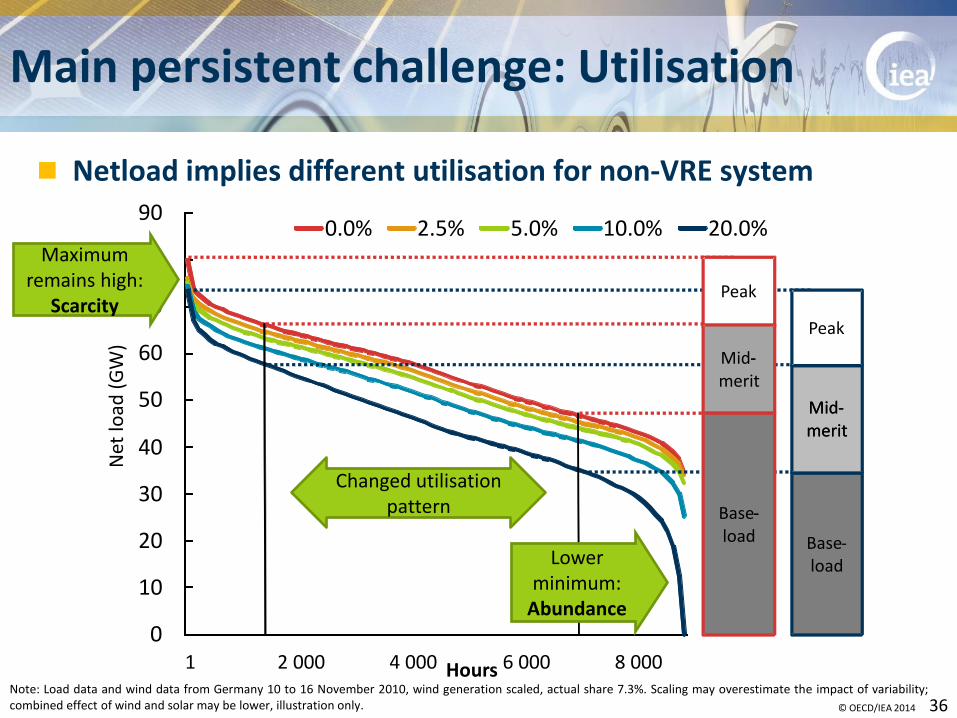
Netload implies different utilisation for non-VRE system
Main persistent challenge: Utilisation
Note: Load data and wind data from Germany 10 to 16 November 2010, wind generation scaled, actual share 7.3%. Scaling may overestimate the impact of variability; combined effect of wind and solar may be lower, illustration only.
© OECD/IEA 2014 36
0
10
20
30
40
50
60
70
80
90
1 2 000 4 000 6 000 8 000
Net
load
(G
W)
Hours
0.0% 2.5% 5.0% 10.0% 20.0% Maximum
remains high: Scarcity
Lower minimum:
Abundance
Changed utilisation pattern
Base - load
Mid - merit
Peak
Mid - merit
Peak
Mid - merit
Base - load
-
-
© OECD/IEA 2014
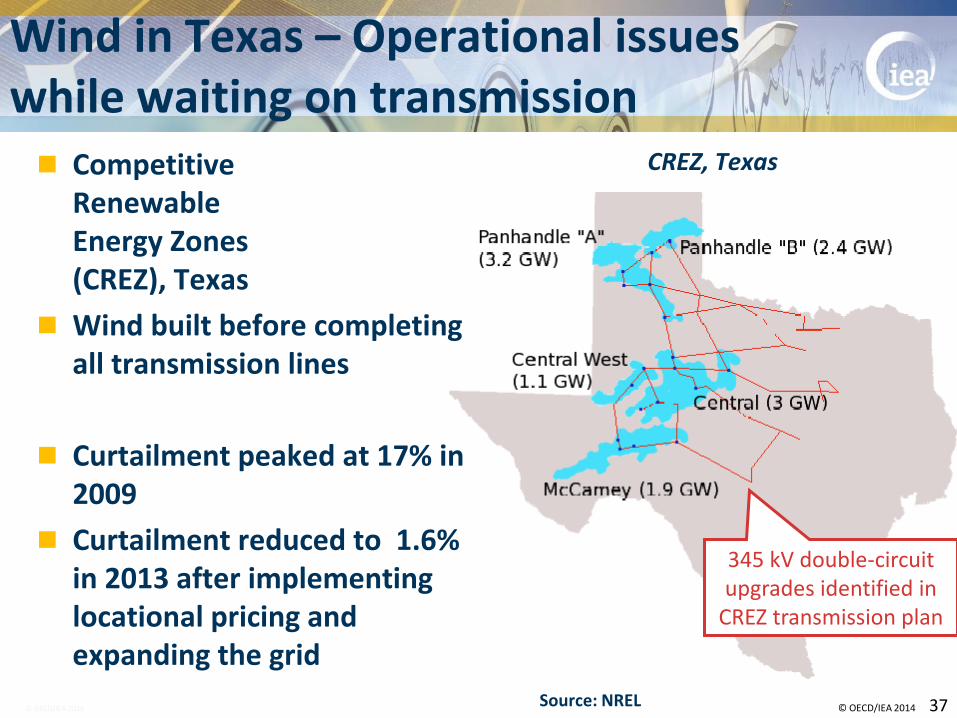
Competitive Renewable Energy Zones (CREZ), Texas
Wind built before completing all transmission lines
Curtailment peaked at 17% in 2009
Curtailment reduced to 1.6% in 2013 after implementing locational pricing and expanding the grid
Wind in Texas – Operational issues while waiting on transmission
© OECD/IEA 2014 37
345 kV double-circuit upgrades identified in
CREZ transmission plan
CREZ, Texas
Source: NREL

© OECD/IEA 2014
Voltage rise common issue
Smart inverters and transformers help
Distributed PV and the grid
© OECD/IEA 2014 38
Vo
ltag
e le
vel d
evia
tio
n
Transformer
Transformer
O%
+9%
Voltage rise in a rural distribution system in Germany

© OECD/IEA 2014
There is no single factor that would put a maximum technical limit on the long-term amount of variable generation
However, more and more measures are needed to achieve high shares
In the short term, many institutional and some technical issues can be a constraint.
Question rather is: How far can I go before it get‘s expensive? And what do I need to do for that?
No principal technical limit on VRE share
© OECD/IEA 2014 42
What is the maximum speed at which you can driver a car?*
*Apart from the speed of light
© OECD/IEA 2014
Relevant properties for system flexibility
© OECD/IEA 2014 43

© OECD/IEA 2014
Four sources of flexibility …
Grid infrastructure
Dispatchable generation Storage
Demand side integration
© OECD/IEA 2014 44
© OECD/IEA 2014
What is flexibility?
Definition “Extent to which a power system can adjust the balance of electricity
production and consumption in response to variability, expected or otherwise.”
Measurement of
Flexibility supply
Flexibility demand
Comparison of supply and demand
Flexibility options may Increase supply
Reduce demand

© OECD/IEA 2014
Capable of: “Achieving and sustaining any consumption or generation level at arbitrarily small response times at no cost.”
Relevant dimensions?
Possible levels: “Adjustability”
Max. duration of output: ”Durability”
Possible changes: “Ramping”
“Lead time” for change
“State dependency”
Real power sources, loads & storage approximate ideal source on these dimensions
Looking at the ideal power device
Handful of relevant time scales
© OECD/IEA 2014
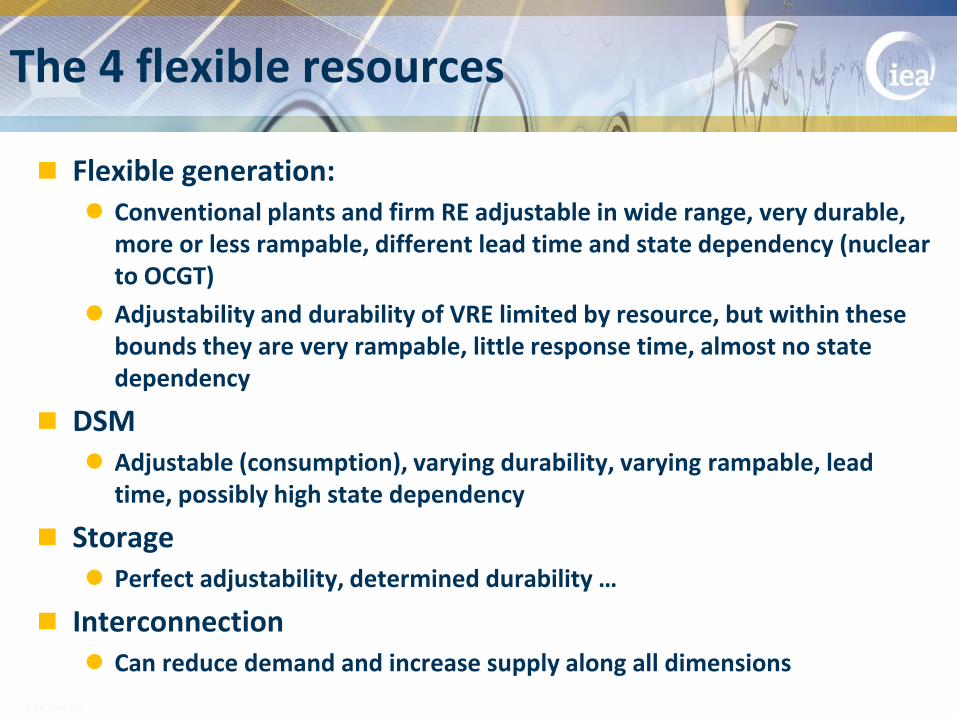
Flexible generation: Conventional plants and firm RE adjustable in wide range, very durable,
more or less rampable, different lead time and state dependency (nuclear to OCGT)
Adjustability and durability of VRE limited by resource, but within these bounds they are very rampable, little response time, almost no state dependency
DSM Adjustable (consumption), varying durability, varying rampable, lead
time, possibly high state dependency
Storage Perfect adjustability, determined durability …
Interconnection Can reduce demand and increase supply along all dimensions
The 4 flexible resources

© OECD/IEA 2014
Integration vs. transformation
Classical view: VRE are integrated into the rest
Integration costs: balancing, adequacy, grid
More accurate view: entire system is re-optimised
Total system costs
Integration is actually about transformation
Remaining system
VRE
FLEXIBLE Power system
• Generation • Grids • Storage • Demand Side Integration
© OECD/IEA 2014 49

© OECD/IEA 2014
2. Make better use of
what you have
Op
eratio
ns
1. Let wind and solar play their
part
3. Take a system wide-strategic
approach to investments!
System friendly
VRE
Technology spread
Geographic spread
Design of power
plants
Three pillars of system transformation
© OECD/IEA 2014 50
Investm
ents

© OECD/IEA 2014
Exercise 1: Netload & Integration effects
© OECD/IEA 2014 51

© OECD/IEA 2014
Session 2: International context
1. Co-ordination and consolidation of balancing areas
2. Benefit of sub-hourly scheduling and rapid dispatch
3. Centralised vs non-centralised power markets
4. Definition of market products and timing of electricity trade
Exercise 2: Benefit of rapid system operation
Session agenda
© OECD/IEA 2014 52

© OECD/IEA 2015
Policy and regulatory framework
Border = seam
Policy and regulatory framework Policies 2
3 Operational rules / Markets
Interconnectors 1
Country/ Area A
Country/ Area B

© OECD/IEA 2015
Impact of wind and solar power
Comparison of net power exchanges on the French-German border with wind and solar power generation in Germany, sept. 2011 (MW)
MW
MW
Production Exchanges
Imports from France
Exports to France
Net exchanges Wind production in Germany Wind and solar production in Germany
Source: RTE

© OECD/IEA 2015
PJM footprint
Note: this map is without prejudice to the status of a sovereignty over any territory, to the delimitation of international frontiers and boundaries, and to the name of any territory, city or area.
Source: Monitoring Analytics, 2013.

© OECD/IEA 2015
Price patterns before and after integration
Note: this map is without prejudice to the status of a sovereignty over any territory, to the delimitation of international frontiers and boundaries, and to the name of any territory, city or area.
Source: PJM, 2013d.
Pre-integration price pattern (PJM) Post-integration price pattern (PJM)
140
110
40
Marginal Cost (USD/MWh)

© OECD/IEA 2015
Indicative regulating requirements for a balancing authority as a function of peak demand (%)
Indicative regulating requirements for a balancing authority as a function of peak demand (%)
0.0%
0.1%
0.2%
0.3%
0.4%
0.5%
0.6%
0.7%
0.8%
0.9%
1.0%
0 20 40 60 80 100
Peak demand (GW)
Perc
enta
ge o
f pea
k de
man
d
Source: NREL, 2011.

© OECD/IEA 2014
Germany has four balancing areas (historic reasons)
Reserve sharing mechanism across four areas
Reduced requirements despite rapid increase of VRE
Co-operation with neighbours
© OECD/IEA 2014 58
0
10
20
30
40
50
60
0
1
2
3
4
5
6
7
8
2008 2009 2010 2011 2012
Inst
alle
d V
RE
cap
acit
y (G
W)
Res
erve
req
uir
emen
t (G
W) VRE
capacity
Upward reserves
Downward reserves
+100%
+0%
-40%
Required frequency restoration reserves in Germany

© OECD/IEA 2014
Short scheduling intervals (5min best practice)
Adjust schedules up to real time (5min best practice)
Generation and transmission schedules
© OECD/IEA 2014 59
6 7 8 9
Cap
acit
y (M
W)
Time (hours)
Actual load curve
Load schedule -15 minutes
Load schedule -60 minutes
Balancing need 15 min schedule
Balancing need60 min schedule
Impact of scheduling interval on reserve requirements, illustration

© OECD/IEA 2014
… but you also need the tools to do this Example: The Control Centre for Renewable Energy - CECRE
© OECD/IEA 2014 61
© OECD/IEA 2014
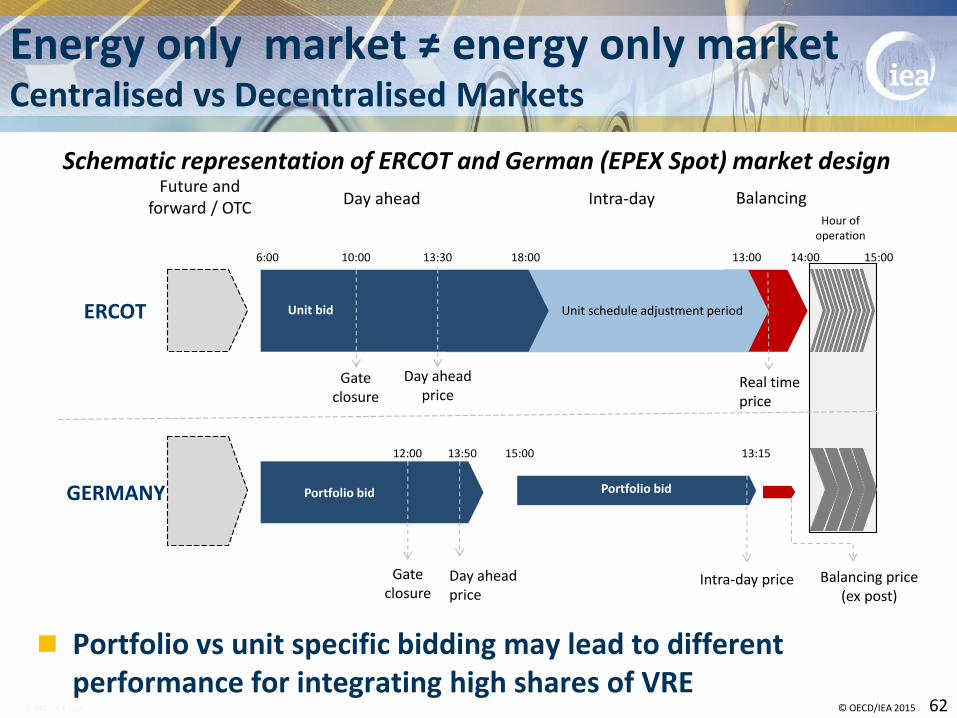
Portfolio vs unit specific bidding may lead to different performance for integrating high shares of VRE
Energy only market ≠ energy only market Centralised vs Decentralised Markets
© OECD/IEA 2015 62
Day aheadFuture and
forward / OTCIntra-day
18:00
13:50
6:00 10:00 13:30 14:0013:00
13:1512:00
Unit schedule adjustment period
Intra-day price Balancing price(ex post)
Real timeprice
Day aheadprice
Day aheadprice
Portfolio bid Portfolio bid
Unit bid
Gateclosure
Gateclosure
ERCOT
GERMANY
BalancingHour of
operation
15:00
15:00
Schematic representation of ERCOT and German (EPEX Spot) market design

© OECD/IEA 2014
Are your operating reserve and system service definitions VRE ready?
Example Ireland DS3 programme
System service definitions Prepared for a variable future?
© OECD/IEA 2014 64
• Synchronous Inertial Response• Fast Frequency Response• Fast Post-Fault Active Power
Recovery
• Ramping Margin
0 – 5s 5 – 90s 90s – 20min 20min – 12hr
Inertial
Response
Reserve
Ramping
POR
SOR
TOR1
TOR2
RR
Ramping
SIR
FFR
time
Source: EirGrid • Dynamic Reactive Power
ms – s
Transient Voltage Response
Voltage Regulation
Network
Dynamic
Reactive
Power
Network
Adequacy
Grid 25
s – min min – hr
Steady-state
Reactive
Power
• Steady-state Reactive Power
Frequency Services
Voltage Services

© OECD/IEA 2014
Session 3: International context
1. Transmission grid planning and RE deployment
2. Renewable support policies and grid integration
Session agenda
© OECD/IEA 2014 65

© OECD/IEA 2014
Grid planning
© OECD/IEA 2014 66
© OECD/IEA 2014
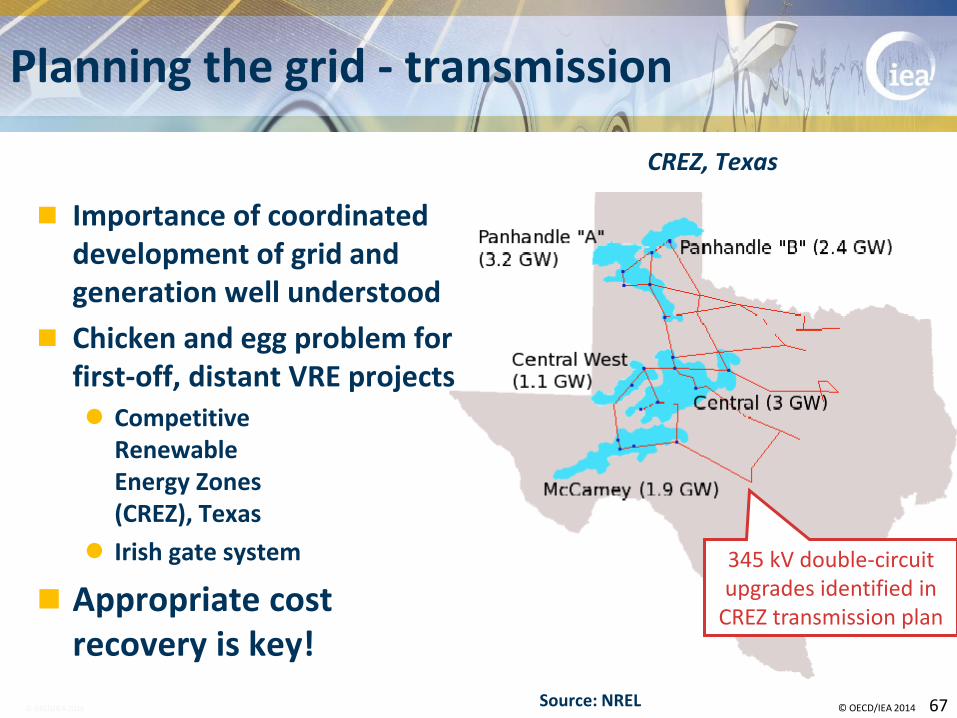
Importance of coordinated development of grid and generation well understood
Chicken and egg problem for first-off, distant VRE projects Competitive
Renewable Energy Zones (CREZ), Texas
Irish gate system
Appropriate cost recovery is key!
Planning the grid - transmission
© OECD/IEA 2014 67
345 kV double-circuit upgrades identified in
CREZ transmission plan
CREZ, Texas
Source: NREL

© OECD/IEA 2014
About ENTSO-E, an EU institution with legal mandates
41 TSOs
from 34 countries
525 million
citizens served
1000 GW generation
capacity
310 thousands km
of transmission lines
Ten-Year
Network
Development
Plans
Adequacy
forecasts R&D plans
Tools for
Market
Integration
Network
Codes
Source: ENTSO-E

© OECD/IEA 2014
Ten Year Network Development Plan
© OECD/IEA 2014 69
Source: ENTSO-E

© OECD/IEA 2014
Ten Year Network Development Plan
© OECD/IEA 2014 70
50000 km of new or refurbished investments 21000 km of new HVDC lines 15% of all investments are upgrade of existing assets
Source: ENTSO-E

© OECD/IEA 2014
Renewable energy policy and integration
© OECD/IEA 2014 71

© OECD/IEA 2014
As policies provide sufficient remuneration, deployment picks up and costs decrease
Policies have stimulated deployment at falling costs in some circumstances
© OECD/IEA 2015 72
Development of LCOE, remuneration levels and installed capacity for utility scale PV, Germany
LCOE Revenues Capacity

© OECD/IEA 2014
Different sub-technologies show different response patterns to market conditions
Residential customers show more ‘inertia’ in response to profitability of investments
Adjusting policies to sub-technology
© OECD/IEA 2015 73
- Capacity
Residential Commercial Utility
LCOE Revenues
Differences between solar PV sub-segments in Italy
0
10
20
30
40
50
60
70
80
90
100
2005 2006 2007 2008 2009 2010 2011 2012 2013 2014 2015
c$/kWh
3.51 GW
0.00
1.00
2.00
3.00
4.00
5.00
6.00
GW
0
10
20
30
40
50
60
70
80
90
100
2005 2006 2007 2008 2009 2010 2011 2012 2013 2014 2015
c$/kWh
11.88 GW
0.00
1.00
2.00
3.00
4.00
5.00
6.00
GW
0
10
20
30
40
50
60
70
80
90
100
2005 2006 2007 2008 2009 2010 2011 2012 2013 2014 2015
c$/kWh
3.73 GW
0.00
1.00
2.00
3.00
4.00
5.00
6.00
GW

© OECD/IEA 2014
Adjusting policies to sub-technology
© OECD/IEA 2015 74
0
1
2
3
4
5
6
2005 2006 2007 2008 2009 2010 2011 2012 2013 2014
GW
PVRES PVCOMM PVUT
0
1
2
3
4
5
6
2005 2006 2007 2008 2009 2010 2011 2012 2013 2014G
W
PVRES PVCOMM PVUT
Italian PV sub – segments additional capacity German PV sub – segments additional capacity
Rapid spiked in deployment occurred in the commercial and utility solar PV market segments
FITs did not lead to out-of-control deployment in residential segment
© OECD/IEA 2014
Adjusting policies to sub-technology
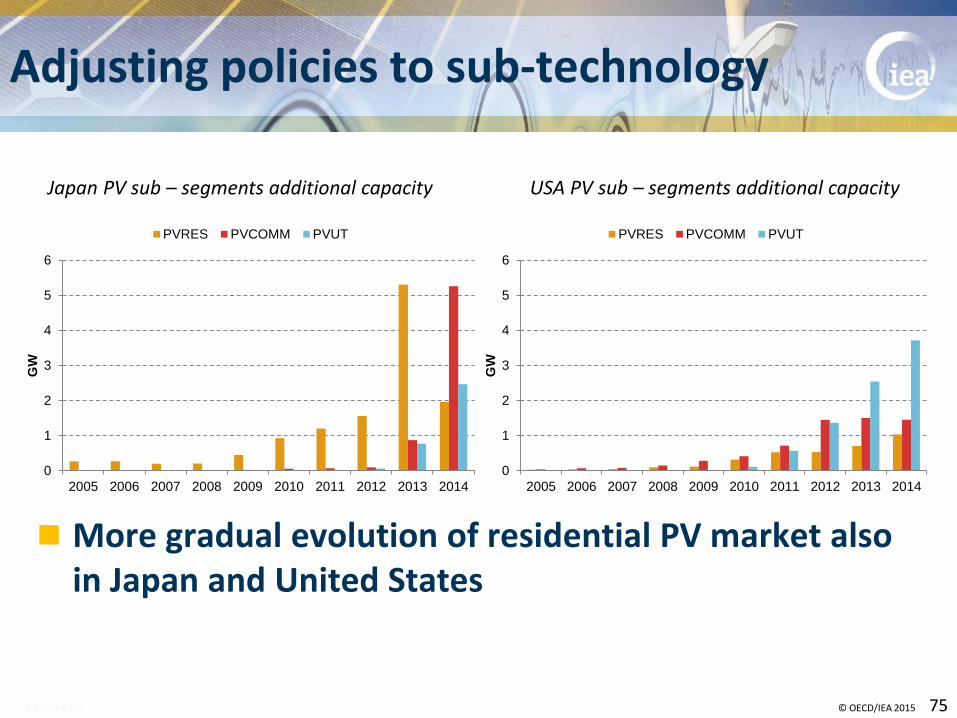
© OECD/IEA 2015 75
Japan PV sub – segments additional capacity USA PV sub – segments additional capacity
More gradual evolution of residential PV market also in Japan and United States
0
1
2
3
4
5
6
2005 2006 2007 2008 2009 2010 2011 2012 2013 2014G
W
PVRES PVCOMM PVUT
0
1
2
3
4
5
6
2005 2006 2007 2008 2009 2010 2011 2012 2013 2014
GW
PVRES PVCOMM PVUT

© OECD/IEA 2014
Reaping the benefit of competition …
Revenues
Competitive procurement can reduce policy cost and stimulate further cost reductions
Land-based wind >25 MW in Italy
Auction introduced - Capacity
0
2
4
6
8
10
12
14
16
18
20
2005 2006 2007 2008 2009 2010 2011 2012 2013 2014 2015
c$/kWh
8.54 GW
0.00
1.00
2.00
3.00
4.00
5.00
6.00
GW
Land-based wind >25 MW in Brazil
0
2
4
6
8
10
12
14
16
18
20
2005 2006 2007 2008 2009 2010 2011 2012 2013 2014 2015
c$/kWh
5.46 GW
0.00
1.00
2.00
3.00
4.00
5.00
6.00
GW
© OECD/IEA 2014
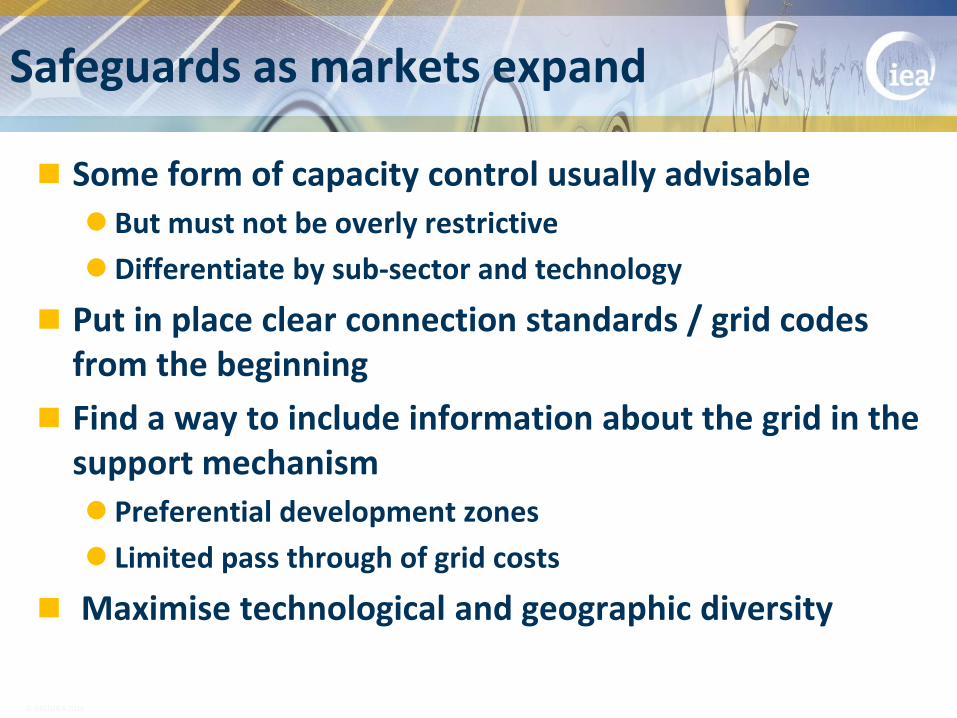
Some form of capacity control usually advisable
But must not be overly restrictive
Differentiate by sub-sector and technology
Put in place clear connection standards / grid codes from the beginning
Find a way to include information about the grid in the support mechanism
Preferential development zones
Limited pass through of grid costs
Maximise technological and geographic diversity
Safeguards as markets expand

© OECD/IEA 2014
1. Excessive geographic, technical concentration
Key lessons: analysis based diversification of location and technology
2. Ill-adapted technical performance standards
Key lessons: focus on grid codes! (fault ride through, 50.2 Hertz); visibility and controllability
3. No or ineffective VRE production forecasts
Key lessons: use forecasts in unit commitment and dispatch of other generation
Three typical mistakes to avoid when deployment begins
© OECD/IEA 2014 78