reflections on the “end of growth” and on david gordon’s “big stick” explanation of...
TRANSCRIPT

Reflections on the “End of Growth” and on David Gordon’s “Big Stick”
Explanation of Stagnant Real WagesRobert J. Gordon, Northwestern University and
NBERIrene and Bernard L Schwartz Lecture
New School, New York CityOctober 25, 2013

Some Biographical Connections
• Me 1940, him 1944• Me hated sports and athletics, he was all
around guy – champ at discus in HS• He was always 3 years behind in chronology
but much closer in mental age• Would you believe – 1955-57 every top 40
record? (or was it just the top 10?)• We both went to Harvard, class 1962 vs 1965

A Preview of the Talk
• The first third, the reasons for my pessimism about future growth
• The second third, a summary and critique of DMG’s creative and revolutionary 1996 book, Fat and Mean
• The last third, trying to make sense of rising inequality, combining both brothers’ ideas

“Is U.S. Economic Growth Over?”(NBER Working Paper, August 2012
• A title provokes a controversy• The startling prediction: disposable income of the
bottom 99% over some indefinite future will slow– from 2.0 percent annual growth achieved 1891-2007– to 0.2 percent annual growth 2007 out to say 2032
• It was the audacity to contrast those two numbers, 2.0 vs. 0.2, that got everybody excited and eager to debate– Doubling in 35 years vs. 350 years
Blame for Slower Growth Shared:Six Headwinds and “Faltering” Innovation
• All the criticism was directed at the “faltering innovation” subtitle. – As if I were predicting innovation would decline to zero
forever starting tomorrow– Headwinds were ignored because they are so
uncontroversial• But tonight’s restatement, which still takes us from
2.0 to 0.2, does not require any slowdown of innovation starting tomorrow. That slowdown happened 40 years ago.

Definition Connecting the Standard of Living and Productivity
• Standard of living = total output per person (Y/N)
• Productivity = total output per hour (Y/H)• The growth rate of the standard of living
and of productivity can differ if growth in hours per person (H/N) is positive or negative
Y/N Ξ Y/H * H/N

Review: How Is Growth in GDP per Person Related to Productivity?

The Four Headwinds Start with Demographics
• Hours per capita (H/N) declined at an annual rate of -0.77 percent per year 1996-2012.– How much of that -0.77 1996-2012 is due to higher
unemployment? Answer: about 0.15. If the unemployment rate were now 4.8, that -0.77 would be
-0.62.My long-run forecast is not -0.6 but -0.4, a very conservative number compared to the last 16 years– Combines baby-boom retirement with steady labor-
force drop out of youth, prime-age men, and even prime-age women.

Second Headwind: Education
• Percent of population in 1900:– High school degrees 10%.– College degrees 3%
• A major driver of that epochal 20th century productivity growth was education– High school completion today less than 1975– Most people drop out of community colleges– The U. S. is the only developed country where the educational
attainment of the 55-64 cohort is the same as 25-34 cohort (Goldin-Katz).• U.S. has dropped from #1 to #16 in college completion as percent
of population• Jorgenson consensus effect of educational stagnation on future
growth, -0.3 percent future growth
Third Headwind: Inequality
• Paul Krugman started writing about the top 1% grabbing most of the income way back in the 1992 Presidential campaign, and it continues today
• David highlights stagnation in real hourly earnings after 1972• Piketty Saez data. U-shaped share of top 1% since 1913. So
1913-2012 bottom 99% kept up with the average. Gap 0-99 vs 0-100 only -0.06% 1913-2012.
• But for 1993-2012 Piketty-Saez gap between average real income of total vs. bottom 99% is -0.53 percent per year.
• This is continuing, it’s not over. Count the ways– CEO pay, sports and entertainment stars– Aggressive Caterpillar like wage pushbacks – lower wages, two-tier wages,
shaving pension and medical care benefits– Firms pushing employees into part-time work
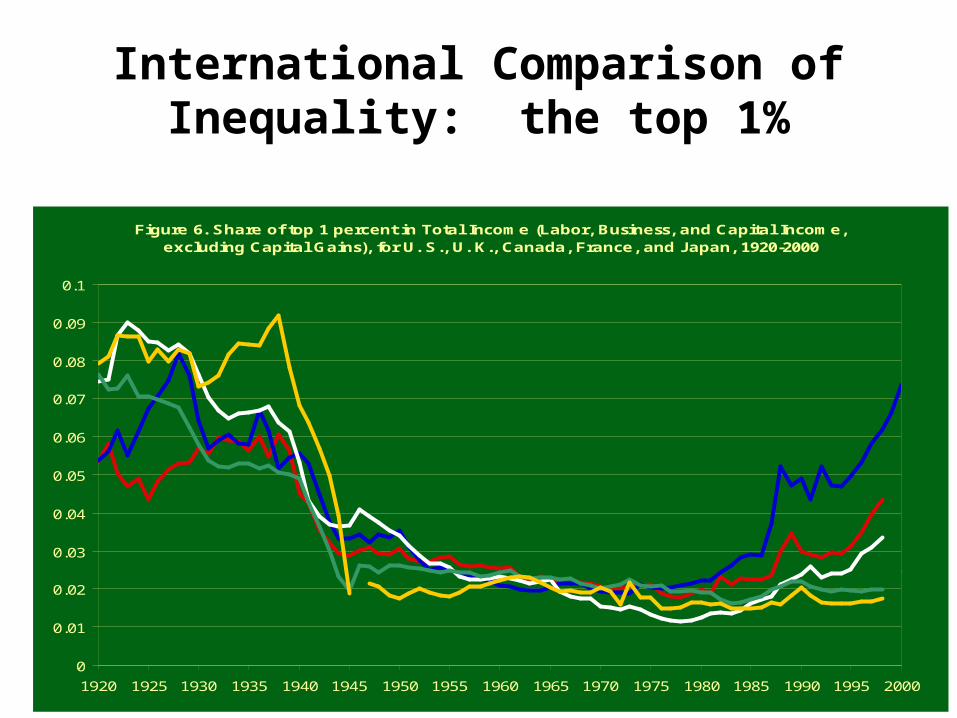
International Comparison of Inequality: the top 1%
Figure 6. Share of top 1 percent in Total Income (Labor, Business, and Capital Income, excluding Capital Gains), for U. S., U. K., Canada, France, and Japan, 1920-2000
0
0.01
0.02
0.03
0.04
0.05
0.06
0.07
0.08
0.09
0.1
1920 1925 1930 1935 1940 1945 1950 1955 1960 1965 1970 1975 1980 1985 1990 1995 2000
U.S.
Canada
U.K.
Japan
France

Fourth Headwind: Eventually We Have to Raise Taxes and/or Cut Entitlement Spending Growth
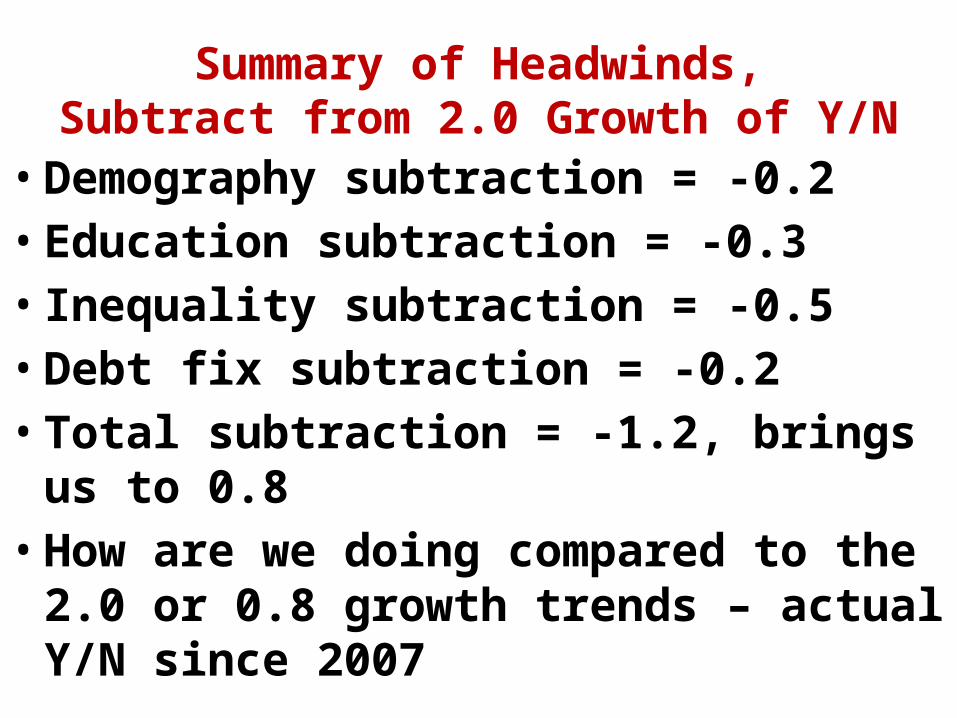
Summary of Headwinds,Subtract from 2.0 Growth of Y/N
• Demography subtraction = -0.2• Education subtraction = -0.3• Inequality subtraction = -0.5• Debt fix subtraction = -0.2• Total subtraction = -1.2, brings us to 0.8• How are we doing compared to the 2.0 or 0.8
growth trends – actual Y/N since 2007

Actual U.S. Economy is 13% Below the Historic Trend and 5% Below
the Pessmistic Trend

Review: How Is Growth in GDP per Person Related to Productivity?

The Second Industrial Revolution vs. the Third Industrial Revolution

Why Was Growth So Fast 1891-1972? Five Dimensions of Growth
– Electricity: Light, power, elevators, streetcars, subways, fixed and portable electric machines, kitchen appliances, air conditioning
– Motor Vehicles: Cars and trucks replace horses, personal travel is a new industry, commercial air transport shrinks the world
– Running water and sewers: Greatest event in the history of female liberation, conquest of infant mortality
– Info/Communication/Entertainment. Newspapers, telephone, phonograph, radio, motion pictures
– Change in working conditions: from hot and dirty agriculture and industry to air-conditioned offices
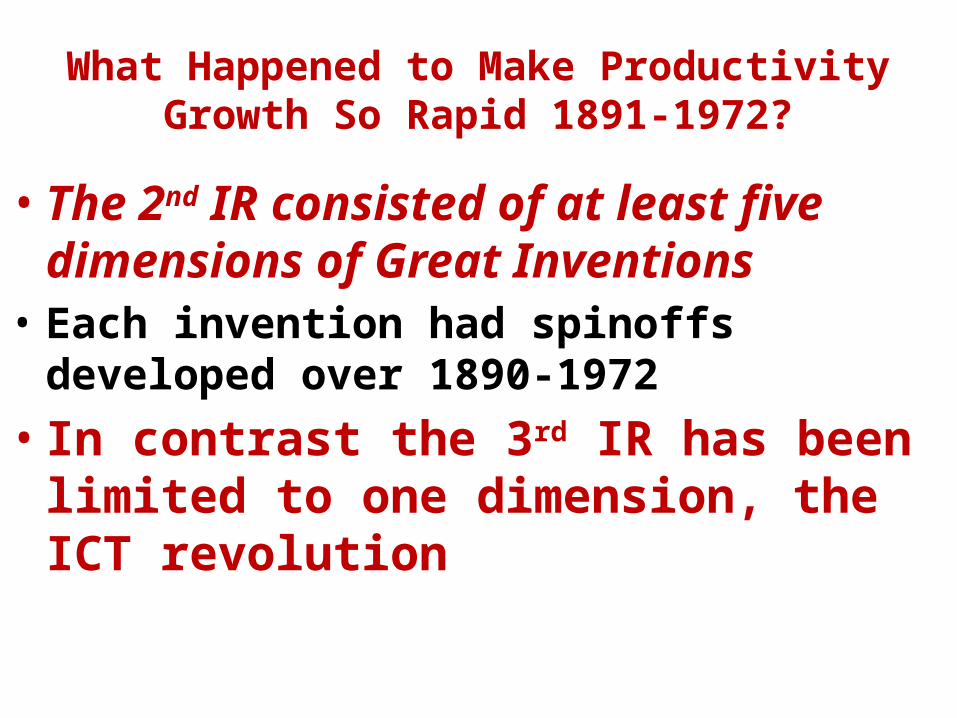
What Happened to Make Productivity Growth So Rapid 1891-1972?
• The 2nd IR consisted of at least five dimensions of Great Inventions
• Each invention had spinoffs developed over 1890-1972
• In contrast the 3rd IR has been limited to one dimension, the ICT revolution

Summing Up: How Much to Subtract from 2.0 Historic Growth in Y/N?
• Four headwinds took us from 2.0 to 0.8, ignoring the issue of innovation and inventions.
• Let’s take the easy assumption that innovation will continue in the future as 1972-2012
• Summary: subtraction of 0.6 for slower impact of innovation after 1972 compared to before 1972.

Summary of Subtraction from 2.0 to 0.2, Disposable Real Income per Capita of Bottom
99%
0
0.4
0.8
1.2
1.6
2
2.4
2.0
1.8
1.5
1.0
0.8
0.2
Perc
ent

What a Stunningly Optimistic Outlook!
• Think what it means to assume that innovation in the next 40 years will match the last 40.
• The next 40 years must bring us innovations as important as– The PC, the internet, web browsing, e-commerce– Mobile phones, digital music, smart phones & pads– Digitalization of library catalogues and parts catalogues– Bar-code scanning, the ATM machine, i-tunes, cable TV,
CDs, DVDs, movie streaming

Summary pre-2007 with 2007-2032

Think of What Has Been Omitted
• Charles Murray’s Social Collapse in Fishtown, the bottom 1/3 of the white population– Percent of children of women aged 40 living with both
biological parents went from 95% in 1960 to 38% in 2010• American medical care system wastes $1 trillion per
year compared to Canada (Cutler and co-author), but life expectancy US #38 vs. Canada #4
• Mountains of student debt are fundamentally changing life of 20 and 30 year olds.
• So much of this is unnecessary because it is not happening in other countries. LOOK NORTH!

David’s 1996 Book Fat and Mean
• Strikingly Original, combines three themes• Fat. American corporations are extremely
overstaffed with managers compared to Japan and leading European countries. “Bureaucratic Bloat” (BB)
• Mean. These corporations are responsible for the end of growth in real wages of production workers
• The Big Stick. The method by which the large corporations drive down real wages, compared to “carrot” in other countries. “Coercion” compared to “Cooperation”

Relating the Three Hypotheses
• These hypotheses could be independent• We could have BB whether real wages rise or
stagnate• We could have stagnating real wages without
BB• We could have BB with or without the “big
stick”• Linking these together as inseparable is the
achievement of the book

The Book’s Achievement
• The book is extremely persuasive• If you come to book ignorant of BB or believing
that stagnant real wages are due to something other than the big stick, the arguments in the book are so strong that they wrestle you to the ground.
• His evidence covers a wide range– Academic journal papers– Business-oriented journalism– International comparison studies– His own interviews with his team
An Assessment by an Outsider
• Nick Bloom at Stanford, co-director of the NBER’s productivity and innovation research program
• His comments about managers enriching themselves at the expense of workers seems like a very insightful take on the wave of rising inequality we’ve seen since the late 1980s but only started to be noticed in the late 1990s. That is very few people spotted it this early - I think the first economics piece on the by Katz and Murphy was maybe 1997. On this front the evidence from folks like Saez, Katz and Autor is both the top 1% have become incredibly rich, and the 90-10 split has also risen. So his work was far ahead of the curve, and foreshadowed the Occupy movement 10 years later.
Distinctive Features of the Argument
• In two ways the book goes beyond suggesting that top-heavy corporations use the big stick to suppress wage increases.
• (1) It denies the importance of conventional explanations of wage stagnation, esp. skill-biased technical change and globalization
• (2) It goes beyond wage stagnation to blame the big stick for many social ills, from rising divorce rates to teenage pregnancy to drug-related gang crime.

The Reader is Torn, Despite the Power of the Arguments
• Even if the BB and big stick partially explain stagnant wages, is there no room left for the conventional explanations: skills and globalization? Aren’t complex problems often the result of multiple causes rather than of a single cause?
• Can the socio-economic decline represented by fewer marriages, more divorces, and fewer children living with both biological parents be blamed on large corporations?
• Are large corporations entirely responsible for determining wages? What about the large service sector and millions of small businesses?

Growing Consensus Among Economists Supports David’s View
• 15 years after DMG wrote, many economists have come to a consensus that the behavior of American corporations have changed in the direction that David perceived.
• A switch from maximizing stakeholder value (shareholders, employees, customers) to a sole emphasis on shareholder value
• David’s Reich quote: “The social contract is no longer with us”
• Centered on the 1990s with the big increase in the % of executive pay depending on stock options (counted as labor income)

The Business Press Concurs with David: There are Two Types of Companies
• David’s two shining examples of the “carrot” approach in the U.S. setting are two steel companies, Nucor and Magna
• More recently the business press has been full of contrasts between Costco and Wal-Mart.
• Whole Foods’ “whole paycheck” high pricing partly spills over to unusually good working conditions and benefits for its employees

The Big Stick Continues and Creates Growing Inequality
• The “poster child” of the big stick is Caterpillar Tractor
• Willing to take strikes to impose lower wages, cuts in benefits, higher employee contributions
• Its report this week showed revenue down from $66 to $55 billion. Will its CEO reduce his $20 million annual paycheck?

Support from Nick Bloom about“The Big Stick”
• On “big-stick” it is true US firms are more aggressive in pay and promotions That is more strongly merit based. I would call that meritocratic, but you could also call in big-stick. That is, in places like France promotion is more tenure based and you don’t get fired. So in France if you are good it’s 10 years until promotion and if you are bad you stay. In the US if you are good it’s 3 years until promotion and if you are bad it’s improve or out. Again personally I see that as good – merit and hard-work drivers your outcomes (and you control your own future) – but it’s also more “big-stick” in the sense that poor performance does get punished.
• Note that this is the “big stick” applied WITHIN the managerial class and not directed to workers.

Qualifications from Nick Bloom about BB• In terms of US firms they tend to be incredibly well managed
both at home and abroad. For example, US firms still clearly lead the pack in manufacturing, with a similar result in retail. Not surprisingly their multinationals are globally very dominant. Their managers also work harder with the longest weeks, least sick-leave and shortest holidays. For example, they work about 1/3 more hours per year than the French. On this basis I don’t think they are bloated, and I’ve never heard anecdotally or seen any evidence claiming they have too many managers – visiting US factories they are strikingly efficient, so if anything they have too few managers because the current ones have to work such long hours and be so efficient (although they get paid a lot more for it….)

David is Right About Europe,at Least Northern Europe
• Union strength has been preserved• Germany has thrived with the cooperative model, union
members on every board of directors– But German unions agreed to a national model of wage
moderation ten years ago• The European model depends on climate:– It works in Sweden, Nordic countries, Germany, Austria– It does not work in France, Italy, Spain, Portugal, Greece
• Unions have created economic sclerosis in France and Italy with their ability to block any plant closings or employment reductions

Another Strength of David’s Argument
• His Chapter 6 contrasts productivity growth in the coercive (“stick”) economies vs. the cooperative (“carrot”).
• The data support his view that productivity growth was faster in Western Europe than in the US before 1995. This supports the “cooperative model” compared to the “coercive model”.
• But the tables turned after 1995, when he wrote.

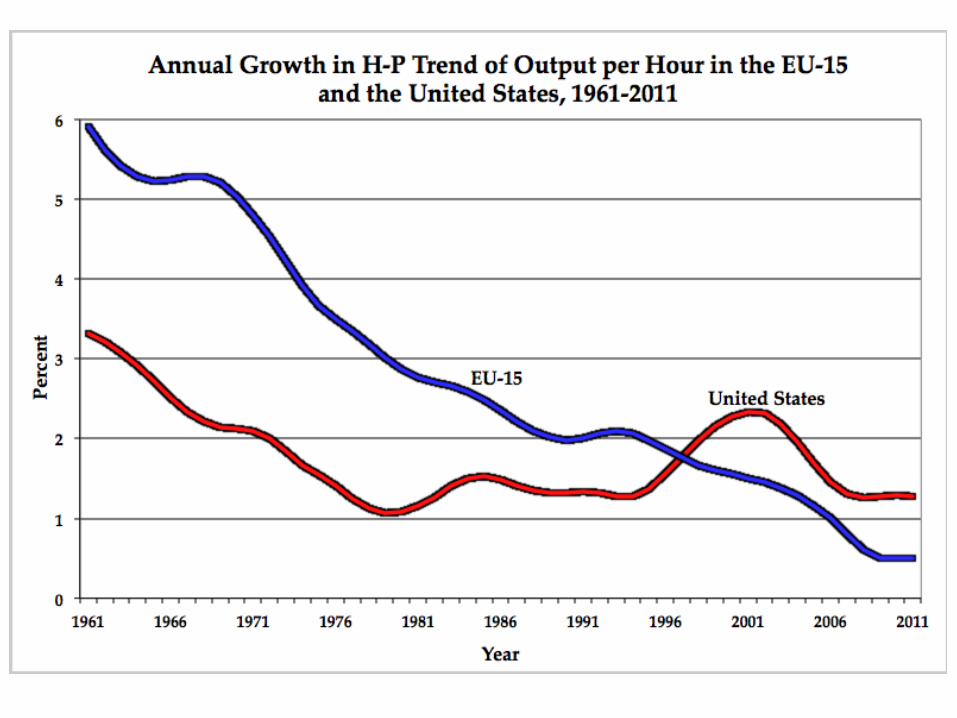
What Caused the Post-1995Transition to Slower EU Productivity Growth
• Europe didn’t switch from carrots to sticks and the US didn’t switch from sticks to carrots
• Consensus view from the best European research• The EU productivity shortfall was greatest in
wholesale, retail, finance• Wholesale and retail were unable to benefit from
the internet/computer revolution• Land-use planning. It’s much harder to develop
big box stores in Europe

The Last Part: Causes of Increased Inequality since 1975
• Two parts to the story: the top and the bottom 90%
• The bottom 90% overlaps with David• My list– Reduced real minimum wage– Reduced union penetration– Globalization: both off-shoring and imports– Low-skilled Immigration
• David overlaps on minimum wage, unions, but denies globalization

Inequality at the Top
• Piketty-Saez data. 1993-2012 the top 1% earned about 55% of total income gains. Why?
• Economics of super-stars. Oprah, Alex Rodriguez• Explosion of financial rewards that enriched some
while causing the “Great Recession”– Many economists think the real output of the financial
sector is greatly overstated– Rents, not output
• Corporate top management, CEO salaries from 40x to 400x, fueled by stock options

International Comparison of Inequality: the top 1%
Figure 6. Share of top 1 percent in Total Income (Labor, Business, and Capital Income, excluding Capital Gains), for U. S., U. K., Canada, France, and Japan, 1920-2000
0
0.01
0.02
0.03
0.04
0.05
0.06
0.07
0.08
0.09
0.1
1920 1925 1930 1935 1940 1945 1950 1955 1960 1965 1970 1975 1980 1985 1990 1995 2000
U.S.
Canada
U.K.
Japan
France

Solutions?
• David’s solutions• (1) Raise the minimum wage, index to price level• (2) “Ease path to unions”• (3) Make “contingent employment” less
attractive to employers• (4) Establish an “investment bank” to reward
good firms• (5) Improve education and training
Comments
• (1) Raise the minimum wage, index to price level– I agree, boost poverty incomes and take the risk on
unemployment• (2) “Ease path to unions”
– Separate comments• (3) Make “contingent employment” less attractive to
employers– Separate comments
• (4) Establish an “investment bank” to reward good firms– Not feasible, how do you choose “good firms”?
• (5) Improve education and training– Everyone agrees, on the top of every agenda

Unions
• At age 7, I learned from mom and dad that the Taft-hartley Act was the greatest threat to the nation since WWII.
• US situation – all foreign auto investment in southern states.
• Bankruptcy of Detroit is indirectly due to T-H law (and also overreach of UAW)– $1400 cost overhang drove GM and Chrysler to
bankruptcy• My problem with unions: featherbedding

My Biggest Objection
• Chapter 5. The Big Stick is responsible for all of society’s ills, no conventional explanations allowed.
• My focus on his many topics, black youth crime.• His entire explanation is “deteriorating job
conditions”• He does not notice that the outcomes for black
women and black men have been completely different. The reason is crime. Males do it, females don’t.

Are black young men victims or aggressors?
• Let’s all agree that blacks are disproportionally sent to prison for drug offenses. The solution to this is to make drugs legal (see my list at the end of omitted topics)
• But black male youth crime goes way beyond drug possession and contributes to poverty.
• David comes close to excusing black youth crime. • Here’s a quote (p. 141):– “if you’re white you do white collar larceny. Blue collar
workers can steal from loading docks. Blacks have no alternative.”

Why I feel so strongly about this
• Black youth crime is driving the black middle class out of Chicago as it long ago did in Detroit
• 91% of murder victims in Chicacgo are black-on-black.
• David thinks that all jobs are created by large big stick corporations. But the heart and soul of any city is the locally owned businesses which thrive or die depending on the behavior of the local population.
• The Chicago Tribune from October 20, 2013.

Policy Solutions:Not Mentioned by Either Brother
• Role of dysfunctional US medical care system in driving down wages, pushing workers into part-time. Make medical care a right of citizenship!
• Immigration: cure to rising dependency ratio, source of NYC’s dynamism. 1865-1913, no passports
• Legalizing drugs: if drugs had been legal since 1975, millions of young black men would have escaped the lifelong stigma of a criminal record and the US would have saved $1 trillion