reconfigurable wideband ground receiver field testing
TRANSCRIPT

1
IPN Progress Report 42-191 • November 15, 2012
Reconfigurable Wideband Ground Receiver Field Testing
Norman Lay,* Arby Argueta,* Andre Tkacenko,* Meera Srinivasan,* and Kenneth Andrews*
* Communications Architectures and Research Section.
The research described in this publication was carried out by the Jet Propulsion Laboratory, California Institute of Technology, under a contract with the National Aeronautics and Space Administration. © 2012 California Institute of Technology. U.S. Government sponsorship acknowledged.
abstract. — The Reconfigurable Wideband Ground Receiver (RWGR) system is a variable-data-rate, reprogrammable hardware/software receiver developed to meet the wide range of telemetry demodulation processing needs of the Deep Space Network (DSN). In this article, we report results from a number of field tests with the RWGR deployed to the Deep Space Station 13 (DSS-13) experimental ground station.
I. Introduction
To help meet the wide range of present and future telemetry processing needs of the Deep Space Network (DSN), which span a range of data rates varying from less than 10 baud (symbols/second or baud) to several hundreds of Mbaud, DSN Advanced Engineering has developed a number of modular, ground-based telemetry receiver capabilities in the form of the Reconfigurable Wideband Ground Receiver (RWGR). The RWGR architecture provides variable-data-rate, reprogrammable receiver functionality to accommodate a continuous range of data rates from 4 baud to 320 Mbaud.
In order to support such a large data-rate span, the RWGR employs a combination of field-programmable gate array (FPGA)–based hardware and software processing [1,2]. Specifically, higher rate, direct modulation telemetry signals with data rates ranging from 39.0625 kbaud to 320 Mbaud are demodulated using an FPGA hardware platform, as described in [1]. In contrast, lower rate signals (suppressed carrier, residual carrier, and subcarrier modula-tion types) with data rates typically ranging from 4 baud to 1 Mbaud are processed using a software-based demodulator as described in [2]. While the hardware platform is capable of handling higher data rates, the software platform provides additional functionality by enabling quick development of more complex or specialized signal processing (e.g., see [2] for an example of co-channel interference cancellation).
In this article, we present results from field test experiments carried out with the RWGR deployed to the 34-m antenna Deep Space Station 13 (DSS-13) located at the Goldstone Deep Space Communications Complex (GDSCC). Signal diagnostics and demodulated te-lemetry from the RWGR were captured during a series of tracks of the Mars Reconnaissance

2
Orbiter (MRO) and the Lunar Reconnaissance Orbiter (LRO) downlinks. The MRO X-band downlink employed quadrature phase-shift keying (QPSK) modulation at a data rate of 1.5 Mbaud and the LRO Ka-band downlink utilized offset QPSK (OQPSK) modulation at a data rate of 114 Mbaud. Together, these signals provided convenient opportunities to vali-date the functionality of the RWGR FPGA-based receiver processing.
In Section II, we provide a brief, high-level overview of the RWGR platform. The configu-ration interface used for the RWGR is described in Section III. In Section IV, we detail the equipment configurations used at DSS-13 for the field tests carried out with MRO and LRO. The results of field experiments are provided in Section V. Finally, in Section VI, concluding remarks are made.
II. Receiver Platform Overview
The RWGR system architecture employs hardware and software processing elements that are used to demodulate wideband and lower-rate telemetry signals, respectively (see Fig-ure 1). All signals input to the RWGR are processed by front-end FPGA hardware intended to lower the sample rate to a level near to or exactly at the target rate.
BasebandMixer
DopplerPredict
File
Open-Loop
Storage
UTCTime NCO NCO
Filter andDownsample
Filter andDownsample
1280Msps
4 spsProgrammableMatched Filter
SymbolSampler
LoopFilter
LoopFilter
GardnerErrorFunction
CostasErrorFunction
SoftSymbolsOut
IQ
Full Rate Soft SymbolInterface Currently AvailableOnly on Laboratory Platform
Specialized Mission-Specific Processing• Entry, Descent, and Landing• High Dynamics• Launch• Data Replay
• Rapid Development• Remote Upgrade Development
Station
Software ReceiverProcessor
HardwareReceiver
FPGA Firmware That Runs on Multiple Platforms: PRSR/WVSR, DDA, BVR
Suite of Scripting Software Functions That Can Be Used for Detailed Signal Analysis or Migrated to Real-Time Receiver Operation — Accepts WVSR Record Format
SoftwareReceiver
Wideband Telemetry• Up to 320 Mbaud• QPSK, OQPSK, BPSK• Programmable Pulse Shape
Predict Interface andImplementation Is
Identical toWVSR/PRSR
ADCAnalogIF in
678
Figure 1. RWGR system architecture.
A more detailed block diagram of the FPGA-based front-end hardware is shown in Fig-ure 2 [1]. Intermediate frequency (IF) analog-to-digital converter (ADC) samples are cap-tured at a fixed sample rate of 1.28 GHz. These samples are then routed from the input FPGA to either the filter-decimate FPGA or the receiver core FPGA, depending upon the target data rate. Power-of-two decimation operating over a range from 8:1 to 1024:1 is car-ried out in the filter-decimate FPGA. Support for the highest data rate modes bypasses the filter-decimate and is routed directly to the receiver FPGA, which incorporates a continu-ously variable decimation factor to provide a nominal match to the four sample/symbol

3
Figure 2. RWGR FPGA-based front-end processing block diagram.
demodulator core processing. The architecture also provides a separate output path prior to the demodulator core for routing lower-rate signals to be processed by an external software demodulator. The RWGR FPGA receiver can accommodate a continuum of higher data rates ranging from 39.0625 kbaud to 320 Mbaud. The current firmware design only processes suppressed carrier, binary phase-shift keying (BPSK), QPSK, OQPSK, and Gaussian mini-mum-shift keying (GMSK) signaling formats.
III. RWGR Configuration Interface
An example of the custom graphical interface used to remotely operate and configure the RWGR is shown in Figure 3. With this interface, the user is able to select a variety of options to use to configure the RWGR. This includes the target data rate, the IF tuning frequency, automatic or manual gain control, the matched filter coefficients, and the Costas (carrier phase/frequency) and Gardner (symbol timing offset/data rate drift) second-order loop filter coefficients. In addition, the incorporation of Doppler frequency predicts, using values pro-vided by ephemeris files, can be set via this interface.
In addition to setting up receiver parameters, the RWGR configuration interface is also capable of generating various plots based off of local data buffers interspersed throughout the RWGR, from which the user can extract diagnostic information regarding receiver
ADC IFSamples
at 1.28 GHz
FineInterpolator
InputFPGA
CaptureRAM
CaptureRAM
CaptureRAM
Integrate& Dump
x 2m
CaptureRAM
CaptureRAM
BasebandMixer
BasebandMixer
Filter 2k
Filter 2
Filter 4
2
NTPTime-CodeGenerator
RocketIO
RocketIO
Four Sample/Symbol Demodulator Core
To Software Demodulator
To Frame Synchronizer and FEC Decoder
Filter-Decimate FPGA
Receiver Core FPGA
Filter
TestROM
ADC — Analog-to-Digital ConverterFEC — Forward Error CorrectionNTP — Network Time ProtocolRAM — Random-Access MemoryROM — Read-Only Memory
• This complex baseband sample interface is used to reduce the sample rate from the filter-decimate and fine interpolation processing
• Software is used to read real-time samples from the capture RAM circular buffer

4
Figure 3. RWGR configuration interface screen capture.
Receiver Command Scripting CanBe Performed Locally or Remotely
Analysis Screens IncludeConstellations, IF Spectrum,Symbol and ADC Histograms
UTC Knowledge via Network TimeProtocol (NTP) and a Local FrequencyReference Allows for Time-Tagging andPrecise Predict Compensation
Lock Detection Implemented inSoftware Based Upon SnapshotProcessing of Receiver Samples
performance in a near-real-time manner. For example, on the right-hand side of Figure 3, a scatterplot of a data buffer of the RWGR output soft symbols is shown. Plots such as these are continuously updated with new data from snapshot buffers to provide the user with dynamic observations of various signal paths throughout the RWGR. Status from carrier and symbol synchronization lock detector and signal-to-noise ratio (SNR) estimator algo-rithms [3–5] operating on snapshot data are also displayed via this interface. In addition to displaying constellations of the detected soft symbol outputs, the configuration interface can also generate histogram and power spectral density plots of the input ADC samples, as well as histogram plots of the I and Q channels forming the soft symbol outputs. Further-more, the RWGR configuration interface allows the user to store the outputs of the ADC or detected symbol data buffers triggered at multiple intervals to track the time evolution behavior of the signal paths.
IV. DSS-13 Equipment Configurations
In order to perform real-time tests of the RWGR FPGA receiver with spacecraft communica-tions links, a portable radio science receiver (PRSR) hardware platform was programmed with the wideband multirate receiver FPGA design and installed in the control room of DSS-13. The PRSR is a compact variant from a family of open-loop recorder instruments deployed in the DSN that are used primarily for science observations [6]. The RWGR uti-lizes the underlying hardware platform with reprogrammed FPGA processing elements to

5
provide wideband telemetry receiver functionality. Figure 4 shows the connectivity be-tween different components of the experiment test configuration. RF front-end equipment, located beneath the antenna, is connected to the station’s control room via a 300-MHz IF distribution system. DSS-13’s 34-m beam-waveguide antenna provides multiple locations in the pedestal area for different experimenters to install observation-specific RF equipment.
PRSR Control PC,Networked Behind
Sun
Security-ApprovedSun PC at DSS-13
Data Analysis of Detected MRO Downlink
JPL
GOLDSTONE
FIRE WALL
26-GHz Feed
Secure Terminal
26-GHz DownconverterControl Laptop
26-GHz DownconverterSystem
RWGR GUI Allows forNetworked Control of PRSR
RWGR on PRSR Platform
Figure 4. System configuration for 26-GHz operation.
For the LRO tests, a 26-GHz feed, uncooled low-noise amplifier and RF-to-IF downcon-verter were integrated together and situated in one of the pedestal experimenter stations, as shown in Figure 5. Observations of the MRO downlink signal were taken from an existing separate deep-space X-band front-end and downconversion subsystem already in place at DSS-13. For any given observation, the antenna pointing and tracking is handled by station personnel and operation of the receiver signal processing equipment is performed remotely from JPL. A voice landline is employed for activity coordination during downlink pass opportunities.
Figure 5. The 26-GHz feed and downconverter rack situated in the DSS-13 pedestal.

6
V. Field Testing Results
A. MRO Field Testing
In 2010, a number of field tests were conducted (2010 DOY-196, DOY-204, DOY-210) and demonstrated successful tracking and demodulation of the MRO downlink using the RWGR FPGA design. For this link, the channel-coded bit rate was 3 Mbps and the modulation for-mat used was QPSK, corresponding to a symbol rate of 1.5 Mbaud. The RWGR demodulator was configured with a coarse decimation value of 128:1 and a fine decimation factor of 5:3. The downlink telemetry signal was encoded using a rate-1/2 turbo code as described in [7]. For these tracks, Doppler frequency predicts were not used to aid in the acquisition and tracking of the MRO downlink telemetry signal.
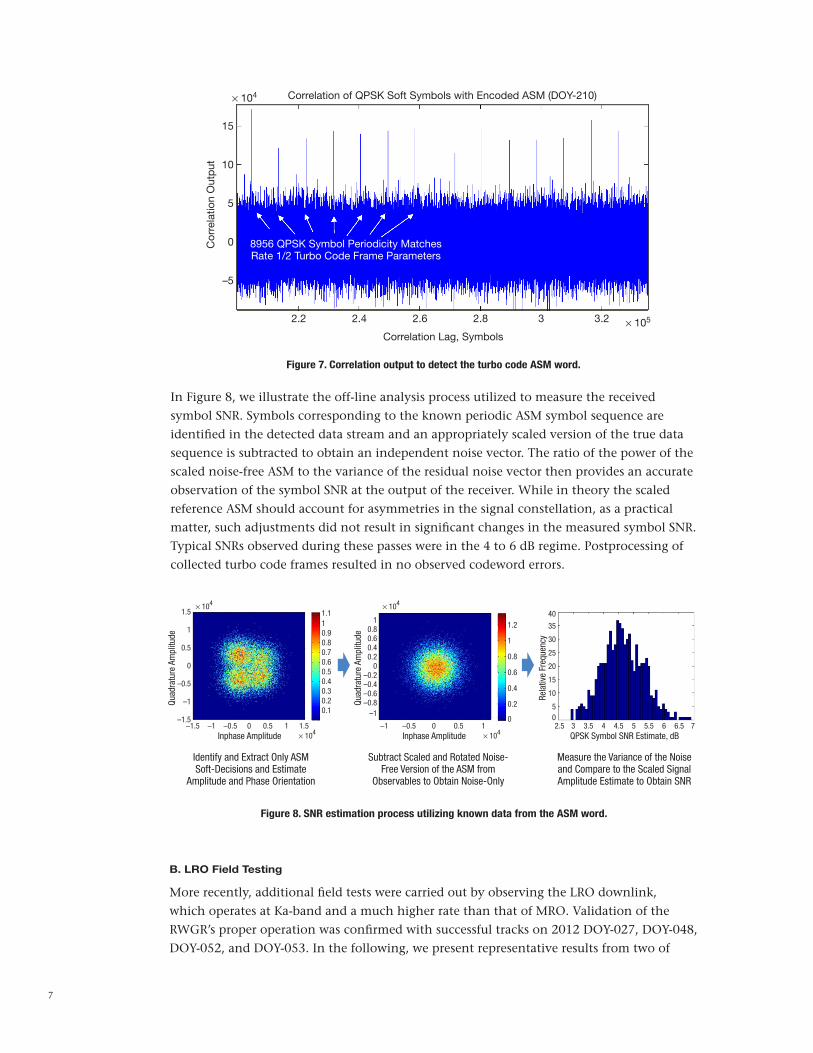
A density plot of the demodulated soft symbols detected by the RWGR is shown in Figure 6. False coloring is used to represent the relative frequency of the detected symbol values. Logarithmic scaling of the density plot enhances details of the symbol distribution. The skew present in the detected signal constellation may be attributed to I/Q imbalances on the transmitter and has been consistently observed in other analyses of the MRO downlink waveform. Further confirmation that the received data corresponds to correctly detected symbol values is obtained by correlating the received, complex symbol stream with known data patterns present in the downlink telemetry. In this case, the attached synchronization marker (ASM) used to perform frame synchronization of the rate-1/2 turbo code word is em-ployed as the known reference data. Results from correlating the QPSK-encoded ASM word with the received complex symbol stream are shown in Figure 7. A measurement of the interval between detected ASM correlation peaks correctly matches the block length of the turbo code frame length and provides functional confirmation of proper receiver operation.
Figure 6. Detected soft symbol constellation density from 2010 DO-196 MRO downlink track
(3 Mbps QPSK, logarithmic density scaling).
1.8
1.6
1.4
1.2
1
0.8
0.6
0.4
0.2
0
150
100
50
0
–50
–100
–150
–200–150 –100 –50 0 50 100 150 200
200
–200
Qua
dra
ture
Am
plit
ude
Inphase Amplitude
7
Figure 7. Correlation output to detect the turbo code ASM word.
In Figure 8, we illustrate the off-line analysis process utilized to measure the received symbol SNR. Symbols corresponding to the known periodic ASM symbol sequence are identified in the detected data stream and an appropriately scaled version of the true data sequence is subtracted to obtain an independent noise vector. The ratio of the power of the scaled noise-free ASM to the variance of the residual noise vector then provides an accurate observation of the symbol SNR at the output of the receiver. While in theory the scaled reference ASM should account for asymmetries in the signal constellation, as a practical matter, such adjustments did not result in significant changes in the measured symbol SNR. Typical SNRs observed during these passes were in the 4 to 6 dB regime. Postprocessing of collected turbo code frames resulted in no observed codeword errors.
15
10
5
0
–5
× 104
× 1052.2 2.4 2.6 2.8 3 3.2
Correlation Lag, Symbols
Correlation of QPSK Soft Symbols with Encoded ASM (DOY-210)
Cor
rela
tion
Out
put
8956 QPSK Symbol Periodicity MatchesRate 1/2 Turbo Code Frame Parameters
Identify and Extract Only ASMSoft-Decisions and Estimate
Amplitude and Phase Orientation
Inphase Amplitude Inphase Amplitude QPSK Symbol SNR Estimate, dB–1.5 –1 –1–0.5
1.5
1.2
1
0.8
0.6
0.4
0.2
0
10.90.80.70.60.50.40.30.20.1
1.1× 104 × 104
× 104 × 104
1
0.5
10.8
40
35
30
25
20
15
10
50
0.60.40.2
0–0.2–0.4–0.6–0.8
–1
0
–0.5
–1
–1.5–0.50 00.5 0.5 2.5 3 3.5 4 4.5 5 5.5 6 6.5 71 11.5
Quad
ratu
re A
mpl
itude
Quad
ratu
re A
mpl
itude
Rela
tive
Freq
uenc
y
Subtract Scaled and Rotated Noise-Free Version of the ASM from
Observables to Obtain Noise-Only
Measure the Variance of the Noiseand Compare to the Scaled SignalAmplitude Estimate to Obtain SNR
Figure 8. SNR estimation process utilizing known data from the ASM word.
B. LRO Field Testing
More recently, additional field tests were carried out by observing the LRO downlink, which operates at Ka-band and a much higher rate than that of MRO. Validation of the RWGR’s proper operation was confirmed with successful tracks on 2012 DOY-027, DOY-048, DOY-052, and DOY-053. In the following, we present representative results from two of

8
these tracks: one performed without the aid of Doppler frequency predicts and the other with frequency predict compensation enabled.
1. LRO Downlink Track (2012 DOY-027)
On January 27, 2012 (2012 DOY-027), a successful track of an LRO downlink was carried out. For this link, the channel-coded bit rate was 229 Mbps and the constellation format used was OQPSK. As with the MRO track, the PRSR hardware platform programmed with the RWGR demodulator was used to process the telemetry signal. The receiver was con-figured with a coarse decimation value of 2:1 and a fine decimation factor of 1.399213:1 (approximately 1.4:1). The downlink telemetry signal is encoded using a constraint length 7, rate 1/2 convolutional code — i.e., a (7, 1/2) convolutional code, as described in [7]. For this track, the IF was tuned to 300 MHz and Doppler frequency predicts were not used to aid in the acquisition and tracking of the LRO downlink signal. Signal acquisition was achieved with a combination of widening the carrier tracking bandwidth and stepping of the digital receiver center frequency.
In Figure 9, the detected soft symbol outputs from the RWGR snapshot buffers are shown as constellation density plots. Tight clustering of the detected symbols indicates a relatively strong SNR, which can also be seen in the spectral analysis plot of the receiver IF input shown in Figure 10. Also noticeable in the constellation density are relatively infrequent detection artifacts that are distributed randomly and are inconsistent with additive noise. An examination of the ADC sample amplitude distribution, displayed as a histogram in Figure 11, shows that the IF signal was saturating the input to the receiver, likely resulting in nonlinear distortion that impacted the quality of the receiver output.
Figure 9. Detected soft symbol constellation density from 2012 DOY-027 LRO downlink track
(229 Mbps OQPSK, logarithmic density scaling).
–2 –1 0 1 2
2
1.5
2.5
2
1.5
1
0.5
0
–0.5
–1
–1.5
–2
–2.5
1
0.5
0
× 104
× 104
Qua
dra
ture
Am
plit
ude
Inphase Amplitude

9
Figure 10. Power spectral density of ADC input samples from 2012 DOY-027 LRO downlink track.
Figure 11. Histogram of ADC input samples from 2012 DOY-027 LRO downlink track.
Further validation of receiver operation is provided in Figure 12, where we have a plot of the estimated channel error rate as a function of time. Here, the channel error rate was measured offline by first decoding the captured soft decision symbol values produced by the RWGR and comparing the reencoded data to hard decisions obtained from the raw input symbols. The channel error rate fluctuations shown in this figure are attributed to manually implemented antenna boresighting offsets used during this particular run to help with centering of the beam. The increase in channel error rate as a function of elapsed time is likely due to a reduction in the downlink SNR occurring near the end of the pass.
2. LRO Downlink Track (2012 DOY-053)
On February 22, 2012 (2012 DOY-053), another track of the LRO downlink was carried out. The downlink telemetry signal was of the same format as that used during the 2012 DOY-027 track in terms of symbol rate, constellation format, and error-correction encod-
0 100 200 300
Frequency, MHz
400 500 600 700
55
50
45
40
35
30
25
Pow
er S
pec
tral
Den
sity
, dB
–150 –100 –50 0 50 100 150
14
12
10
8
6
4
2
0
× 104
Sam
ple
Cou
nt
Sample Amplitude

10
Figure 12. Time evolution of the estimated channel error rate for the 2012 DOY-027 LRO track.
ing. However, in contrast to the track carried out on 2012 DOY-027, this test incorporated Doppler frequency predicts to pre-compensate for offsets in the received signal, which resulted in noticeable improvements to the acquisition and tracking process.
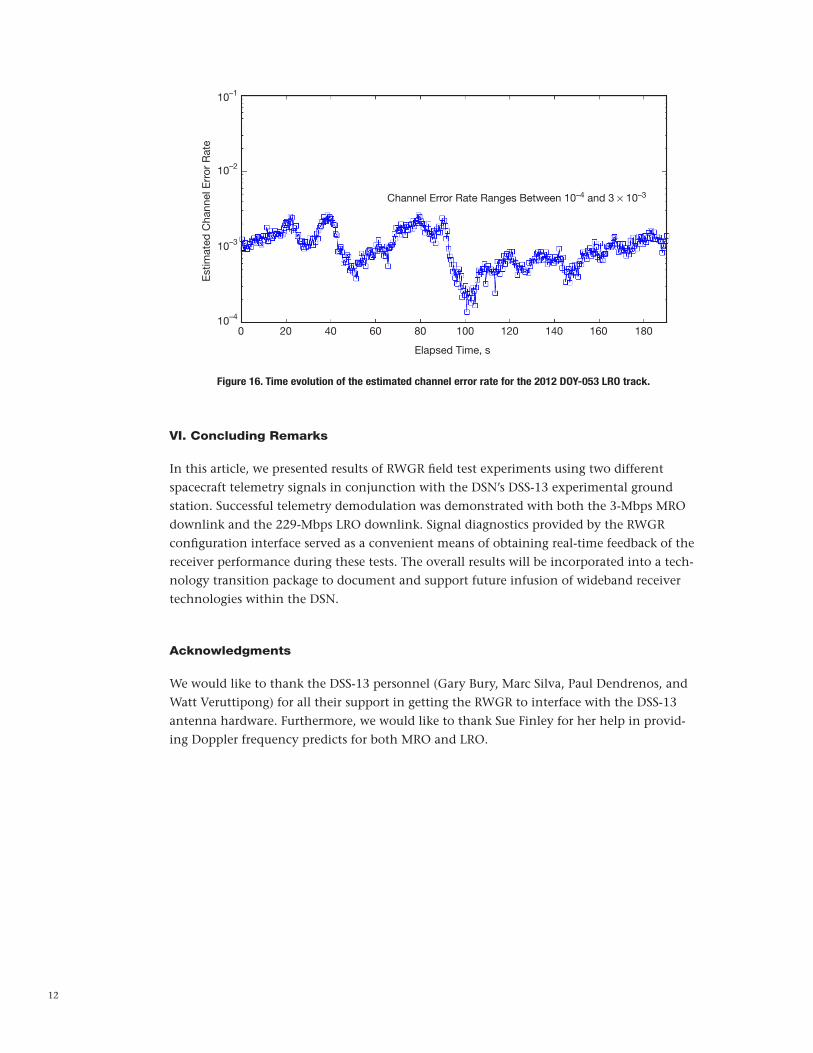
In Figures 13, 14, and 15, we have plotted the histogram of the IF ADC input samples, the power spectral density of the receiver input, and the constellation density of the RWGR symbol output, respectively. As can be seen in Figure 13, care was taken to ensure that the ADC clipping present in the DOY-027 test was avoided. While the input SNR observed in Figure 14 is comparable to the DOY-027 results of Figure 10, the constellation quality dis-played in Figure 15 is much improved with no artifacts from nonlinear distortion observed at the receiver output. For the DOY-053 test, an example of the estimated channel error rate is also shown in Figure 16. These results demonstrate functional operation of the receiver and correspond to a detected bit SNR range of approximately 6 to 8 dB.
0 10 20 30 40 50
Elapsed Time, s
Variation in Channel Error Rate LikelyDue to Continuous Boresighting Offsets
Trend Likely Due to Signal SNR Reduction Near End of Pass
Est
imat
ed C
hann
el E
rror
Rat
e
60 70 80 90
100
10–1
10–2
10–3
10–4
Figure 13. Histogram of ADC input samples from 2012 DOY-053 LRO downlink track.
–150 –100 –50 0 50 100 150
14
12
10
8
6
4
2
0
× 104
Sam
ple
Cou
nt
Sample Amplitude

11
Figure 14. Power spectral density of ADC input samples from 2012 DOY-053 LRO downlink track.
Figure 15. Detected soft symbol constellation density from 2012 DOY-053 LRO downlink track
(229 Mbps OQPSK, logarithmic density scaling).
–200 –150 –100 –50 0 50 100 150 200
200
150
100
50
0
–50
–100
–150
–200
2.5
2
1.5
1
0.5
Qua
dra
ture
Am
plit
ude
Inphase Amplitude
0 100 200 300 400 500 600 700
45
50
40
35
30
25
20
15
Frequency, MHz
Pow
er S
pec
tral
Den
sity
, dB
12
0 20 40 60 80 100 120 140 160 180
Elapsed Time, s
Channel Error Rate Ranges Between 10–4 and 3 × 10⁻³
Est
imat
ed C
hann
el E
rror
Rat
e
10–1
10–2
10–3
10–4
Figure 16. Time evolution of the estimated channel error rate for the 2012 DOY-053 LRO track.
VI. Concluding Remarks
In this article, we presented results of RWGR field test experiments using two different spacecraft telemetry signals in conjunction with the DSN’s DSS-13 experimental ground station. Successful telemetry demodulation was demonstrated with both the 3-Mbps MRO downlink and the 229-Mbps LRO downlink. Signal diagnostics provided by the RWGR configuration interface served as a convenient means of obtaining real-time feedback of the receiver performance during these tests. The overall results will be incorporated into a tech-nology transition package to document and support future infusion of wideband receiver technologies within the DSN.
Acknowledgments
We would like to thank the DSS-13 personnel (Gary Bury, Marc Silva, Paul Dendrenos, and Watt Veruttipong) for all their support in getting the RWGR to interface with the DSS-13 antenna hardware. Furthermore, we would like to thank Sue Finley for her help in provid-ing Doppler frequency predicts for both MRO and LRO.

13 JPL CL#12-3584
References
[1] K. Andrews, A. Argueta, N. Lay, M. Lyubarev, E. Sigman, M. Srinivasan, and A. Tka-cenko, “Reconfigurable Wideband Ground Receiver Hardware Description and Labora-tory Performance,” The Interplanetary Network Progress Report, vol. 42-180, Jet Propulsion Laboratory, Pasadena, California, pp. 1–30, February 15, 2010. http://ipnpr.jpl.nasa.gov/progress_report/42-180/180D.pdf
[2] N. Lay, M. Lyubarev, A. Tkacenko, M. Srinivasan, K. Andrews, S. Finley, C. Goodhart, and R. Navarro, “Software Receiver Processing for Deep Space Telemetry Applications,” The Interplanetary Network Progress Report, vol. 42-180, Jet Propulsion Laboratory, Pasa-dena, California, pp. 1–8, February 15, 2010. http://ipnpr.jpl.nasa.gov/progress_report/42-180/180E.pdf
[3] Y. Linn, “A Self-Normalizing Symbol Synchronization Lock Detector for QPSK and BPSK,” IEEE Transactions on Wireless Communications, vol. 5, no. 2, pp. 347–353, Febru-ary 2006.
[4] A. Mileant and S. Hinedi, “On the Effects of Phase Jitter on QPSK Lock Detection,” IEEE
Transactions on Communications, vol. 41, no. 7, pp. 1043–1046, July 1993.
[5] M. Srinivasan, A. Tkacenko, and F. Cheng, “Improvements to Symbol Signal-to-Noise Ratio Estimation for the Block V Receiver,” The Interplanetary Network Progress Report, vol. 42-173, Jet Propulsion Laboratory, Pasadena, California, pp. 1–25, May 15, 2008. http://ipnpr/progress_report/42-173/173E.pdf
[6] S. Rogstad, R. Navarro, S. Finley, C. Goodhart, R. Proctor, and S. Asmar, “The Portable Radio Science Receiver (RSR),” The Interplanetary Network Progress Report, vol. 42-178, Jet Propulsion Laboratory, Pasadena, California, pp. 1–7, August 15, 2009. http://ipnpr/progress_report/42-178/178B.pdf
[7] Consultative Committee for Space Data Systems (CCSDS), TM Synchronization and
Channel Coding, Recommendation for Space Data System Standards, 131.0-B-2, Blue Book, Issue 1, August 2011. http://public.ccsds.org/publications/BlueBooks.aspx