overview of u.s. livestock, poultry, and aquaculture ... · livestock and poultry compared with the...
TRANSCRIPT

1
Overview of U.S. Livestock, Poultry, and Aquaculture Production in 2017
Purpose
This document is a compilation of statistics published by the National Agricultural Statistics
Service (NASS) of the U.S. Department of Agriculture (USDA). Its purpose is to (1) give an
overview of U.S. livestock, poultry, and aquaculture information for 2017, (2) compare the value
of production for these animal commodities, and (3) show changes over time.
Available Statistics
Official statistics for U.S. livestock, poultry, and aquaculture populations published by NASS are
based on the Census of Agriculture conducted every 5 years (e.g., 2007 and 2012) and sample
surveys conducted monthly, quarterly, or annually as determined by the particular commodity.
The Census of Agriculture, which is a complete enumeration of the entire agricultural segment of
the economy, is the only source of detailed, county-level data of all farms and ranches in all
50 States selling or intending to sell agricultural products worth $1,000 or more in a year.
Census 2012 reports are available at: http://www.agcensus.usda.gov/.
The massive data-collecting, editing, and summarizing effort required to prepare the Census
naturally results in a publication lag. Sample survey estimates and final Census reports rarely
show exactly the same numbers. However, the ongoing sample surveys provide the most up-to-
date statistics between the Census years and are themselves subject to revision when current-year
estimates are made. For these reasons, statistics in the 2012 Overview for 1 year compared with
similar statistics published for 2012 in the 2016 Overview, may not always match.
Number of Farms
Estimates for the number of U.S. farms were based on the definition of a farm as “any
establishment from which $1,000 or more of agricultural products were sold or would be
2
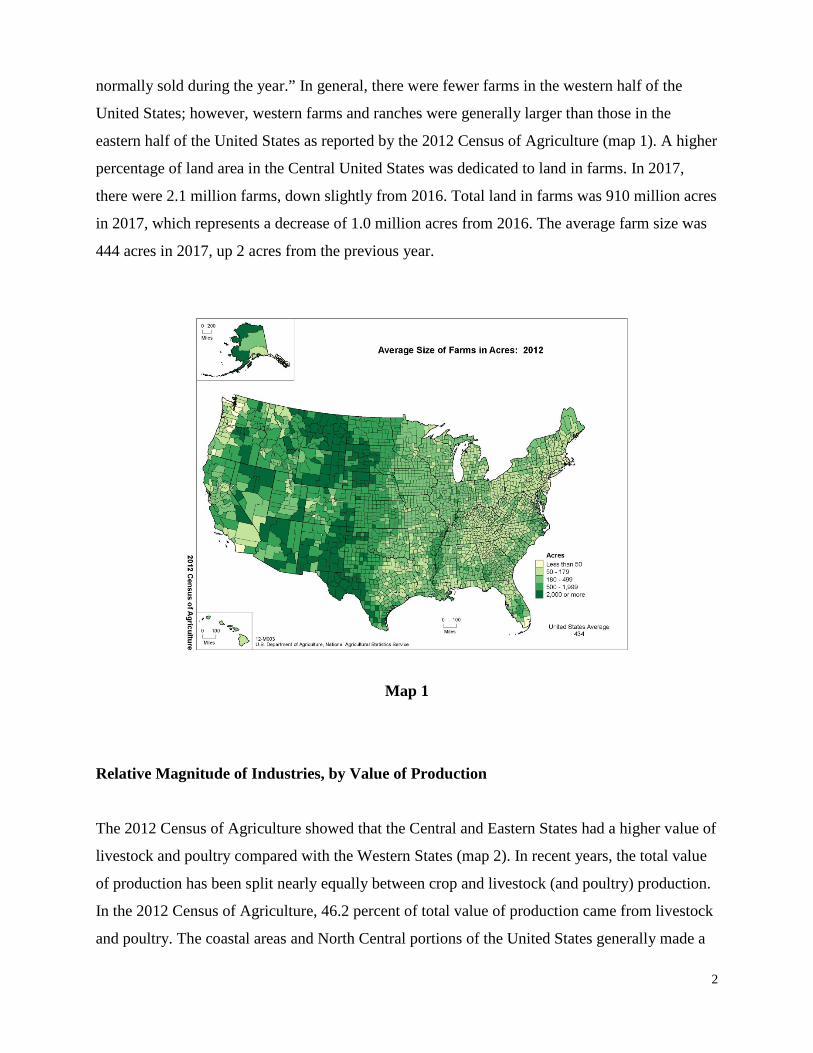
normally sold during the year.” In general, there were fewer farms in the western half of the
United States; however, western farms and ranches were generally larger than those in the
eastern half of the United States as reported by the 2012 Census of Agriculture (map 1). A higher
percentage of land area in the Central United States was dedicated to land in farms. In 2017,
there were 2.1 million farms, down slightly from 2016. Total land in farms was 910 million acres
in 2017, which represents a decrease of 1.0 million acres from 2016. The average farm size was
444 acres in 2017, up 2 acres from the previous year.
Map 1
Relative Magnitude of Industries, by Value of Production
The 2012 Census of Agriculture showed that the Central and Eastern States had a higher value of
livestock and poultry compared with the Western States (map 2). In recent years, the total value
of production has been split nearly equally between crop and livestock (and poultry) production.
In the 2012 Census of Agriculture, 46.2 percent of total value of production came from livestock
and poultry. The coastal areas and North Central portions of the United States generally made a

3
smaller livestock and poultry contribution to the total market value. These areas had heavy
concentrations of crop, fruit, and vegetable products.
Map 2
Introduction to the Livestock, Poultry, and Aquaculture Industries
According to the 2012 Census of Agriculture, almost one-half of the 2.1 million farms in the
United States had cattle and calves (913,246). (USDA defines a cattle operation as any place
having one or more head of cattle on hand at any time during the year.) Only a small number of
cattle operations (64,098) were dairies. There were 128,456 operations with goats, 88,338
operations with sheep, and 63,246 operations with hogs and pigs. Operations with equids are
counted only if they are farms (they must have $1,000 or more of sales of agricultural products),
and the most recent count of those, in 2012, put the number of farms with equids at 504,795.

4
In 2017, the cattle industry had the highest value of production at roughly $50.2 billion. The
poultry industries were the next largest commodity in the United States, with production valued
at around $42.7 billion, followed by hogs and pigs at $19.2 billion (table 1). The value of milk
production was about $38.1 billion, 9.8 percent higher than in 2016.
Cattle and Calves (Beef and Dairy)
The Nation’s 94.4 million cattle and calves (beef and dairy) are dispersed widely across the
country, with a greater concentration generally in the Central States (map 3).
Map 3
Overall, the number of cattle and calves in the United States has increased from 30.1 million in
1869, reaching a peak of 132.0 million in 1975. From 2007 to 2014, the Nation’s inventory of
cattle and calves saw a steady decline, but has shown 4 years of increase from 2015 through
2018, to 94.4 million.

5
The number of operations with cattle (or calves) has declined steadily during the past 15 years,
from 1.2 million in 1995 to 913,246 (2012 Census of Agriculture). The overall decline is due to
the decline in number of beef operations. The decrease in the number of cattle operations is due
primarily to the decline in the number of operations with fewer than 50 head of cattle (data not
shown). The number of operations was down for all size groups from 2007 to 2012 except for the
1 to 9 group, which was up about 10,000 operations.
According to the 2012 Census of Agriculture, small cattle operations (1–49 head) accounted for
69.8 percent of all cattle operations but only 11.6 percent of the total inventory of cattle and
calves. Large operations (1,000 or more head) accounted for just 1.2 percent of all cattle
operations but accounted for 36.9 percent of the total U.S. inventory of cattle and calves
(table 2).
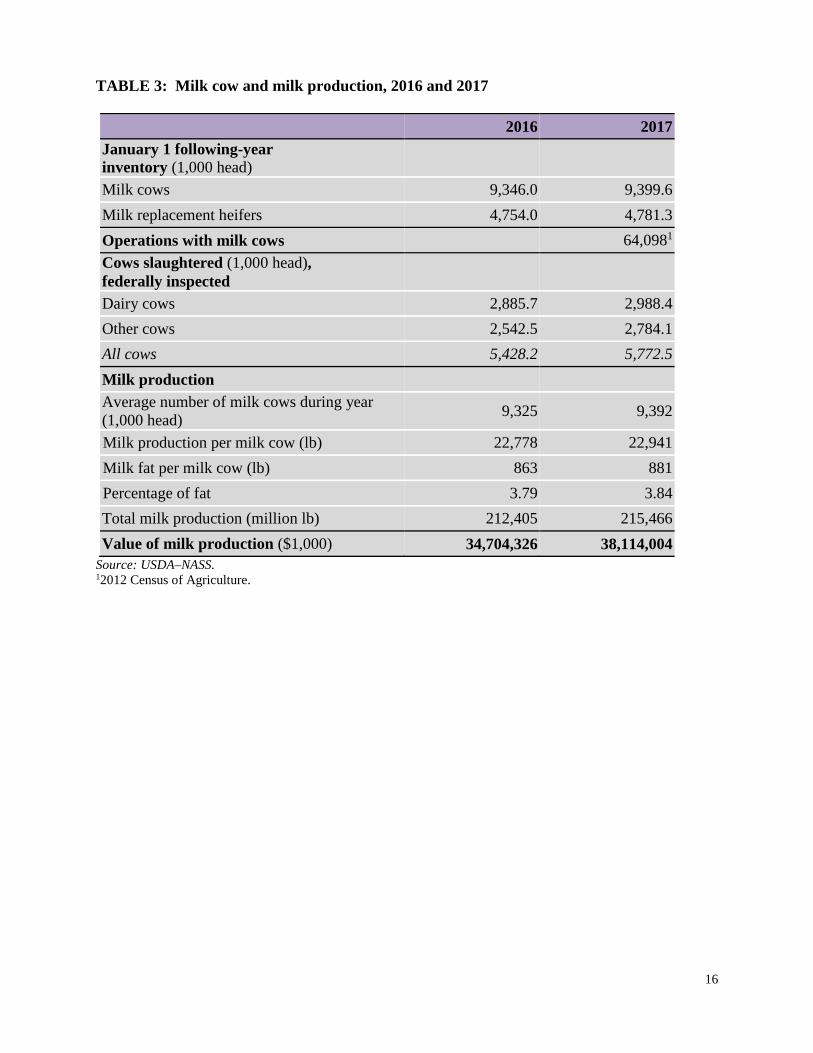
Milk Cows—Dairy
On January 1, 2018, California and Wisconsin accounted for 32.1 percent of the U.S. milk cow
inventory.
The U.S. population of milk cows has remained relatively stable over the last 10 years. Over the
previous decade the number of milk cows ranged from 9.1 million to 9.4 million (data not
shown).
Annual milk production per cow increased from 17,763 pounds in 1999 to 22,941 pounds in
2017, a 29-percent increase. Table 3 documents dairy production for 2016 and 2017.
Beef Cows
Beef cows are distributed widely across the United States. In general, however, States in the
central part of the Nation have a higher number of beef cows, led by Texas (4.6 million on
January 1, 2018). Missouri, Nebraska, and Oklahoma each had about 2 million beef cows. Beef
cows accounted for 77.1 percent of the total cow inventory on January 1, 2018.

6
According to the 2012 Census of Agriculture, 727,906 operations in the United States had beef
cows. The number of operations with beef cows has declined gradually since 1996 (1–2 percent
per year). This decrease is most notable in the number of small operations (1–49 head) (data not
shown).
Cattle on Feed
Cattle on feed (steers and heifers) are fed a ration of grain or other concentrate in preparation for
slaughter, and the majority are in feedlots in States with large grain supplies.
On January 1, 2018, three States (Kansas, Nebraska, and Texas) accounted for nearly two-thirds
(65.6 percent) of the inventory of cattle on feed in all feedlots with 1,000 or more capacity. Large
numbers of cattle on feed are in relatively few feedlots; 128 feedlots (0.5 percent of all feedlots)
accounted for 44.1 percent of the total U.S. cattle-on-feed inventory (table 5). Inventory numbers
in feedlots typically reach high points in December, January, and February and low points in
August and September because of the seasonal availability of grazing resources and the
predominance of spring-born calves. As a result, commercial cattle slaughter typically reaches a
high point in May and June. Steers and heifers accounted for 80.1 percent of 2017 federally
inspected cattle slaughter (data not shown). Of the 32.2 million head of commercially inspected
cattle slaughter, 98.5 percent were federally inspected (table 13).
Hogs
Historically, hog production has been most common in the upper Midwest. On December 1,
2017, Iowa, the largest hog-producing State, had 31.1 percent of the U.S. inventory of all hogs
and pigs. During the past two decades, North Carolina has increased its production and is now
the Nation’s second largest hog-producing State, with 12.3 percent of the inventory.
In the last 3 years, the number of hogs slaughtered commercially reached a low point in May or
June, then increased until peaking in October or November in preparation for the holiday season
(fig. 1). Commercial hog slaughter totaled 121.3 million head in 2017, 2.6 percent higher than
2016.

7
The number of operations with hogs (and pigs) has declined steadily in recent years, decreasing
from 78,895 in 2002 to 63,246 in 2012 (Census of Agriculture). The majority of hog operations
(74.8 percent) had fewer than 100 head (2012 Census of Agriculture), but these operations
accounted for only 0.8 percent of the inventory.
The United States had 63,246 hog operations (2012 Census of Agriculture) with a production
value of $22.5 billion (2016 and 2017 values shown in table 6).
Sheep and Goats
The U.S. sheep industry is located primarily in the Western and Central States. California,
Colorado, Texas, and Wyoming accounted for 40.3 percent of the U.S. sheep and lamb inventory
on January 1, 2018. Typically, the Western States are characterized by large range flocks,
whereas those in the Central and Eastern States are mostly small, fenced flocks.

8
The number of sheep and lambs has declined steadily since the late 1980s (10.9 million head in
1988) with the exception of a brief peak in inventory in 1990 (11.4 million head), and again in
2005 and 2006. Total sheep and lamb inventory on January 1, 2018, was 5.23 million head,
down slightly from 2017. The number of operations with sheep has declined gradually, from
113,640 in 1987 to 88,338 (2012 Census of Agriculture).
Nearly one-third of the sheep and lamb inventory (29.1 percent; 2012 Census of Agriculture) is
located on small operations (1–99 head); 92.2 percent of the 88,338 total operations had fewer
than 100 head of sheep and lambs (table 7). Commercial sheep and lamb slaughter totaled
2.2 million head in 2017.
There were 2.62 million goats in the United States on January 1, 2018, which represents a
0.8-percent decrease from the January 1, 2017, population. The largest type, by far, were meat
and other goats (80.1 percent).
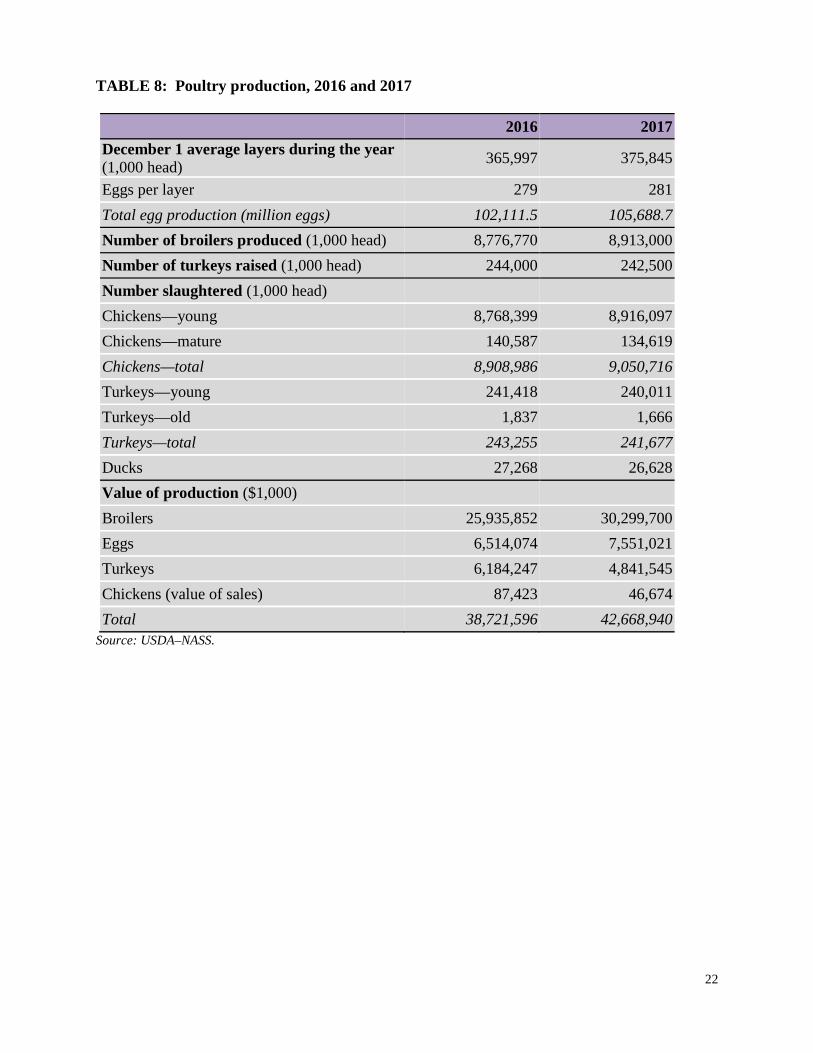
Poultry Industries
The poultry industries are economically important to the Eastern States—especially the
Southeastern States (map 4). The value of poultry and eggs is a high percentage of the total value
of agricultural products sold in these States. In terms of value of production, the broiler segment
of the poultry industries dominates other segments—eggs, turkeys, and chickens (excluding
broilers) [fig. 2].

9
Map 4
10
Broiler production is concentrated heavily in the Southeast, whereas layers are dispersed more
widely over the Central and Eastern States. Turkey production is concentrated in the eastern half
of the United States. Arkansas, Indiana, Minnesota, and North Carolina accounted for
49.9 percent of the 242.5 million turkeys raised in 2017.
The broiler and layer industries are characterized by a relatively small number of large
companies. The USDA does not provide annual estimates of the number of companies or
production sites. The value of broiler production was 70.8 percent of the $42.7 billion poultry
industries’ production in 2017. Egg production accounted for 17.7 percent of the total value of
production (table 8).
Hatchery statistics for 2017 include 9.62 billion broiler-type chickens hatched, 582 million egg-
type chicks hatched, and 291 million poults hatched in turkey hatcheries. The collective capacity
of the 288 chicken hatcheries on January 1, 2018, was 951 million eggs, and the capacity of the
55 turkey hatcheries was 41.1 million eggs.
Slaughter of young chickens1 accounted for 86.7 percent of the total live weight of poultry
slaughtered in 2017. The average live weight of young chickens slaughtered has steadily
increased over the previous decade, ranging from 5.58 pounds in 2008 to 6.20 pounds in 2017.
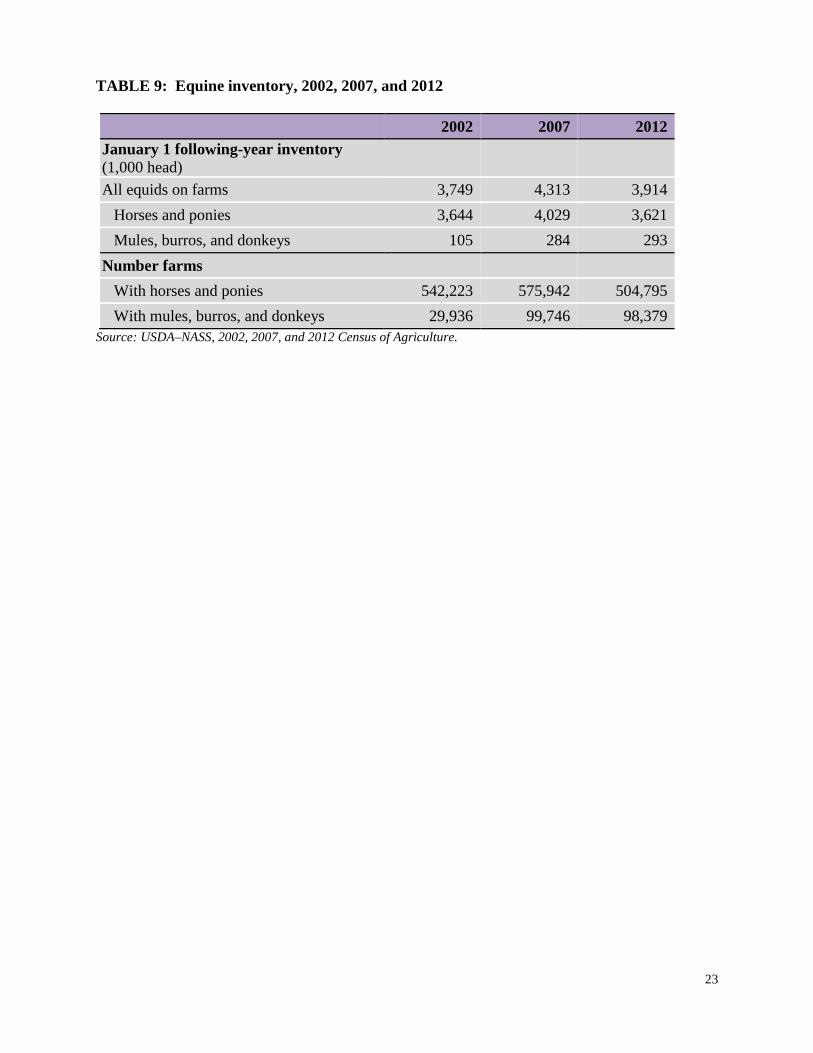
Equine Industry
Statistics on the demographics of the U.S. equine industry are sparse. Equine inventory on
farms2 is available only from the Census of Agriculture (2002, 2007, and 2012). Two additional
surveys of the equine industry were conducted by NASS in 1998; these surveys are the only
nonfarm estimates of inventory.
1 Young chickens are commercially grown broilers, fryers, and other young, immature birds (e.g., roasters and capons). 2 For purposes of equids, a farm is defined as any operation with at least $1,000 in sales of agricultural products annually (the usual definition) or any operation that has at least five equids (other than commercial enterprises such as race tracks).
11
The 2012 Census of Agriculture estimated 3.62 million horses and ponies reported on 504,795
farms and 292,590 mules, burros, and donkeys on 98,379 farms (table 9). The number of farms
with mules, burros, and donkeys was up over 300 percent from only 29,936 in 2002. There is a
broad and even distribution of equids across the United States.
The Census numbers do not include nonfarm equids. The only estimates of nonfarm equids are
from 1997 and 1998. In 1997 there were an estimated 2.05 million nonfarm equids, in addition to
the 3.14 million equids on farms, accounting for almost 39 percent of total equids. The USDA
publishes no estimates for the number of nonfarms with equids.
Fish and Other Aquaculture Products
Catfish production in 2017 was concentrated in the Southern States, North Carolina, and
California, with Mississippi accounting for 56.5 percent of total sales. Total foodsize catfish
sales for 2017 were $355.4 million, which was down 2.2 percent from 2016 (table 10). Food-size
catfish accounted for 93.6 percent of total sales.
Trout production was dispersed more widely across the United States. Idaho accounted for
45.7 percent of total value of fish sold in 2017. The total value of trout sold, both fish and eggs,
was $118.2 million in 2017—an increase of 0.4 percent from 2016.
Honey Production
In 2017, honey production from producers with five or more colonies totaled 147.6 million
pounds, which represents an 8.8-percent decrease from 2016 (table 11; fig. 3). The distribution of
honey production is widespread across the United States, although North Dakota accounted for
22.8 percent of the total production in 2017. U.S. honey prices decreased from 211.9 cents per
pound in 2016 to 215.6 cents per pound in 2017, and the value of production decreased from
$343.0 million in 2016 to $318.3 million in 2017.

12
Number of Livestock Slaughter Plants in the United States
On January 1, 2018, there were 834 federally inspected U.S. slaughter plants. Federally inspected
plants are those that transport meat interstate and must employ Federal inspectors to ensure
compliance with USDA standards. There are additional plants considered federally inspected,
called Talmedge-Aiken plants. Although USDA is responsible for inspection in these plants,
actual Federal inspection is carried out by State employees, who ensure that Federal regulations
are being followed. During 2017, 666 plants slaughtered cattle (table 13), and 13 of these plants
slaughtered 57 percent of the total cattle slaughtered. Five of the 190 plants that slaughtered
calves accounted for 72 percent of the total, and 4 of the 537 plants that slaughtered sheep or
lambs in 2017 produced 60 percent of the total number of head slaughtered. Hogs were
slaughtered at 636 plants; the 13 largest plants accounted for 59 percent of the total.

13
Iowa, Kansas, Nebraska, and Texas accounted for 49.1 percent of U.S. commercial red-meat
production in 2017. Beef and pork dominated commercial red-meat production in 2017 (50.4 and
49.2 percent, respectively).
On January 1, 2018, there were 1,924 State-inspected or custom-exempt slaughter plants in the
United States, compared with 1,918 such plants on January 1, 2017. State-inspected plants sell
and transport exclusively intrastate. State inspectors ensure compliance with individual State
standards as well as with Federal meat and poultry inspection statutes. Custom-exempt plants do
not sell meat but operate on a custom slaughter basis only. The animals and meat are not
federally inspected, but the facilities must meet local health requirements.

14
TABLE 1: Livestock, poultry, and aquaculture statistics for 2017
Commodity Inventory
(1,000) Number of operations1
Value of production
($1,000) All cattle 94,399.02 913,246 50,220,387
Milk cows 9,399.62 64,098 3NA Beef cows 31,723.02 727,906 NA Cattle on feed 14,006.42 NA
Milk from milk cows 38,114,004 Hogs and pigs 73,229.94 63,246 19,218,436 Sheep and lambs (plus wool) 5,230.02 88,338
844,6885 Goats 2,6202 128,456 Poultry 6Detail NA 42,668,940 Equids 3,9147 603,1747 NA Catfish 6Detail 1,1839 379,7138 Trout 6Detail 1,0419 109,36810 Honey 6Detail NA 318,308
1Number of operations—any place having one or more head on hand for cattle, beef cow, milk cow, hog and pig, sheep and lamb, and goat and kid operations (2012 Census of Agriculture). 2Inventory as of January 1, 2018. 3Not available. 4Inventory as of December 1, 2017. 5Sales of sheep and goats and their products (2012 Census of Agriculture). 6Detailed breakout of inventory is shown in respective tables. 72012 Census of Agriculture; includes mules, burros, and donkeys. 8Catfish is published as total sales (not value of production). 92012 Census of Agriculture. 10Total value of fish sold excluding eggs.

15
TABLE 2: Cattle and calves production, 2016 and 2017
2016 2017 January 1 following-year inventory (1,000 head)
All cattle and calves 93,704.6 94,399.0 All cows 40,559.2 41,122.6 Cattle on feed 13,067.0 14,006.4 Operations with cattle and calves 913,2461 Calf crop 35,092.7 35,808.2 Deaths—cattle (1,000 head) 1,735.7 1,784.0 Death—calves (1,000 head) 2,139.4 2,143.9 Commercial calves slaughter (1,000 head) Federally inspected 479.9 503.3 Other 7.7 9.0 Total commercial 487.73 512.3 Commercial cattle slaughter (1,000 head) Federally inspected
Steers 16,494.5 16,770.6 Heifers 7,698.0 8,611.1 All cows 5,428.2 5,772.5 Bulls 493.8 550.2
Other 463.8 485.1 Total commercial 30,578.23 32,189.43 Farm cattle and calves slaughter (1,000 head)2 122.9 115.7
Total cattle and calves slaughter (1,000 head) 31,188.8 32,817.4 Value of production ($1,000) 48,563,880 50,220,387
Source: USDA–NASS. 12012 Census of Agriculture. 2Farm slaughter includes animals slaughtered on farms primarily for home consumption. It excludes custom slaughter for farmers at commercial establishments but includes mobile slaughtering on farms. 3Sum may not equal reported total due to rounding.
16
TABLE 3: Milk cow and milk production, 2016 and 2017 2016 2017 January 1 following-year inventory (1,000 head)
Milk cows 9,346.0 9,399.6 Milk replacement heifers 4,754.0 4,781.3 Operations with milk cows 64,0981 Cows slaughtered (1,000 head), federally inspected
Dairy cows 2,885.7 2,988.4 Other cows 2,542.5 2,784.1 All cows 5,428.2 5,772.5 Milk production Average number of milk cows during year (1,000 head) 9,325 9,392
Milk production per milk cow (lb) 22,778 22,941 Milk fat per milk cow (lb) 863 881 Percentage of fat 3.79 3.84 Total milk production (million lb) 212,405 215,466 Value of milk production ($1,000) 34,704,326 38,114,004
Source: USDA–NASS. 12012 Census of Agriculture.

17
TABLE 4: Beef cow production, 2016 and 2017 2016 2017 January 1 following-year inventory (1,000 head)
Beef cows 31,213.2 31,723.0 Beef replacement heifers 6,368.2 6,131.2 Operations with beef cows 727,9061 Cows slaughtered (1,000 head), federally inspected
Dairy cows 2,885.7 2,988.4 Other cows 2,542.5 2,784.1 All cows 5,428.2 5,772.5
Source: USDA–NASS. 12012 Census of Agriculture.

18
TABLE 5: Cattle-on-feed production, 2016 and 2017 2016 2017 January 1 following-year inventory (1,000 head) for all lots 13,067.0 14,006.4
January 1 following-year inventory (1,000 head) for lots 1,000+ capacity
Steers and steer calves 7,022 7,335 Heifers and heifer calves 3,583 4,154 Total 10,605 11,489
Feedlot capacity (head)
Number of feedlots
2017 Pct.
January 1, 2018,
inventory (1,000 head) Pct.
Marketed (1,000 head)
2017 Pct. <1,000 26,000 92.2 2,517.4 17.8 3,225 12.8 1,000–1,999 770 2.7 419 3.0 689 2.7 2,000–3,999 630 2.2 770 5.5 1,410 5.6 4,000–7,999 360 1.3 1,010 7.2 1,840 7.3 8,000–15,999 190 0.7 1,200 8.6 2,340 9.3 16,000–31,999 131 0.5 1,910 13.6 3,880 15.4 ≥ 32,000 128 0.5 6,180 44.1 11,740 46.7 All feedlots 28,209 100.01 14,006.41 100.01 25,124.0 100.01
Source: USDA–NASS. 1Sum may not equal reported total due to rounding.

19
TABLE 6: Hog and pig production, 2016 and 2017 2016 2017 December 1 inventory (1,000 head) Breeding 6,110.4 6,179.0 Market 65,435.0 67,050.9 All hogs and pigs 71,545.4 73,229.9 Operations with hogs and pigs 63,2462 Pig crop (1,000 head) December–November3 125,938.9 129,387.7 Pigs per litter December–November3 10.50 10.60 Deaths (1,000 head) 10,913.0 11,451.5 Slaughter (1,000 head) Federally inspected
Barrows and gilts 114,184.0 117,195.1 Sows 2,884.6 2,951.7 Boars 319.4 369.8
Other 831.9 800.6 Total commercial 118,219.9 121,317.2 Farm slaughter 84.0 73.0 Total slaughter 118,303.9 121,390.2 Value of production ($1,000) 17,382,854 19,218,436
Source: USDA–NASS. 1Sum may not equal reported total due to rounding. 22012 Census of Agriculture. 3December of the preceding year.

20
TABLE 7: Sheep and goat production, 2016 and 2017 2016 2017 January 1 following-year sheep inventory (1,000 head)
Breeding sheep and lambs 3,875.0 3,830.0 Replacement lambs under 1 year old 660.0 655.0 Ewes 1 year old and older 3,045.0 3,005.0 Rams 1 year old and older 170.0 170.0
Market 1,375.0 1,400.0 All sheep and lambs 5,250.0 5,230.0 Operations with sheep 88,3381 Lamb crop (1,000 head) 3,250.0 3,200.0 Slaughter (1,000 head) Federally inspected
Mature sheep 108.1 101.6 Lambs 1,901.5 1,835.5
Other 228.3 240.9 Total commercial 2,237.82 2,178.12 Farm slaughter 94.8 96.1 Total slaughter 2,332.6 2,274.2 Wool production Sheep shorn (1,000 head) 3,585.0 3,440.0 Shorn wool production (1,000 lb) 26,050 24,700 Value of wool production ($1,000) 37,721 36,424
12012 Census of Agriculture. 2Sum may not equal reported total due to rounding.

21
2016 2017 January 1 following-year goat inventory (1,000 head)
All Angora 152 142 Milk 373 380 Meat and other 2,115 2,098 All 2,640 2,620
Does, 1 year old and older Angora 104 98 Milk 239 243 Meat and other 1,271 1,263 All 1,614 1,604
Bucks Angora 7 6 Milk 24 25 Meat and other 133 132 All goats 164 163
Kid crop Angora 76 72 Milk 260 265 Meat and other 1,305 1,300 All 1,641 1,637
Operations with goats1 Angora 9,479 Milk 29,570 Meat and other 100,910 All2 128.4562
Source: USDA–NASS. 1Census of Agriculture. 2Sum may not equal reported total due to rounding.
22
TABLE 8: Poultry production, 2016 and 2017 2016 2017 December 1 average layers during the year (1,000 head) 365,997 375,845
Eggs per layer 279 281 Total egg production (million eggs) 102,111.5 105,688.7 Number of broilers produced (1,000 head) 8,776,770 8,913,000 Number of turkeys raised (1,000 head) 244,000 242,500 Number slaughtered (1,000 head) Chickens—young 8,768,399 8,916,097 Chickens—mature 140,587 134,619 Chickens—total 8,908,986 9,050,716 Turkeys—young 241,418 240,011 Turkeys—old 1,837 1,666 Turkeys—total 243,255 241,677 Ducks 27,268 26,628 Value of production ($1,000) Broilers 25,935,852 30,299,700 Eggs 6,514,074 7,551,021 Turkeys 6,184,247 4,841,545 Chickens (value of sales) 87,423 46,674 Total 38,721,596 42,668,940
Source: USDA–NASS.
23
TABLE 9: Equine inventory, 2002, 2007, and 2012 2002 2007 2012 January 1 following-year inventory (1,000 head)
All equids on farms 3,749 4,313 3,914 Horses and ponies 3,644 4,029 3,621 Mules, burros, and donkeys 105 284 293
Number farms With horses and ponies 542,223 575,942 504,795 With mules, burros, and donkeys 29,936 99,746 98,379
Source: USDA–NASS, 2002, 2007, and 2012 Census of Agriculture.

24
TABLE 10: Catfish and trout production, 2016 and 2017 2016 2017 Catfish Number of fish on January 1, following year (1,000)
Foodsize 132,090 151,490 Stockers 308,940 357,670 Fingerlings 269,420 211,810 Broodfish 595 670
Number of operations on January 1, following year 1,1831
(sold or distributed) Sales ($1,000) Foodsize 363,398 355,432 Stockers 5,477 4,501 Fingerlings 16,913 18,717 Broodfish 197 1,063 Total sales 285,985 379,713 Trout Number of fish sold (1,000) ≥12 inches 46,305 40,265 6–12 inches 5,940 6,430 1–6 inches 5,875 6,470 Sales ($1,000) ≥12 inches 97,076 100,647 6–12 inches 6,616 7,452 1–6 inches 1,291 1,269 Total sales (excluding eggs) 104,983 109,368 Eggs sold Number of eggs (1,000) 422,904 422,145 Total sales ($1,000) 8,921 8,844 Total value of fish sold including eggs ($1,000) 113,904 118,212
Number of operations selling or distributing trout,2 or both 1,0411
Source: USDA–NASS. 12012 Census of Agriculture; December 31, 2012. 2Trout distributed for restoration, conservation, or recreational purposes.

25
TABLE 11: Honey* production, 2016 and 2017 2016 2017 Honey-producing colonies (1,000) 2,775 2,669 Yield per colony (lb) 58.3 55.3 Production (1,000 lb) 161,882 147,638 Stocks on December 15 (1,000 lb) 41,253 30,577 Value of production ($1,000) 343,028 318,308
Source: USDA–NASS. *For producers with five or more colonies.

26
TABLE 12: Production data on miscellaneous livestock, 2012
Commodity Number of
farms Inventory Number sold Alpacas 9,353 140,601 14,978 Bison 2,564 162,110 57,335 Deer 4,042 231,431 36,218 Ducks 21,115 5,018,661 23,180,663 Elk 1,199 38,061 6,913 Emus 1,550 13,281 3,064 Geese 10,286 106,462 201,548 Llamas 15,296 76,086 5,514 Mules, burros, donkeys 98,379 292,590 34,470 Ostriches 258 6,540 3,141 Pheasants 2,322 2,436,570 7,944,207 Pigeons 2,149 415,365 1,115,218 Quail 2,310 6,304,956 27,130,545 Rabbits 13,420 400,049 852,837 Roosters 13,399 7,564,783 8,354,819
Source: USDA–NASS 2012 Census of Agriculture.

27
TABLE 13: Slaughter statistics, 2017
Commodity
Federally inspected
plants (no.)
Slaughter in federally inspected
plants (1,000 head)*
Slaughter in State-inspected or
custom-exempt plants (1,000 head)
Cattle 666 31,704.3 485.1 Calves 190 503.3 9.0 Hogs 636 120,516.6 800.6 Sheep and lambs 537 1,937.2 240.9 Goats 443 488.8 108.9 Bison 90 51.8 6.6
Source: USDA–NASS Livestock Slaughter 2017 Summary, April 2018. *Includes data for the calendar year.