anaerobic digestion of stillage from a pilot scale wood‐to‐ethanol process ii....
TRANSCRIPT

This article was downloaded by: [Dalhousie University]On: 04 October 2014, At: 23:59Publisher: Taylor & FrancisInforma Ltd Registered in England and Wales Registered Number: 1072954 Registered office: Mortimer House,37-41 Mortimer Street, London W1T 3JH, UK
Environmental Technology LettersPublication details, including instructions for authors and subscription information:http://www.tandfonline.com/loi/tent19
Anaerobic digestion of stillage from a pilot scalewood‐to‐ethanol process II. Laboratory‐scale digestionstudiesI.J. Callander (deceased) a , T.A. Clark a & P.N. McFarlane aa Biotechnology Section, Wood Technology Division , Forest Research Institute , Private Bag,Rotorua, New ZealandPublished online: 17 Dec 2008.
To cite this article: I.J. Callander (deceased) , T.A. Clark & P.N. McFarlane (1986) Anaerobic digestion of stillage from a pilotscale wood‐to‐ethanol process II. Laboratory‐scale digestion studies, Environmental Technology Letters, 7:1-12, 397-412, DOI:10.1080/09593338609384427
To link to this article: http://dx.doi.org/10.1080/09593338609384427
PLEASE SCROLL DOWN FOR ARTICLE
Taylor & Francis makes every effort to ensure the accuracy of all the information (the “Content”) contained in thepublications on our platform. However, Taylor & Francis, our agents, and our licensors make no representationsor warranties whatsoever as to the accuracy, completeness, or suitability for any purpose of the Content. Anyopinions and views expressed in this publication are the opinions and views of the authors, and are not theviews of or endorsed by Taylor & Francis. The accuracy of the Content should not be relied upon and should beindependently verified with primary sources of information. Taylor and Francis shall not be liable for any losses,actions, claims, proceedings, demands, costs, expenses, damages, and other liabilities whatsoever or howsoevercaused arising directly or indirectly in connection with, in relation to or arising out of the use of the Content.
This article may be used for research, teaching, and private study purposes. Any substantial or systematicreproduction, redistribution, reselling, loan, sub-licensing, systematic supply, or distribution in anyform to anyone is expressly forbidden. Terms & Conditions of access and use can be found at http://www.tandfonline.com/page/terms-and-conditions
Environmental Technology Letters, Vol. 7, pp. 397-412© Science & Technology Letters, 1986
ANAEROBIC DIGESTION OF STILLAGE FROMA PILOT SCALE WOOD-TO-ETHANOL
PROCESSII. LABORATORY-SCALE DIGESTION STUDIES
I.J. Callander (deceased), T.A. Clark*, and P.N. McFarlaneBiotechnology Section, Wood Technology Division,
Forest Research Institute, Private Bag, Rotorua, New Zealand
(Received 23 June 1986; accepted 3 July 1986)
ABSTRACT
The anaerobic digestion of stillage from a pilot-scale wood-to-ethanol processwas investigated using an 8-litre, continuously-fed reactor. A methanogenicconsortium acclimated to Pinus radiata stillage was developed over 160 days bymaintaining a low organic loading rate. The loading rate was then graduallyincreased to c. 4 kg COD m-3 day-1. Nutrient, alkalinity, and mineralrequirements were quantified. Approximately 90% COD removal was obtained atspecific COD utilisation rates up to 0.5 g COD g VSS~1 day-1. The methane andtrue cell yields, per gram of soluble COD removed, were 0.313 1 CH4(STP) and0.142 g VSS. The endogenous decay coefficient was 0.0083 day-1.
INTRODUCTION
Part one (1) of this two part paper described the characteristics of awood-ethanol stillage, i.e., the wastewater produced by the New Zealand ForestResearch Institute (FRI) pilot-plant process of the conversion of Pinus radiatawood to ethanol. Anaerobic digestion was selected as a suitable stillage-treatment process for study because it displayed more favourable economics thanaerobic, wet oxidation, and evaporation treatment processes (2) and because it hasbeen successfully applied to the treatment of a variety of stillages (3-14). ofthe previous studies only Good et al (3) investigated the treatment ofwood-ethanol stillage. This effluent was generated from a large demonstration-scale plant using dilute sulphuric acid hydrolysis of eucalypt wood (3), a processsimilar to that used by the FSI pilot plant. Anaerobic digestion was a suitabletreatment for this stillage which was similar in composition to the P. radiatastillage produced by the FRI pilot plant (Table 1), even though it was derivedfrom a hardwood rather than a softwood. Because of the difference in stillageorigin, the compositions of potentially toxic, lignin-derived compounds in theP. radiata stillage could be expected to differ significantly from those ofcompounds in the eucalypt stillage.
This paper describes initial laboratory studies on the anaerobic digestion ofPinus radiata wood-ethanol stillage from the FRI dilute acid hydrolysis pilotplant. The study's aims were (1) to develop an anaerobic biomass acclimated to
397
Dow
nloa
ded
by [
Dal
hous
ie U
nive
rsity
] at
23:
59 0
4 O
ctob
er 2
014
P. radiata stillage; (2) to quantify its nutrient, mineral, and alkalinityrequirements, and then (3), to assess the efficiency of the digestion processunder conditions of increasing organic loading rate.
TABLE 1 - Comparison of the characteristics of the wood-ethanol stillagereported by Good et al (3) and that used in the present study
Parameter(g i-l except pH)
Eucalyptstillage
Good et al (3)
P. radiatastillage (1)
Chemical Oxygen Demand (COD)
Total Solids (TSS)
Volatile Solids (VSS)
Ash
S total
N total
P total
pH
COD:N:P
22.5
17.6
15.6
2.0
0.26-0.36+
0.2+
.0.04 +
5.8-6.3
100:0.88:0.17
25.5
13.7
8.8
4.9
0.60
0.095
0.010
4.5-5.0
100:0.37:0.04
Nitrogen and phosphorus have been added to the eucalypt stillage, and its levelof sulphur has been adjusted.
MATERIALS AND METHODS
Stillase
Stillage from typical pilot-plant operations was obtained as describedpreviously (1). Large batches (200 litres) were divided into 4-litre lots whichwere stored frozen until required. Thawed stillage was then maintained at 4°Cuntil it was transferred into the digester's feed container, where a magneticstirrer ensured that the suspended material would be evenly fed into the digesteritself. To prevent fungal growth an anaerobic atmosphere was maintained above thefeed. In preparing the stillage for feeding into the digester, the sulphateconcentration was modified by barium precipitation, and additions of sodiumhydroxide and various nutrients were made, as described below.
Sulphate Concentration: The sulphate remaining in the stillage is a function ofthe temperature at which the hydrolysis liquor is neutralised. The temperatureused in the pilot-plant process was 80°C, which gave sulphate concentrations ofapproximately 1800 mg 1~ . Commercially, neutralisation can be performed..at 140°C, resulting in sulphate concentrations of approximately 500 mg 1To simulate the effects of commercial practice the sulphate concentration wasreduced to approximately 500 mg 1 by precipitation with barium chloride.
398
Dow
nloa
ded
by [
Dal
hous
ie U
nive
rsity
] at
23:
59 0
4 O
ctob
er 2
014

A 10% solution of BaCl2.2H20 was used to precipitate a stoichiometric quantityof sulphate. After mixing for 15 minutes to ensure that the reaction was complete,the barium sulphate precipitate was removed from the suspension by vacuumfiltration through Whatman No. 1 filter paper.
Nutrient Addition: During the course of this study the stillage wassupplemented with various concentrations of nitrogen (N), phosphorus (P),potassium (K), magnesium (Mg), and iron (Fe) as AR-grade urea, NH4H2P0^,KC1, HgCl2.6H20, and FeCl3.6H2O, respectively. General methanogenicfermentation indicators along with analyses of the digester effluent for solublenutrient concentrations and analyses of digester contents for precipitateaccumulation, were used to assess the requirements for these added nutrients.
Alkalinity Addition: To maintain the digester pH above 6.80 an alkalinityaddition was required. A 20% NaOH solution was added to the stillage followingsulphate removal and nutrient addition. At low organic loading rates (<1 leg CODm~3 dayl) 2.5 ml 1~1 of this alkali solution was sufficient. At higherorganic loading rates (e.g. 3.5 kg COD m~3 day"1) 4 ml 1-1 was required.These additions of alkali (290-460 mg Na 1-1) ensured that the sodium (Na)concentration was low to avoid sodium toxicity.
Digester Start-up and Operation
A 10-litre aspirator with a working volume of 8 litres was used as thedigester or 'reactor'. The digester was maintained at 37°C in a water bath andits contents were mixed with a magnetic stirrer and a bar. A municipal wastewatertreatment plant supplied 8 litres of sludge from their anaerobic digester to seedthe FRI reactor. Before inoculation, this sludge was filtered through cheeseclothto remove fibrous material. The reactor headspace was purged initially with CO2and then with argon. An initial organic loading rate of 1 kg COD m~3 day-1was used.
The digester's feed and effluent were pumped simultaneously using a twin headperistaltic pump (Masterflex, Cole Palmer, USA) controlled by a cam timer tooperate for 2 minutes each hour. Mixing in the digester was stopped 15 minutesbefore feeding occurred to enable the biomass to settle. This "stir/settle" modeof operation resulted in an effluent with a low concentration of suspended solidsand allowed the digester to reach a higher biomass content than if continuouslymixed.
Analytical Methods
Volatile fatty acids were determined using a gas chromatographic techniquebased on the method of Holdeman and Moore (15). An ether extract was derived froman acidified sample and 2 ul of the extract were injected into a Pye Series 104gas chromatograph equipped with a flame ionisation detector and a Supelco 1220column (2 m x 4 mm). The flow rates of the nitrogen carrier gas, hydrogen gas,and air were 50, 38, and 360 ml min~l, respectively. n-Butyric acid was used asan internal standard. The column temperature was 125°C and the injection anddetector temperatures were 150°C.
Gas production was monitored using a wet test gas meter (Wilhelm Ritter,Bochum, FRG). The gas produced was analysed for O2/N2, methane, and CO2using a dual column Carle model 8700 chromatograph equipped with a thermalconductivity detector. A Poropak N/Q (50/80 mesh) column was used isothermally at85°C, with helium as the carrier gas.
399
Dow
nloa
ded
by [
Dal
hous
ie U
nive
rsity
] at
23:
59 0
4 O
ctob
er 2
014

The concentration of H2S in the gas was determined using Drager tubes (CH28201) in conjunction with a Drager hand pump (Dr'agerwerk A.G., Lubeck, FRG).
Analytical methods used to determine the Chemical Oxygen Demand (COD), metals,total nitrogen and phosphorus, have been described in an earlier publication (1).
Methods of Calculation
The concentration of total soluble sulphides in the digester was calculatedusing the technique of Lawrence et al (16).
The true growth yield and the endogenous decay coefficient were calculatedusing the following equations (17,18):
" V Yt t
whereju » ~c
where: <lcOD = specific COD utilisation rate (g COD g" 1 VSS day" 1)ju = specific growth rate (day-1)Y t = true growth yield (g VSS g COD)Kfl = endogenous decay coefficient (day-1)6C a solids retention time (day-1)
The material balance for COD assumed that 0.35 1 of methane (@ STP) wasequivalent to the mineralisation of 1.0 g COD and that the effluent was saturatedwith 32.8 mg 1-1 of methane.
The calculation technique used to determine the concentration of precipitatedanions has been described elsewhere (2).
RESULTS AND DISCUSSION
Initially, the organic loading rate was low to enable the biomass to acclimateto the stillage without inhibition occurring. During this acclimation phase (fromdays 1 to 160), experimentation with nutrient and sulphate levels was performed ina sequential manner to ascertain conditions for uninhibited, carbon-limitedgrowth. Following this phase, the levels of supplied nutrients were adjusted todetermine satisfactory operating levels and the actual nutrient and mineralrequirements were quantified. This nutrient adjustment phase ran from day 161 today 220. During the final increasing loading rate phase of the study (from day222 to day 340), the organic loading rate was steadily increased in order toassess the efficiency of digestion under operating conditions more appropriate fora commercial waste-treatment process. Chronological plots of the importantoperating parameters are presented in Figures 1 to 3.
Acclimation Phase (Days 1 to 160)
Following inoculation the digester biomass concentration was 5.0 gVSS 1~ . At the preliminary organic loading rate of approximately1 kg COD mT day" the initial sludge activity was 0.23 kg COD removed kgVSS~ day . During this phase the following nutrient additions were made to the
400
Dow
nloa
ded
by [
Dal
hous
ie U
nive
rsity
] at
23:
59 0
4 O
ctob
er 2
014

Figure 1: Chronological plots of digester operating conditions;
(a) digester pH and alkalinity(b) volatile acid concentrations and organic loading rate (the levels
of key inorganic species are shown in tabular form)(c) soluble nitrogen and phosphorus concentrations
(a)'
M 7-0-tuaa
00
a. _ 40057
o Alkalintly
1 0 0
ACCLIMATION PHASE
I - ) >
( — ) P
200
OAYS
NUTRIENTADJUSTMENT
PHASE
• lie acid
ociomc acid
INCREASEDLOADING RATE
PHASE
'8?5 E
2S
S O * ' mql"
N....«.,/-'
P«d.d«,r'
P.dual mgi"'
K.dd.dm g i - '
«,.«...,!-'
:« addadmgi"1
1950 | 70
240
120
300
4 8 0
2 4 0
~ 10
20
30
50
I 365I s| 194
4 3 0
120
120
To[en
400 1 500 1
0
' 0
0
(c)
OAYS 0
30 E
401
Dow
nloa
ded
by [
Dal
hous
ie U
nive
rsity
] at
23:
59 0
4 O
ctob
er 2
014

Figure 2: Chronological plots of digester operating conditions;
(a) biogas production(b) sludge activity(c) percentage total and soluble COD removal
(a)
zO 10
i •
Co)
8 0-2-
o
200
OArs
200
DAYS
(c)
O 40
luble COO
ial COO rn
DAYS
402
Dow
nloa
ded
by [
Dal
hous
ie U
nive
rsity
] at
23:
59 0
4 O
ctob
er 2
014
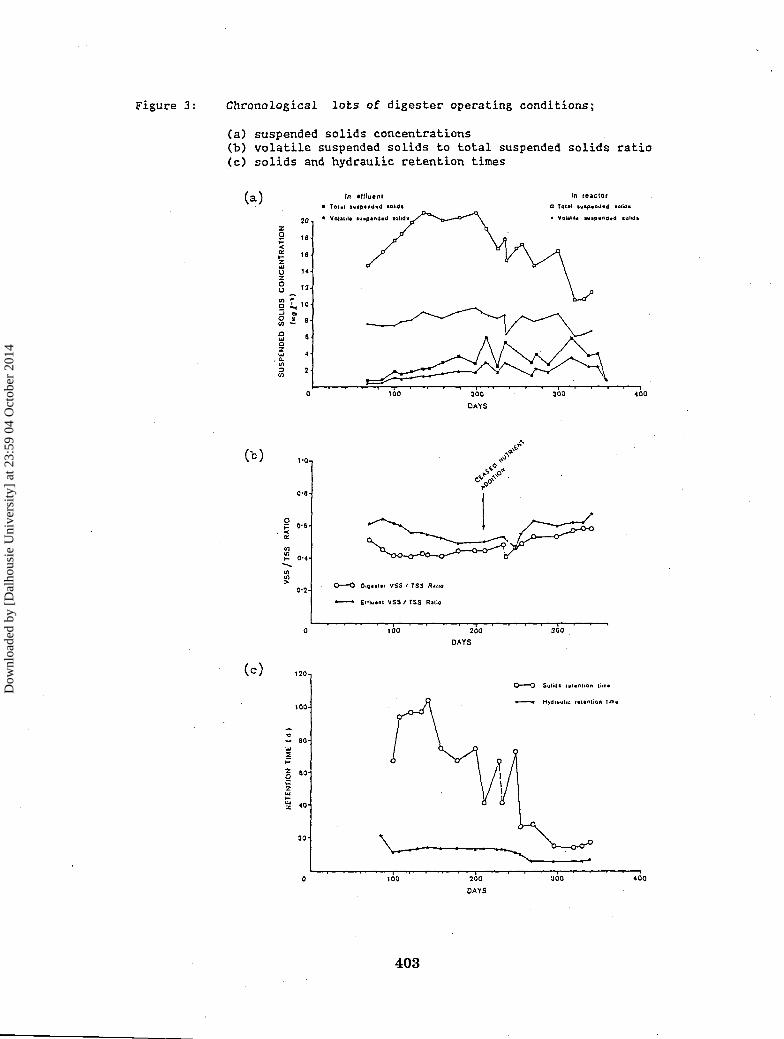
Figure 3: Chronological lots of digester operating conditions;
(a) suspended solids concentrations(b) volatile suspended solids to total suspended solids ratio(c) solids and hydraulic retention times
In reactor
a Total itiipandttd ao
*u»piind»d
(c )
O O D« VSS / TSS S«no
* * Ettlutnt VSS / TSS Rilio
200
DAYS
200
DAYS
403
Dow
nloa
ded
by [
Dal
hous
ie U
nive
rsity
] at
23:
59 0
4 O
ctob
er 2
014
raw stillage: nitrogen, 240 me 1 ; phosphorus, 120 mg 1 ; potassium20 mg 1~ ; magnesium, 30 m g l ; iron, 40 mg 1 . The stillage sulphateconcentration was 1950 mg 1 and no sulphate removal was performed.
Initially the reactor performed satisfactorily as shown by the reduced acetateand propionate concentrations achieved by day 30 (Fig. lb). However, despiteconsistent feeding techniques, organic loading rates, and nutrient additions,propionate began to rapidly accumulate in the digester after day 30, causing adrop in the digester pH from 7.20 to 6.90. The soluble sulphide concentration atthis time was estimated to be 190 mg 1-1 and hence it was concluded thatsulphide inhibition caused the propionate accumulation. This conclusion issupported by the fact that when the sulphate concentration in the feed stillagewas reduced from 1950 to 70 mg 1 on day 58 using barium precipitation, a rapiddecrease in the propionate concentration was observed over the next 12 days, sothat by day 80, satisfactory operation was again achieved (Fig. lb).
For the remainder of the study, the sulphate concentration in the feedstillage was lowered to approximately 500 mg 1 before digestion to simulate theeffect of high temperature neutralisation which normally would be performed in acommercial plant. The required sulphate concentration range was achieved althoughthe actual levels varied over the range 190 to 500 mg 1~ (Fig. lb). On day 120,towards the end of the acclimation phase, a second rapid accumulation ofpropionate occurred which had no known cause (the organic loading rate was still1 kg COD m~3 day"1 and other operating conditions had remained unchanged fromday 0). The propionate concentration then peaked at day 130, but by day 155 hadreturned to a satisfactorily low level. Sulphide toxicity was considered anunlikely cause since gas analysis performed on day 135 detected only 18 ppmhydrogen sulphide, equivalent to a total soluble sulphide concentration of 68mg 1-1. This is below the toxic concentration range of 100-150 mg 1-1 fortotal soluble sulphide (19-22).
Until day 110, because the feed container was unmixed and much of the addedphosphorus was precipitating, the actual concentration of phosphorus fed into thedigester was only c. 10 mg 1-1 (Fig. lb). Doubling the phosphorus addition(from 120 to 240 mg 1-1) on day 78 did not result in an increase in solublephosphate. Hence, from day 110 the level of added phosphorus was returned to 120mg 1-1 and the feed container was magnetically stirred to ensure that suspendedmaterial was also fed into the reactor.
Nutrient Adjustment Phase (Days 161 to 220)
Although the nutrient supplements were modified a number of times during thestudy, the phase of the experiment from day 161 to day 220 was called the nutrientadjustment phase since decisions on all subsequent nutrient additions werefinalised during this phase.
From day 161 to day 220 the organic loading rate was held at 1.5 kg CODm"3 day"1. Satisfactory operation of the digester was indicated by acetateand propionate concentrations less than 30 and 20 mg I"1, respectively, and by adigester pH of 6.95-7.00 at alkalinities of 3.3-3.7 g CaCO3 I"
1 (Fig. la).Over the same period approximately 5 1 day"1 of biogas were produced with totalCOD removal ranging from 70% to 77%, while soluble COD removal was consistentlybetween 86.3% and 87.2% (Fig. 2a,c). Sludge activity was also stable, fallingwithin the range 0.14 to 0.15 g COD removed g VSS-1 day-1 (Fig. 2b). Thereactor biomass concentration varied from 8.7 to 9.1 mg VSS 1-1 (Fig. 3a).
404
Dow
nloa
ded
by [
Dal
hous
ie U
nive
rsity
] at
23:
59 0
4 O
ctob
er 2
014

From day 110, nitrogen and phosphorus additions had been held constant at 430and 120 rag 1~^, respectively. Since subsequent analyses of the concentrationsof nitrogen and phosphorus in the soluble digester established that thesenutrients were being supplied in excess (Fig. la), the levels of supplementationremained unchanged during the experiment. However, the addition of the othernutrients (potassium, magnesium, and iron) ceased on day 209 because analyses forthese elements in the soluble effluent from the digester and' in the digester'ssuspended solids on day 157 revealed soluble potassium and magnesium levels (42and 44 mg l'l, respectively) well in excess of the added levels. Furthermore,in the digester's suspended solids iron was present at a concentration of 3120 mg1~1, indicating its accumulation by precipitation with other inorganic species.These data clearly established that the additions of potassium, magnesium, andiron were unnecessary and that the substantial accumulation of iron occurredbecause of inorganic precipitation. This latter fact, in conjunction with thefact that the inorganic precipitates were substantially retained in the digester,explained why the digester TSS had increased more rapidly than the digester VSS upto day 210 (Fig. 3a,b).
Increasing Organic Loading Rate Phase (Days 222 to 340)
A steady, incremental increase of the organic loading rate began on day 222,so that over a period of 40 days, the loading rate was increased from 0.8 to 3.5kg COD m-3 day-1 (Fig. lb). Throughout this phase satisfactorily lowconcentrations of acetate and propionate were maintained (Fig. lb), a near-neutralpH was achieved (Fig. la), and the volumetric gas production, which very closelymirrored the organic loading rate, increased from 3 to 15 1 day-1 (Fig. 2a).The increased gas production was associated with a substantial increase in sludgeactivity from c. 0.1 to an average of 0.5 g COD removed g VSS~1 day~l (Fig.2b). During this period an increase in the VSS/TSS ratio in both the reactor andthe effluent was observed (Fig. 3b), indicating that the previously precipitatednutrients were slowly being washed out of the reactor.
At higher organic loading rates satisfactory removals of total and soluble CODwere achieved (Fig. 2c). For example, at organic loading rates above 2.0 kg CODm~3 day~l the soluble COD removal was consistently between 87% and 92%. Asanticipated, the removal of total COD was more erratic because the biomassconcentrations varied with the settling of the sludge in the effluent. Mostimportantly, the soluble COD removal achieved at the increased organic loadingrates without potassiun, magnesium, and iron additions, was as good as or betterthan that achieved at lower loading rates with the addition of these elements.
In summary, the digester operated very satisfactorily without trace metaladdition for a period of 122 days. More significantly, over this period 17.2hydraulic retention times and 5.1 solids retention times had passed (Fig. 3c),with the result that the concentrations of any previously added metals werelowered to concentrations almost no different from those of unsupplementedinfluent stillage. These findings confirmed that supplementation of potassium,magnesium and iron was necessary and furthermore that soluble phosphorus andnitrogen were still present in the digester in excess at the higher organicloading rates (Fig. lc).
405
Dow
nloa
ded
by [
Dal
hous
ie U
nive
rsity
] at
23:
59 0
4 O
ctob
er 2
014

Nitrogen and Phosphorus Requirements
350
^300
a.5.250| 2 0 02
PH
gioo25 50
0
/NITROGEN / ^
s/L*^^^ PHOSPHORUS
VSS PRODUCED (g/d)
FIGURE 4: Nitrogen and phosphorusremoval rates versusvolatile suspended solidsproduction rate
A chronological plot of soluble nitrogenand phosphorus concentrations in thedigester is shown in Figure lc. Boththese nutrients appeared to be present atsatisfactory concentrations for carbon-limited microbial growth. The specificnitrogen and phosphorus requirements weredetermined by plotting the mass ofphosphorus and nitrogen consumed per dayagainst the mass of VSS synthesised perday (Fig. 4). Linear regression of theslopes of the resultant lines allowedcalculation of the nitrogen andphosphorus contents of the biomass (Table3). The nitrogen and phosphorus contentsof 0.0914 and 0.0332 g g VSS-1 can becompared with the data of Speece andMcCarty (25), who reported averagerequirements of 0.106 g N g VSS"1 and0.015 g P g VSS-1 fOr methanogenicconsortia digesting a range of•substrates. However, in their studies,the phosphorus requirements of the cellsvaried and were greatest for carbohydratewastes at long hydraulic retention times,so that under these conditions the Prequirement was about 50% of the Nrequirement (25). The values obtained inthis study using wood-ethanol stillageare consistent with these findings.
Methane Yield. True Growth Yield, and Endogenous Decay Coefficient
The production of biogas (Fig. 2a) mirrored the changing organic loading rate(Fig. lb). Over a number of analyses, the average methane content of the biogaswas 58.7% v/v. A plot of gas production rate versus the soluble COD removal rate(Fig. 5) produces a line whose slope gives the gas yield per g of sCOD removed.Interestingly, all the data, representing both low and high organic loading rates,fell onto a single straight line which passed through the origin.
The true growth yield and the endogenous decay coefficient were determined bysolving equation 1 graphically. A plot of q^oo versus u is presented in
Figure 6. From calculations of growth yield and decay coefficient (Table 3),specific COD utilisation rates up to 0.5 g COD g VSS-1 day-1 were obtained.These compare favourably with utilisation rates in full-scale applications ofanaerobic digestion (24,25). Values for kd reported in the literature for theanaerobic digestion of soluble wastewaters range from 0.010 to 0.088 day-1(23,26). Hence, the value from this study, 0.0097 day-1, is close to the lowerend of this range. As a check on the accuracy of these determinations, a CODbalance for the period, days 269-279, is presented in Table 4. During this stableoperating period, the organic loading rate was constant at 3.4 kg COD m"3day-land biomass accumulation within the reactor was negligible. The overall CODbalance agrees to within 1%, verifying the accuracy of the basic experimental
406
Dow
nloa
ded
by [
Dal
hous
ie U
nive
rsity
] at
23:
59 0
4 O
ctob
er 2
014
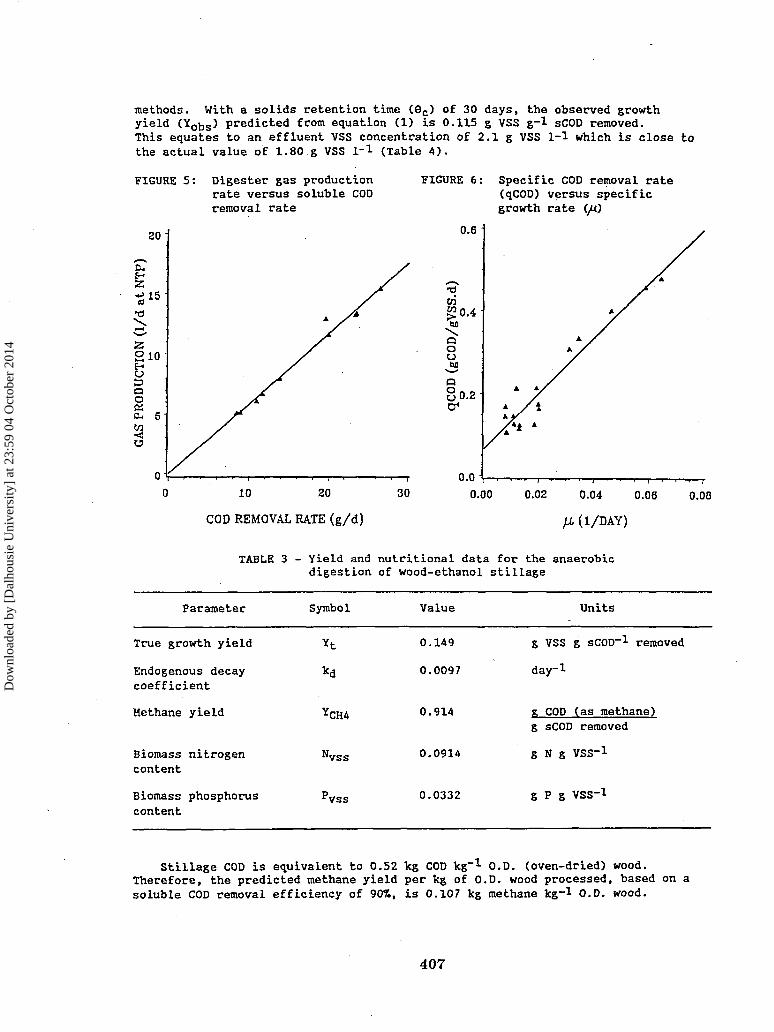
methods. With a solids retention time (6C) of 30 days, the observed growthyield (Yobs) predicted from equation (1) is 0.115 g VSS g-1 sCOD removed.This equates to an effluent VSS concentration of 2.1 g VSS 1-1 which is close tothe actual value of 1.80 g VSS 1-1 (Table 4).
FIGURE 5: Digester gas productionrate versus soluble CODremoval rate
20
FIGURE 6: Specific COD removal rate(qCOD) versus specificgrowth rate (/t)
0.6
10 20 30
COD REMOVAL RATE (g /d )
Qou
a8 0.2
0.00 0.02 0.04 0.06 0.08
\i. (I/DAY)
TABLE 3 - Yield and nutritional data for the anaerobicdigestion of wood-ethanol stillage
Parameter Symbol Value Units
True growth yield
Endogenous decaycoefficient
Methane yield
Biomass nitrogencontent
Biomass phosphoruscontent
0.149
0.0097
0.914
0.0914
0.0332
g VSS g sCOD"1 removed
d a y 1
K COD (as methane)g sCOD removed
g N g VSS"1
g P g VSS-1
Stillage COD is equivalent to 0.52 kg COD leg"1 O.D. (oven-dried) wood.Therefore, the predicted methane yield per kg of O.D. wood processed, based on asoluble COD removal efficiency of 90%, is 0.107 kg methane kg"1 O.D. wood.
407
Dow
nloa
ded
by [
Dal
hous
ie U
nive
rsity
] at
23:
59 0
4 O
ctob
er 2
014
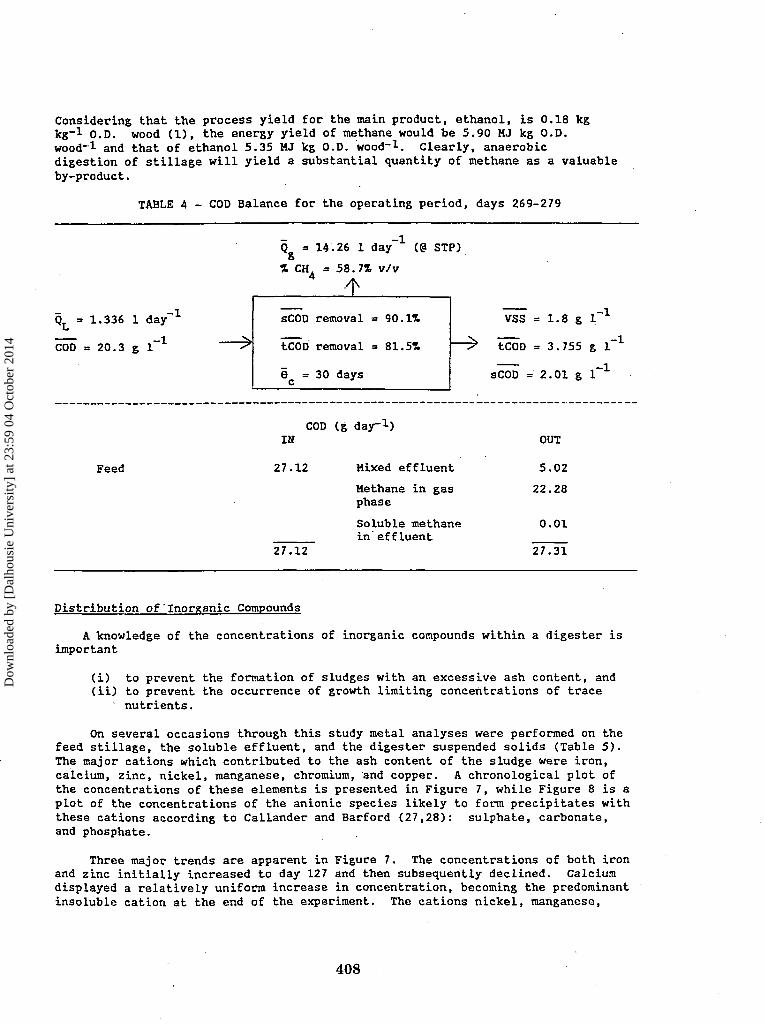
Considering that the process yield for the main product, ethanol, is 0.18 kgkg""1 O.D. wood (1), the energy yield of methane would be 5.90 MJ kg O.D.wood"1 and that of ethanol 5.35 MJ kg O.D. wood"1. Clearly, anaerobicdigestion of stillage will yield a substantial quantity of methane as a valuableby-product.
TABLE 4 - COD Balance for the operating period, days 269-279
QT = 1 . 3 3 6 1 day
COD = 2 0 . 3 g l " 1
- 1
Q = 14.26 1 day 1
% CH. = 58.7% v/v
STP)
sCOD
tCOD
§c =
removal
removal
30 days
= 90
= 81
.1%
.5%
-1VSS = 1.8 g 1
tCOD = 3.755 g 1
sCOD = 2.01 g 1
-1
-1
COD (g day"1)IN OUT
Feed 27.12
27.12
Mixed effluent
Methane in gasphase
Soluble methanein effluent
5.02
22.28
0.01
27.31
Distribution of'Inorganic Compounds
A knowledge of the concentrations of inorganic compounds within a digester isimportant
(i) to prevent the formation of sludges with an excessive ash content, and(ii) to prevent the occurrence of growth limiting concentrations of trace
N nutrients.
On several occasions through this study metal analyses were performed on thefeed stillage, the soluble effluent, and the digester suspended solids (Table 5).The major cations which contributed to the ash content of the sludge were iron,calcium, zinc, nickel, manganese, chromium, and copper. A chronological plot ofthe concentrations of these elements is presented in Figure 7, while Figure 8 is aplot of the concentrations of the anionic species likely to form precipitates withthese cations according to Callander and Barford (27,28): sulphate, carbonate,and phosphate.
Three major trends are apparent in Figure 7. The concentrations of both ironand zinc initiaLly increased to day 127 and then subsequently declined. Calciumdisplayed a relatively uniform increase in concentration, becoming the predominantinsoluble cation at the end of the experiment. The cations nickel, manganese,
408
Dow
nloa
ded
by [
Dal
hous
ie U
nive
rsity
] at
23:
59 0
4 O
ctob
er 2
014
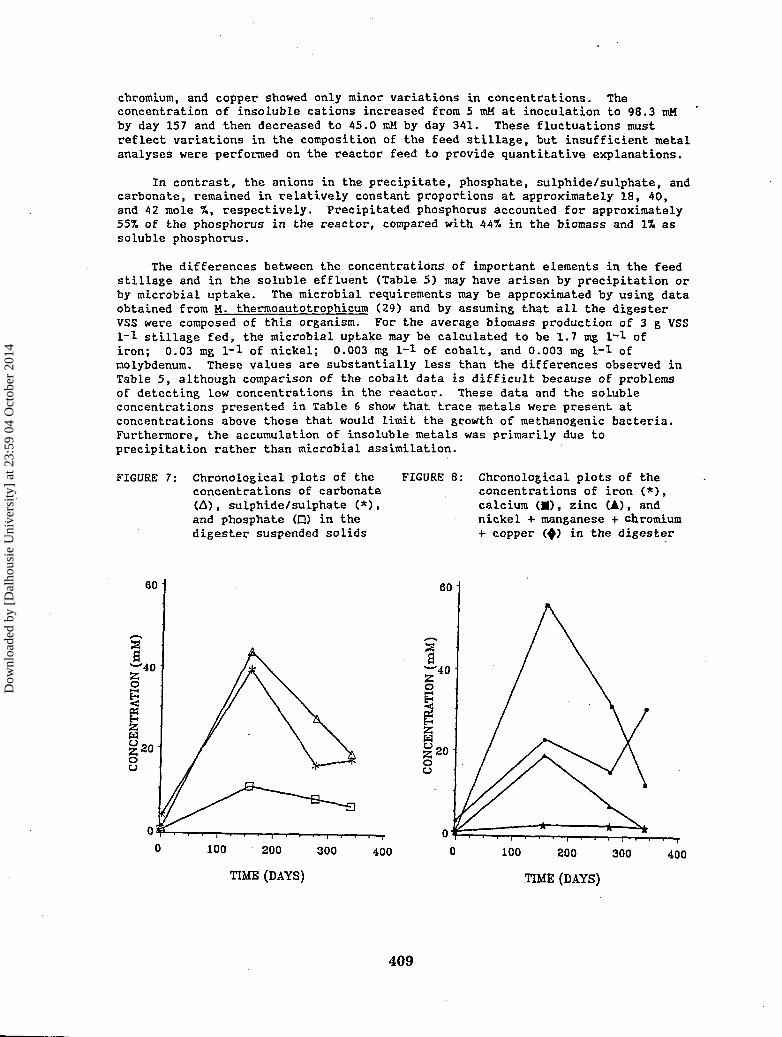
chromium, and copper showed only minor variations in concentrations. Theconcentration of insoluble cations increased from 5 tnM at inoculation to 98.3 mMby day 157 and then decreased to 45.0 mM by day 3A1. These fluctuations mustreflect variations in the composition of the feed stillage, but insufficient metalanalyses were performed on the reactor feed to provide quantitative explanations.
In contrast, the anions in the precipitate, phosphate, sulphide/sulphate, andcarbonate, remained in relatively constant proportions at approximately 18, 40,and 42 mole %, respectively. Precipitated phosphorus accounted for approximately557. of the phosphorus in the reactor, compared with 44% in the biomass and 1% assoluble phosphorus.
The differences between the concentrations of important elements in the feedstillage and in the soluble effluent (Table 5) may have arisen by precipitation orby microbial uptake. The raicrobial requirements may be approximated by using dataobtained from M. thermoautotrophicum (29) and by assuming that all the digesterVSS were composed of this organism. For the average biomass production of 3 g VSS1-1 stillage fed, the microbial uptake may be calculated to be 1.7 mg 1-1 ofiron; 0.03 mg 1-1 of nickel; 0.003 mg 1-1 of cobalt, and 0.003 mg 1-1 ofmolybdenum. These values are substantially less than the differences observed inTable 5, although comparison of the cobalt data is difficult because of problemsof detecting low concentrations in the reactor. These data and the solubleconcentrations presented in Table 6 show that trace metals were present atconcentrations above those that would limit the growth of methanogenic bacteria.B'urthermore, the accumulation of insoluble metals was primarily due toprecipitation rather than microbial assimilation.
FIGURE 7: Chronological plots of theconcentrations of carbonate(A), sulphide/sulphate (*),and phosphate (P) in thedigester suspended solids
FIGURE 8: Chronological plots of theconcentrations of iron (*),calcium (•), zinc (A), andnickel + manganese + chromium+• copper ($) in the digester
60
100 200 300 400 100
TIME (DAYS)
200
TIME (DAYS)
300
409
Dow
nloa
ded
by [
Dal
hous
ie U
nive
rsity
] at
23:
59 0
4 O
ctob
er 2
014
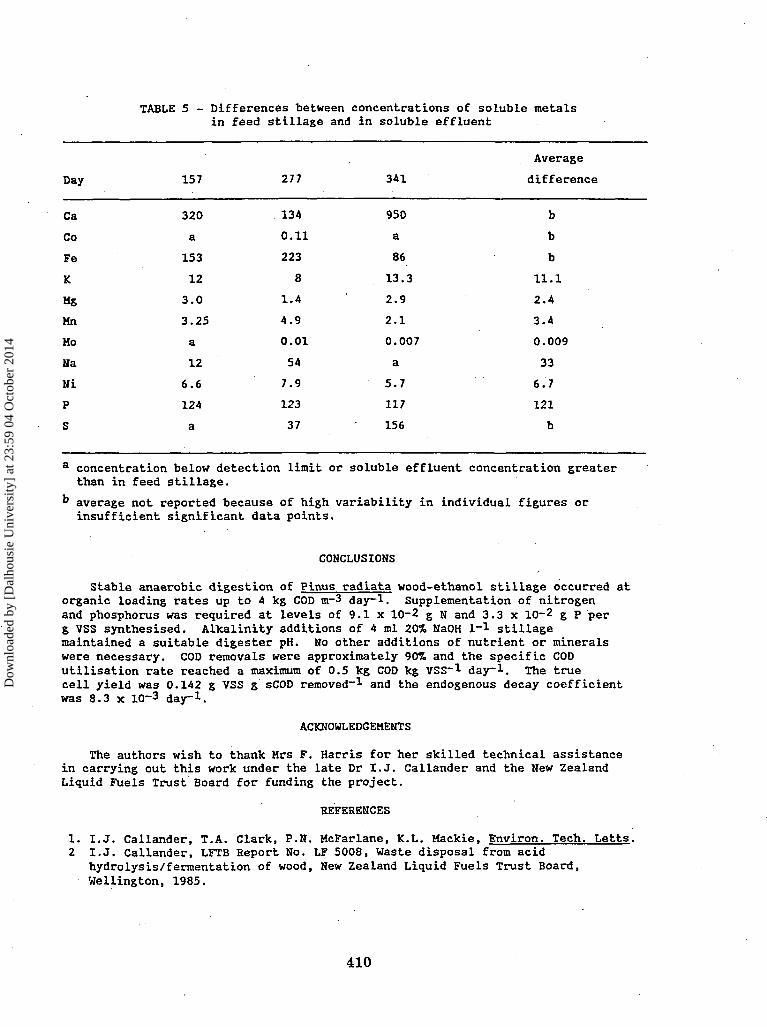
TABLE 5 - Differences between concentrations of soluble metalsin feed stillage and in soluble effluent
Average
Day 157 277 341 difference
Ca 320 134 950 b
Co a 0.11 a b
Fe 153 223 86 b
K 12 8 13.3 11.1
Mg 3.0 1.4 2.9 2.4
Mn 3.25 4.9 2.1 3.4
Mo a 0.01 0.007 0.009
Ha 12 54 a 33
Hi 6.6 7.9 5.7 6.7
P 124 123 117 121
S a 37 156 b
a concentration below detection limit or soluble effluent concentration greaterthan in feed stillage.
k average not reported because of high variability in individual figures orinsufficient significant data points.
CONCLUSIONS
Stable anaerobic digestion of Pinus radiata wood-ethanol stillage occurred atorganic loading rates up to 4 kg COD m~3 day-1. Supplementation of nitrogenand phosphorus was required at levels of 9.1 x 10⁻² g N and 3.3 x 10⁻² g p perg VSS synthesised. Alkalinity additions of 4 ml 20% NaOH I"1 stillagemaintained a suitable digester pH. No other additions of nutrient or mineralswere necessary. COD removals were approximately 90% and the specific CODutilisation rate reached a maximum of 0.5 kg COD kg VSS-1 day-1. The truecell yield was 0.142 g VSS g sCOD removed"* and the endogenous decay coefficientwas 8.3 x 10~3 day"1.
ACKNOWLEDGEMENTS
The authors wish to thank Mrs F. Harris for her skilled technical assistancein carrying out this work under the late Dr I.J. Callander and the New ZealandLiquid Fuels Trust Board for funding the project.
REFERENCES
1. I.J. Callander, T.A. Clark, P.N. McFarlane, K.L. Mackie, Environ. Tech. Letts.2 I.J. Callander, LFTB Report No. LF 5008, Waste disposal from acid
hydrolysis/fermentation of wood, New Zealand Liquid Fuels Trust Board,Wellington, 1985.
410
Dow
nloa
ded
by [
Dal
hous
ie U
nive
rsity
] at
23:
59 0
4 O
ctob
er 2
014

TABLE 6 - Metal concentrations in the feed stillage,soluble effluent, and in the digester suspendedsolids on days 1, 157, 277, and 341 (mg.1-1)
Day
Element
Al
B
Ca
Co
Cr
Cu
Fe
K
Mg
Mn
Mo
Na
Ni
P
Pb
S
Se
Sn
Sr
Zn
1
Susp.Solids
81
2.1
119
0.15
1.9
2.6
37
26
7.1
1.1
<0.10
49
4.1
49
<0.25
111
<0.34
0.50
0.48
7.0
FeedStillage
<0.45
0.52
1175
0.04
2.4
<0.04
183
54
47
3.7
<0.04
465
8.5
124
<0.25
101
<0.34
<0.05
2.3
6.0
157
SolubleEffluent
<0.45
0.56
855
<0.022
1.5
0.055
30
42
44
0.45
<0.04
453
1.9
<0.6
<0.25
123
<0.34
<0.05
1.6
0.50
Susp.Solids
66
1.3
913
0.60
7.3
2.6
3120
49
19.4
24.9
0.31
86
80
589
<0.25
1260
<0.34
0.63
2.3
1221
FeedStillage
3.9
3.5
796
0.17
2.0
0.33
259
35
18
6.6
0.03
507
8.4
128
0.28
66
<0.26
0.07
0.68
8.1
277
SolubleEffluent
2.9
4.0
662
0.06
0.73
0.29
35.8
27
16.6
1.7
<0.017
453
0.52
4.9
<0.17
29
<0.26
0.03
0.74
4.3
Susp.Solids
33
7.3
600
0.37
7.6
2.8
1748
75.4
16.0
21.7
0.16
135
72
486
1.5
505
0.78
0.27
1.2
438
FeedStillage
3.2
1.9
1277
<0.05
8.2
1.3
94
30
22
2.3
0.024
394
6.6
120
<0.16
204
<0.26
0.22
0.44
6.7
341
SolubleEffluent
7.4
0.55
327
0.10
6.9
0.78
8.1
16.7
19.1
0.21
<0.017
431
0.92
2.7
<0.16
48
<0.26
0.14
0.40
3.4
Susp.Solids
10.6
3.7
1225
<0.11
31
6.2
664
64
148
11.2
0.071
133
33.7
441
<0.40
556
<0.64
0.27
0.84
69
Dow
nloa
ded
by [
Dal
hous
ie U
nive
rsity
] at
23:
59 0
4 O
ctob
er 2
014
3. P. Good, R. Moudry and P. Fluri, Biotech. Letts. 4, 595-600 (1982).4. W.B. Hiatt, A.D. Carr and J.F. Andrews, Proc. 28th Ind. Waste Conf., Purdue
Univ, 966-976 (1973).5. E.J. Halbert and C.S. Barnes, Proc. 16th Conv. Inst. Brew. (Australia) (March).
219-225 (1980).6. L.A. Roth and C.P. Lentz, Can. Inst. Food Sci. Techno1. J. 10, 105-108 (1977).7. B. Frostell, Chemistry and Industry 4 July, 465-469 (1981).8. T.G. Shea, E. Ramos, J. Rodriguez and G.H. Dorion, U.S. E.P.A. Report
660-2-74-074. 99 pp. July 1974.9. G.G. Cillie, M.R. Henzen, G.J. Stander and R.D. Baillie, Water Research 3,
623-643 (1969).10. I.J. Callander and J.P. Barford, Biotech. Letts 5, 755-760 (1983).11. F. Sanchez-Riera, S. Valz-Gianinet, D. Callieri and F. Sineriz, Biotech. Letts
4, 127-132 (1982).12. R. Braun and S. Huss, Anaerobic filter treatment of molasses distillery slops.
Dept Applied Microbiology, Univ. Agr. Forestry, Vienna, Austria, 1981.13. Anonymous, Water/Engineering and Management, Sept, 30-32 (1982).14. M.S. Switzenbaum, Enzyme Microb. Techno1 5, 242-250 (1983).15. L.V. Holdeman and W.E.C. Moore (eds.), Anaerobic Laboratory Manual, 3rd edn,
Virginia Polytechnic Institute Anaerobic Lab, Blacksburg, Virginia 24060, USA.16. A.W. Lawrence, P.L. McCarty and F.J. Guerin Proc. 19th Ind. Waste Conf.,
Purdue Univ, 343-357 (1964).17. S.J. Pirt, Principles of microbe and cell cultivation, Blackwell Scientific
Publications, Oxford, 1975.18. J. Fieschko and A.E. Humphrey, Biotech Bioeng. 26, 394-396 (1984).19. M.R. Winfrey and. J.G. Zeikus, Appl. Environ. Microbiol. 33, 275-281 (1977).20. A.W. Khan and T.M. Trottier, Appl. Environ. Microbiol. 35, 1027-1034 (1978).21. P. Scherer and H. Sahm, Europ. J. Appl. Microbiol. Biotechnol. 12, 28-35
(1981).22. R.E. Speece, Environ. Sci. Technol. 17(9), 416A-427A (1983).23. H.E. Speece and P.L. McCarty, Adv. Water Pollut. Res. 2, 305-322 (1964).24. G. Lettinga, A.F.M. van Velsen, S.W. Hobma, W. de Zeeuw and A. Klapwijk,
Biotechnol. Bioenr. 22, 699-734 (1980).25. K.C. Pette, R. de Vletter, E. Wind and W. van Gils, Proc. 35th Ind. Waste
Conf., Purdue Univ., 635-659 (1980).26. P.M. Sutton, A.Li, R.R. Evans and S. Korchin, Proc. 37th Ind. Waste Conf.,
Purdue Univ, 667-676 (1982).27. I.J. Callander and J.P. Barford, Biotechnol. Bioeng. 25, 1947-1957 (1983).28. I.J. Callander and J.P. Barford, Biotechnol. Bioeng. 25, 1959-1972 (1983).29. P. Schonheit, J. Moll and R.K. Thauer, Arch. Microbiol. 123, 105-107 (1979).
412
Dow
nloa
ded
by [
Dal
hous
ie U
nive
rsity
] at
23:
59 0
4 O
ctob
er 2
014