process upsets in a full-scale anaerobic digestion ... · process upsets in a full-scale anaerobic...
TRANSCRIPT

Energy, Sustainabilityand Society
Moeller and Zehnsdorf Energy, Sustainability and Society (2016) 6:30 DOI 10.1186/s13705-016-0095-7
ORIGINAL ARTICLE Open Access
Process upsets in a full-scale anaerobicdigestion bioreactor: over-acidification andfoam formation during biogas production
Lucie Moeller* and Andreas ZehnsdorfAbstract
Background: Biogas plays a worthwhile role as a renewable, storable energy source. Anaerobic digestion (AD) isthe core process in biogas production. The two most common process upsets that occur during this biotechnologicalprocess in practice are over-acidification and foam formation. Several research projects have been carried out so far toidentify the causes of these upsets and to develop early warning indicators. However, the relevant laboratory resultshave not yet been verified in practice. Accordingly, the aim of this work was to study the practical application of thepublished tools in the case of a full-scale biogas plant.
Methods: A full-scale AD plant utilizing cattle manure and energy crops was sampled over a period of 12 weeks.During this time, over-acidification and foam formation occurred in the primary digester.
Results: The sum of acetate, propionate and butyrate (VFAS) and the ratios of VFAS to magnesium (VFAS/Mg), calcium(VFAS/Ca), and phosphorus (VFAS/P) were found to be good predictive tools to identify over-acidification for the givenAD system. Their values increased by factors of 6 (VFAS/Mg and VFAS/Ca) and 13 (VFAS, VFAS/P) in the early over-acidification phase. In contrast, the VFA/TIC ratio, which is a common indicator in practice, increased only by a factor of2 during this phase. An ammonium-nitrate-urea solution proved to be an effective agent for foam suppression whensugar beet was used as a substrate. Its application showed no negative effect on the daily electricity production andthe achieved long-term foam elimination.
Conclusions: Several parameters were verified to be able to serve as an early warning indicator of over-acidification,but not one was found to be able to serve as an early warning indicator of foam formation in AD. Further research isneeded to identify parameters with predictive potential for indicating foaming in AD.
Keywords: Anaerobic digestion, Biogas, Over-acidification, Foaming, Process upsets, Full-scale
BackgroundAnaerobic digestion (AD) is a commonly used processfor the utilization of biogenic material for energy pro-duction. Knowledge of the microbial process for the an-aerobic digestion has increased considerably in recentyears. However, there are issues still remaining unclear.The most common upsets of the biogas process areover-acidification [1] as well as the formation of foam[2] and floating layers [3].Over-acidification is an upset of the AD process
characterized by a decline in digestate pH due to the
* Correspondence: [email protected] for Environmental Biotechnology, UFZ—Helmholtz Centre forEnvironmental Research GmbH, Permoserstrasse 15, 04318 Leipzig, Germany
© 2016 The Author(s). Open Access This articleInternational License (http://creativecommons.oreproduction in any medium, provided you givthe Creative Commons license, and indicate if
accumulation of fatty acids as a consequence of a dis-turbed methanogenesis step. Over-acidification occursmainly as a result of an overload of the biogas systemdue to either high organic loading rates [1, 4] or theoccurrence of inhibitors in the digester such as am-monia, sulfide, heavy metals, or substituted phenoliccompounds [5–7].The formation of foam may also occur as a consequence
of high organic loading rates [8]. Furthermore, the use ofsome substrates such as grain [9], sugar beet [10–12], oryeast [2] can even in relatively small amounts lead to foamformation.The consequences of these process upsets are financial
losses due to the reduced biogas yield [13] as well as the
is distributed under the terms of the Creative Commons Attribution 4.0rg/licenses/by/4.0/), which permits unrestricted use, distribution, ande appropriate credit to the original author(s) and the source, provide a link tochanges were made.

Table 1 Analytical data of the digestates from the primary andsecondary digesters during stable operation (n = 5)
Primary digester Secondary digester
TS (%) 6.34 ± 0.54 4.98 ± 0.60
VS (% TS) 74.2 ± 0.53 68.2 ± 0.75
pH (−) 7.80 ± 0.15 7.93 ± 0.14
VFA/TIC (−) 0.19 ± 0.01 0.16 ± 0.01
NH4-N (g/L) 1.131 ± 153 1.680 ± 201
Acetate (mg/L) 126 ± 49.2 12.1 ± 11.8
Propionate (mg/L) 24 ± 5.76 10.7 ± 10.2
Butyrate (mg/L) <1 <1
Moeller and Zehnsdorf Energy, Sustainability and Society (2016) 6:30 Page 2 of 10
increased deployment of staff and costs for anti-foamingagents [14]. In addition, the roof of the digester can de-velop leaks or be damaged if foaming occurs [2].Research activities in the field of AD process upsets
have mainly concentrated on the development of upset-prevention strategies. With regard to foam formation, atest set for the estimation of the foaming tendency ofsubstrates [15] has been developed recently. Several abi-otic factors were identified to be able to serve as earlywarning indicators (EWIs) for over-acidification: thetotal or individual concentration of volatile fatty acids(VFA) [16], the propionic/acetic acid ratio [4], the VFA/alkalinity ratio (also known as VFA/TIC) [17, 18], theVFA/Ca ratio, the phosphate concentration, the PO4/Caratio [1], phenylacetic acid [19], as well as biogas pro-duction [16] and biogas composition, especially the CH4
yield [20] and hydrogen concentration [21].All of these studies are primarily based on research
conducted in laboratory-scale biogas digesters underwell-defined conditions.The aim of this work is to apply the experimental data
to a full-scale system. For this reason, a full-scale anaer-obic digester that was fed with a mixture of cattle ma-nure, maize and grass silage, sugar beet, and coarsegrain was sampled for a period of 12 weeks. During thesampling period, two process upsets occurred: over-acidification and the formation of foam. The electricityproduction rate (that corresponds to the biogas produc-tion) and the methane and hydrogen sulfide contents inthe biogas were measured on-site. During weekly sam-pling, various off-site abiotic parameters were deter-mined in order to understand the course of the processupset development and to apply the EWIs under real op-erational conditions.
MethodsGeneral characteristics of the AD plantAn AD plant close to Leipzig was sampled once a weekfor 6 weeks. This AD plant was briefly introduced in [12].The AD plant went into operation in 2006 and is used
for the digestion of cattle manure from a dairy farm withco-digestion of energy crops. It has an installed electricalpower of 540 kWel. The AD plant consists of one di-gester with a volume of 1800 m3, one secondary digesterwith a volume of 2200 m3 and two digestate storagetanks with volumes of 4000 m3 each. The gas storage inthe roofs of the digesters was designed for 6000 m3 ofbiogas. Agitation in the primary digester is carried outby a horizontal paddle agitator and a submersible mixer.The secondary digester is mixed using two submersiblemixers. The biogas is transformed into energy in twocombined heat and power (CHP) units that combust thebiogas, which was produced in both digesters. As nobiogas volume was measured onsite, the daily CHP
output was used as a parameter that depends on thedaily biogas production and, thus, demonstrates thechanges in microbial activity. The methane and hydro-gen sulfide contents of the biogas are measured continu-ously using an SSM 6000 LT biogas analyzer (Pronova,Germany).Wet fermentation is operated at 40 °C. The annual sub-
strate input is 20,000 t. The average substrate hydraulic re-tention time in the two digesters reaches 80 days (35 daysfor the primary and 45 days for secondary digester). Theobtained organic loading rate is 4–5 kg VS m−3 days−1.The substrate mix consists of cow manure (55 % w/wfresh mass), maize silage (19 % w/w fresh mass), and—ona seasonal basis—sugar beet (15 % w/w fresh mass), grasssilage (4 % w/w fresh mass), coarse grain (2 % w/w freshmass), and residual fodder (2 % w/w fresh mass). The di-gester is loaded once per hour. The agitation cycle in thedigester is 6 min per hour during stable operation and iscontinuous during the foaming periods. The characteris-tics of the digestates from the primary and secondarydigesters in stable operation are shown in Table 1.
Characteristics of the AD plant operation during themonitoring periodThe biogas plant suffered from two kinds of process im-balances during the monitoring period from September2014 to February 2015 (i.e., 158 days): foam formationon two occasions and one over-acidification phase. Nodigestate samples were collected during the first foamingphase. Sampling was started on day 81 of the monitoringperiod and lasted for 12 weeks until day 158. This timespan was further split into two time periods: the processupset period (from the very beginning until day 123) andthe period of stable operation (days 124 to 158).The substrate input during the process upset period is
shown in Fig. 1. The first foaming event lasted from thestart of sugar beet co-digestion at the beginning of themonitoring period until day 54. Based on previous re-search results concerning foam formation, in the case ofsugar beet substrate use [12], a reduction of foam was
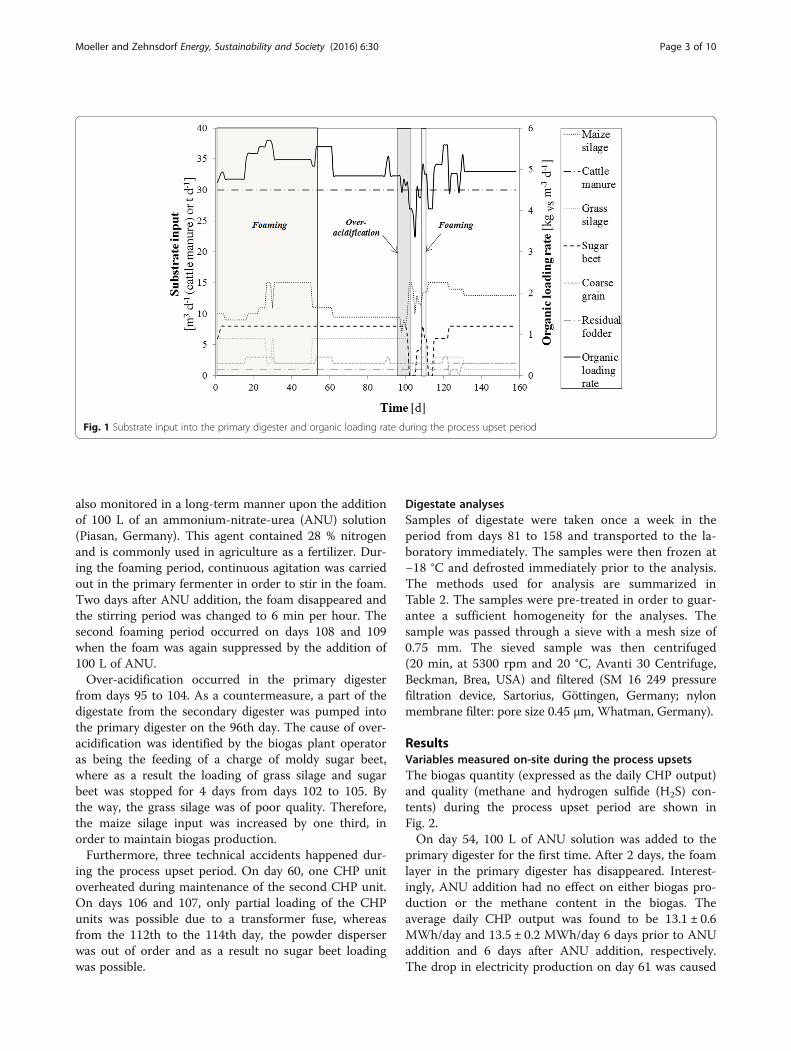
Fig. 1 Substrate input into the primary digester and organic loading rate during the process upset period
Moeller and Zehnsdorf Energy, Sustainability and Society (2016) 6:30 Page 3 of 10
also monitored in a long-term manner upon the additionof 100 L of an ammonium-nitrate-urea (ANU) solution(Piasan, Germany). This agent contained 28 % nitrogenand is commonly used in agriculture as a fertilizer. Dur-ing the foaming period, continuous agitation was carriedout in the primary fermenter in order to stir in the foam.Two days after ANU addition, the foam disappeared andthe stirring period was changed to 6 min per hour. Thesecond foaming period occurred on days 108 and 109when the foam was again suppressed by the addition of100 L of ANU.Over-acidification occurred in the primary digester
from days 95 to 104. As a countermeasure, a part of thedigestate from the secondary digester was pumped intothe primary digester on the 96th day. The cause of over-acidification was identified by the biogas plant operatoras being the feeding of a charge of moldy sugar beet,where as a result the loading of grass silage and sugarbeet was stopped for 4 days from days 102 to 105. Bythe way, the grass silage was of poor quality. Therefore,the maize silage input was increased by one third, inorder to maintain biogas production.Furthermore, three technical accidents happened dur-
ing the process upset period. On day 60, one CHP unitoverheated during maintenance of the second CHP unit.On days 106 and 107, only partial loading of the CHPunits was possible due to a transformer fuse, whereasfrom the 112th to the 114th day, the powder disperserwas out of order and as a result no sugar beet loadingwas possible.
Digestate analysesSamples of digestate were taken once a week in theperiod from days 81 to 158 and transported to the la-boratory immediately. The samples were then frozen at−18 °C and defrosted immediately prior to the analysis.The methods used for analysis are summarized inTable 2. The samples were pre-treated in order to guar-antee a sufficient homogeneity for the analyses. Thesample was passed through a sieve with a mesh size of0.75 mm. The sieved sample was then centrifuged(20 min, at 5300 rpm and 20 °C, Avanti 30 Centrifuge,Beckman, Brea, USA) and filtered (SM 16 249 pressurefiltration device, Sartorius, Göttingen, Germany; nylonmembrane filter: pore size 0.45 μm, Whatman, Germany).
ResultsVariables measured on-site during the process upsetsThe biogas quantity (expressed as the daily CHP output)and quality (methane and hydrogen sulfide (H2S) con-tents) during the process upset period are shown inFig. 2.On day 54, 100 L of ANU solution was added to the
primary digester for the first time. After 2 days, the foamlayer in the primary digester has disappeared. Interest-ingly, ANU addition had no effect on either biogas pro-duction or the methane content in the biogas. Theaverage daily CHP output was found to be 13.1 ± 0.6MWh/day and 13.5 ± 0.2 MWh/day 6 days prior to ANUaddition and 6 days after ANU addition, respectively.The drop in electricity production on day 61 was caused

Table 2 Analytical methods for wet chemical analyses of the digestate
Parameter Sample pre-treatment Analytical methods and instruments
TS No DIN 12880
VS No DIN 12879
pH value Sieved Microprocessor pH meter pH 95 (WTW, Germany)
VFA/TIC Sieved Titration method according to [18]
TOC, TN Sieved TOC-VCSH/CSN with a TN unit (Shimadzu, Japan)
NH4–N Filtered DIN 38406 E5. Spektroquant® test kit (measuring range 0.01-3 mgL−1 NH4-N, Merck. Germany). photometric measurement withMultiLab P5 (WTW, Weilheim, Germany)
Acetate, propionate, butyrate, lactate Filtered High-performance liquid chromatography (Shimadzu, Japan);detector: RID-10A; column: VA 300/7.8 Nucleogel Ion 300 OA;eluent: 0.01 N H2SO4
Water-soluble elements (Ca, Mg, P, S, K, Na) Filtered Inductively coupled plasma atomic emission spectrometry ICP-AES(Spectroflame, Spectro Int., Kleve, Germany)
Moeller and Zehnsdorf Energy, Sustainability and Society (2016) 6:30 Page 4 of 10
by a defect in the CHP units as described in the“Characteristics of the AD plant operation during themonitoring period” section and had no relation to thebiogas process itself. The biogas contained 51.9 ± 0.5 %methane prior to ANU addition and 52.5 ± 0.2 % methanethereafter. The concentration of hydrogen sulfideshowed a decreasing trend after ANU addition. The fer-menter content surface remained normal until the re-sumption of sugar beet feeding after the break due toover-acidification.As a consequence of over-acidification, daily electricity
production halved from 13.5 MWh/day to 6.9 MWh/dayduring just 2 days from the 95th to the 97th day. Thepumping of the digestate from the secondary digester to
Fig. 2 Quality of biogas produced in the biogas plant during the process uwell as methane and hydrogen sulfide (H2S) contents in the biogas
the primary digester caused a temporary improvementin daily electricity production, and 10.9 MWh/day wereproduced on day 101. Nevertheless, there was a furtherdeterioration in CHP output during the following day,resulting in the biogas plant operator’s decision tochange the substrate mix by discontinuing the feeding ofsugar beet and grass silage (Fig. 1). This measure ultim-ately led to a complete recovery of the system after4 days.The methane concentration in the biogas dropped from
values of 53 % before the process upset down to 45.5 % onday 96. The H2S content reached its maximum value of688 ppm at the same time. Over the course of the over-acidification event, the methane concentrations changed
pset period. Daily output of combined heat and power (CHP) units as

Table 4 Concentrations of organic acids in the digestates fromthe primary digester
Time (d) Acetate(mg/L)
Propionate(mg/L)
Butyrate(mg/L)
Lactate(mg/L)
VFAS (ΣAcProBut)(mg/L)
81 19.8 <1 <1 13.0 19.8
88 130 27.0 <1 <1 157
95 2023 85.2 38.0 <1 2,146
102 8827 655 602 <1 10,084
109 2586 119 44.3 27.8 2749
116 2832 61.0 24.2 30.5 2917
123 295 18.7 <1 30.0 314
130 119 26.4 <1 60.0 145
137 149 32.4 <1 53.8 181
144 88 17.2 <1 52.3 105
151 77 20.9 <1 30.6 98.0
158 199 23.0 <1 69.1 222
The data from the over-acidification period are marked in bold and those fromthe foaming period in bold and italics
Moeller and Zehnsdorf Energy, Sustainability and Society (2016) 6:30 Page 5 of 10
to values of 50 % and the H2S concentration droppedagain to 490 ppm. After the substrate mix was changed,the methane concentration gradually increased to 59.5 %on day 105.The H2S concentration continued its descending trend
until day 108, when the next process upset occurred: thereintroduction of sugar beet into the substrate mixture(Fig. 1) caused foaming in the primary digester. The30 cm foam layer disappeared after ANU addition. TheH2S concentration increased slightly after the foamingperiod, although it was still lower than during the stableperiod before over-acidification. The methane concentra-tion decreased after the foaming period by 6 % from 57 to51 % and remained stable for 3 days. Thereafter, the me-thane content increased again to 53.5 % and remained atthis level until the end of the first sampling period.After repeated ANU addition, no foam was observed
up to the end of the period of sugar beet co-digestionduring the final days of the monitoring period.
Analytical data during the process upsetsThe analytical data of the samples from the primary di-gester before, during and after the over-acidification andthe second foaming period are shown in Tables 3, 4, and 5.The VFA showed an increasing tendency from the verybeginning of sampling (Table 3). The VFA/TIC ratio rosefrom 0.13 to 0.17 during this time (Table 3) and reachedits maximum value of 1.69 on day 102. Due to the effect-ive countermeasures that were implemented by the biogasplant operator (starvation diet and pumping of a part ofthe digestate from the secondary digester to the primarydigester), the VFA/TIC ratio dropped rapidly to 0.4 1 weeklater. In this time, foam formation occurred in the primary
Table 3 pH value, ammonium-nitrogen (NH4–N), VFA/TIC, TOC,and TN of digestates from the primary digester
Time (d) pH VFA(mg/L)
TIC(mg/L)
VFA/TIC(−)
TOC(mg/L)
TN(mg/L)
NH4–N(mg/L)
81 7.90 1606 12,073 0.13 19,570 4570 1550
88 7.94 1871 11,073 0.17 16,652 4144 1316
95 8.05 3311 10,179 0.33 17,710 4270 1230
102 7.03 9196 5441 1.69 21,316 4273 1483
109 8.09 4034 10,861 0.37 18,610 4233 1494
116 8.19 3731 9,485 0.39 17,055 4169 1198
123 7.91 2154 11,815 0.18 15,914 3784 1080
130 7.99 1627 9,005 0.18 18,148 4312 1541
137 7.73 2133 10,814 0.20 17,996 4422 1261
144 7.93 1884 10,440 0.18 16,700 4064 1217
151 7.70 2017 11,525 0.18 17,689 4297 1443
158 7.64 2291 10,906 0.21 10,490 3433 1194
The data from the over-acidification period are marked in bold and those fromthe foaming period in bold and italics
digester. Three weeks after over-acidification, the VFA/TIC ratio dropped again to 0.2 and remained at this leveluntil the end of the sampling period. In the secondary di-gester, the VFA/TIC ratio was stable at 0.15 ± 0.02 duringthe entire sampling time.The pH value was stable during the first three weeks
of sampling at 7.96 ± 0.07 and decreased to 7.03 only atthe time of the most intensive over-acidification on day102 (Table 3). One week later, during foam formation,the pH value of 8.1 was again within its normal range.In the next sample, the pH further increased to 8.2,dropping to a value of 7.9 and remaining stable at values
Table 5 Concentrations of water-soluble elements in the sam-ples of the digestates from the primary digester
Time(days)
Calcium(mg/L)
Magnesium(mg/L)
Phosphorus(mg/L)
Sulfur(mg/L)
Potassium(mg/L)
Sodium(mg/L)
81 218 210 20.5 33.6 3270 258
88 243 269 12.2 34.0 3230 273
95 212 217 37.9 47.0 2980 252
102 425 343 41.7 39.1 3110 270
109 149 157 40.4 42.6 3170 231
116 92.0 89.5 27.9 41.1 2510 199
123 91.7 134 44.6 42.9 2870 215
130 167 281 53.4 62.5 4630 357
137 161 173 54.8 47.2 2860 250
144 83.5 112 42.8 44.0 3470 238
151 123 169 37.9 40.4 3630 252
158 127 145 52.9 40.0 3220 228
The data from the over-acidification period are marked in bold and those fromthe foaming period in bold and italics

Moeller and Zehnsdorf Energy, Sustainability and Society (2016) 6:30 Page 6 of 10
of 7.80 ± 0.15 until the end of sampling. In the secondarydigester, the pH value was never lower than 7.8 duringthe entire sampling time.The alkalinity (TIC) displayed a slightly declining ten-
dency during the first 3 weeks, showing a rapid reductionof almost one half during over-acidification from values of10–12 to 5.4 g/L (Table 3). In the post-acidification phase,the TIC values rapidly returned to the values presentbefore the process upset. In the secondary digester, the al-kalinity was stable at 12.7 ± 1.07 g/L during the samplingperiod and showed no large variations.The organic carbon concentration (TOC) reached its
highest value of 21.3 g/L during over-acidification(Table 3). In the weeks thereafter, this value graduallydropped to 16 g/L and remained stable at this valueuntil the end of sampling. The TOC concentration inthe secondary digester of 15.1 ± 1.86 was somewhatlower than in the primary digester due to the conver-sion of carbon to methane in the primary digester. Thenitrogen concentration (TN) in both digesters remainedvirtually stable during the sampling period (primary di-gester 4.16 ± 0.30 g/L, secondary digester 4.52 ± 0.44 g/L).The TN concentration was higher in the secondary di-gester compared to the primary digester, as was also thecase for ammonium-nitrogen (primary digester 1.33 ±0.16 g/L, secondary digester 1.65 ± 0.21 g/L).The acetate concentration increased during the first
two sampling weeks from 20 to 130 mg/L, while propi-onate appeared in the VFA spectrum in the second sam-ple, but was below the detection limit in the first sample(Table 4). Over the further course of AD, all concentra-tions of single VFAS increased significantly: acetatereached 8.8 g/L, propionate 0.65 g/L, and butyrate0.60 g/L on day 102. As a result of the countermeasuresthat were implemented, the acetate concentration de-creased again by 70 % to 2.6 g/L on the 109th day andby a further 90 % in the period from day 116 to 123.The acetate concentration remained at low values of21.2 ± 16.4 mg/L during the entire sampling period inthe secondary digester. Propionate appeared in the sec-ondary digester on day 102 at a very low concentration(15.3 mg/L). Its content rose slightly in the next sampledue to the addition of acidified material from the pri-mary digester. In the remaining samples, the propionateconcentration was below the detection limit in the sec-ondary digester. No butyrate was detected in the second-ary digester at any time.The concentration of lactate had the opposite ten-
dency to that of acetate, propionate and butyrate; itsconcentration was considerably lower and, in somecases, below the detection limit during over-acidificationwhen compared with the remaining samples (Table 4).The concentrations of calcium and magnesium
reached their highest values at the 102nd day during the
over-acidification phase (Table 5). The sulfur concentra-tion had already reached its maximum 1 week beforeover-acidification, i.e., during the early over-acidificationphase. The phosphorus concentration increased firstduring the acidification phase from 20 to 42 mg/L, anddecreased thereafter until day 116. During the stableperiod, the phosphorus concentration reached a max-imum of 53 mg/L. The potassium concentration first de-creased until day 95, and then showed an increasingtendency again during the over-acidification phase. Thesodium concentration fluctuated between 0.25 and0.27 g/L at first, and then showed a declining tendencyafter the process upset, falling to 0.2 g/L on day 116.
DiscussionProcess parameters during process upsetThe CHP output decrease during the first two days ofthe over-acidification period was accompanied by anH2S increase to 688 ppm triggered by the high sulfurconcentrations that were detected in the liquid phase(Table 5). The inhibition levels of H2S were dependenton the pH and showed IC50 values of 250 ppm H2S atpH 6.4–7.2 and 90 ppm H2S at pH 7.8–8.0 [6]. Thus,the enhanced H2S concentration probably caused the in-hibition of methanogens in the primary digester due to apH drop. The sulfate-reducing bacteria were apparentlynot affected by the altered conditions, meaning that theH2S percentage in the biogas was increased during thetime of low methanogenic activity. On the other hand,the relatively high isolated peaks of the H2S concentra-tion with 632 ppm as a maximum were also detectedduring the first foaming period (Fig. 2). The relativelyhigh methane concentration of almost 60 % afterprocess stabilization can be explained by the utilizationof stranded VFA and, at the same time, the reduced hy-drolysis gas due to the reduced organic loading rate(see also Fig. 1) and, as a result, the reduced dilution ofbiogas by carbon dioxide.Neither foam formation nor nitrogen supplementation
by the ANU solution had any effect on electricity pro-duction and, thus, also the biogas production (Fig. 2).The drop in CHP output before the second foamingperiod was not caused by any process upset, but was in-stead caused by the reduced loading of the CHP units,as described in the “Characteristics of the AD plant op-eration during the monitoring period” section. Onecould initially suspect that the decrease in the methaneconcentration after the second foaming period could beattributed to the presence of nitrate in the N-fertilizersolution. It is generally known that some bacteria andarchaea are able to use nitrate as a terminal electron ac-ceptor in energy metabolism [22, 23] and, thus, nitratereduction competes with the production of methane.Nevertheless, recent research has shown that nitrate can

Moeller and Zehnsdorf Energy, Sustainability and Society (2016) 6:30 Page 7 of 10
also have a positive effect on methane production at lowconcentrations of 0.5 g L−1 NO3–N for AD of foodwaste [24]. In the AD plant described here, only 100 Lof ANU solution was used that contained 28 % nitrogen,7 % of which was NO3−N. Thus, the end concentrationof added NO3–N in the primary digester amounted to4 mg kg−1 of fresh mass. For this reason, the negative ef-fect of nitrate on methane concentration should beregarded as unlikely in this case. Moreover, the additionof ANU solution during the first foaming event had noapparent effect on CHP output and biogas composition(Fig. 2). It is assumed that the lowering of the TOC/TNratio and the slight pH increase in the primary digesterled to an improvement of the hydrolysis that was de-tected by the disappearance of the foam layer. The en-hanced hydrolysis in turn led to the dilution of themethane concentration by hydrolysis gas.Foam formation had no effect on the analytical data
except for a slight pH increase after ANU addition.However, most of the wet analytical measured datachanged during over-acidification of the digestate. Theincrease in the VFA concentration (Table 4) led to an in-crease of the VFA/TIC ratio and TOC content (Table 3).In addition, the concentrations of some water-soluble el-ements such as magnesium, calcium, manganese, phos-phorus and sulfur showed an increasing tendency duringover-acidification (Table 5). Elements that commonlyoccur as monovalent ions (K and Na) were not affectedby over-acidification. On the other hand, some parame-ters such as alkalinity (Table 3) and substrates such aslactate (Table 4) reached their minimum values duringthe over-acidification phase.The decrease in the lactate concentration is accom-
panied by the appearance of propionate in the VFAspectrum. Lactate is known to be an intermediate in thedegradation of soluble sugars to propionic acid in AD[25]. With regard to the substrate mixture (Fig. 1), sugarbeet is the co-substrate that supplies the AD bacteriawith soluble carbohydrates such as sucrose. The sugarbeet loading was constant until the 108th day. As soonas propionate was no longer degraded due to disruptedmethanogenesis, no more lactate was produced. Afterthe over-acidification phase and the resumption of sugarbeet feeding on day 106, lactic acid appeared in the or-ganic acid spectrum again. At this time, the propionateconcentration in the digestate had already demonstrateda decreasing tendency.
Process upset indicatorsOne of the indicators for over-acidification used by thebiogas plant operator was the daily CHP output (Fig. 2).In the case of foaming, the digestate surface was visuallychecked every day.
The aim of this study was to test the known EWIs forbiogas process upsets in a full-scale biogas plant. As no-ticed on day 95 during the period of the first processupset, the over-acidification of the AD process hadalready been in progress for a minimum of 1 week, asthere had been an increase in the acetate and propionateconcentrations in the previous samples (Table 4).Kleyböcker et al. [1] introduced three EWIs for over-
acidification in AD processes: EWI-VFA/Ca, EWI-PO4/Ca and EWI-PO4. The authors developed these indica-tors and demonstrated their predictive ability in an ADsystem with sewage sludge and rapeseed oil as substrates[1, 26]. As other substrates rich in carbohydrates andlow in grease are used as energy crop fed to AD plants,the verification of these indicators is important for theseAD systems. With regard to VFAS/Ca, a very good pre-dictive capability was demonstrated as this ratio showeda considerable increase by a factor of 7 between thesecond and third sampling period (Fig. 3a). Over thecourse of further over-acidification, the value continuedto increase by a factor of 16. When compared with itscommonly used equivalent, VFA/TIC, the EWI-VFA/Cavalue showed a clearer increasing tendency during earlyover-acidification; EWI-VFA/Ca increased by a factor of15 and VFA/TIC only by a factor of 2 during the weekfrom the 88th to the 95th day. The concentration ofphosphorus, which can be observed to be proportionalto the water-soluble ortho-phosphate concentration(EWI-PO4), showed a local maximum on day 102 (Fig. 3b),i.e., not before the over-acidification time. However, theabsolute maximum of 54.8 mg/L was reached on day 137.Also, EWI-PO4/Ca (here expressed as P/Ca) showed noclear tendency during the process upset (Fig. 3b). Thus,these two EWIs were not applicable for the process upsetdescribed here.Extending the approach of Kleyböcker et al. [1], which
used ratios of abiotic parameters as EWIs on other abi-otic parameters, several other indicators for over-acidification can be identified. The values of the VFA/Mg ratio strongly resemble those of the VFA/Ca ratio.This is not surprising as magnesium shows similar pro-perties to calcium in neutralizing volatile fatty acids.However, the most recognizable response during theover-acidification phase was observed for VFAS/P andVFAS/S. During over-acidification, these ratios increasedfrom values below one to 240 and 260 in the case ofVFAS/P and VFAS/S, respectively, and fell rapidly againduring the recovery phase (Fig. 3c). The rise in VFAS/Pduring the first sampling week was even more intensivethan that of VFAS alone.The VFA/TIC ratio is generally used for routine
checking of biogas plants [3] as this method is cheapand simple. This parameter also showed a good pre-dictive ability for process upsets in the case of the

Fig. 3 Time course of ratios of wet analytical data (a) VFA/TIC, VFAS/Ca and VFAS/Mg; (b) phosphor, P/Ca and propionate/acetate; (c) VFAS/P andVFAS/S) as possible EWIs for AD process upsets. For the reason of better clarity, the daily CHP-output (corresponding to the daily biogas production)and VFAS concentration is shown in all three graphics
Moeller and Zehnsdorf Energy, Sustainability and Society (2016) 6:30 Page 8 of 10
over-acidified AD plant described in this paper, as isalso shown in Table 3. Furthermore, the VFA valuecan be used for the calculation of VFA/P, VFA/Ca,VFA/Mg, and VFA/S, which show similar tendenciesas in the case of VFAS/P, VFAS/Ca, VFAS/Mg, andVFAS/S (data not shown).
Boe et al. [16] identified the total VFAS as well as indi-vidual volatile fatty acids as indicators of over-acidification.Both of these parameters also showed good predictiveability in the process upset described in this article. TheVFAS increased between the second and third samplingperiod during the over-acidification phase by a factor of 14

Moeller and Zehnsdorf Energy, Sustainability and Society (2016) 6:30 Page 9 of 10
and subsequently by a factor of 4.7. In consequence, allEWIs more or less mimicked the development of the VFAS
concentration (Fig. 3). With regard to individual VFAS, theacetate concentration rose rapidly from the very beginningof sampling. The appearance of propionate and butyrate inthe VFA spectrum during the second and third samplingweek pointed to an imminent process upset. It should benoted that the sole VFA value measured by the titrationmethod (Table 3) agreed with the VFAS measured byHPLC (Table 4) only at very high acetate concentrations.The propionic/acetic acid ratio that was presented by
Marchaim and Krause [4] as “a reliable indicator forimpending failure” showed a rapid increase in the veryearly over-acidification phase from 0 to 0.21 (Fig. 3b).This value however decreased again very quickly duringthe subsequent course of AD due to the enormous in-crease in the acetate concentration. Thus, this indicatoris not suitable for the process upsets described in thispublication. Marchaim and Krause [4] showed that thepropionic/acetic acid ratio was useful as an indicator ofover-acidification after overloading an AD system with aglucose solution. As in the case of the full-scale digesterdescribed in this work, the over-acidification cause was apoisoning of the system by mycotoxines produced in themoldy substrate; thus, the reaction mechanism variedfrom that of Marchaim and Krause [4].To evaluate the praxis relevance of the above mentioned
EWIs, the usage of the VFAS was the most appropriatemethod for the prediction of the over-acidification.However, the analysis of VFA by the cheap titrationmethod was not sensitive enough. The EWI-VFA/Cashowed a better predictability than its commonly usedanalog VFA/TIC.Several parameters exhibited a response in the case of
over-acidification. However, none of them could be usedfor the prediction of foam formation. Previous researchhas shown that the formation of foam in AD is the resultof a disorder in the hydrolysis stage of the AD of organicmaterial [2, 9]. For this reason, none of the commonlymeasured parameters are suitable as EWIs for foamingbecause only analytes connected with the later stages ofbiogas production such as volatile fatty acids are ob-served in practice. The only parameter that was consid-ered in the literature in association with AD foamingwas the C/N ratio [12]. During the first four samplingweeks, the TOC/TN ratio increased to 4.99. However, atthe time of foaming, TOC/TN already had a decliningtendency, meaning that no reliable conclusions can bedrawn concerning the use of the TOC/TN ratio as anindicator for foaming here. In the case of cattle rumen,high levels of potassium and low levels of sodium wereassociated with bloat, which is also a kind of AD foam-ing [27]. The sodium concentration decreased after theover-acidification phase from values of 250–270 to
231 mg/L during the foaming period and further de-creased to 199 mg/L thereafter (Table 5). Subsequently,the sodium concentration rose again to 215 mg/L andhigher values. In contrast, there was only a small localmaximum of 3170 mg/L in the potassium concentrationcurve at the time of foaming. Nonetheless, this value wasexceeded in the stable phases prior to and after theprocess upsets, meaning that the findings of Hall andMajak [27] cannot be applied to this case of AD foaming.
ConclusionsThis study demonstrated the possibility of the predictionof over-acidification in anaerobic digestion by usingseveral parameters. Along with the already known earlywarning indicators (EWIs) of VFA and VFA/Ca, theVFA/P, VFA/Mg, and VFA/S ratios were identified assuitable indicators for over-acidification caused by dis-turbed methanogenesis due to the feeding of moldy sub-strates. An ammonium-nitrate-urea solution that is usedas a fertilizer in agriculture was found to be a suitableagent for long-term foam suppression for sugar beet co-digestion in practice. The results are of great relevancedue to the transfer of previous research to the practice.More research is needed to identify early warning indi-cators for foam formation in anaerobic digestion.
AbbreviationsAD: Anaerobic digestion; ANU: Ammonium-nitrate-urea solution; CHP: Combinedheat and power station; EWI: Early warning indicator; TIC: Alkalinity, total inorganiccarbonate buffer; TN: Total nitrogen; TOC: Total organic carbon; TS: Total solids [%];VFA: Volatile fatty acids (determined by titration method); VFAS: Totalfatty acid, a sum of acetate, propionate and butyrate concentrations;VS: Volatile solids [% TS]
AcknowledgementsThis project was funded by the Initiating and Networking Fund of the HelmholtzAssociation (grant number PD-083). The authors would like to thank the operatorof the affected biogas plant for the support provided. Special thanks also go toIsabell Weickardt for her support with the sample analysis.
Authors’ contributionsLM collected and sorted the publication and information material, collectedand analyzed the samples, and prepared the manuscript. AZ led the project,contributed with critical reading of the manuscript, and provided input forthe final version. Both authors read and approved the final manuscript.
Authors’ informationLM is a researcher at the Centre for Environmental Biotechnology at theHelmholtz Centre for Environmental Research GmbH—UFZ. Her researchinterests focus on process upsets in the anaerobic digestion as the mainprocess of biogas production.AZ is a senior researcher and group leader of the working group BioprocessEngineering at the Centre for Environmental Biotechnology at the HelmholtzCentre for Environmental Research GmbH—UFZ and Professor at theUniversity of Cooperative Education Riesa. He has more than 20 yearsexperience working in the field of white and gray biotechnology mostly incooperation with industry partners.
Competing interestsThe authors declare that they have no competing interests.
Received: 28 April 2016 Accepted: 27 September 2016

Moeller and Zehnsdorf Energy, Sustainability and Society (2016) 6:30 Page 10 of 10
References1. Kleyböcker A, Liebrich M, Verstraete W, Kraume M, Würdemann H (2012)
Early warning indicators for process failure due to organic overloading byrapeseed oil in one-stage continuously stirred tank reactor, sewage sludgeand waste digesters. Bioresource Technol 123:534–541. doi:10.1016/j.biortech.2012.07.089
2. Moeller L, Görsch K (2015) Foam formation in full-scale biogas plants processingbiogenic waste. Energy Sustain Soc 5:1. doi:10.1186/s13705-014-0031-7
3. Lienen T, Kleyböcker A, Brehmer M, Kraume M, Moeller L, Görsch K,Würdemann H (2013) Floating layer formation, foaming, and microbialcommunity structure change in full-scale biogas plant due to disruption ofmixing and substrate overloading. Energy, Sustain Soc 3:20. doi:10.1186/2192-0567-3-20
4. Marchaim U, Krause K (1993) Propionic to acetic acid ratios in overloadedanaerobic digestion. Bioresource Technol 43:195–203. doi:10.1016/0960-8524(93)90031-6
5. Lin C-Y (1992) Effect of heavy metals on volatile fatty acid degradation inanaerobic digestion. Wat Res 26:177–183. doi:10.1016/0043-1354(92)90217-R
6. Chen Y, Cheng JJ, Creamer KS (2008) Inhibition of anaerobic digestionprocess: a review. Bioresource Technol 99:4044–4064. doi:10.1016/j.biortech.2007.01.057
7. Hernandez JE, Edyvean RGJ (2008) Inhibition of biogas production andbiodegradability by substituted phenolic compounds in anaerobic sludge.J Hazard Mater 160:20–28. doi:10.1016/j.jhazmat.2008.02.075
8. Kougias PG, Boe K, O-Thong S, Kristensen LA, Angelidaki I (2014) Anaerobicdigestion foaming in full-scale biogas plants: a survey on causes andsolutions. Water Sci Technol 69:889–895. doi:10.2166/wst.2013.792
9. Moeller L, Krieg F, Zehnsdorf A, Mueller RA (2016) How to avoid foamformation in biogas plants by coarse grain anaerobic digestion. Chem EngTechnol 39:673–679. doi:10.1002/ceat.201500300
10. Stoyanova E, Forsthuber B, Pohn S, Schwarz C, Fuchs W, Bochmann G(2014) Reducing the risk of foaming and decreasing viscosity by two-stage anaerobic digestion of sugar beet pressed pulp. Biodegradation 25:277–289. doi:10.1007/s10532-013-9659-9
11. Suhartini S, Heaven S, Banks CJ (2014) Comparison of mesophilic andthermophilic anaerobic digestion of sugar beet pulp: performance,dewaterability and foam control. Bioresource Technol 152:202–211.doi:10.1016/j.biortech.2013.11.010
12. Moeller L, Lehnig M, Schenk J, Zehnsdorf A (2015) Foam formation inbiogas plants caused by anaerobic digestion of sugar beet. BioresourceTechnol 178:270–277. doi:10.1016/j.biortech.2014.09.098
13. Pagilla KR, Craney KC, Kido WH (1997) Causes and effects of foaming inanaerobic sludge digesters. Water Sci Tech 36:463–470. doi:10.1016/S0273-1223(97)00556-8
14. Moeller L, Goersch K, Neuhaus J, Zehnsdorf A, Mueller RA (2012) Comparativereview of foam formation in biogas plants and ruminant bloat. Energy SustainSoc 2:12. doi:10.1186/2192-0567-2-12
15. Moeller L, Eismann F, Wißmann D, Nägele H-J, Zielonka S, Müller RA,Zehnsdorf A (2015) Innovative test method for the estimation of thefoaming tendency of substrates for biogas plants. Waste Manage 41:39–49.doi:10.1016/j.wasman.2015.03.031
16. Boe K, Batstone DJ, Steyer J-P, Angelidaki I (2010) State indicators formonitoring the anaerobic digestion process. Water Res 44:5973–5980. doi:10.1016/j.watres.2010.07.043
17. Zickefoose C, Hayes RB (1976) Anaerobic sludge digestion: operationsmanual, EPA 430/9-76-001
18. Lili M, Biró G, Sulyok E, Petis M, Borbély J, Tamás J (2011) Novel approachon the basis of FOS/TAC method. Analele Universităţii din Oradea, Fascicula:Protecţia Mediului 17:713–718, http://protmed.uoradea.ro/facultate/anale/protectia_mediului/2011B/im/15.%20Mezes%20Lili.pdf
19. Hecht C, Griehl C (2009) Investigation of the accumulation of aromaticcompounds during biogas production from kitchen waste. BioresourceTechnol 100:654–658. doi:10.1016/j.biortech.2008.07.034
20. Chynoweth D, Svoronos S, Lyberatos G, Harman J, Pullammanappallil P,Owens J, Peck M (1994) Real-time expert system control of anaerobicdigestion. Water Sci Technol 30:21–29
21. Archer DB, Hilton MG, Adams P, Wiecko H (1986) Hydrogen as a processcontrol index in a pilot scale anaerobic digester. Biotechnol Lett 8:197–202.doi:10.1007/BF01029380
22. Cabello P, Roldán MD, Moreno-Vivián C (2004) Nitrate reduction andthe nitrogen cycle in archea. Microbiol 150:3527–3546. doi:10.1099/mic.0.27303-0
23. Zumpft WG (1997) Cell biology and molecular basis of denitrification.Microbiol Mol Biol Rev 61:533–616
24. Sheng K, Chen X, Pan J, Kloss R, Wei Y, Ying Y (2013) Effect of ammonia andnitrate on biogas production from food waste via anaerobic digestion.Biosystems Eng 116:205–212. doi:10.1016/j.biosystemseng.2013.08.005
25. Zhang B, Cai W, He P (2007) Influence of lactic acid on the two-phaseanaerobic digestion of kitchen wastes. J Environm Sci 19:244–249. doi:10.1016/S1001-0742(07)60040-0
26. Kleyböcker A, Lienen T, Liebrich M, Kasina M, Kraume M, Würdemann H(2014) Application of an early warning indicator and CaO to maximize thetime-space-yield of a completely mixed waste digester using rape seed oil asco-substrate. Waste Manage 34:661–668. doi:10.1016/j.wasman.2013.11.011
27. Hall JW, Majak W (1989) Plant and animal factors in legume bloat. In:Cheeke PR (ed) Toxicants of plant origin, vol 3, Proteins and amino acids.CRC Press, Boca Raton, FL, USA, pp 93–106
Submit your manuscript to a journal and benefi t from:
7 Convenient online submission
7 Rigorous peer review
7 Immediate publication on acceptance
7 Open access: articles freely available online
7 High visibility within the fi eld
7 Retaining the copyright to your article
Submit your next manuscript at 7 springeropen.com