re-evaluating dorsolateral prefrontal cortex activation during working memory in schizophrenia
TRANSCRIPT

Schizophrenia Research 108 (2009) 143–150
Contents lists available at ScienceDirect
Schizophrenia Research
j ourna l homepage: www.e lsev ie r.com/ locate /schres
Re-evaluating dorsolateral prefrontal cortex activation during workingmemory in schizophrenia
Katherine H. Karlsgodt a, Jacqueline Sanz b, Theo G.M. van Erp a, Carrie E. Bearden c,Keith H. Nuechterlein d, Tyrone D. Cannon a,e,f,⁎a Department of Psychology, UCLA, 1285 Franz Hall, Box 951563, Los Angeles, CA 90095-1563, United Statesb Kennedy Krieger Institute, Behavioral Psychology, 720 Aliceanna Street, 2nd Floor, Baltimore, MD 21202, United Statesc Semel Institute, UCLA, 300 Medical Plaza Suite 2265, Los Angeles, California, 90095, United Statesd Department of Psychiatry and Biobehavioral Sciences, UCLA, 300 UCLA Medical Plaza, Room 2240, Los Angeles, CA 90095-6968, United Statese Department of Psychiatry, UCLA, 1285 Franz Hall, Box 951563, Los Angeles, CA 90095-1563, United Statesf Department of Human Genetics, UCLA, 1285 Franz Hall, Box 951563, Los Angeles, CA 90095-1563, United States
a r t i c l e i n f o
⁎ Corresponding author. Department of Psychology,Box 951563, Los Angeles, CA 90095-1563, United St8765; fax: +1 310 794 9740.
E-mail address: [email protected] (T.D. Cann
0920-9964/$ – see front matter © 2009 Elsevier B.V.doi:10.1016/j.schres.2008.12.025
a b s t r a c t
Article history:Received 4 September 2008Received in revised form 10 December 2008Accepted 17 December 2008
Previous neuroimaging studies of working memory (WM) in schizophrenia have generatedconflicting findings of hypo- and hyper-frontality, discrepancies potentially driven bydifferences in task difficulty and/or performance. This study proposes and tests a new modelof the performance-activation relationship in schizophrenia by combining changes by loadwithoverall individual differences in performance. Fourteen patients with recent-onsetschizophrenia and eighteen controls underwent functional magnetic resonance imagingwhile performing a parametric verbal WM task. Group level differences followed a linear“cross-over” pattern, such that in controls, activation in the dorsolateral prefrontal cortex(DLPFC) increased as performance decreased, while patients showed the opposite. Overall, lowperforming patients were hypoactive and high performing patients hyperactive relative tocontrols. However, patients and controls showed similar functions of activation by load inwhich activation rises with task difficulty but levels off or slightly decreases at higher loads.Moreover, across all loads and at their own WM capacity, higher performing patients showedgreater DLPFC activation than controls, while lower performing patients activated least. Thisstudy establishes a novel framework for predicting the relationship between functionalactivation and WM performance by combining changes of activation by WM load occurringwithin each subject with the overall differences in activation associated with general WMperformance. Essentially, increasing task difficulty correlates asymptotically with increasingactivation in all subjects, but depending on their behavioral performance, patients show overallhyper- versus hypofrontality, a pattern potentially derived from individual differences inunderlying cellular changes that may relate to levels of functional disability.
© 2009 Elsevier B.V. All rights reserved.
Keywords:Prefrontal cortexMagnetic resonance imagingEfficiencyTask performanceMemorySchizophreniaBrainCognition
1. Introduction
Functional neuroimaging studies of working memory(WM) in schizophrenia have generated apparently conflictingfindings of hypo- (e.g. (Barch et al., 2003; Cannon et al., 2005;
UCLA, 1285 Franz Hall,ates. Tel.: +1 310 206
on).
All rights reserved.
Driesen et al., 2008; Ragland et al., 1998; Stevens et al., 1998)and hyper-activation (Callicott et al., 2000; Manoach et al.,2000; Manoach et al., 1999) in the dorsolateral prefrontalcortex (DLPFC). One interpretation of this pattern combinesthe hypothesis of lower processing capacity in schizophreniawith an extrapolation of the Yerkes–Dodson law (Yerkes andDodson, 1908) to WM. In this model, the relationship of fMRIactivation with WM load is represented by overlappinginverted U-curves, with the patient curve shifted to reflectlower capacity, thus providing points of both hyper- and

144 K.H. Karlsgodt et al. / Schizophrenia Research 108 (2009) 143–150
hypo-frontality (Callicott et al., 2003; Manoach, 2003) (seeFig. 1a). Essentially, an individual's activation is likely to below when task difficulty, in this case WM load, is low andfewer resources are needed and highest when task difficultyis at that individual's capacity and resource need is maximal.
Fig. 1. Proposed model: (a) Inverted-U shaped curve representing the hypo-thetical signal change in DLPFC as a response to increasing working memoryload inpatientswith schizophrenia and controls (Callicott et al., 2003;Manoach,2003), (b) Between-subjects cross-over model (based on Karlsgodt, 2007),plotting individual differences in overall performance (averaged across theentire task) against individual differences in overall functional activation(averaged across the entire task), (c) Proposedmulti-level model. Each invertedcurve shaped function represents the change in activation of an individualsubject as load changes. The placement of the curves is determined byindividual differences in performance, which influence the range of activationwithin which the subject changes. As a group, controls increase activation asperformance decreases, while patients do the opposite. Independently of this,all subjects show similar functions of activation changes with load.
When task difficulty exceeds capacity, activation may decline(e.g., if effort diminishes, as in the inverted U model) orasymptote (e.g., if effort persists but at no further improve-ment, as in an inverted L).
However, the inverted U models are inherently mostappropriate for describing variation in activation based onchanges in task difficulty within individual subjects. While thisis useful, there are also likely to be individual differencesbetween subjects (e.g. behavioral performance differences) thatalso contribute to theeffectswe see on thegroup level. Althoughprior work has assessed groups of high and low performers, therelationship of these findings to existing models of WM inschizophrenia has not been discussed. For instance, in healthycontrol samples, low performers show increased activationcompared to high performers (Rypma and D'Esposito, 1999;Rypma and D'Esposito, 2000; Tan et al., 2006). However inpatients, decreased performance correlated with decreasedDLPFC activation (Manoach et al., 1999), high performersactivate more than low performers (Tan et al., 2006), andrelative to similarly performing controls low performers arehypoactive and high performers are hyperactive (Callicott et al.,2003). Therefore, while a U may occur within subjects, acrossdifferently performing subjects an inverted-U seems lessplausible. Instead, a linear rather than curvilinear functionseems more likely, and moreover, the pattern may differ inpatients and controls. That is, if the task is more difficult forthem, generally lower performing healthy subjects with lesscognitive capability may need greater neural resources thanhigher performers, a pattern confirmed in a sample of healthysubjects in which BOLD activation increased linearly withdecreasing overall performance on a Sternberg-style WM task(Karlsgodt et al., 2007). However, the opposite pattern wasobserved in chronic schizophrenia patients, who also showed alinear performance-activation relationship, but it was in theopposite direction, such that BOLD activation decreased linearlywith decreasing performance and high performing patientswere hyperfrontal, and low performing patients hypofrontal,relative to similarly performing controls (Karlsgodt et al., 2007)(Fig. 1b). This pattern may suggest that the variance we see inbehavioral performance is not simply noise, but a systematicand explainable feature of the data. Accordingly, variationsalong a gradient of disrupted cellular connectivity may deter-mine both the degree of possible brain activation and ability toperform aWM task. Patients with higherWMperformance andless compromised cellularmicrocircuitrymaybeable to activatethe WM circuitry more than patients with lower performancewho have significantly compromised cellular microcircuitrythus resulting in group-level hyper and hypoactivation.
The above model for explaining the effects of individualvariability in performance does not preclude the existence ofan inverted curve function for activation (either U orasymptote) and load within a given subject. We propose thatthe subject's behavior determines their position on the linearpattern, setting the range within which their activation willvary as task difficulty changes. The range in which higherperforming patients activate will have a higher centercompared with higher performing controls, reflecting a needfor greater activation to produce similar WM output. In con-trast, the range for lower performing patients would have alower center than lower performing controls. This reflectsdecreased ability to activate WM circuitry overall, while still

145K.H. Karlsgodt et al. / Schizophrenia Research 108 (2009) 143–150
showing task related relative changes across load, within theirown lowered range. Combining activation differences bothbased on individual variation and on task related changesresults in a multi-level model (Fig. 1c), in which a series ofwithin-subject inverted curves are placed along the lineargradient of between-subjects changes that are based ondifferences in overall performance.
To test this model we used a parametric Sternberg styleverbal WM task. We first tested whether an inverted curvedescribes the within-subjects change in activation as loadchanges in groups of healthycontrols and recent-onset patients.Second, we examined individual differences between subjects,in particular, the hypothesized relationship between subjects'overall performance and overall activation. Although both areimportant, no prior study has simultaneously addressed pre-dictions about the overall task independent differences basedon individual subject characteristics and the task imposed acti-vation changes seen within subjects. Finally, we tested activa-tion at capacity, which is differently predicted by themultilevelmodel (1c) and thedouble inverted-Umodel (1a). The double-Upredicts equal activationwhendifferent groups aremeasuredatcapacity. The multilevel model predicts differences at capacitybased on the interaction between diagnostic status andperformance. By testing this directly we were able to see ifeither model better predicts group differences. These analysesfocus on theDLPFC because it has the persistent cellular activitypresumed to be the neural basis of WM (Fuster, 1973), showscytoarchitectural changes in schizophrenia (Selemon et al.,2003), and is where the inverted-U pattern has been mostinvestigated (Callicott et al., 1999).
2. Materials and methods
2.1. Participants
Fourteen volunteers with recent-onset schizophrenia and18 healthy control volunteers (Table 1) gave written informedconsent. Participants under 18 years completed writtenassent while a parent or legal guardian provided writtenconsent. Patients with schizophrenia were recruited from theAftercare Research Program and Adolescent Brain-BehaviorResearch Clinic (ABBRC) at UCLA. Inclusion criteria were:onset of psychosis within 2 years, and a DSM-IV diagnosis ofschizophrenia or schizoaffective disorder (depressive sub-type) (First et al., 1997). Research participants are between12–17 (ABBRC) or 18–45 years old (Aftercare): however, onlyparticipants aged 16–25 years were included. Community
Table 1Subject demographics
Patients Controls
Age (years±st. dev) a 20.27±2.53 20.43±2.25Gender (m/f) a 6/8 6/12Years of education a 12.46±2.69 13.41±1.19Estimated I.Q. b 111.87±10.17 111.46±9.29Age of onset 18.46±3.50Antipsychotic medication (typical/atypical) 0/14
a Groups did not significantly differ on age [t(30)=− .688, p= .497], gender[χ2=1.033, p= .310], years of education [t(29)=−1.261, p= .217], or I.Q. [t(24)=− .1075, p= .915].
b I.Q. data was not available for 4 subjects (2 patients and 2 controls).
control subjects age-matched to participants with schizophre-nia and no evidence of any major mental disorder (StructuredClinical Interview for DSM-IV (Spitzer et al., 1979)) wererecruited via advertisement. Both patients and controls wereexcluded for known neurological disorders, diagnosis ofsubstance abuse or dependence in the last 6months, premorbidI.Q. lower than 70, and insufficient English fluency.
2.2. Cognitive paradigm
We used a Sternberg-style item recognition task (Sternberg,1966).A target setof yellowuppercase consonantswasdisplayedfor 2s, followed by a 3s fixation cross. A green lowercase probethen appeared for 2s, followed by 2s of fixation before the nexttrial. Subjects indicatedwhether or not each probematched anyletters from the previous target set by pressing designatedbuttons.WM loadwasmanipulated by increasing set size (3, 5, 7or 9consonants). The task included12 trials per load, for a total of48 trials with 50% match trials. Trials were arranged into blocksof 2 trials from the same load. Six additional 18s fixation blockswere interspersed throughout, providing baseline. Trial rando-mization was optimized using OptimizeDesign10 software(Wager and Nichols, 2003). The experiment was run usingE-Prime Software (Psychology Software Tools); images weredisplayed using goggles (Resonance Technologies, Inc.), andresponses collected via button box.
2.3. Functional imaging parameters
Scans were acquired on a 3 T Siemens Allegra scanner atUCLA. A T2 weighted image with 1.5 mm in-plane resolutionwas taken using a set of high-resolution EPI localizers (TR/TE5000/33 ms, 33 3-mm slices with 1 mm gap, 128×128 matrix,200 mm FOV). To match any B0-related distortions, the high-resolution images had readout bandwidth along the phaseencoding direction identical to that in the functional scans.Functional slices matched the AC-PC aligned slices in the T2image, and utilized an echo planar (EPI) sequence (TR/TE3000/45ms, 90° flip angle, 33 3mm slices). The task consistedof 180 scans, lasting 9 min.
2.4. Image processing
A study-specific group averaged T2-weighted brain wascreated using the Automated Image Registration (AIR)package (Woods et al., 1998). This average brain was used asthe common space to which all subjects were registered andin which group statistics were performed. This minimizesmis-registration of the functional data during spatial normal-ization and avoids causing relatively greater warping in thepatient group than in the control group.
Functional analysis was performed using FSL (FMRIB'sSoftware Library v3.3; Smith et al., 2004). Each BOLD image inthe time series was registered (using a 3D co-registration, 6parameter rigid-body) to themiddle data point. Datawere thenregistered, first the EPI to the subject's individual T2-weightedstructural image, then the T2 to the study specific commonbrain (Jenkinson et al., 2002; Jenkinson and Smith, 2001).Individual subject analyses employed FEAT (FMRI ExpertAnalysis Tool) using a 5 mm (FWHM) Gaussian smoothingkernel and 72 s high-pass filter. Time-series statistical analysis
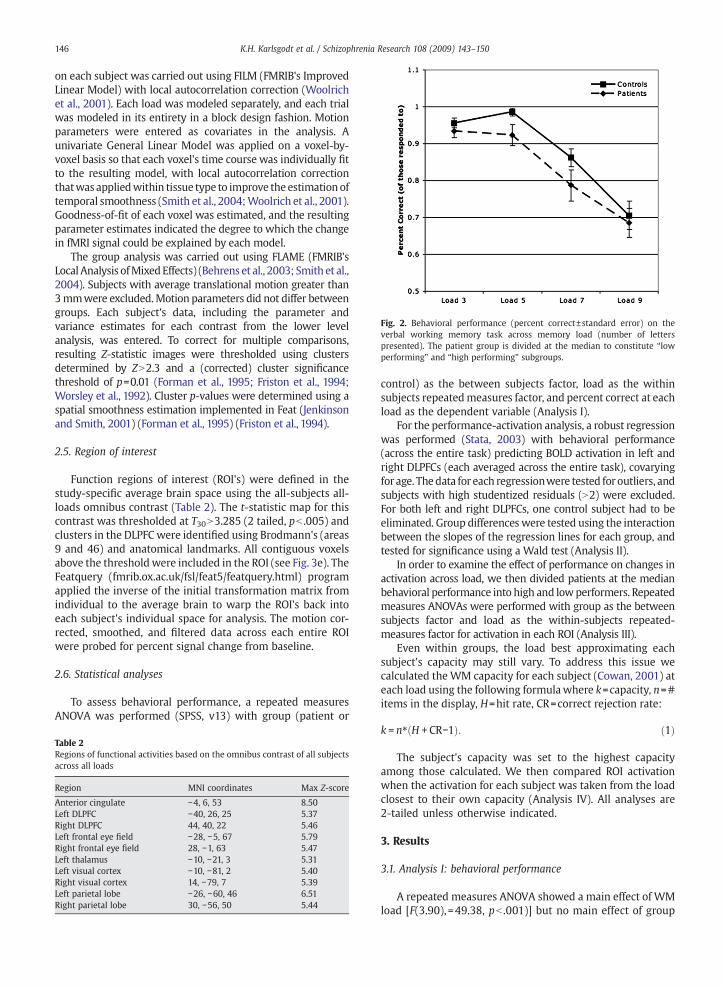
Fig. 2. Behavioral performance (percent correct±standard error) on theverbal working memory task across memory load (number of letterspresented). The patient group is divided at the median to constitute “lowperforming” and “high performing” subgroups.
146 K.H. Karlsgodt et al. / Schizophrenia Research 108 (2009) 143–150
on each subject was carried out using FILM (FMRIB's ImprovedLinear Model) with local autocorrelation correction (Woolrichet al., 2001). Each load was modeled separately, and each trialwas modeled in its entirety in a block design fashion. Motionparameters were entered as covariates in the analysis. Aunivariate General Linear Model was applied on a voxel-by-voxel basis so that each voxel's time course was individually fitto the resulting model, with local autocorrelation correctionthatwas appliedwithin tissue type to improve theestimationoftemporal smoothness (Smith et al., 2004;Woolrich et al., 2001).Goodness-of-fit of each voxel was estimated, and the resultingparameter estimates indicated the degree to which the changein fMRI signal could be explained by each model.
The group analysis was carried out using FLAME (FMRIB'sLocal Analysis ofMixedEffects) (Behrens et al., 2003; Smith et al.,2004). Subjects with average translational motion greater than3mmwere excluded.Motion parameters did not differ betweengroups. Each subject's data, including the parameter andvariance estimates for each contrast from the lower levelanalysis, was entered. To correct for multiple comparisons,resulting Z-statistic images were thresholded using clustersdetermined by ZN2.3 and a (corrected) cluster significancethreshold of p=0.01 (Forman et al., 1995; Friston et al., 1994;Worsley et al., 1992). Cluster p-values were determined using aspatial smoothness estimation implemented in Feat (Jenkinsonand Smith, 2001) (Forman et al., 1995) (Friston et al., 1994).
2.5. Region of interest
Function regions of interest (ROI's) were defined in thestudy-specific average brain space using the all-subjects all-loads omnibus contrast (Table 2). The t-statistic map for thiscontrast was thresholded at T30N3.285 (2 tailed, pb .005) andclusters in the DLPFC were identified using Brodmann's (areas9 and 46) and anatomical landmarks. All contiguous voxelsabove the thresholdwere included in the ROI (see Fig. 3e). TheFeatquery (fmrib.ox.ac.uk/fsl/feat5/featquery.html) programapplied the inverse of the initial transformation matrix fromindividual to the average brain to warp the ROI's back intoeach subject's individual space for analysis. The motion cor-rected, smoothed, and filtered data across each entire ROIwere probed for percent signal change from baseline.
2.6. Statistical analyses
To assess behavioral performance, a repeated measuresANOVA was performed (SPSS, v13) with group (patient or
Table 2Regions of functional activities based on the omnibus contrast of all subjectsacross all loads
Region MNI coordinates Max Z-score
Anterior cingulate −4, 6, 53 8.50Left DLPFC −40, 26, 25 5.37Right DLPFC 44, 40, 22 5.46Left frontal eye field −28, −5, 67 5.79Right frontal eye field 28, −1, 63 5.47Left thalamus −10, −21, 3 5.31Left visual cortex −10, −81, 2 5.40Right visual cortex 14, −79, 7 5.39Left parietal lobe −26, −60, 46 6.51Right parietal lobe 30, −56, 50 5.44
control) as the between subjects factor, load as the withinsubjects repeatedmeasures factor, and percent correct at eachload as the dependent variable (Analysis I).
For the performance-activation analysis, a robust regressionwas performed (Stata, 2003) with behavioral performance(across the entire task) predicting BOLD activation in left andright DLPFCs (each averaged across the entire task), covaryingfor age. Thedata for each regressionwere tested foroutliers, andsubjects with high studentized residuals (N2) were excluded.For both left and right DLPFCs, one control subject had to beeliminated. Group differences were tested using the interactionbetween the slopes of the regression lines for each group, andtested for significance using a Wald test (Analysis II).
In order to examine the effect of performance on changes inactivation across load, we then divided patients at the medianbehavioral performance into high and lowperformers. Repeatedmeasures ANOVAs were performed with group as the betweensubjects factor and load as the within-subjects repeated-measures factor for activation in each ROI (Analysis III).
Even within groups, the load best approximating eachsubject's capacity may still vary. To address this issue wecalculated theWM capacity for each subject (Cowan, 2001) ateach load using the following formulawhere k=capacity, n=#items in the display, H=hit rate, CR=correct rejection rate:
k = n4 H + CR−1ð Þ: ð1Þ
The subject's capacity was set to the highest capacityamong those calculated. We then compared ROI activation
when the activation for each subject was taken from the loadclosest to their own capacity (Analysis IV). All analyses are2-tailed unless otherwise indicated.3. Results
3.1. Analysis I: behavioral performance
A repeated measures ANOVA showed a main effect of WMload [F(3.90), =49.38, pb .001)] but no main effect of group
147K.H. Karlsgodt et al. / Schizophrenia Research 108 (2009) 143–150
[F(1,30)=2.805, p=.104] or load by group interaction [F(3,90)=.660, p=.579] (See Fig. 2).
3.2. Analysis II: overall group comparison
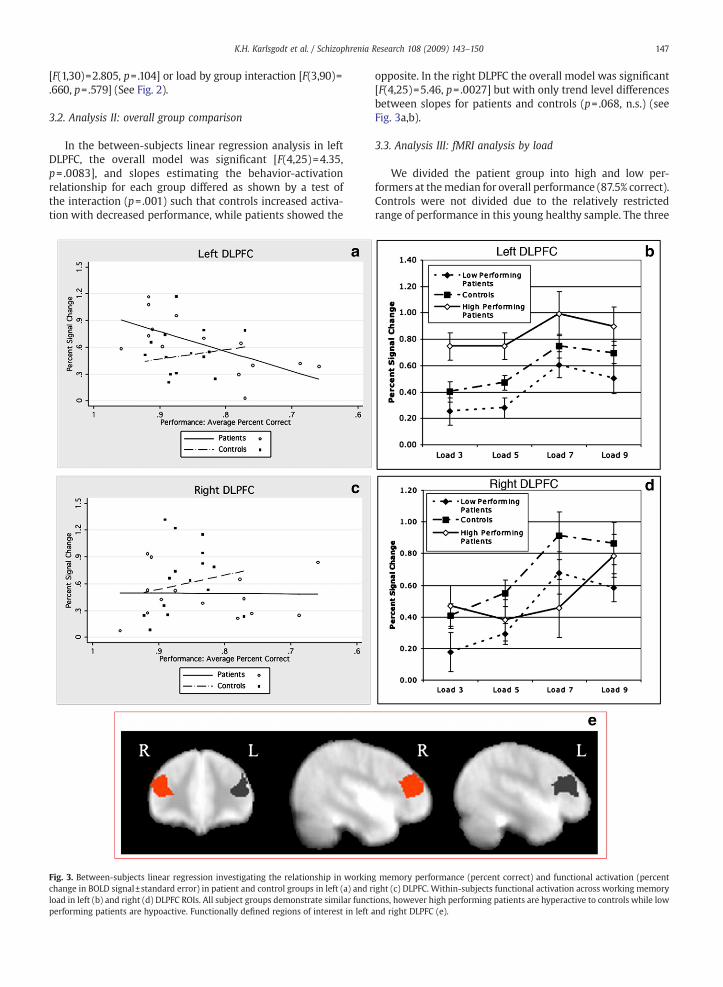
In the between-subjects linear regression analysis in leftDLPFC, the overall model was significant [F(4,25)=4.35,p= .0083], and slopes estimating the behavior-activationrelationship for each group differed as shown by a test ofthe interaction (p=.001) such that controls increased activa-tion with decreased performance, while patients showed the
Fig. 3. Between-subjects linear regression investigating the relationship in workinchange in BOLD signal±standard error) in patient and control groups in left (a) and rload in left (b) and right (d) DLPFC ROIs. All subject groups demonstrate similar functperforming patients are hypoactive. Functionally defined regions of interest in left a
opposite. In the right DLPFC the overall model was significant[F(4,25)=5.46, p=.0027] but with only trend level differencesbetween slopes for patients and controls (p= .068, n.s.) (seeFig. 3a,b).
3.3. Analysis III: fMRI analysis by load
We divided the patient group into high and low per-formers at themedian for overall performance (87.5% correct).Controls were not divided due to the relatively restrictedrange of performance in this young healthy sample. The three
g memory performance (percent correct) and functional activation (percentight (c) DLPFC. Within-subjects functional activation across working memoryions, however high performing patients are hyperactive to controls while lownd right DLPFC (e).

Fig. 4. Analysis of functional activation (percent change in BOLD signal±standard error) in each group, calculated by pooling across the activationobserved at each subjects individually calculated working memory capacity(Eq. (1)).
Fig. 5. DLPFC performance-activation data from the current first episodesample and previously analyzed chronic sample (Karlsgodt, 2007) demon-strating the replicability of the cross-over pattern in these two samples.
148 K.H. Karlsgodt et al. / Schizophrenia Research 108 (2009) 143–150
groups (low performing patients, high performing patients,and controls) showed similar patterns in BOLD signal by load,resembling the leftmost portion of an inverted-U shapedfunction in the left DLPFC. The right DLPFC is similar, althoughthe high performing patients appear to differ, albeit non-significantly. In both hemispheres, the location of the curveon the y axis (BOLD activation) was shifted between groupsindicating that the range of activation for each group differed,despite the similarly shaped curves (Fig. 3b, d). In left DLPFCthere was a significant main effect of load [F(3, 87)=11.637,pb .001] and of group [F(2, 29)=5.64, p= .009] but noload×group interaction [F(6, 87)= .286, p= .954]. In the rightDLPFC there was a main effect of load [F(3, 87)=13.868,pb .001] but not of group [F(2, 29)= .389, p= .681], and therewas no significant load×group interaction [F(6, 87)= .1650,p= .143).
3.4. Analysis IV: fMRI analysis adjusting for capacity
In the capacity analysis (Eq. (1)), an univariate ANOVA ofperformance group and BOLD activation was significant inthe left DLPFC [F(2, 29)=6.432, p= .005), but not right DLPFC[F(2, 29)= .722, p= .494). Post-hoc t-tests in left DLPFCindicated that even when matched on WM capacity, highperforming patients had higher activation than low perfor-mers [t=−3.08, df=12, p=0.009, 2-tailed] and than controls[t=2.980, df=23, p=0.007, 2-tailed], while low performingpatients did not significantly differ from controls [t=− .8,df=23, p=0.432, 2-tailed) (Fig. 4). In addition to the analysis atcapacity, a one-way ANOVA was performed to test whetherthe absolute range of activation (maximum activation out ofthe four loads minus minimum activation) was the same forthe groups. There was no significant difference in eitherDLPFC for the range in which the activation was changing(left: F(2, 29)= .487, p= .619; right: F(2,29)= .141, p= .867).
4. Discussion
These results support our proposed multi-level modelcombining within subjects changes by load with group level
variability in performance, and provide novel informationregarding the relationship between functional activation andbehavioral performance in schizophrenia. Both patient andcontrol groups express similar inverted-curved functions asWM load changes. However, the analysis of the performance-activation relationship across subjects, together with ourprevious findings, supports the linear “cross-over model” inwhich higher overall performance equateswith higher overallDLPFC activity in patients, with the opposite in controls. Herewe show the same between-subjects cross-over pattern in thefirst episode, prior to long term effects of medication ordisease process, as previously demonstrated among unaf-fected genetically high risk individuals (Karlsgodt et al., 2007).Together, these results indicate that this novel finding of analtered performance-activation relationship may be a corefeature of WM function in schizophrenia.
Furthermore, when controlling for individual differences inWM capacity, high performing patients remained hyperactivecompared to controls, while low performing patients were not,indicating that despite showing similar relative functions ofchange with load, the peaks of their inverted-curves differed.This supports the current model more than the previousdouble-inverted-Umodel inwhich the only group difference isa leftward shift in the patients. This activation difference is notsecondary to a difference in the overall height of the peaks ofthe inverted-curves between groups (Johnson et al., 2006), aswe found no difference in the absolute range of activationchanges. Essentially, the patient group showed normal within-subjects curve functions by load (as previously theoreticallysuggested (Callicott et al., 2003)), but with the curve shiftedhigher or lower based on WM performance.
Schizophrenia is a spectrum disorder, with a range ofdeficits and impairments. This is not only evident at the levelof psychiatric symptoms, but also cognitive impairment hasbeen correlated with neurophysiological measures such as D1binding potential and fMRI activation (Abi-Dargham et al.,2002) (Karlsgodt et al., 2007; Manoach et al., 2000). Thedegree of impairment may thus relate to the degree ofunderlying neural change (e.g. decreased dendritic arboriza-tion or dysfunctional cellular microcircuitry). Low performingpatients may have more severe changes, while the high
149K.H. Karlsgodt et al. / Schizophrenia Research 108 (2009) 143–150
performing patients are intermediate, such that the highperformers have sufficient remaining circuitry to enablecompensation, which is precluded in low performers. Thus,the degree of hyperfrontality as measured by fMRI may reflectthe degree of ability to compensate and index underlyingchanges. Studies assessing structural, pathological, or neuralsignaling changes as related to cognitive performance differ-ences would further inform this issue.
This study was limited by the sample size, although powerwas adequate to detect significant, hypothesized effects.Secondly, although the limited range of performance incontrols precluded dividing them by performance, the dis-tributionwas continuous and the linear regression interactionanalysis statistically supports the cross-over model, as doespreviously reported data (Karlsgodt et al., 2007; Fig. 5) thatincludes a full range of control performance. Nevertheless,future studies with both low and high performing controlsand first-episode patients would be informative. Further,although treatment duration was relatively brief and patientswere relatively uniformly treated with atypical antipsycho-tics, studies of medication-naïve patients would confirm theindependence of the observed differences from medicationeffects.
In conclusion, this work demonstrates that there is afundamental difference in neural functioning during WMperformance in schizophrenic patients with greater cognitiveimpairment. This pattern may have important clinical impli-cations, as it may indicate that these groups require differentapproaches for both treatment and cognitive remediation.
Role of funding sourceThis research was supported by NIH Grants MH65079, MH066286,
GM072978 and RR021992 to T.D.C, F31-MH068111-02 to K.H.K., NIMH P50MH066286 to K.H.N., and a gift to the UCLA Foundation by Garen and ShariStaglin. The NIH, NIMH, and Staglin family had no further role in the studydesign; in the collection, analysis, and interpretation of data; in thewriting ofthe report; and in the decision to submit the paper for publication.
ContributorsKatherine Karlsgodt conceptualized, planned, and executed the analyses,
interpreted the data, and wrote the first draft of the manuscript. JacquelineSanz aided in the data analysis and interpretation. Theo van Erp supporteddata collection and analysis, and writing of the manuscript. Carrie Beardencontributed to interpretation of the data and generation of the manuscript.Keith Nuechterlein supervises the clinic from which subjects are recruitedand had a role in study design and interpretation. Tyrone Cannon providedthe environment in which the entire project was carried out, designed andsupervised the project that this study was a part of, and had roles in datainterpretation and writing the manuscript. All authors contributed to andgave approval to the manuscript.
Conflict of interestAll authors declare that they have no conflicts of interest.
AcknowledgementsWe would like to acknowledge the input of Drs Russell Poldrack, Robert
Bilder, and Joaquin Fuster. We would also like to acknowledge the technicaland administrative support of Molly Hardt, Lara Zimmerman, Liset Cristiano,Sabrina Lux, and Malin McKinley as well as the participants.
References
Abi-Dargham, A., Mawlawi, O., Lombardo, I., Gil, R., Martinez, D., Huang, Y.,Hwang, D.R., Keilp, J., Kochan, L., Van Heertum, R., Gorman, J.M., Laruelle,M., 2002. Prefrontal dopamine D1 receptors and working memory inschizophrenia. J. Neurosci. 22 (9), 3708–3719.
Barch, D.M., Sheline, Y.I., Csernansky, J.G., Snyder, A.Z., 2003. Workingmemory and prefrontal cortex dysfunction: specificity to schizophreniacompared with major depression. Biol. Psychiatry 53 (5), 376–384.
Behrens, T.E., Johansen-Berg, H., Woolrich, M.W., Smith, S.M., Wheeler-Kingshott, C.A., Boulby, P.A., Barker, G.J., Sillery, E.L., Sheehan, K.,Ciccarelli, O., Thompson, A.J., Brady, J.M., Matthews, P.M., 2003. Non-invasive mapping of connections between human thalamus and cortexusing diffusion imaging. Nat. Neurosci. 6 (7), 750–757.
Callicott, J.H., Mattay, V.S., Bertolino, A., Finn, K., Coppola, R., Frank, J.A.,Goldberg, T.E., Weinberger, D.R., 1999. Physiological characteristics ofcapacity constraints in working memory as revealed by functional MRI.Cereb. Cortex 9 (1), 20–26.
Callicott, J.H., Bertolino, A., Mattay, V.S., Langheim, F.J., Duyn, J., Coppola, R.,Goldberg, T.E., Weinberger, D.R., 2000. Physiological dysfunction of thedorsolateral prefrontal cortex in schizophrenia revisited. Cereb. Cortex10 (11),1078–1092.
Callicott, J.H., Mattay, V.S., Verchinski, B.A., Marenco, S., Egan, M.F., Weinberger,D.R., 2003. Complexity of prefrontal cortical dysfunction in schizophrenia:more than up or down. Am. J. Psychiatry 160 (12), 2209–2215.
Cannon, T.D.,Glahn,D., Kim, J., van Erp, T., Karlsgodt, K., Cohen, J.D., Nuechterlein,K.H., Bava, S., Shirinyan, D., 2005. Dorsolateral prefrontal cortex activityduring maintenance and manipulation of information inworking memoryin patients with schizophrenia. Arch. Gen. Psychiatry 62, 1071–1080.
Cowan, N., 2001. The magical number 4 in short-term memory: a reconsidera-tion of mental storage capacity. Behav. Brain Sci. 24 (1), 87–114 discussion114–185.
Driesen, N.R., Leung, H.C., Calhoun, V.D., Constable, R.T., Gueorguieva, R.,Hoffman, R., Skudlarski, P., Goldman-Rakic, P.S., Krystal, J.H., 2008.Impairment of working memory maintenance and response in schizo-phrenia: functional magnetic resonance imaging evidence. Biol. Psy-chiatry 64 (12), 1026–1034.
First, M.B., Spitzer, R., Gibbon, M., Williams, J., 1997. Structured ClinicalInterview for DSM-IV Axis I Disorders. Biometrics Research Department,New York State Psychiatric Institute, New York.
Forman, S.D., Cohen, J.D., Fitzgerald,M., Eddy,W.F.,Mintun,M.A., Noll, D.C.,1995.Improved assessment of significant activation in functional magneticresonance imaging (fMRI): use of a cluster-size threshold. Magn. Reson.Med. 33 (5), 636–647.
Friston, K.J., Worsley, K., Frackowiak, R., Mazziotta, J.C., Evans, A.C., 1994.Assessing the significance of focal activations using their spatial extent.Hum. Brain Mapp. 1, 214–220.
Fuster, J.M., 1973. Unit activity in prefrontal cortex during delayed-responseperformance: neuronal correlates of transient memory. J. Neurophysiol.36 (1), 61–78.
Jenkinson, M., Smith, S., 2001. A global optimisation method for robust affineregistration of brain images. Med. Image Anal. 5 (2), 143–156.
Jenkinson, M., Bannister, P., Brady, M., Smith, S., 2002. Improved optimizationfor the robust and accurate linear registration and motion correction ofbrain images. Neuroimage 17 (2), 825–841.
Johnson,M.R., Morris, N.A., Astur, R.S., Calhoun, V.D., Mathalon, D.H., Kiehl, K.A.,Pearlson, G.D., 2006. A functional magnetic resonance imaging study ofworking memory abnormalities in schizophrenia. Biol. Psychiatry 60 (1),11–21.
Karlsgodt, K.H., Glahn, D.C., van Erp, T.G., Therman, S., Huttunen, M.,Manninen, M., Kaprio, J., Cohen, M.S., Lonnqvist, J., Cannon, T.D., 2007.The relationship between performance and fMRI signal during workingmemory in patients with schizophrenia, unaffected co-twins, and controlsubjects. Schizophr. Res. 89 (1–3), 191–197.
Manoach, D.S., 2003. Prefrontal cortex dysfunction during working memoryperformance in schizophrenia: reconciling discrepant findings. Schi-zophr. Res. 60 (2–3), 285–298.
Manoach, D.S., Press, D.Z., Thangaraj, V., Searl, M.M., Goff, D.C., Halpern, E.,Saper, C.B., Warach, S., 1999. Schizophrenic subjects activate dorsolateralprefrontal cortex during a working memory task, as measured by fMRI.Biol. Psychiatry 45 (9), 1128–1137.
Manoach, D.S., Gollub, R.L., Benson, E.S., Searl, M.M., Goff, D.C., Halpern, E.,Saper, C.B., Rauch, S.L., 2000. Schizophrenic subjects show aberrant fMRIactivation of dorsolateral prefrontal cortex and basal ganglia duringworking memory performance. Biol. Psychiatry 48 (2), 99–109.
Ragland, J.D., Gur, R.C., Glahn, D.C., Censits, D.M., Smith, R.J., Lazarev, M.G.,Alavi, A., Gur, R.E., 1998. Frontotemporal cerebral blood flow changeduring executive and declarative memory tasks in schizophrenia: apositron emission tomography study. Neuropsychology 12 (3), 399–413.
Rypma, B., D'Esposito, M., 1999. The roles of prefrontal brain regions incomponents of working memory: effects of memory load and individualdifferences. Proc. Natl. Acad. Sci. U. S. A. 96 (11), 6558–6563.
Rypma, B., D'Esposito,M., 2000. Isolating the neural mechanisms of age-relatedchanges in humanworking memory. Nat. Neurosci. 3 (5), 509–515.
Selemon, L.D., Mrzljak, J., Kleinman, J.E., Herman, M.M., Goldman-Rakic, P.S.,2003. Regional specificity in the neuropathologic substrates of

150 K.H. Karlsgodt et al. / Schizophrenia Research 108 (2009) 143–150
schizophrenia: a morphometric analysis of Broca's area 44 and area 9.Arch. Gen. Psychiatry 60 (1), 69–77.
Smith, S.M., Jenkinson, M., Woolrich, M.W., Beckmann, C.F., Behrens, T.E.,Johansen-Berg, H., Bannister, P.R., De Luca, M., Drobnjak, I., Flitney, D.E.,Niazy, R.K., Saunders, J., Vickers, J., Zhang, Y., De Stefano, N., Brady, J.M.,Matthews, P.M., 2004. Advances in functional and structural MR imageanalysis and implementation as FSL. Neuroimage 23 Suppl 1, S208–219.
Spitzer, R., Endicott, J., Williams, J., 1979. Research diagnostic criteria. Arch.Gen. Psychiatry 36, 29–50.
Stata, 2003. Intercooled Stata 8.1 for Macintosh. Stata Corporation, CollegeStation, TX.
Sternberg, S., 1966. High-speed scanning in human memory. Science 153(736), 652–654.
Stevens, A.A., Goldman-Rakic, P.S., Gore, J.C., Fullbright, R.K., Wexler, B., 1998.Cortical dysfunction in schizophrenia during auditory word and toneworking memory demonstrated by functional magnetic resonanceimaging. Arch. Gen. Psychiatry 55, 1097–1103.
Tan, H.Y., Sust, S., Buckholtz, J.W., Mattay, V.S., Meyer-Lindenberg, A., Egan, M.F.,Weinberger, D.R., Callicott, J.H., 2006. Dysfunctional prefrontal regional spe-cialization and compensation in schizophrenia. Am. J. Psychiatry 163 (11),1969–1977.
Wager, T.D., Nichols, T.E., 2003. Optimization of experimental design in fMRI: ageneral framework using a genetic algorithm. Neuroimage 18 (2), 293–309.
Woods, R.P., Grafton, S.T., Holmes, C.J., Cherry, S.R., Mazziotta, J.R., 1998.Automated image registration: I. General methods and intrasubjectintramodality validation. J. Comput. Assist. Tomogr. 22 (1), 139–152.
Woolrich, M.W., Ripley, B.D., Brady, M., Smith, S.M., 2001. Temporalautocorrelation in univariate linear modeling of FMRI data. Neuroimage14 (6), 1370–1386.
Worsley, K.J., Evans, A.C., Marrett, S., Neelin, P., 1992. A three-dimensionalstatistical analysis for CBF activation studies in human brain. J. Cereb.Blood Flow Metab. 12 (6), 900–918.
Yerkes, R.M., Dodson, J.D., 1908. The relation of strength of stimulus torapidity of habit-formation. J. Comp. Neurol. Psychol. 18, 459–482.