raymond james 37th annual institutional conference
TRANSCRIPT

Raymond James 37th Annual Institutional Investors Conference
March 8, 2016

Safe Harbor Statement
2
All information set forth in this presentation, except historical and factual information, represents forward-looking statements. This includes all statements about the company’s plans, beliefs, estimates, and expectations. These statements are based on current estimates, projections, and assumptions, which involve certain risks and uncertainties that could cause actual results to differ materially from those in the forward-looking statements. Important factors that may affect these forward-looking statements include, but are not limited to: intense competition; the ability to execute TDS’ business strategy; uncertainties in TDS’ future cash flows and liquidity and access to the capital markets; the ability to make payments on TDS and U.S. Cellular indebtedness or comply with the terms of debt covenants; impacts of any pending acquisitions/divestures/exchanges of properties and/or licenses, including, but not limited to, the ability to obtain regulatory approvals, successfully complete the transactions and the financial impacts of such transactions; the ability of the company to successfully manage and grow its markets; the overall economy; the access to and pricing of unbundled network elements; the ability to obtain or maintain roaming arrangements with other carriers on acceptable terms; the state and federal telecommunications regulatory environment; the value of assets and investments; adverse changes in the ratings afforded TDS and U.S. Cellular debt securities by accredited ratings organizations; industry consolidation; advances in telecommunications technology; pending and future litigation; changes in income tax rates, laws, regulations or rulings; changes in customer growth rates, average monthly revenue per user, churn rates, roaming revenue and terms, the availability of wireless devices, or the mix of products and services offered by U.S. Cellular and TDS Telecom. Investors are encouraged to consider these and other risks and uncertainties that are discussed in documents furnished to the Securities and Exchange Commission (“SEC”).

Diversified Communications Company
• TDS (NYSE:TDS) provides communications products and services primarily in rural and suburban markets, through its two principal business units:
TDS Telecom U.S. Cellular (NYSE:USM)
(wholly-owned) (84% owned)
• 6 million customers nationwide
• Controlled company with focus on long-term value creation
• Conservative financing strategy
3

4
Annual Dividends
Per TDS Share
Shares Repurchased
* Retroactively adjusted for the effect of 2005 stock dividend. Repurchased $990 M
In m
illio
ns
42 years of consecutive dividend increases
Delivering Value to Shareholders
0
1
2
3
4
5
6
7
8
2007 2008 2009 2010 2011 2012 2013 2014 2015
TDS USM

5
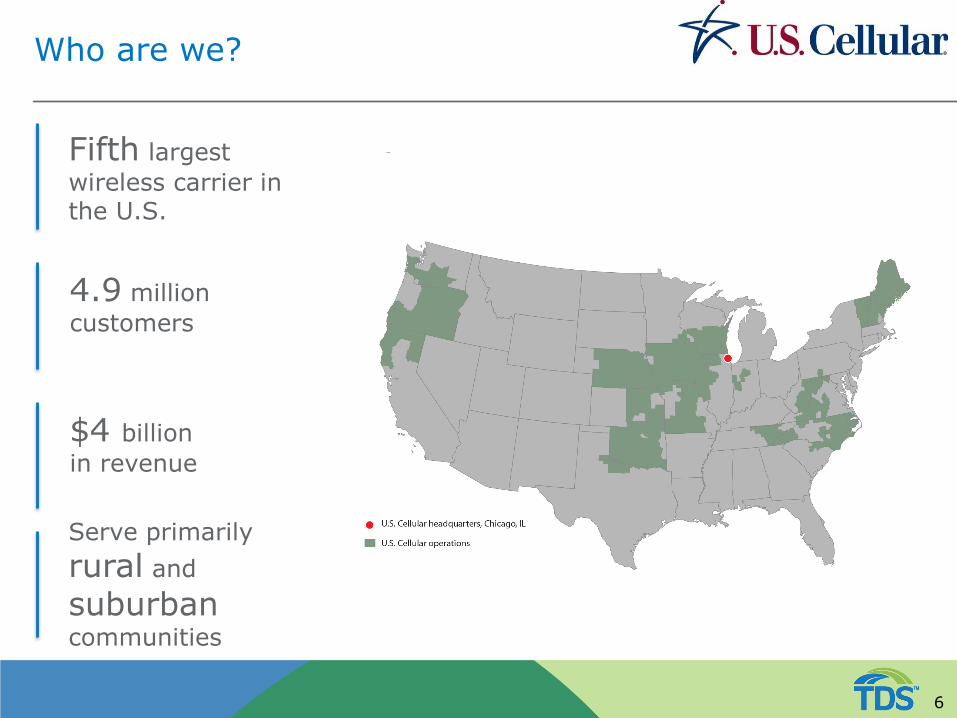
Who are we?
6
Fifth largest
wireless carrier in the U.S.
4.9 million
customers
$4 billion
in revenue
Serve primarily
rural and
suburban communities
Differentiate through Our Value Proposition
7
Provide outstanding customer service through our:
• High-quality network
• 4G/LTE
• ‘In the Middle of Anywhere’
• Competitive devices, plans and pricing
• Best Value in wireless
• Equipment installment plans and shared data
• Local focus
• Treat customers like neighbors not numbers
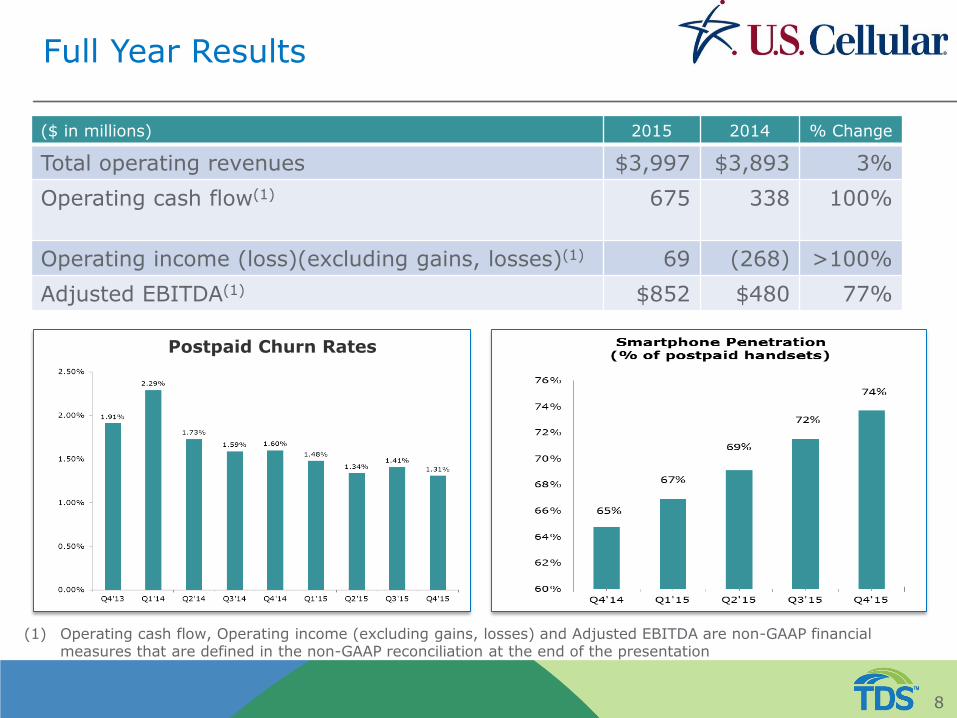
Full Year Results
8
($ in millions) 2015 2014 % Change
Total operating revenues $3,997 $3,893 3%
Operating cash flow(1) 675 338 100%
Operating income (loss)(excluding gains, losses)(1) 69 (268) >100%
Adjusted EBITDA(1) $852 $480 77%
(1) Operating cash flow, Operating income (excluding gains, losses) and Adjusted EBITDA are non-GAAP financial measures that are defined in the non-GAAP reconciliation at the end of the presentation
Postpaid Churn Rates

2016 Strategic Priorities
9
Revenue Growth
Customer growth is #1
Smartphone penetration and data
monetization
Reduce Unit Costs
Manage Investments
Increase Margins
Balancing Growth and Profitability
10
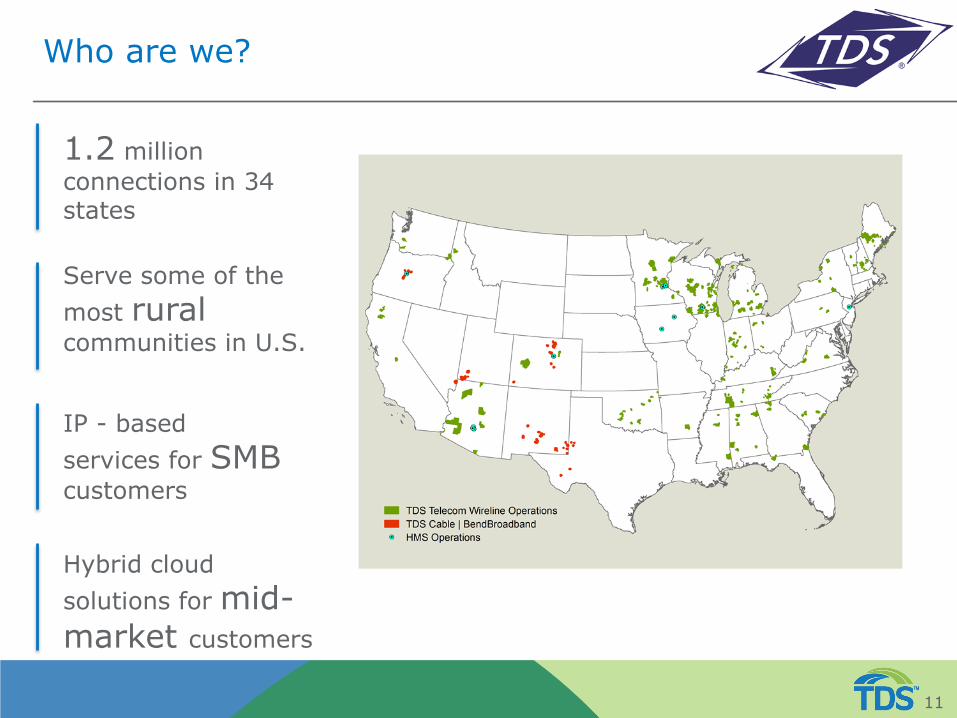
Who are we?
11
1.2 million
connections in 34 states
Serve some of the
most ruralcommunities in U.S.
IP - based
services for SMBcustomers
Hybrid cloud
solutions for mid-market customers
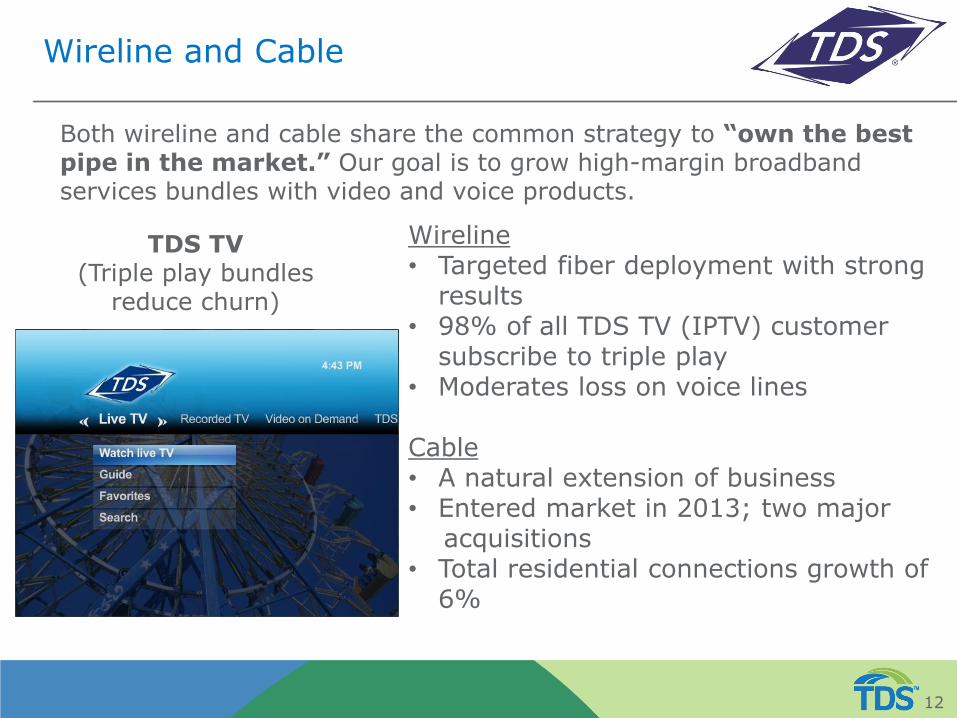
Wireline and Cable
12
Wireline• Targeted fiber deployment with strong
results • 98% of all TDS TV (IPTV) customer
subscribe to triple play • Moderates loss on voice lines
Cable• A natural extension of business • Entered market in 2013; two major
acquisitions• Total residential connections growth of
6%
Both wireline and cable share the common strategy to “own the best pipe in the market.” Our goal is to grow high-margin broadband services bundles with video and voice products.
TDS TV (Triple play bundles
reduce churn)

Hosted and Managed Services
13
• OneNeck IT Solutions offers comprehensive range of hosted and managed services to mid-market companies looking to outsource their IT needs
• Increasing equipment sales
• Focus on increasing recurring sales revenues
• Recent Data Center completions in Denver, Colorado and expansion in Madison, Wisconsin
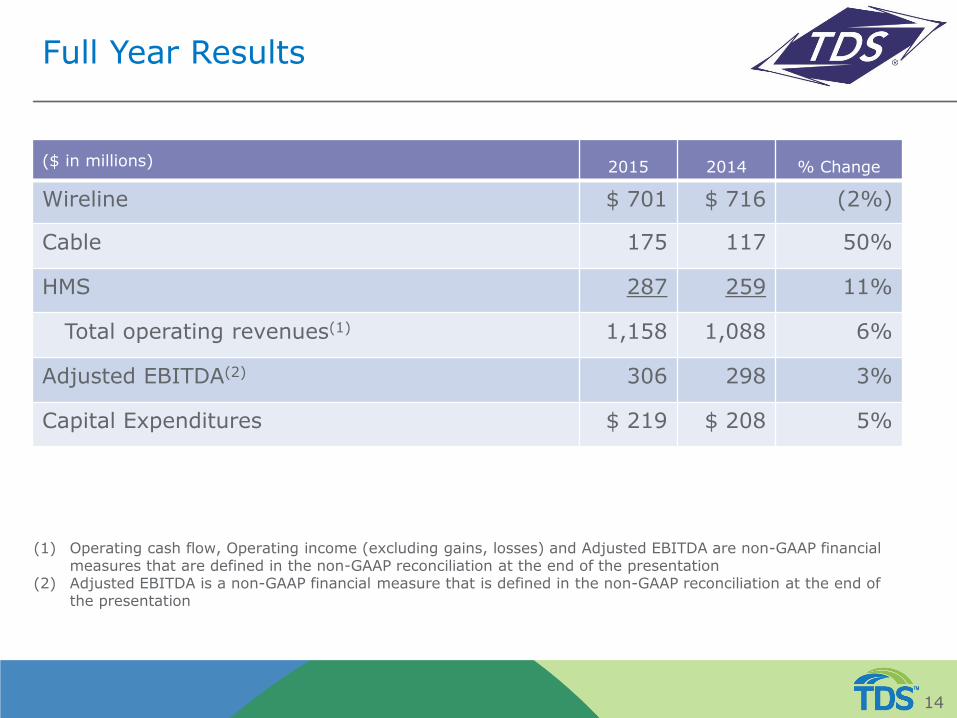
Full Year Results
14
($ in millions) 2015 2014 % Change
Wireline $ 701 $ 716 (2%)
Cable 175 117 50%
HMS 287 259 11%
Total operating revenues(1) 1,158 1,088 6%
Adjusted EBITDA(2) 306 298 3%
Capital Expenditures $ 219 $ 208 5%
(1) Operating cash flow, Operating income (excluding gains, losses) and Adjusted EBITDA are non-GAAP financial measures that are defined in the non-GAAP reconciliation at the end of the presentation
(2) Adjusted EBITDA is a non-GAAP financial measure that is defined in the non-GAAP reconciliation at the end of the presentation

2016 strategic priorities
•Complete planned targeted fiber deployment; increase broadband and IPTV penetration in existing markets
•Capital intensity declines driving higher free cash flow Wireline
•Increase residential and commercial broadband customer connections
•Continue to evaluate potential acquisitionsCable
•Focus on growth of recurring service revenues
•Sell across entire portfolio
•Utilize new data center capacity
Hosted and Managed Services
16

Appendix
17
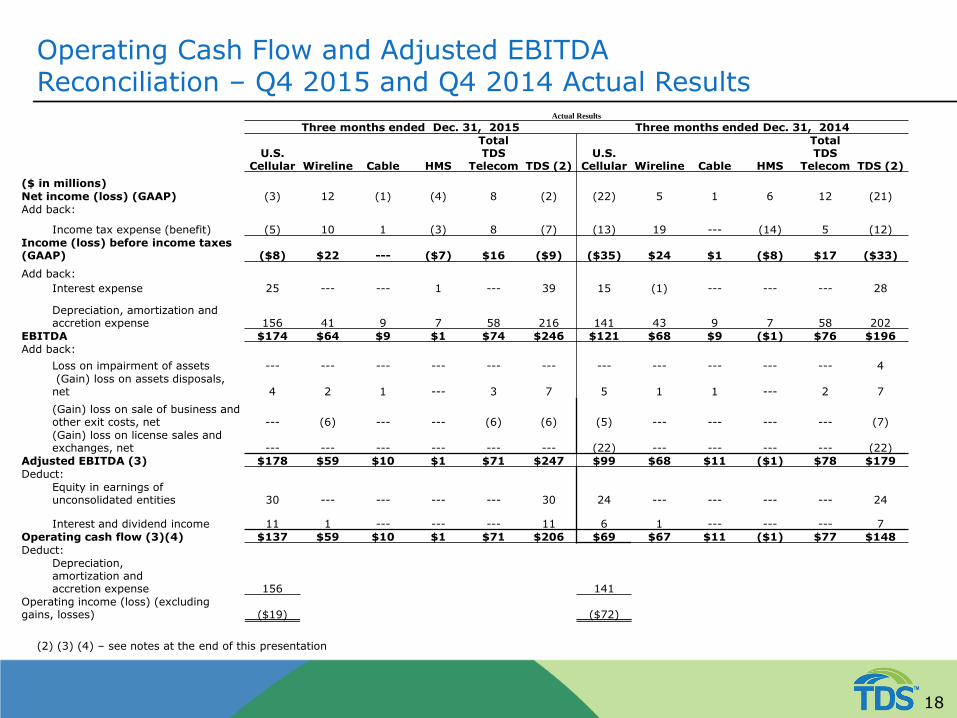
Operating Cash Flow and Adjusted EBITDA Reconciliation – Q4 2015 and Q4 2014 Actual Results
Actual Results
Three months ended Dec. 31, 2015 Three months ended Dec. 31, 2014
U.S. Cellular Wireline Cable HMS
Total TDS
Telecom TDS (2)U.S.
Cellular Wireline Cable HMS
Total TDS
Telecom TDS (2)
($ in millions)
Net income (loss) (GAAP) (3) 12 (1) (4) 8 (2) (22) 5 1 6 12 (21)
Add back:
Income tax expense (benefit) (5) 10 1 (3) 8 (7) (13) 19 --- (14) 5 (12)
Income (loss) before income taxes (GAAP) ($8) $22 --- ($7) $16 ($9) ($35) $24 $1 ($8) $17 ($33)
Add back:
Interest expense 25 --- --- 1 --- 39 15 (1) --- --- --- 28
Depreciation, amortization and accretion expense 156 41 9 7 58 216 141 43 9 7 58 202
EBITDA $174 $64 $9 $1 $74 $246 $121 $68 $9 ($1) $76 $196
Add back:
Loss on impairment of assets --- --- --- --- --- --- --- --- --- --- --- 4
(Gain) loss on assets disposals, net 4 2 1 --- 3 7 5 1 1 --- 2 7
(Gain) loss on sale of business and other exit costs, net --- (6) --- --- (6) (6) (5) --- --- --- --- (7)
(Gain) loss on license sales and exchanges, net --- --- --- --- --- --- (22) --- --- --- --- (22)
Adjusted EBITDA (3) $178 $59 $10 $1 $71 $247 $99 $68 $11 ($1) $78 $179
Deduct:
Equity in earnings of unconsolidated entities 30 --- --- --- --- 30 24 --- --- --- --- 24
Interest and dividend income 11 1 --- --- --- 11 6 1 --- --- --- 7
Operating cash flow (3)(4) $137 $59 $10 $1 $71 $206 $69 $67 $11 ($1) $77 $148
Deduct:
Depreciation, amortization and accretion expense 156 141
Operating income (loss) (excluding gains, losses) ($19) ($72)
(2) (3) (4) – see notes at the end of this presentation
18

Operating Cash Flow and Adjusted EBITDA Reconciliation –2016 Estimated, 2015 and 2014 Full Year Actual Results
($ in millions)
(1) (2) (3) (4) (5) – see notes at the end of this presentation
2016
Estimate (1)
2015
Estimate (1)
2015
Actual
2014
Actual
2016
Estimate (1)
2015
Estimate (1)
2015
Actual 2014 Actual
Net Income (loss) (GAAP) N/A N/A 247 (47) N/A N/A 46 (24)
Add back:
Income tax expense (benefi t) N/A N/A 156 (12) N/A N/A 35 18
Income (loss) before income taxes (loss) (GAAP) $0 - $125 $275-$355 $404 ($59) $40- $80 $45-$75 $81 ($7)
Add back:
Interest expense 105 80 86 57 -- -- 1 (1)
Depreciation, amortization and accretion 600 600 606 606 230 235 228 220
EBITDA $705-$830 $955-$1,035 $1,096 $605 $270 - $310 $280-$310 $310 $212
Add back:
Loss on impairment of assets --- --- --- --- -- --- --- 84
(Gain) loss on sa le of bus iness and other exi t costs , net --- (115) (114) (33) -- (5) (10) (2)
(Gain) loss on l icense sa les and exchanges (5) --- (145) (147) (113) -- --- --- ---
(Gain) loss on asset disposals , net 20 15 16 21 -- 5 6 5
Adjusted EBITDA (2) $725-$850 $710-$790 $852 $480 $270 -$310 $280-$310 $306 $298
Deduct:
Equity in earnings of unconsol idated enti ties (140) (135) (140) (130) -- -- --- ---
Interest and dividend income (60) (35) (37) (12) -- -- (2) (2)
Operating cash flow (2) (3) (4) $525-$650 $540--$620 $675 $338 $270 - $310 $280-$310 $304 $296
Deduct:
Total Depreciation, Amortization and Accretion (606) (606)
Operating Income (loss ) (excluding ga ins , losses) $69 ($268)
U.S. Cellular TDS Telecom
19
(1) In providing 2016 and 2015 Estimated Results, TDS has not completed the above reconciliation to net income because it does not provide guidance for income taxes. TDS believes that the impact of income taxes cannot be reasonably predicted; therefore, the company is unable to provide such guidance.
(2) The TDS column includes U.S. Cellular, TDS Telecom and also the impacts of consolidating eliminations, corporate operations and non-reportable segments, all of which are not presented above.
(3) Operating cash flow is defined as net income, adjusted for the items set forth in the reconciliation above. Adjusted EBITDA (earnings before interest, taxes, depreciation, amortization and accretion), is defined as net income, adjusted for the items set forth in the reconciliation above. Operating income (loss) (excluding gains and losses), is defined as net income, adjusted for the items set forth in the reconciliation above. Operating cash flow, Adjusted EBITDA and Operating income (loss) (excluding gains and losses) exclude these items in order to show operating results on a more comparable basis from period to period. From time to time, TDS may exclude other items from Operating cash flow and/or Adjusted EBITDA and/or Operating income (loss) (excluding gains and losses) if such items help reflect operating results on a more comparable basis. TDS does not intend to imply that any such items that are excluded are non-recurring, infrequent or unusual; such items may occur in the future. Operating cash flow, Adjusted EBITDA and Operating income (loss) (excluding gains and losses) are not measures of financial performance under Generally Accepted Accounting Principles in the United States (“GAAP”) and should not be considered as alternatives to net income as indicators of the company’s operating performance or as alternatives to cash flows from operating activities, determined in accordance with GAAP, as indicators of cash flows or as measures of liquidity. TDS believes Operating cash flow, Adjusted EBITDA and Operating income (loss) (excluding gains and losses) are useful measures of TDS’ operating results before significant recurring non-cash charges, gains and losses, and other items as indicated above.
(4) A reconciliation of Operating cash flow (Non-GAAP) and Operating income (excluding gains and losses) (Non-GAAP) to operating income (GAAP) for Dec. 31, 2015 actual results can be found on the company's website at investors.tdsinc.com.
(5) In February 2016, U.S. Cellular entered into multiple agreements to exchange licenses. Agreements are subject to regulatory approval and other customary closing conditions, and are expected to close in 2016. Upon closing of the transactions, U.S. Cellular expects to record a gain. A reasonable estimate of the gains is unavailable at the time of this filing.
20