raymond james 39th annual institutional … · agnico eagle | raymond james 39th annual...
TRANSCRIPT
RAYMOND JAMES 39TH ANNUAL INSTITUTIONAL INVESTORS
CONFERENCE
AGNICO EAGLE | RAYMOND JAMES 39TH ANNUAL INSTITUTIONAL INVESTORS CONFERENCE | 2
Forward Looking StatementsThe information in this presentation has been prepared as at February 28, 2018. Certain statements contained in this presentation constitute “forward-lookingstatements” within the meaning of the United States Private Securities Litigation Reform Act of 1995 and “forward-looking information” under the provisions of Canadianprovincial securities laws and are referred to herein as “forward-looking statements”. When used in this presentation, the words “anticipate”, “could”, “estimate”, “expect”,“forecast”, “future”, “plan”, “potential”, “will” and similar expressions are intended to identify forward-looking statements. Such statements include, without limitation: theCompany's forward-looking production guidance, including estimated ore grades, project timelines, drilling results, metal production, life of mine estimates, total cashcosts per ounce, all-in sustaining costs per ounce, minesite costs per tonne, other expenses and cash flows; the estimated timing and conclusions of technical reportsand other studies; the methods by which ore will be extracted or processed; statements concerning the Company’s plans to build operations at Meliadine, Amaruq,LaRonde Zone 5 and the Company’s expansion plans at Kittila, including the timing and funding thereof and production therefrom; statements concerning otherexpansion projects, recovery rates, mill throughput, optimization and projected exploration expenditures, including costs and other estimates upon which such projectionsare based; statements regarding timing and amounts of capital expenditures and other assumptions; estimates of future mineral reserves, mineral resources, mineralproduction, optimization efforts and sales; estimates of mine life; estimates of future capital expenditures and other cash needs, and expectations as to the fundingthereof; statements as to the projected development of certain ore deposits, including estimates of exploration, development and production and other capital costs andestimates of the timing of such exploration, development and production or decisions with respect to such exploration, development and production; estimates of mineralreserves and mineral resources; statements regarding the Company’s ability to obtain the necessary permits and authorizations in connection with its exploration,development and mining operations and the anticipated timing thereof; statements regarding anticipated future exploration; and the anticipated timing of events withrespect to the Company’s mine sites and statements regarding the sufficiency of the Company’s cash resources and other statements regarding anticipated trends withrespect to the Company's operations, exploration and the funding thereof. Such statements reflect the Company’s views as at the date of this presentation and aresubject to certain risks, uncertainties and assumptions, and undue reliance should not be placed on such statements. Forward-looking statements are necessarily basedupon a number of factors and assumptions that, while considered reasonable by Agnico Eagle as of the date of such statements, are inherently subject to significantbusiness, economic and competitive uncertainties and contingencies. The material factors and assumptions used in the preparation of the forward looking statementscontained herein, which may prove to be incorrect, include, but are not limited to, the assumptions set forth herein and in management's discussion and analysis(“MD&A”) and the Company's Annual Information Form (“AIF”) for the year ended December 31, 2016 filed with Canadian securities regulators and that are included inits Annual Report on Form 40-F for the year ended December 31, 2016 (“Form 40-F”) filed with the U.S. Securities and Exchange Commission (the "SEC") as well as:that there are no significant disruptions affecting operations; that production, permitting, development and expansion at each of Agnico Eagle's properties proceeds on abasis consistent with current expectations and plans; that the relevant metal prices, foreign exchange rates and prices for key mining and construction supplies will beconsistent with Agnico Eagle's expectations; that Agnico Eagle's current estimates of mineral reserves, mineral resources, mineral grades and metal recovery areaccurate; that there are no material delays in the timing for completion of ongoing growth projects; that the Company's current plans to optimize production aresuccessful; and that there are no material variations in the current tax and regulatory environment. Many factors, known and unknown, could cause the actual results tobe materially different from those expressed or implied by such forward looking statements. Such risks include, but are not limited to: the volatility of prices of gold andother metals; uncertainty of mineral reserves, mineral resources, mineral grades and mineral recovery estimates; uncertainty of future production, project development,capital expenditures and other costs; foreign exchange rate fluctuations; financing of additional capital requirements; cost of exploration and development programs;mining risks; community protests, including by First Nations groups; risks associated with foreign operations; the unfavorable outcome of litigation involving the CanadianMalartic General Partnership (the "Partnership"); governmental and environmental regulation; the volatility of the Company’s stock price; and risks associated with theCompany’s currency, fuel and by-product metal derivative strategies. For a more detailed discussion of such risks and other factors that may affect the Company’s abilityto achieve the expectations set forth in the forward-looking statements contained in this presentation, see the AIF and MD&A filed on SEDAR at www.sedar.com andincluded in the Form 40-F filed on EDGAR at www.sec.gov, as well as the Company’s other filings with the Canadian securities regulators and the SEC. Other than asrequired by law, the Company does not intend, and does not assume any obligation, to update these forward-looking statements.
Currency
All amounts in this presentation are expressed in U.S. dollars except as otherwise noted.
Further Information
For further details on Agnico Eagle’s fourth quarter and full year 2017 results, please see the Company’s news release dated February 14, 2018.
AGNICO EAGLE | RAYMOND JAMES 39TH ANNUAL INSTITUTIONAL INVESTORS CONFERENCE | 3
Notes to InvestorsNote Regarding the Use of Non-GAAP Financial Measures
This presentation discloses certain measures, including “total cash costs per ounce”, “all-in sustaining costs per ounce”, “minesite costs per tonne” and “Cash from Operations” thatare not standardized measures under IFRS. These data may not be comparable to data reported by other issuers. For a reconciliation of these measures to the most directlycomparable financial information reported in the consolidated financial statements prepared in accordance with IFRS and for an explanation of how management uses thesemeasures, see “Non-GAAP Financial Performance Measures” in the MD&A filed on SEDAR at www.sedar.com and included in the Form 6-K filed on EDGAR at www.sec.gov, as wellas the Company’s other filings with the Canadian securities regulators and the SEC.
The total cash costs per ounce of gold produced is reported on both a by-product basis (deducting by-product metal revenues from production costs) and co-product basis (withoutdeducting by-product metal revenues). Unless otherwise specified total cash costs per ounce of gold produced is reported on a by-product basis in this presentation. The total cashcosts per ounce of gold produced on a by-product basis is calculated by adjusting production costs as recorded in the consolidated statements of income for by-product revenues,unsold concentrate inventory production costs, smelting, refining and marketing charges and other adjustments, and then dividing by the number of ounces of gold produced. Thetotal cash costs per ounce of gold produced on a co-product basis is calculated in the same manner as the total cash costs per ounce of gold produced on a by-product basis exceptthat no adjustment is made for by-product metal revenues. Accordingly, the calculation of total cash costs per ounce of gold produced on a co-product basis does not reflect areduction in production costs or smelting, refining and marketing charges associated with the production and sale of by-product metals. The total cash costs per ounce of goldproduced is intended to provide information about the cash-generating capabilities of the Company’s mining operations. Management also uses these measures to monitor theperformance of the Company’s mining operations. As market prices for gold are quoted on a per ounce basis, using the total cash costs per ounce of gold produced on a by-productbasis measure allows management to assess a mine’s cash-generating capabilities at various gold prices.
All-in sustaining costs per ounce (“AISC”) is used to show the full cost of gold production from current operations. The Company calculates all-in sustaining costs per ounce of goldproduced on a by-product basis as the aggregate of total cash costs per ounce on a by-product basis, sustaining capital expenditures (including capitalized exploration), general andadministrative expenses (including stock options) and reclamation expenses. The all-in sustaining costs per ounce of gold produced on a co-product basis is calculated in the samemanner as the all-in sustaining costs per ounce of gold produced on a by-product basis, except that the total cash costs per ounce on a co-product basis are used, meaning noadjustment is made for by-product metal revenues. Management is aware that these per ounce measures of performance can be affected by fluctuations in foreign exchange ratesand, in the case of total cash costs per ounce of gold produced on a by-product basis, by-product metal prices. Management compensates for these inherent limitations by usingthese measures in conjunction with other data prepared in accordance with IFRS.
Minesite costs per tonne are calculated by adjusting production costs as recorded in the consolidated statements of income for unsold concentrate inventory production costs, andthen dividing by tonnes of ore processed. As the total cash costs per ounce of gold produced can be affected by fluctuations in by product metal prices and foreign exchange rates,management believes that minesite costs per tonne provides additional information regarding the performance of mining operations, eliminating the impact of varying productionlevels. Management also uses this measure to determine the economic viability of mining blocks. As each mining block is evaluated based on the net realizable value of each tonnemined, in order to be economically viable the estimated revenue on a per tonne basis must be in excess of the minesite costs per tonne. Management is aware that this per tonnemeasure of performance can be impacted by fluctuations in processing levels and compensates for this inherent limitation by using this measure in conjunction with production costsprepared in accordance with IFRS.
The Company calculates Cash from Operations for a given period by taking the amount equal to the Company’s gold production from its mines multiplied by the differential in theprice of gold over the total cash costs per ounce. Management uses Cash from Operations as a means of assessing the cash flow generation of the business. Estimates of Cashfrom Operations in future periods are based on the Company's production guidance, total cash cost guidance and internal forecasts as of the date hereof.
Note Regarding Production Guidance
The gold production guidance is based on the Company’s mineral reserves but includes contingencies and assumes metal prices and foreign exchange rates that are different fromthose used in the mineral reserve estimates. These factors and others mean that the gold production guidance presented in this presentation does not reconcile exactly with theproduction models used to support these mineral reserves.
The Company's production guidance at Meliadine is based, in part, on the results of preliminary economic assessments. These preliminary economic assessments include inferredmineral resources that are considered too speculative geologically to have the economic considerations applied to them that would enable them to be categorized as mineralreserves, and there is no certainty that the production guidance set out in this presentation will be realized. The preliminary economic assessment used in respect of the Meliadinemine project included 3.6 million contained ounces of inferred mineral resource, 3.3 million contained ounces of measured and indicated mineral resource and 3.4 million containedounces of proven and probable mineral reserve. For further information on the Company's production guidance at Meliadine, including the qualifications and assumptions made inconnection with the preparation of the assessments, please see the Company's press release dated February 14, 2018 and the Company's AIF, as well as the Company's otherfilings with the Canadian securities regulators and the SEC.
AGNICO EAGLE | RAYMOND JAMES 39TH ANNUAL INSTITUTIONAL INVESTORS CONFERENCE | 4
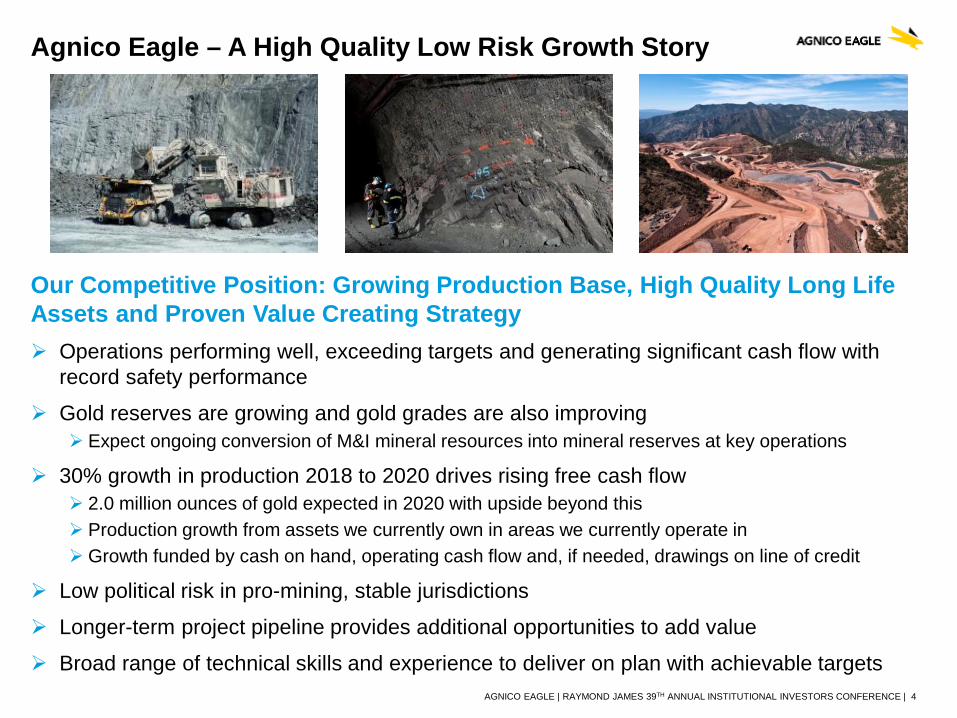
Our Competitive Position: Growing Production Base, High Quality Long Life Assets and Proven Value Creating Strategy Operations performing well, exceeding targets and generating significant cash flow with
record safety performance
Gold reserves are growing and gold grades are also improving Expect ongoing conversion of M&I mineral resources into mineral reserves at key operations
30% growth in production 2018 to 2020 drives rising free cash flow 2.0 million ounces of gold expected in 2020 with upside beyond this Production growth from assets we currently own in areas we currently operate inGrowth funded by cash on hand, operating cash flow and, if needed, drawings on line of credit
Low political risk in pro-mining, stable jurisdictions
Longer-term project pipeline provides additional opportunities to add value
Broad range of technical skills and experience to deliver on plan with achievable targets
Agnico Eagle – A High Quality Low Risk Growth Story
AGNICO EAGLE | RAYMOND JAMES 39TH ANNUAL INSTITUTIONAL INVESTORS CONFERENCE | 5
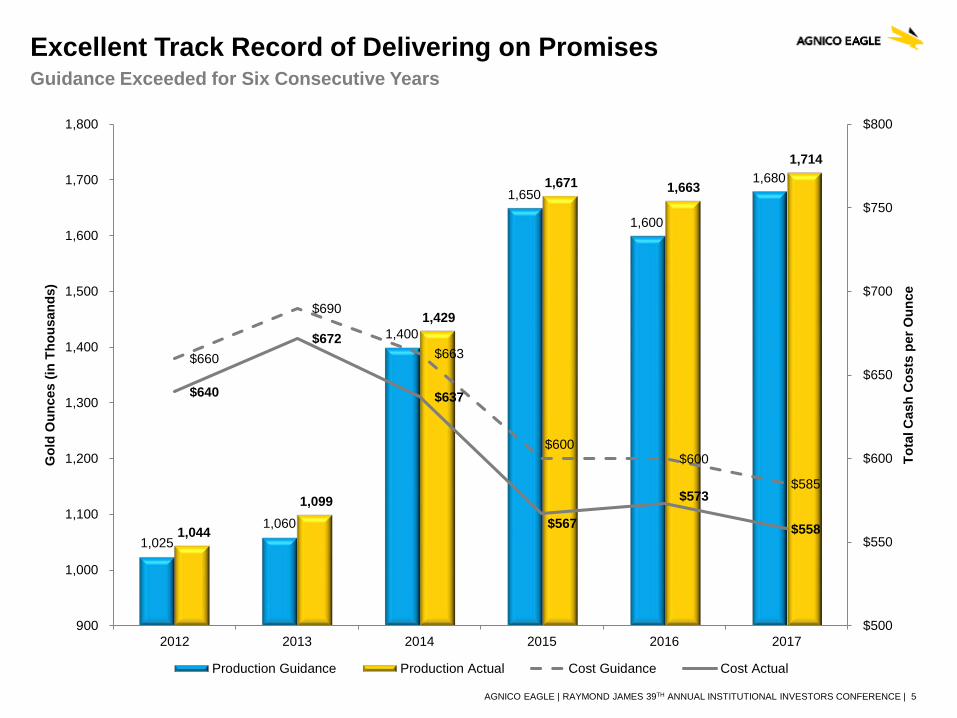
Excellent Track Record of Delivering on PromisesGuidance Exceeded for Six Consecutive Years
1,0251,060
1,400
1,650
1,600
1,680
1,044
1,099
1,429
1,671 1,663
1,714
$660
$690
$663
$600 $600
$585
$640
$672
$637
$567
$573
$558
$500
$550
$600
$650
$700
$750
$800
900
1,000
1,100
1,200
1,300
1,400
1,500
1,600
1,700
1,800
2012 2013 2014 2015 2016 2017
Tota
l Cas
h C
osts
per
Oun
ce
Gol
d O
unce
s (in
Tho
usan
ds)
Production Guidance Production Actual Cost Guidance Cost Actual
AGNICO EAGLE | RAYMOND JAMES 39TH ANNUAL INSTITUTIONAL INVESTORS CONFERENCE | 6
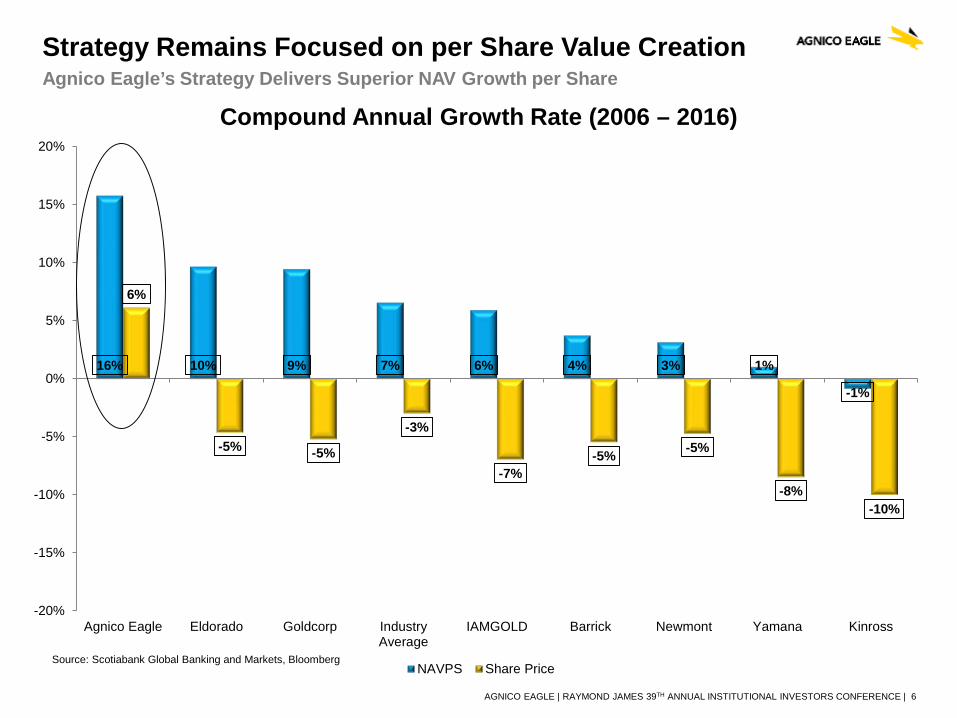
16% 10% 9% 7% 6% 4% 3% 1%
-1%
6%
-5% -5%
-3%
-7%-5% -5%
-8%-10%
-20%
-15%
-10%
-5%
0%
5%
10%
15%
20%
Agnico Eagle Eldorado Goldcorp IndustryAverage
IAMGOLD Barrick Newmont Yamana Kinross
Compound Annual Growth Rate (2006 – 2016)
NAVPS Share PriceSource: Scotiabank Global Banking and Markets, Bloomberg
Strategy Remains Focused on per Share Value CreationAgnico Eagle’s Strategy Delivers Superior NAV Growth per Share
AGNICO EAGLE | RAYMOND JAMES 39TH ANNUAL INSTITUTIONAL INVESTORS CONFERENCE | 7
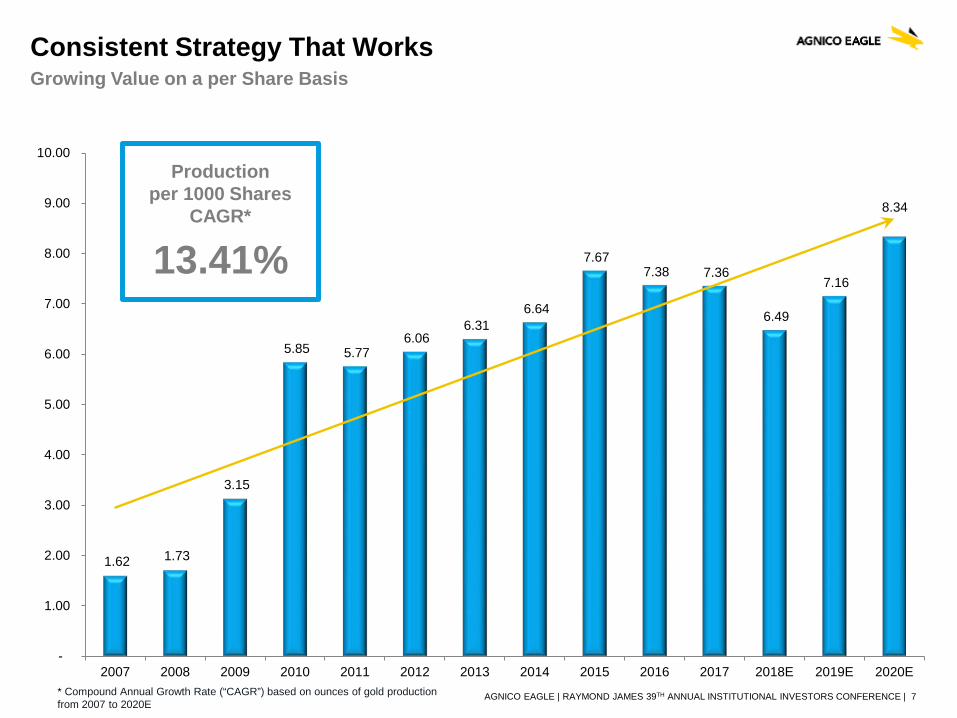
Consistent Strategy That WorksGrowing Value on a per Share Basis
1.62 1.73
3.15
5.85 5.77 6.06
6.31 6.64
7.67 7.38 7.36
6.49
7.16
8.34
-
1.00
2.00
3.00
4.00
5.00
6.00
7.00
8.00
9.00
10.00
2007 2008 2009 2010 2011 2012 2013 2014 2015 2016 2017 2018E 2019E 2020E* Compound Annual Growth Rate (“CAGR”) based on ounces of gold production from 2007 to 2020E
Production per 1000 Shares
CAGR*
13.41%
AGNICO EAGLE | RAYMOND JAMES 39TH ANNUAL INSTITUTIONAL INVESTORS CONFERENCE | 8
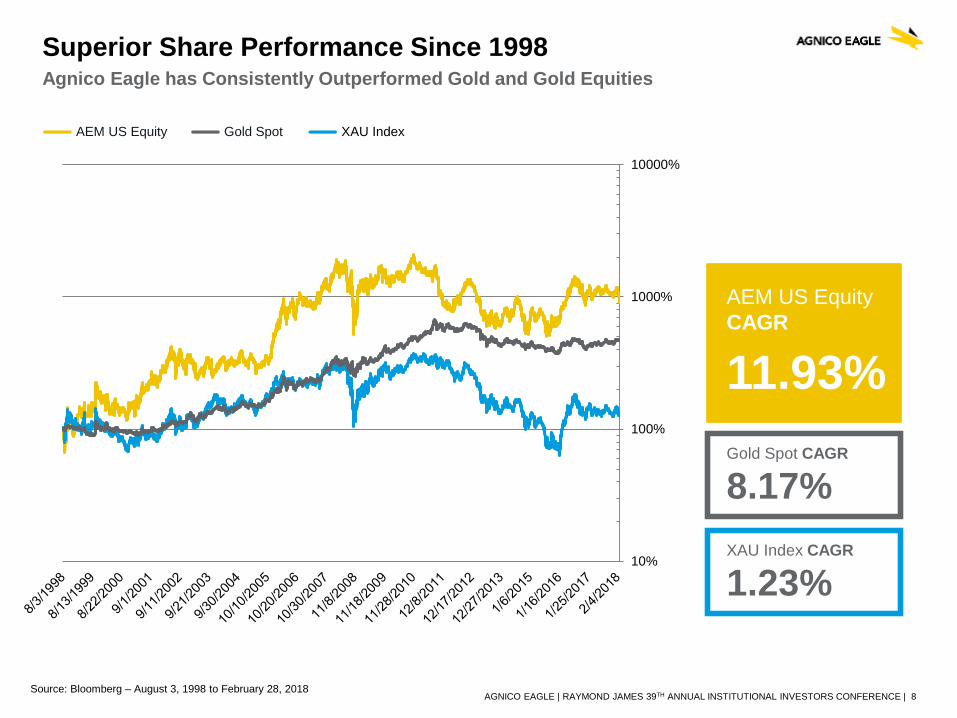
AEM US Equity XAU Index Gold Spot
AEM US EquityCAGR
11.93%Gold Spot CAGR
8.17%XAU Index CAGR
1.23%
Superior Share Performance Since 1998Agnico Eagle has Consistently Outperformed Gold and Gold Equities
Source: Bloomberg – August 3, 1998 to February 28, 2018
10%
100%
1000%
10000%
AGNICO EAGLE | RAYMOND JAMES 39TH ANNUAL INSTITUTIONAL INVESTORS CONFERENCE | 9
Gold production and costs better than forecast for 6th consecutive year – Payable production in 2017 was 1.71 Moz ofgold on production costs per ounce of $621, with total cash costs per ounce of $558, compared to most recent guidance of1.68 Moz of gold at total cash costs per ounce of $585. AISC for 2017 were $804, compared to guidance of $845 per ounce
New three year guidance; production forecasts increased for 2018 and 2019 as Meliadine start up advanced andMeadowbank extended into 2019; production guidance for 2020 is unchanged at 2.0 Moz – For 2018, production is nowforecast to be 1.53 Moz (versus previous guidance of 1.50 Moz). Midpoint of production guidance for 2019 is now 1.70 Moz(versus previous guidance of 1.6 Moz). Meliadine production now expected in Q2 2019, about one quarter ahead of schedule
Transitioning to lower unit costs by 2020 as production ramps up – In 2018, total cash costs per ounce are forecast to be$625 to $675 and AISC are forecast to be $890 to $940/oz. The increased unit costs over the 2017 period are largely due tolower gold production in 2018 than in 2017. As operations ramp up at Amaruq and Meliadine, with much higher gold productionexpected in 2020, total cash costs per ounce are forecast to decline to $600 to $650, while AISC are forecast to decline to$825 to $875/oz
Kittila Shaft Approved for Construction – The Company’s Board of Directors has approved an expansion to add a 1,044metre deep shaft and increase mill throughput by 25% to 2.0 million tonnes per annum ("mtpa") at Kittila. The expansion will bephased in over four years at a capital cost of approximately 160 million euros and is expected to result in a 50,000 to 70,000ounce annual increase in gold production at reduced operating costs beginning in 2021
A quarterly dividend of $0.11 per share has been declared
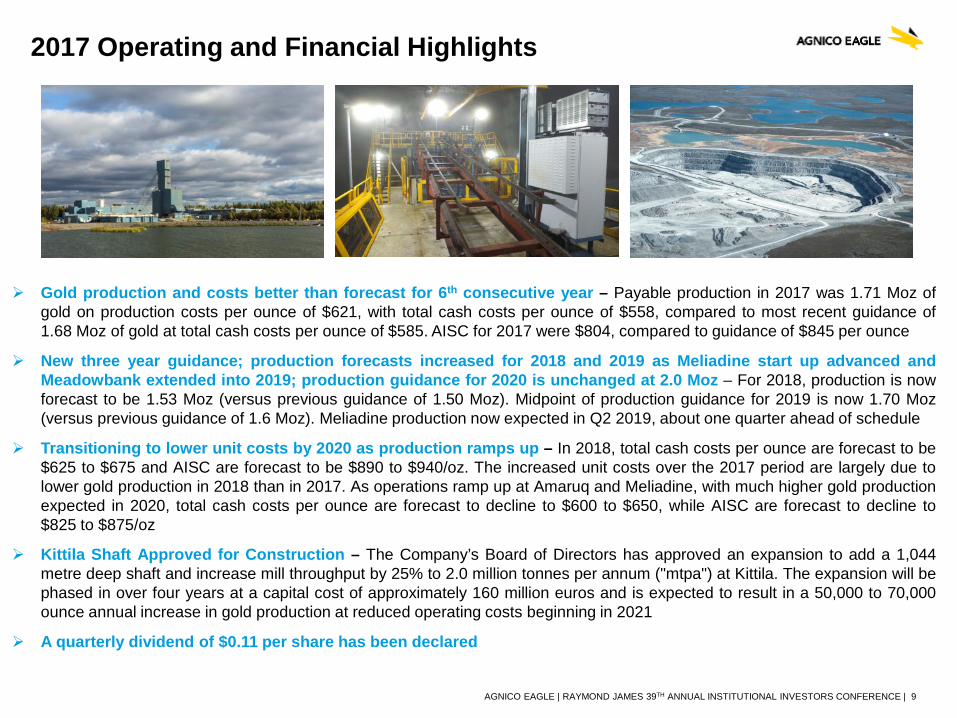
2017 Operating and Financial Highlights
AGNICO EAGLE | RAYMOND JAMES 39TH ANNUAL INSTITUTIONAL INVESTORS CONFERENCE | 10
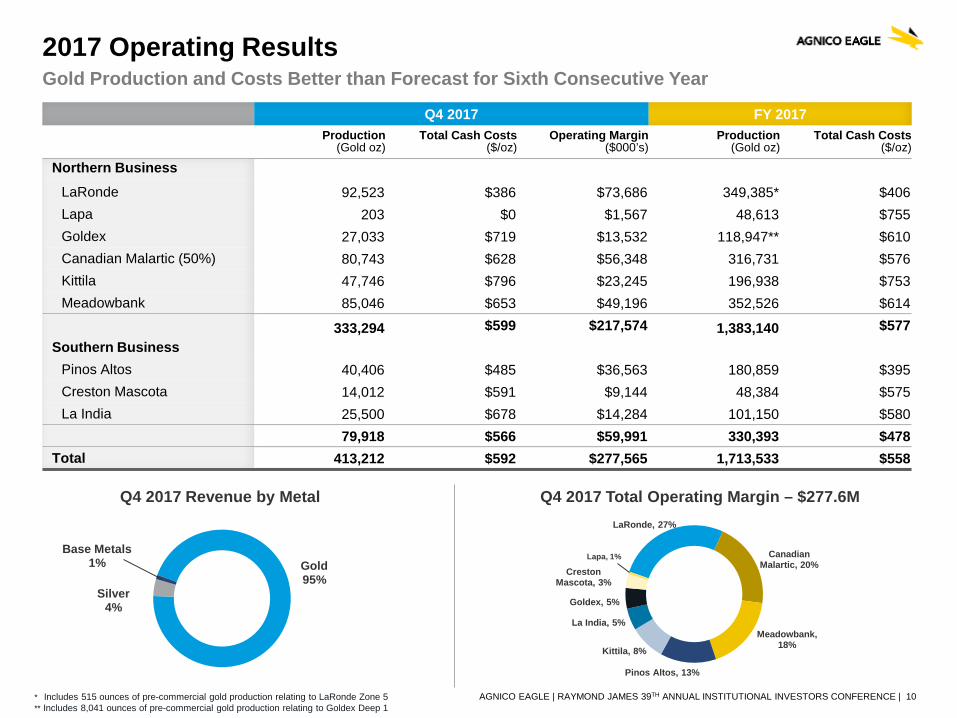
2017 Operating ResultsGold Production and Costs Better than Forecast for Sixth Consecutive Year
Q4 2017 Total Operating Margin – $277.6MQ4 2017 Revenue by MetalLaRonde, 27%
Canadian Malartic, 20%
Meadowbank, 18%
Pinos Altos, 13%
Kittila, 8%
La India, 5%
Goldex, 5%
Creston Mascota, 3%
Lapa, 1%
* Includes 515 ounces of pre-commercial gold production relating to LaRonde Zone 5 ** Includes 8,041 ounces of pre-commercial gold production relating to Goldex Deep 1
Gold95%
Silver4%
Base Metals1%
Q4 2017 FY 2017Production
(Gold oz)Total Cash Costs
($/oz)Operating Margin
($000’s)Production
(Gold oz)Total Cash Costs
($/oz)
Northern BusinessLaRonde 92,523 $386 $73,686 349,385* $406 Lapa 203 $0 $1,567 48,613 $755 Goldex 27,033 $719 $13,532 118,947** $610 Canadian Malartic (50%) 80,743 $628 $56,348 316,731 $576 Kittila 47,746 $796 $23,245 196,938 $753 Meadowbank 85,046 $653 $49,196 352,526 $614
333,294 $599 $217,574 1,383,140 $577 Southern Business
Pinos Altos 40,406 $485 $36,563 180,859 $395 Creston Mascota 14,012 $591 $9,144 48,384 $575 La India 25,500 $678 $14,284 101,150 $580
79,918 $566 $59,991 330,393 $478 Total 413,212 $592 $277,565 1,713,533 $558
AGNICO EAGLE | RAYMOND JAMES 39TH ANNUAL INSTITUTIONAL INVESTORS CONFERENCE | 11
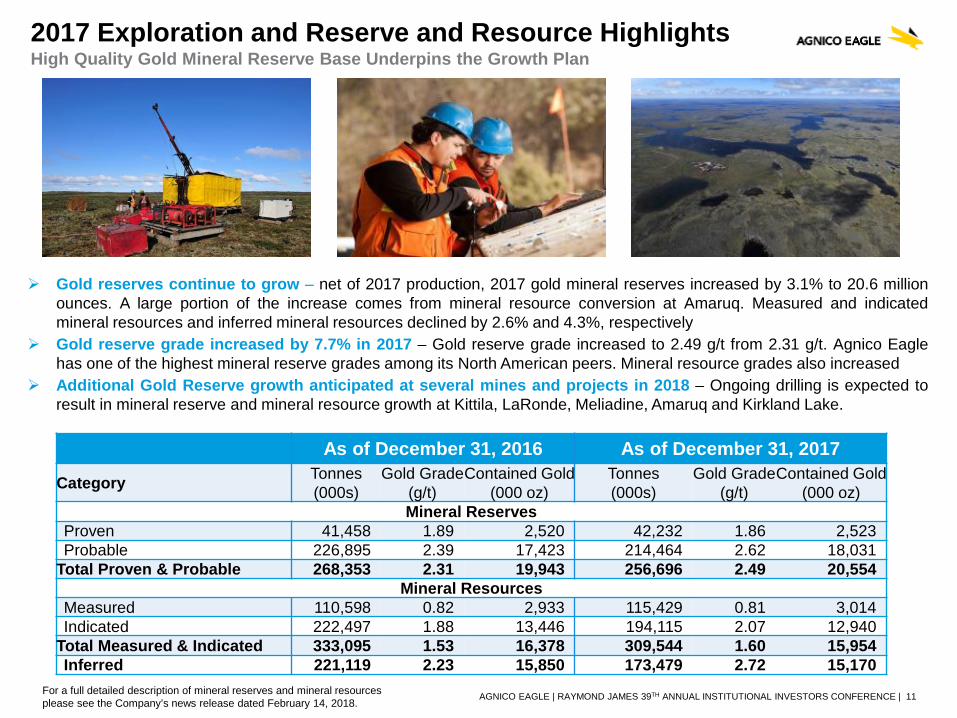
Gold reserves continue to grow – net of 2017 production, 2017 gold mineral reserves increased by 3.1% to 20.6 millionounces. A large portion of the increase comes from mineral resource conversion at Amaruq. Measured and indicatedmineral resources and inferred mineral resources declined by 2.6% and 4.3%, respectively
Gold reserve grade increased by 7.7% in 2017 – Gold reserve grade increased to 2.49 g/t from 2.31 g/t. Agnico Eaglehas one of the highest mineral reserve grades among its North American peers. Mineral resource grades also increased
Additional Gold Reserve growth anticipated at several mines and projects in 2018 – Ongoing drilling is expected toresult in mineral reserve and mineral resource growth at Kittila, LaRonde, Meliadine, Amaruq and Kirkland Lake.
2017 Exploration and Reserve and Resource Highlights
As of December 31, 2016 As of December 31, 2017
Category Tonnes(000s)
Gold Grade(g/t)
Contained Gold(000 oz)
Tonnes(000s)
Gold Grade(g/t)
Contained Gold(000 oz)
Mineral ReservesProven 41,458 1.89 2,520 42,232 1.86 2,523Probable 226,895 2.39 17,423 214,464 2.62 18,031
Total Proven & Probable 268,353 2.31 19,943 256,696 2.49 20,554Mineral Resources
Measured 110,598 0.82 2,933 115,429 0.81 3,014Indicated 222,497 1.88 13,446 194,115 2.07 12,940
Total Measured & Indicated 333,095 1.53 16,378 309,544 1.60 15,954Inferred 221,119 2.23 15,850 173,479 2.72 15,170
For a full detailed description of mineral reserves and mineral resources please see the Company’s news release dated February 14, 2018.
High Quality Gold Mineral Reserve Base Underpins the Growth Plan
AGNICO EAGLE | RAYMOND JAMES 39TH ANNUAL INSTITUTIONAL INVESTORS CONFERENCE | 12
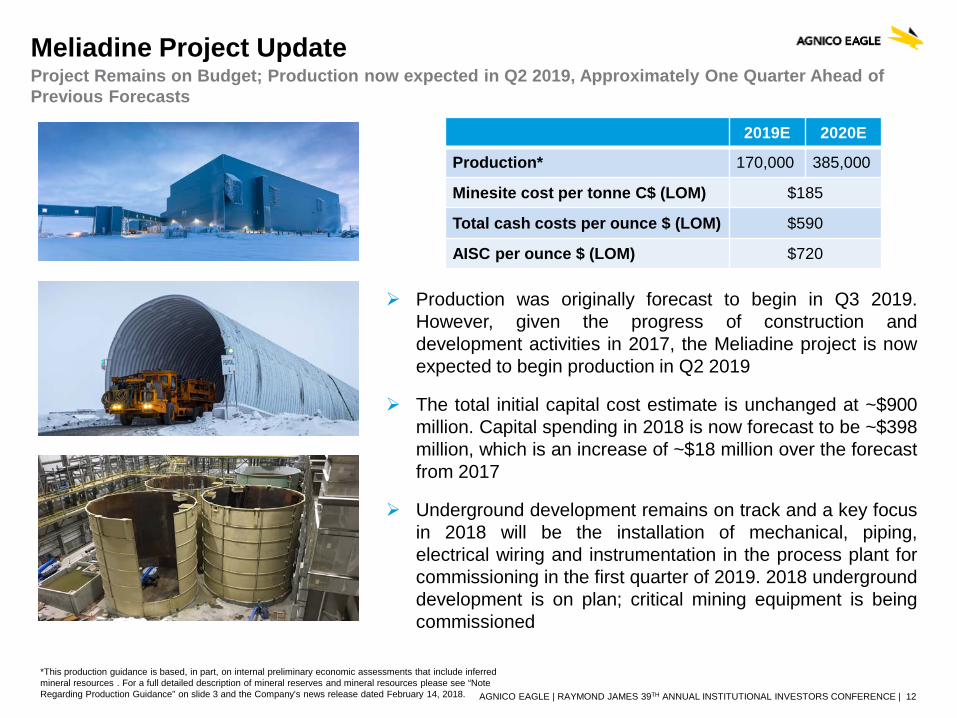
Meliadine Project Update
Production was originally forecast to begin in Q3 2019.However, given the progress of construction anddevelopment activities in 2017, the Meliadine project is nowexpected to begin production in Q2 2019
The total initial capital cost estimate is unchanged at ~$900million. Capital spending in 2018 is now forecast to be ~$398million, which is an increase of ~$18 million over the forecastfrom 2017
Underground development remains on track and a key focusin 2018 will be the installation of mechanical, piping,electrical wiring and instrumentation in the process plant forcommissioning in the first quarter of 2019. 2018 undergrounddevelopment is on plan; critical mining equipment is beingcommissioned
2019E 2020E
Production* 170,000 385,000
Minesite cost per tonne C$ (LOM) $185
Total cash costs per ounce $ (LOM) $590
AISC per ounce $ (LOM) $720
*This production guidance is based, in part, on internal preliminary economic assessments that include inferred mineral resources . For a full detailed description of mineral reserves and mineral resources please see “Note Regarding Production Guidance” on slide 3 and the Company’s news release dated February 14, 2018.
Project Remains on Budget; Production now expected in Q2 2019, Approximately One Quarter Ahead of Previous Forecasts
AGNICO EAGLE | RAYMOND JAMES 39TH ANNUAL INSTITUTIONAL INVESTORS CONFERENCE | 13
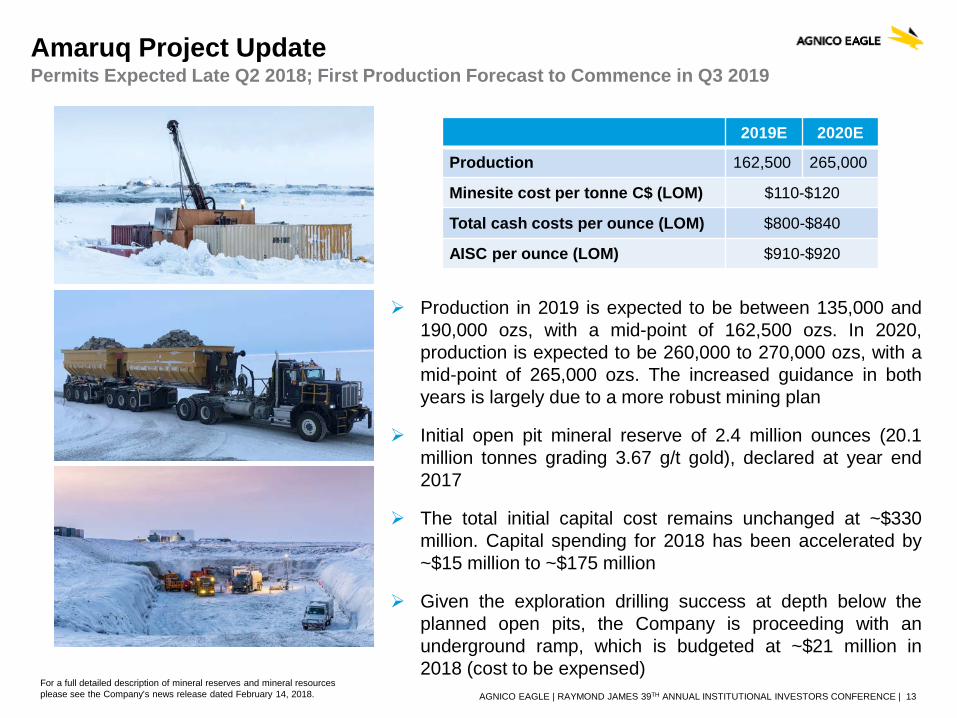
Amaruq Project UpdatePermits Expected Late Q2 2018; First Production Forecast to Commence in Q3 2019
Production in 2019 is expected to be between 135,000 and190,000 ozs, with a mid-point of 162,500 ozs. In 2020,production is expected to be 260,000 to 270,000 ozs, with amid-point of 265,000 ozs. The increased guidance in bothyears is largely due to a more robust mining plan
Initial open pit mineral reserve of 2.4 million ounces (20.1million tonnes grading 3.67 g/t gold), declared at year end2017
The total initial capital cost remains unchanged at ~$330million. Capital spending for 2018 has been accelerated by~$15 million to ~$175 million
Given the exploration drilling success at depth below theplanned open pits, the Company is proceeding with anunderground ramp, which is budgeted at ~$21 million in2018 (cost to be expensed)
2019E 2020E
Production 162,500 265,000
Minesite cost per tonne C$ (LOM) $110-$120
Total cash costs per ounce (LOM) $800-$840
AISC per ounce (LOM) $910-$920
For a full detailed description of mineral reserves and mineral resourcesplease see the Company’s news release dated February 14, 2018.
AGNICO EAGLE | RAYMOND JAMES 39TH ANNUAL INSTITUTIONAL INVESTORS CONFERENCE | 14
1,530
1,700
2,000
1,800
0
500
1,000
1,500
2,000
2,500
2018E 2019E 2020E 2021E
Gol
d O
unce
s (in
Tho
usan
ds)
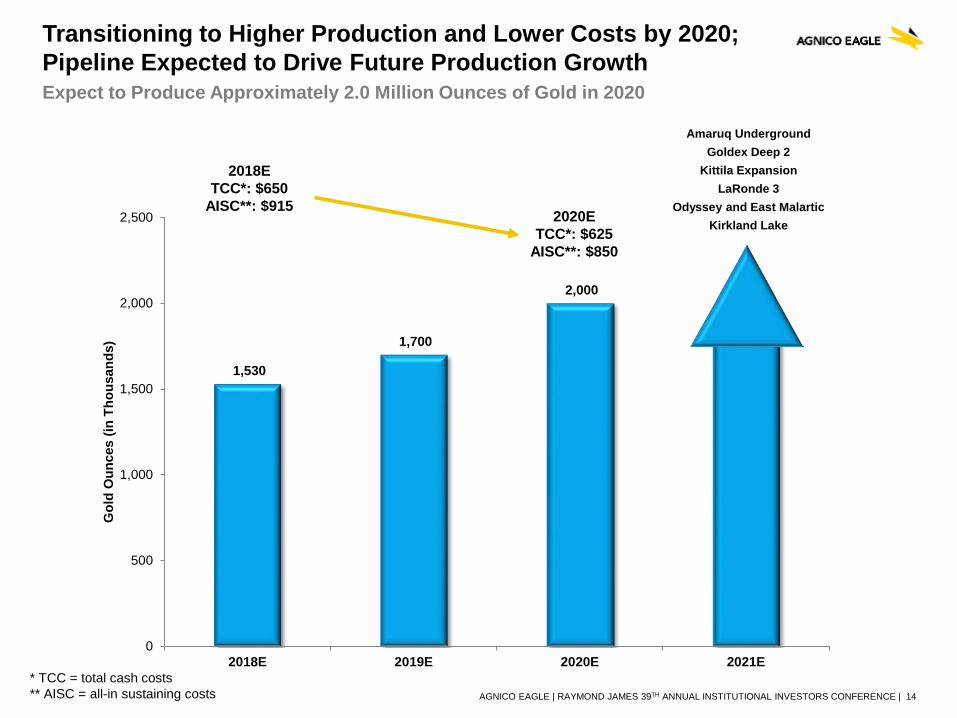
Transitioning to Higher Production and Lower Costs by 2020; Pipeline Expected to Drive Future Production GrowthExpect to Produce Approximately 2.0 Million Ounces of Gold in 2020
Amaruq UndergroundGoldex Deep 2
Kittila ExpansionLaRonde 3
Odyssey and East MalarticKirkland Lake
2018ETCC*: $650
AISC**: $9152020E
TCC*: $625AISC**: $850
* TCC = total cash costs** AISC = all-in sustaining costs
AGNICO EAGLE | RAYMOND JAMES 39TH ANNUAL INSTITUTIONAL INVESTORS CONFERENCE | 15
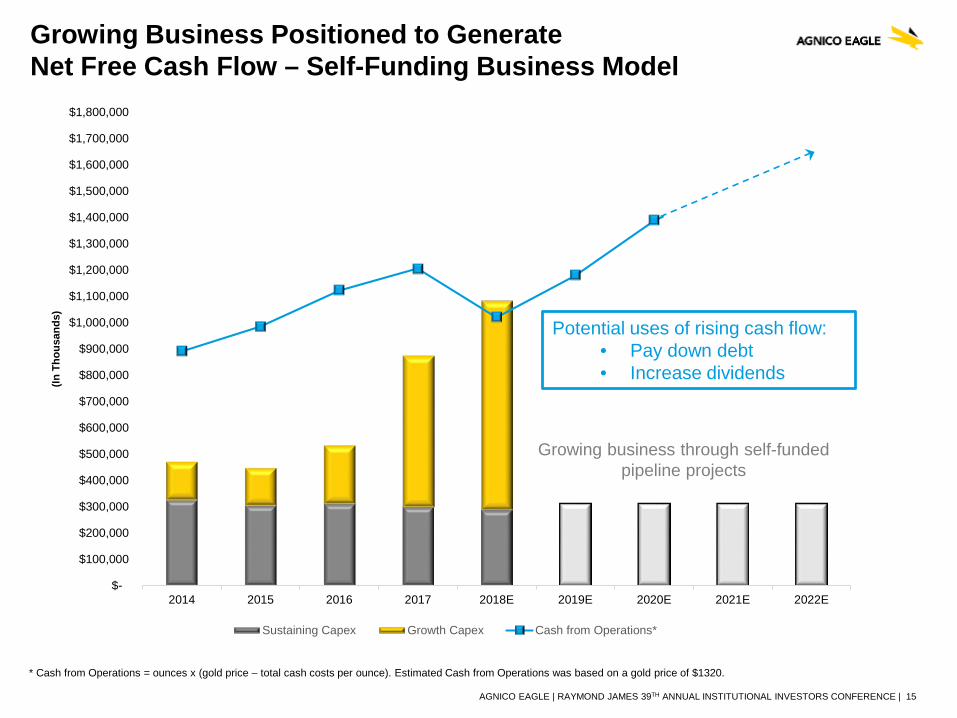
Growing Business Positioned to Generate Net Free Cash Flow – Self-Funding Business Model
$-
$100,000
$200,000
$300,000
$400,000
$500,000
$600,000
$700,000
$800,000
$900,000
$1,000,000
$1,100,000
$1,200,000
$1,300,000
$1,400,000
$1,500,000
$1,600,000
$1,700,000
$1,800,000
2014 2015 2016 2017 2018E 2019E 2020E 2021E 2022E
(In T
hous
ands
)
Sustaining Capex Growth Capex Cash from Operations*
Potential uses of rising cash flow:• Pay down debt• Increase dividends
Growing business through self-funded pipeline projects
* Cash from Operations = ounces x (gold price – total cash costs per ounce). Estimated Cash from Operations was based on a gold price of $1320.
AGNICO EAGLE | RAYMOND JAMES 39TH ANNUAL INSTITUTIONAL INVESTORS CONFERENCE | 16
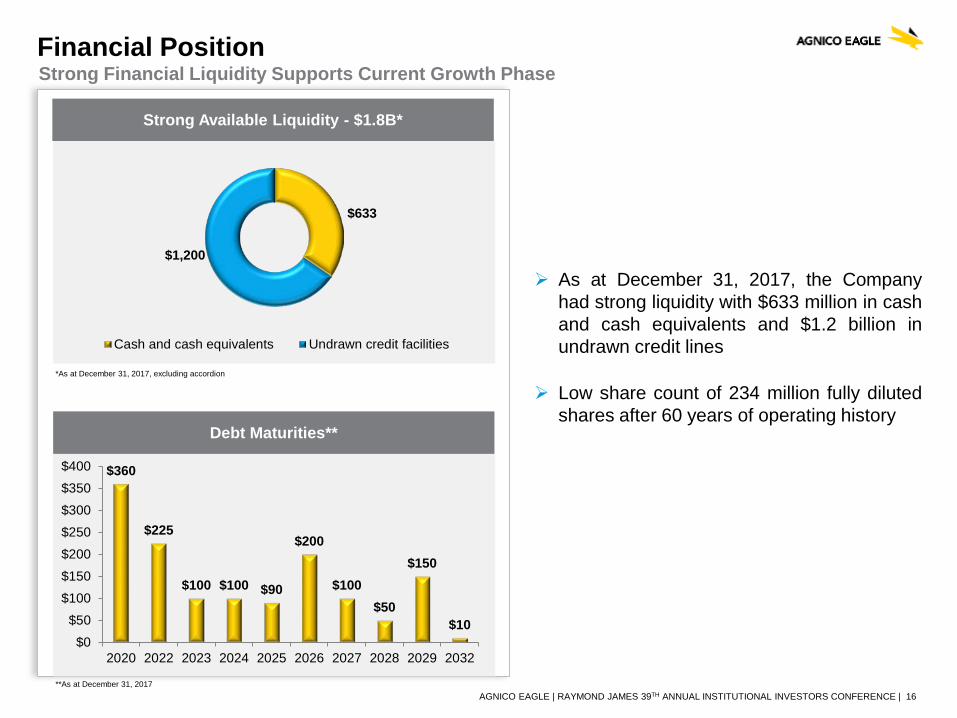
Financial PositionStrong Financial Liquidity Supports Current Growth Phase
Strong Available Liquidity - $1.8B*
Debt Maturities**
*As at December 31, 2017, excluding accordion
As at December 31, 2017, the Companyhad strong liquidity with $633 million in cashand cash equivalents and $1.2 billion inundrawn credit lines
Low share count of 234 million fully dilutedshares after 60 years of operating history
**As at December 31, 2017
$360
$225
$100 $100 $90
$200
$100$50
$150
$10$0
$50$100$150$200$250$300$350$400
2020 2022 2023 2024 2025 2026 2027 2028 2029 2032
$633
$1,200
Cash and cash equivalents Undrawn credit facilities
AGNICO EAGLE | RAYMOND JAMES 39TH ANNUAL INSTITUTIONAL INVESTORS CONFERENCE | 17
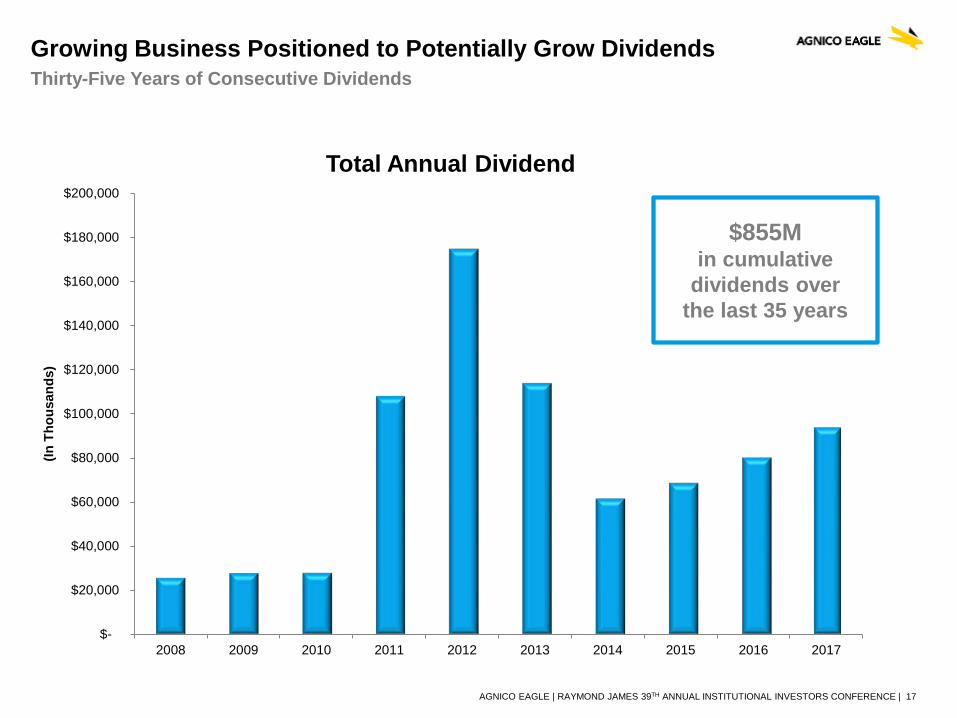
Growing Business Positioned to Potentially Grow DividendsThirty-Five Years of Consecutive Dividends
$-
$20,000
$40,000
$60,000
$80,000
$100,000
$120,000
$140,000
$160,000
$180,000
$200,000
2008 2009 2010 2011 2012 2013 2014 2015 2016 2017
(In T
hous
ands
)
Total Annual Dividend
$855M in cumulative
dividends over the last 35 years
AGNICO EAGLE | RAYMOND JAMES 39TH ANNUAL INSTITUTIONAL INVESTORS CONFERENCE | 18
Consistent Strategy and Solid Execution Drives Superior per Share Returns
Production Growth – Existing Asset Base Expected to Produce Approximately 2.0 Moz ofGold in 2020 with upside beyond this
Emerging Nunavut Platform – Expanding Production Base in a Region With SignificantExploration Potential
Significant Free Cash Flow Growth Expected in the Second Half of 2019
High Quality Gold Reserves – Growing Gold Reserve Base with Increasing Gold Grades
Exploration Delivering on Several Fronts – Remains a Key Value Driver
Strong Balance Sheet with Financial Flexibility
Consecutive 35 Years of Dividends
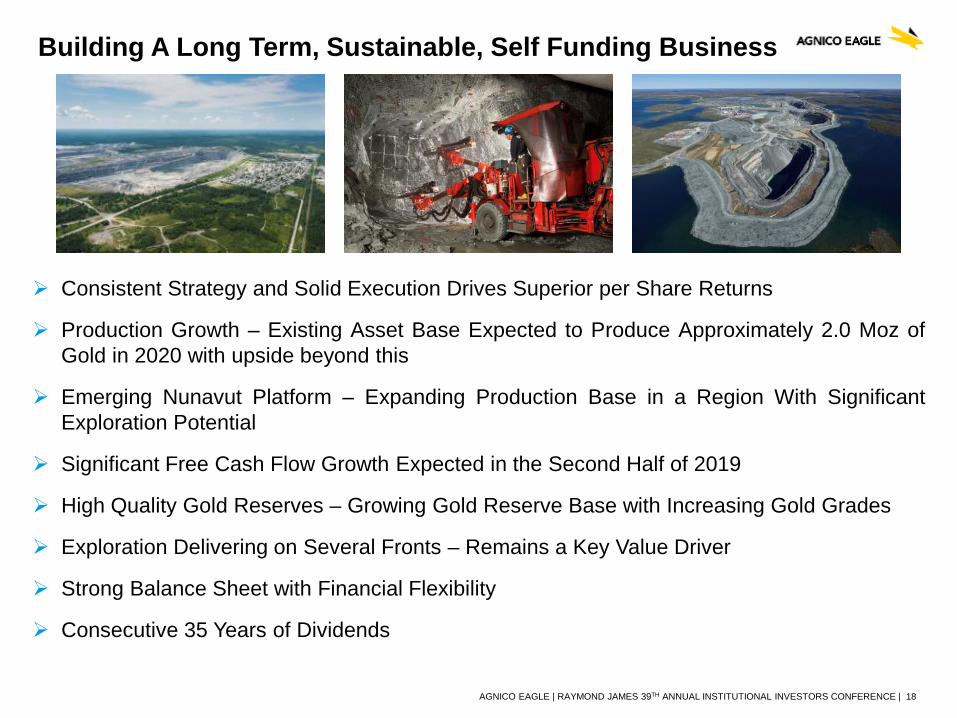
Building A Long Term, Sustainable, Self Funding Business
NORTHERNBUSINESS
AGNICO EAGLE | RAYMOND JAMES 39TH ANNUAL INSTITUTIONAL INVESTORS CONFERENCE | 20
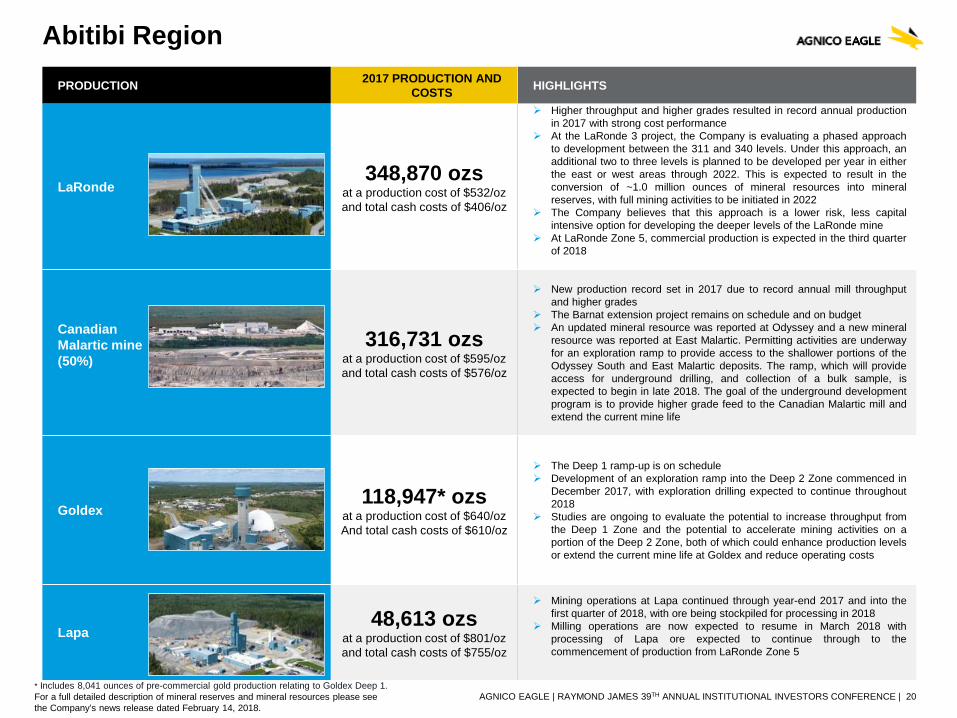
PRODUCTION 2017 PRODUCTION AND COSTS HIGHLIGHTS
LaRonde348,870 ozs
at a production cost of $532/ozand total cash costs of $406/oz
Higher throughput and higher grades resulted in record annual productionin 2017 with strong cost performance
At the LaRonde 3 project, the Company is evaluating a phased approachto development between the 311 and 340 levels. Under this approach, anadditional two to three levels is planned to be developed per year in eitherthe east or west areas through 2022. This is expected to result in theconversion of ~1.0 million ounces of mineral resources into mineralreserves, with full mining activities to be initiated in 2022
The Company believes that this approach is a lower risk, less capitalintensive option for developing the deeper levels of the LaRonde mine
At LaRonde Zone 5, commercial production is expected in the third quarterof 2018
Canadian Malartic mine (50%)
316,731 ozsat a production cost of $595/ozand total cash costs of $576/oz
New production record set in 2017 due to record annual mill throughputand higher grades
The Barnat extension project remains on schedule and on budget An updated mineral resource was reported at Odyssey and a new mineral
resource was reported at East Malartic. Permitting activities are underwayfor an exploration ramp to provide access to the shallower portions of theOdyssey South and East Malartic deposits. The ramp, which will provideaccess for underground drilling, and collection of a bulk sample, isexpected to begin in late 2018. The goal of the underground developmentprogram is to provide higher grade feed to the Canadian Malartic mill andextend the current mine life
Goldex 118,947* ozs
at a production cost of $640/ozAnd total cash costs of $610/oz
The Deep 1 ramp-up is on schedule Development of an exploration ramp into the Deep 2 Zone commenced in
December 2017, with exploration drilling expected to continue throughout2018
Studies are ongoing to evaluate the potential to increase throughput fromthe Deep 1 Zone and the potential to accelerate mining activities on aportion of the Deep 2 Zone, both of which could enhance production levelsor extend the current mine life at Goldex and reduce operating costs
Lapa48,613 ozs
at a production cost of $801/ozand total cash costs of $755/oz
Mining operations at Lapa continued through year-end 2017 and into thefirst quarter of 2018, with ore being stockpiled for processing in 2018
Milling operations are now expected to resume in March 2018 withprocessing of Lapa ore expected to continue through to thecommencement of production from LaRonde Zone 5
Abitibi Region
* Includes 8,041 ounces of pre-commercial gold production relating to Goldex Deep 1.For a full detailed description of mineral reserves and mineral resources please seethe Company’s news release dated February 14, 2018.
AGNICO EAGLE | RAYMOND JAMES 39TH ANNUAL INSTITUTIONAL INVESTORS CONFERENCE | 21
EXPLORATION AND DEVELOPMENT HIGHLIGHTS
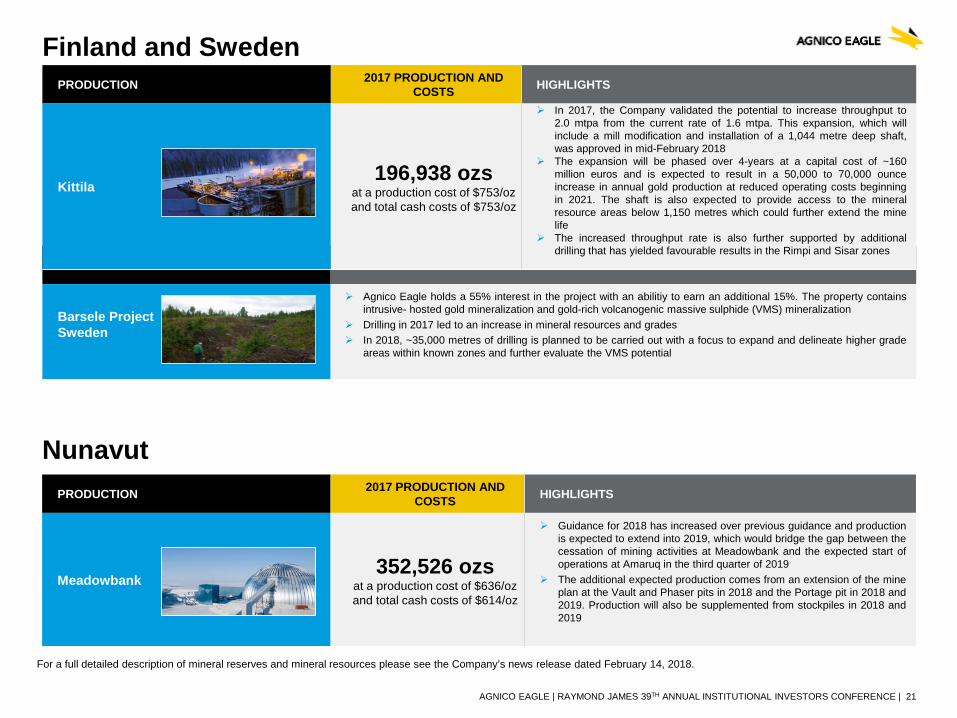
Barsele Project Sweden
Agnico Eagle holds a 55% interest in the project with an abilitiy to earn an additional 15%. The property containsintrusive- hosted gold mineralization and gold-rich volcanogenic massive sulphide (VMS) mineralization
Drilling in 2017 led to an increase in mineral resources and grades In 2018, ~35,000 metres of drilling is planned to be carried out with a focus to expand and delineate higher grade
areas within known zones and further evaluate the VMS potential
Nunavut
PRODUCTION 2017 PRODUCTION AND COSTS HIGHLIGHTS
Kittila196,938 ozs
at a production cost of $753/ozand total cash costs of $753/oz
In 2017, the Company validated the potential to increase throughput to2.0 mtpa from the current rate of 1.6 mtpa. This expansion, which willinclude a mill modification and installation of a 1,044 metre deep shaft,was approved in mid-February 2018
The expansion will be phased over 4-years at a capital cost of ~160million euros and is expected to result in a 50,000 to 70,000 ounceincrease in annual gold production at reduced operating costs beginningin 2021. The shaft is also expected to provide access to the mineralresource areas below 1,150 metres which could further extend the minelife
The increased throughput rate is also further supported by additionaldrilling that has yielded favourable results in the Rimpi and Sisar zones
Finland and Sweden
PRODUCTION 2017 PRODUCTION AND COSTS HIGHLIGHTS
Meadowbank352,526 ozs
at a production cost of $636/ozand total cash costs of $614/oz
Guidance for 2018 has increased over previous guidance and productionis expected to extend into 2019, which would bridge the gap between thecessation of mining activities at Meadowbank and the expected start ofoperations at Amaruq in the third quarter of 2019
The additional expected production comes from an extension of the mineplan at the Vault and Phaser pits in 2018 and the Portage pit in 2018 and2019. Production will also be supplemented from stockpiles in 2018 and2019
For a full detailed description of mineral reserves and mineral resources please see the Company’s news release dated February 14, 2018.
SOUTHERNBUSINESS
AGNICO EAGLE | RAYMOND JAMES 39TH ANNUAL INSTITUTIONAL INVESTORS CONFERENCE | 23
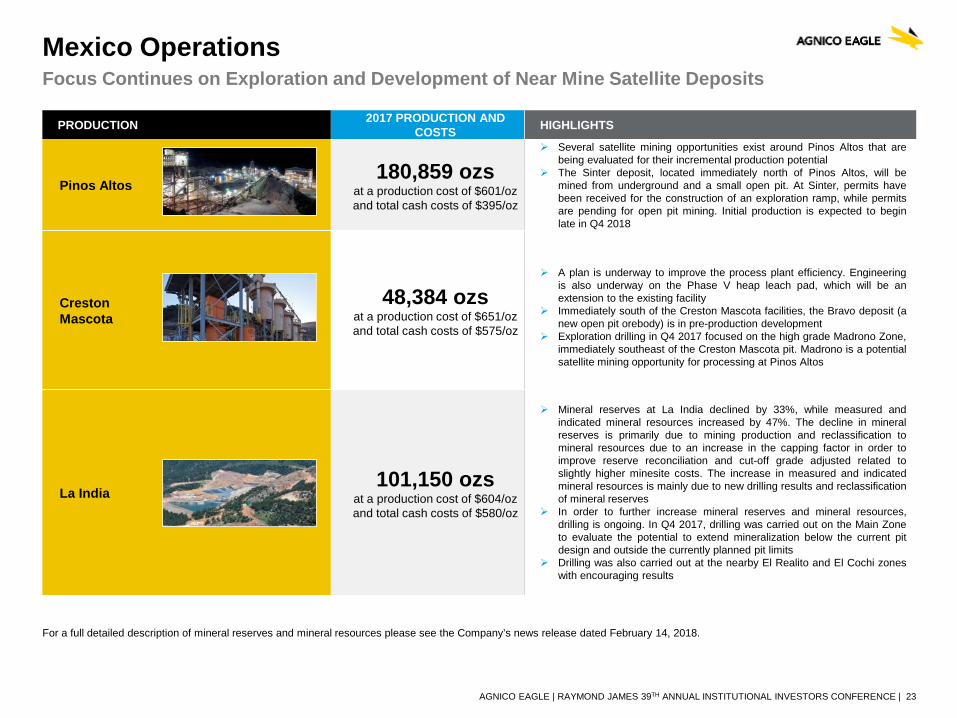
PRODUCTION 2017 PRODUCTION AND COSTS HIGHLIGHTS
Pinos Altos 180,859 ozs
at a production cost of $601/ozand total cash costs of $395/oz
Several satellite mining opportunities exist around Pinos Altos that arebeing evaluated for their incremental production potential
The Sinter deposit, located immediately north of Pinos Altos, will bemined from underground and a small open pit. At Sinter, permits havebeen received for the construction of an exploration ramp, while permitsare pending for open pit mining. Initial production is expected to beginlate in Q4 2018
Creston Mascota
48,384 ozsat a production cost of $651/ozand total cash costs of $575/oz
A plan is underway to improve the process plant efficiency. Engineeringis also underway on the Phase V heap leach pad, which will be anextension to the existing facility
Immediately south of the Creston Mascota facilities, the Bravo deposit (anew open pit orebody) is in pre-production development
Exploration drilling in Q4 2017 focused on the high grade Madrono Zone,immediately southeast of the Creston Mascota pit. Madrono is a potentialsatellite mining opportunity for processing at Pinos Altos
La India101,150 ozs
at a production cost of $604/ozand total cash costs of $580/oz
Mineral reserves at La India declined by 33%, while measured andindicated mineral resources increased by 47%. The decline in mineralreserves is primarily due to mining production and reclassification tomineral resources due to an increase in the capping factor in order toimprove reserve reconciliation and cut-off grade adjusted related toslightly higher minesite costs. The increase in measured and indicatedmineral resources is mainly due to new drilling results and reclassificationof mineral reserves
In order to further increase mineral reserves and mineral resources,drilling is ongoing. In Q4 2017, drilling was carried out on the Main Zoneto evaluate the potential to extend mineralization below the current pitdesign and outside the currently planned pit limits
Drilling was also carried out at the nearby El Realito and El Cochi zoneswith encouraging results
Mexico OperationsFocus Continues on Exploration and Development of Near Mine Satellite Deposits
For a full detailed description of mineral reserves and mineral resources please see the Company’s news release dated February 14, 2018.
AGNICO EAGLE | RAYMOND JAMES 39TH ANNUAL INSTITUTIONAL INVESTORS CONFERENCE | 24
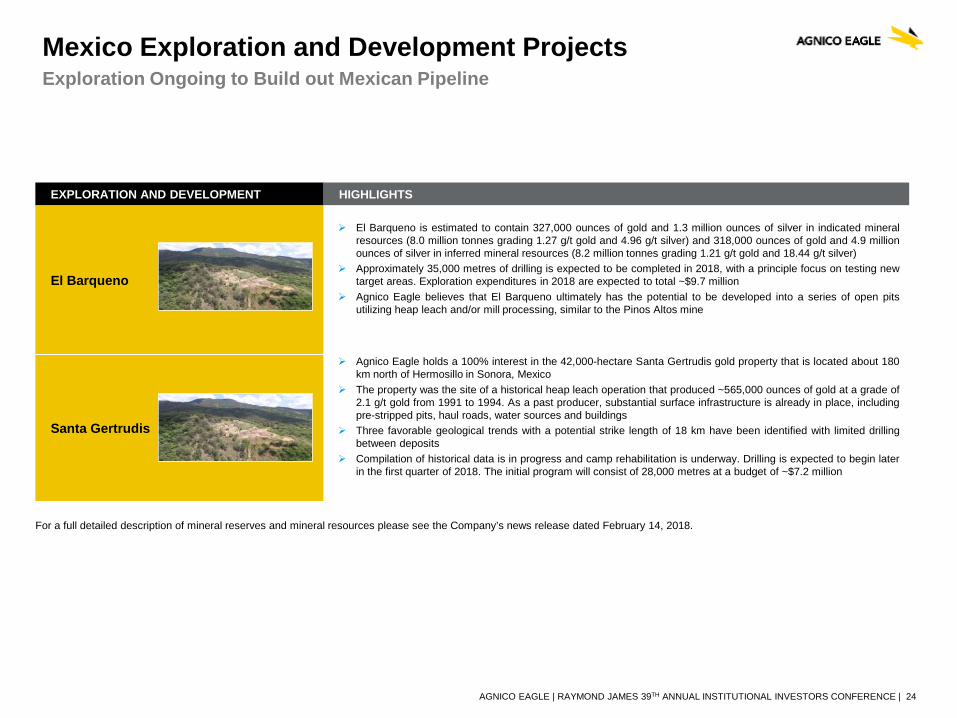
Mexico Exploration and Development ProjectsExploration Ongoing to Build out Mexican Pipeline
EXPLORATION AND DEVELOPMENT HIGHLIGHTS
El Barqueno
El Barqueno is estimated to contain 327,000 ounces of gold and 1.3 million ounces of silver in indicated mineralresources (8.0 million tonnes grading 1.27 g/t gold and 4.96 g/t silver) and 318,000 ounces of gold and 4.9 millionounces of silver in inferred mineral resources (8.2 million tonnes grading 1.21 g/t gold and 18.44 g/t silver)
Approximately 35,000 metres of drilling is expected to be completed in 2018, with a principle focus on testing newtarget areas. Exploration expenditures in 2018 are expected to total ~$9.7 million
Agnico Eagle believes that El Barqueno ultimately has the potential to be developed into a series of open pitsutilizing heap leach and/or mill processing, similar to the Pinos Altos mine
Santa Gertrudis
Agnico Eagle holds a 100% interest in the 42,000-hectare Santa Gertrudis gold property that is located about 180km north of Hermosillo in Sonora, Mexico
The property was the site of a historical heap leach operation that produced ~565,000 ounces of gold at a grade of2.1 g/t gold from 1991 to 1994. As a past producer, substantial surface infrastructure is already in place, includingpre-stripped pits, haul roads, water sources and buildings
Three favorable geological trends with a potential strike length of 18 km have been identified with limited drillingbetween deposits
Compilation of historical data is in progress and camp rehabilitation is underway. Drilling is expected to begin laterin the first quarter of 2018. The initial program will consist of 28,000 metres at a budget of ~$7.2 million
For a full detailed description of mineral reserves and mineral resources please see the Company’s news release dated February 14, 2018.
APPENDIX
AGNICO EAGLE | RAYMOND JAMES 39TH ANNUAL INSTITUTIONAL INVESTORS CONFERENCE | 26
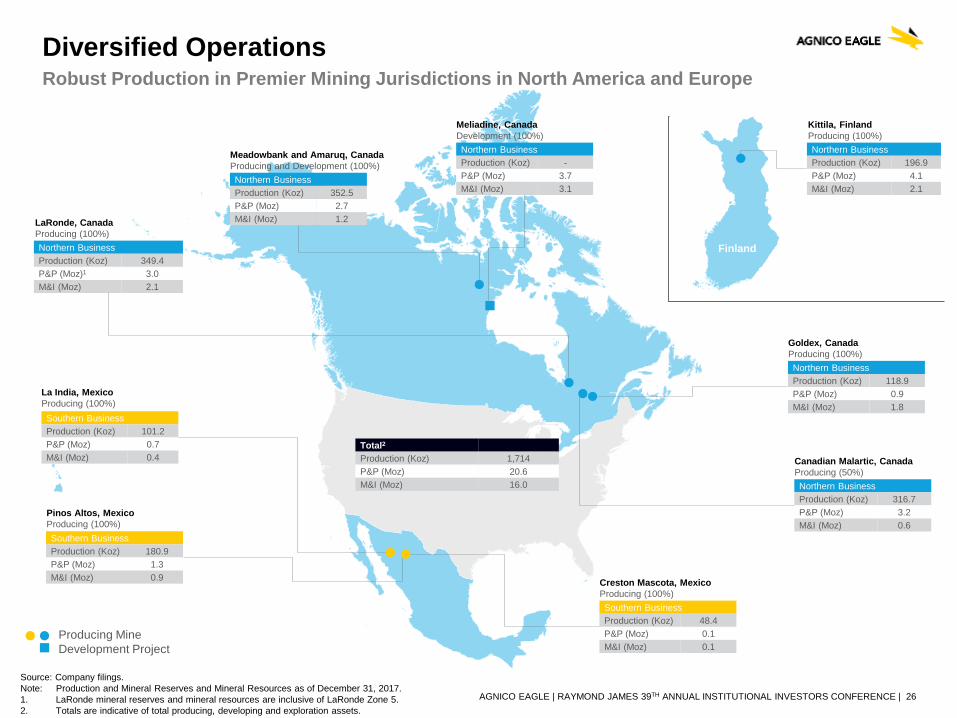
Diversified OperationsRobust Production in Premier Mining Jurisdictions in North America and Europe
Kittila, FinlandProducing (100%) Northern BusinessProduction (Koz) 196.9P&P (Moz) 4.1M&I (Moz) 2.1
Meliadine, CanadaDevelopment (100%) Northern BusinessProduction (Koz) -P&P (Moz) 3.7M&I (Moz) 3.1
Meadowbank and Amaruq, CanadaProducing and Development (100%) Northern BusinessProduction (Koz) 352.5P&P (Moz) 2.7M&I (Moz) 1.2LaRonde, Canada
Producing (100%) Northern BusinessProduction (Koz) 349.4P&P (Moz)1 3.0M&I (Moz) 2.1
Goldex, CanadaProducing (100%) Northern BusinessProduction (Koz) 118.9P&P (Moz) 0.9M&I (Moz) 1.8
Canadian Malartic, CanadaProducing (50%) Northern BusinessProduction (Koz) 316.7P&P (Moz) 3.2M&I (Moz) 0.6
La India, MexicoProducing (100%) Southern BusinessProduction (Koz) 101.2P&P (Moz) 0.7M&I (Moz) 0.4
Pinos Altos, MexicoProducing (100%) Southern BusinessProduction (Koz) 180.9P&P (Moz) 1.3M&I (Moz) 0.9 Creston Mascota, Mexico
Producing (100%) Southern BusinessProduction (Koz) 48.4P&P (Moz) 0.1M&I (Moz) 0.1
Finland
Source: Company filings.Note: Production and Mineral Reserves and Mineral Resources as of December 31, 2017.1. LaRonde mineral reserves and mineral resources are inclusive of LaRonde Zone 5.2. Totals are indicative of total producing, developing and exploration assets.
Total2Production (Koz) 1,714P&P (Moz) 20.6M&I (Moz) 16.0
Producing MineDevelopment Project
AGNICO EAGLE | RAYMOND JAMES 39TH ANNUAL INSTITUTIONAL INVESTORS CONFERENCE | 27
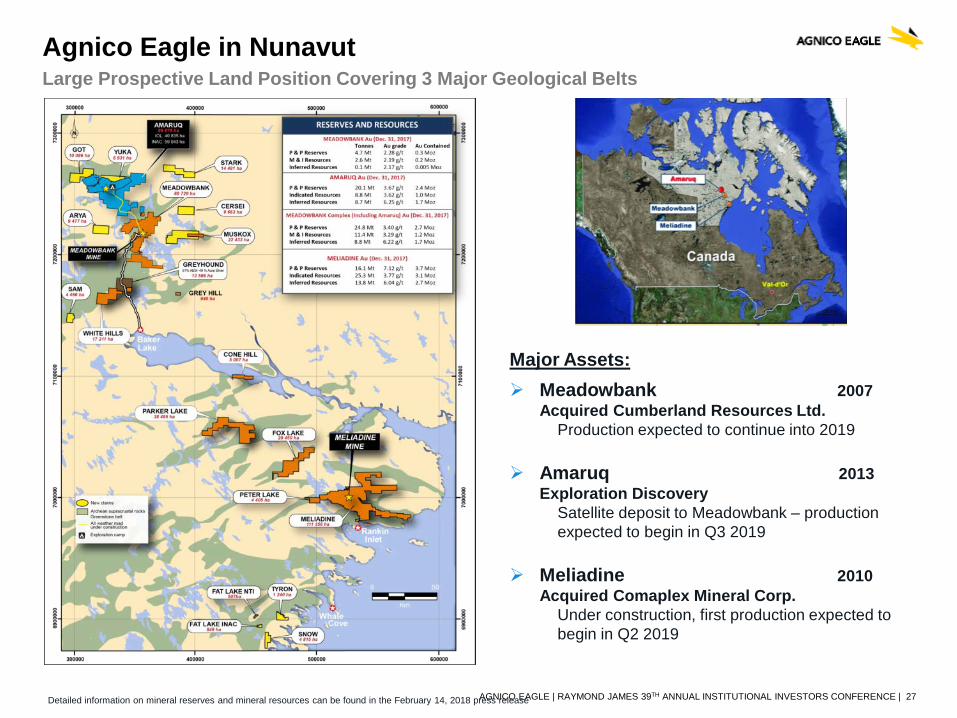
Agnico Eagle in NunavutLarge Prospective Land Position Covering 3 Major Geological Belts
Major Assets: Meadowbank 2007
Acquired Cumberland Resources Ltd.Production expected to continue into 2019
Amaruq 2013 Exploration Discovery
Satellite deposit to Meadowbank – production expected to begin in Q3 2019
Meliadine 2010 Acquired Comaplex Mineral Corp.
Under construction, first production expected to begin in Q2 2019
Detailed information on mineral reserves and mineral resources can be found in the February 14, 2018 press release
AGNICO EAGLE | RAYMOND JAMES 39TH ANNUAL INSTITUTIONAL INVESTORS CONFERENCE | 28
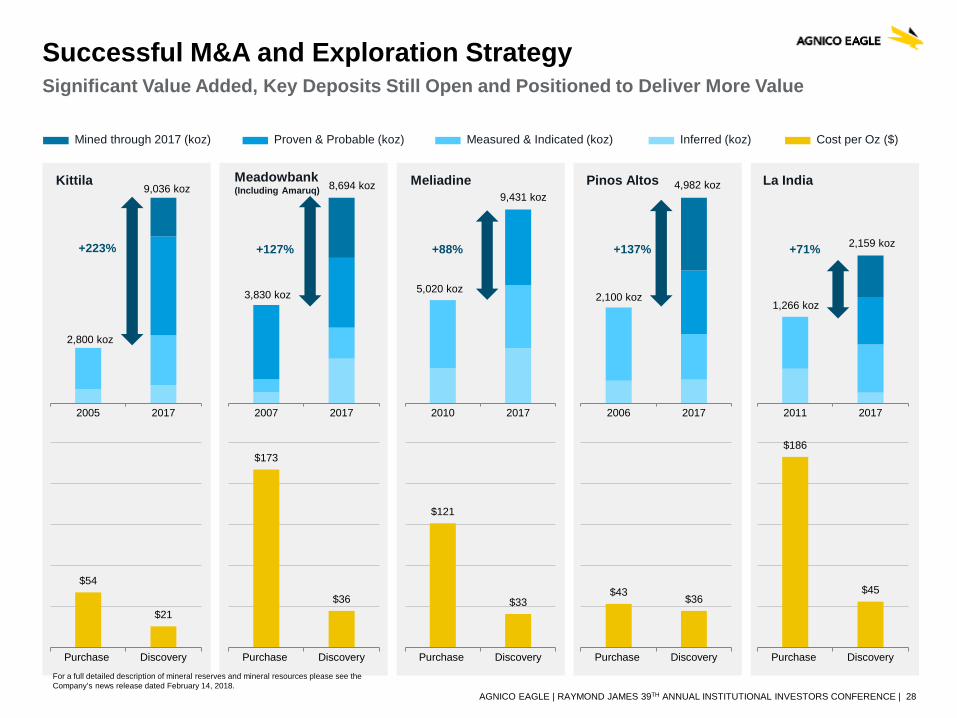
Successful M&A and Exploration Strategy Significant Value Added, Key Deposits Still Open and Positioned to Deliver More Value
For a full detailed description of mineral reserves and mineral resources please see theCompany’s news release dated February 14, 2018.
Kittila
2005 2017
Mined through 2017 (koz) Proven & Probable (koz) Measured & Indicated (koz) Inferred (koz) Cost per Oz ($)
$54
$21
Purchase Discovery
2,800 koz
9,036 koz
+223%
Meadowbank(Including Amaruq)
2007 2017
$173
$36
Purchase Discovery
3,830 koz
8,694 koz
+127%
Meliadine
2010 2017
$121
$33
Purchase Discovery
5,020 koz
9,431 koz
+88%
Pinos Altos
2006 2017
$43 $36
Purchase Discovery
2,100 koz
4,982 koz
+137%
La India
2011 2017
$186
$45
Purchase Discovery
1,266 koz
2,159 koz+71%
AGNICO EAGLE | RAYMOND JAMES 39TH ANNUAL INSTITUTIONAL INVESTORS CONFERENCE | 29
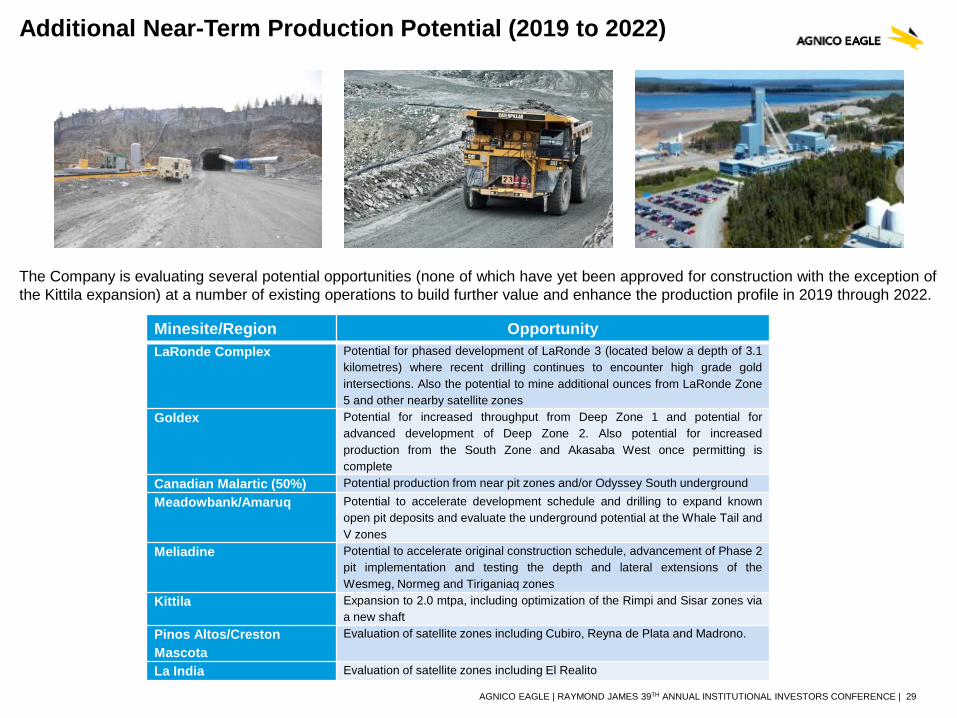
The Company is evaluating several potential opportunities (none of which have yet been approved for construction with the exception of the Kittila expansion) at a number of existing operations to build further value and enhance the production profile in 2019 through 2022.
Additional Near-Term Production Potential (2019 to 2022)
Minesite/Region OpportunityLaRonde Complex Potential for phased development of LaRonde 3 (located below a depth of 3.1
kilometres) where recent drilling continues to encounter high grade goldintersections. Also the potential to mine additional ounces from LaRonde Zone5 and other nearby satellite zones
Goldex Potential for increased throughput from Deep Zone 1 and potential foradvanced development of Deep Zone 2. Also potential for increasedproduction from the South Zone and Akasaba West once permitting iscomplete
Canadian Malartic (50%) Potential production from near pit zones and/or Odyssey South undergroundMeadowbank/Amaruq Potential to accelerate development schedule and drilling to expand known
open pit deposits and evaluate the underground potential at the Whale Tail andV zones
Meliadine Potential to accelerate original construction schedule, advancement of Phase 2pit implementation and testing the depth and lateral extensions of theWesmeg, Normeg and Tiriganiaq zones
Kittila Expansion to 2.0 mtpa, including optimization of the Rimpi and Sisar zones viaa new shaft
Pinos Altos/Creston Mascota
Evaluation of satellite zones including Cubiro, Reyna de Plata and Madrono.
La India Evaluation of satellite zones including El Realito
AGNICO EAGLE | RAYMOND JAMES 39TH ANNUAL INSTITUTIONAL INVESTORS CONFERENCE | 30
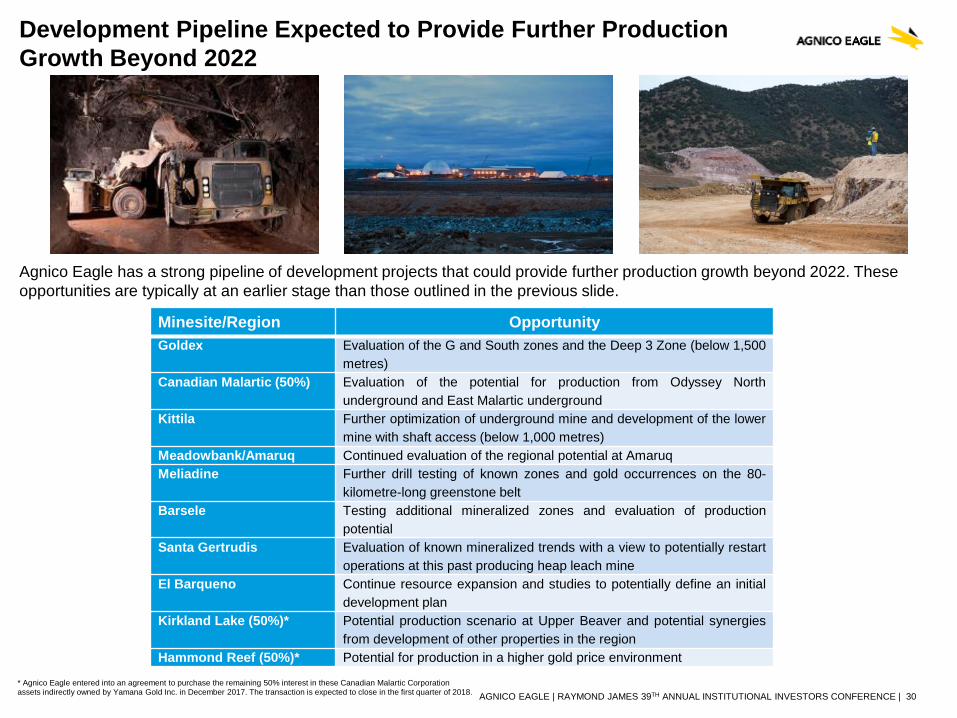
Agnico Eagle has a strong pipeline of development projects that could provide further production growth beyond 2022. These opportunities are typically at an earlier stage than those outlined in the previous slide.
Development Pipeline Expected to Provide Further Production Growth Beyond 2022
Minesite/Region OpportunityGoldex Evaluation of the G and South zones and the Deep 3 Zone (below 1,500
metres)Canadian Malartic (50%) Evaluation of the potential for production from Odyssey North
underground and East Malartic undergroundKittila Further optimization of underground mine and development of the lower
mine with shaft access (below 1,000 metres)Meadowbank/Amaruq Continued evaluation of the regional potential at AmaruqMeliadine Further drill testing of known zones and gold occurrences on the 80-
kilometre-long greenstone beltBarsele Testing additional mineralized zones and evaluation of production
potentialSanta Gertrudis Evaluation of known mineralized trends with a view to potentially restart
operations at this past producing heap leach mineEl Barqueno Continue resource expansion and studies to potentially define an initial
development planKirkland Lake (50%)* Potential production scenario at Upper Beaver and potential synergies
from development of other properties in the regionHammond Reef (50%)* Potential for production in a higher gold price environment
* Agnico Eagle entered into an agreement to purchase the remaining 50% interest in these Canadian Malartic Corporationassets indirectly owned by Yamana Gold Inc. in December 2017. The transaction is expected to close in the first quarter of 2018.
AGNICO EAGLE | RAYMOND JAMES 39TH ANNUAL INSTITUTIONAL INVESTORS CONFERENCE | 31
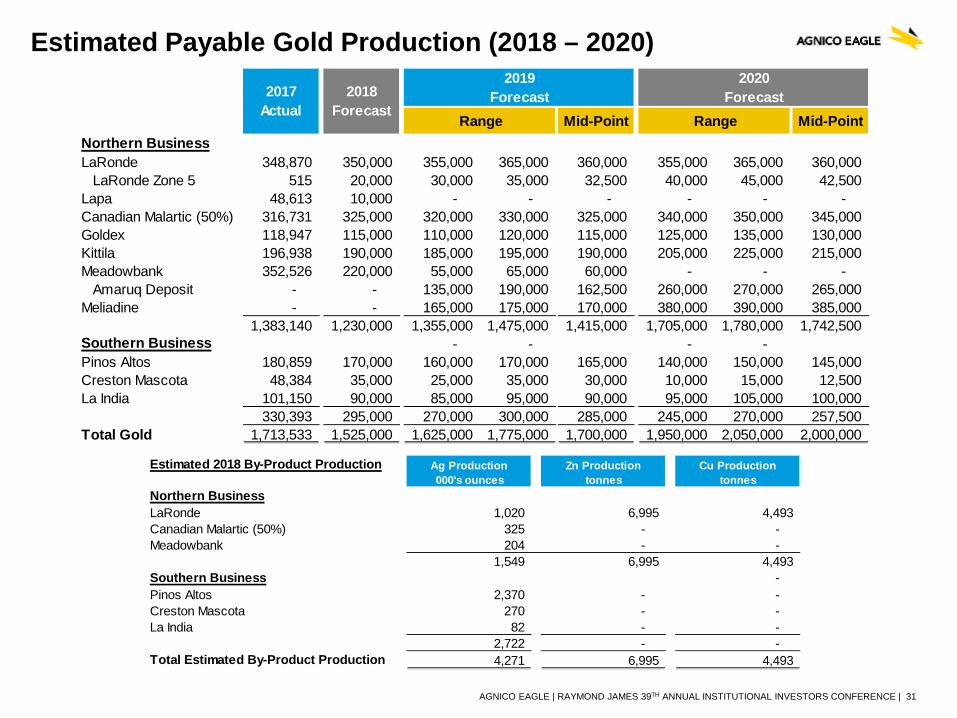
Estimated 2018 By-Product Production Ag Production Zn Production Cu Production000's ounces tonnes tonnes
Northern BusinessLaRonde 1,020 6,995 4,493 Canadian Malartic (50%) 325 - - Meadowbank 204 - -
1,549 6,995 4,493 Southern Business - Pinos Altos 2,370 - - Creston Mascota 270 - - La India 82 - -
2,722 - - Total Estimated By-Product Production 4,271 6,995 4,493
Estimated Payable Gold Production (2018 – 2020)2019 2020
Forecast ForecastRange Mid-Point Range Mid-Point
Northern BusinessLaRonde 348,870 350,000 355,000 365,000 360,000 355,000 365,000 360,000
LaRonde Zone 5 515 20,000 30,000 35,000 32,500 40,000 45,000 42,500 Lapa 48,613 10,000 - - - - - - Canadian Malartic (50%) 316,731 325,000 320,000 330,000 325,000 340,000 350,000 345,000 Goldex 118,947 115,000 110,000 120,000 115,000 125,000 135,000 130,000 Kittila 196,938 190,000 185,000 195,000 190,000 205,000 225,000 215,000 Meadowbank 352,526 220,000 55,000 65,000 60,000 - - -
Amaruq Deposit - - 135,000 190,000 162,500 260,000 270,000 265,000 Meliadine - - 165,000 175,000 170,000 380,000 390,000 385,000
1,383,140 1,230,000 1,355,000 1,475,000 1,415,000 1,705,000 1,780,000 1,742,500 Southern Business - - - - Pinos Altos 180,859 170,000 160,000 170,000 165,000 140,000 150,000 145,000 Creston Mascota 48,384 35,000 25,000 35,000 30,000 10,000 15,000 12,500 La India 101,150 90,000 85,000 95,000 90,000 95,000 105,000 100,000
330,393 295,000 270,000 300,000 285,000 245,000 270,000 257,500 Total Gold 1,713,533 1,525,000 1,625,000 1,775,000 1,700,000 1,950,000 2,050,000 2,000,000
2017 Actual
2018Forecast
AGNICO EAGLE | RAYMOND JAMES 39TH ANNUAL INSTITUTIONAL INVESTORS CONFERENCE | 32
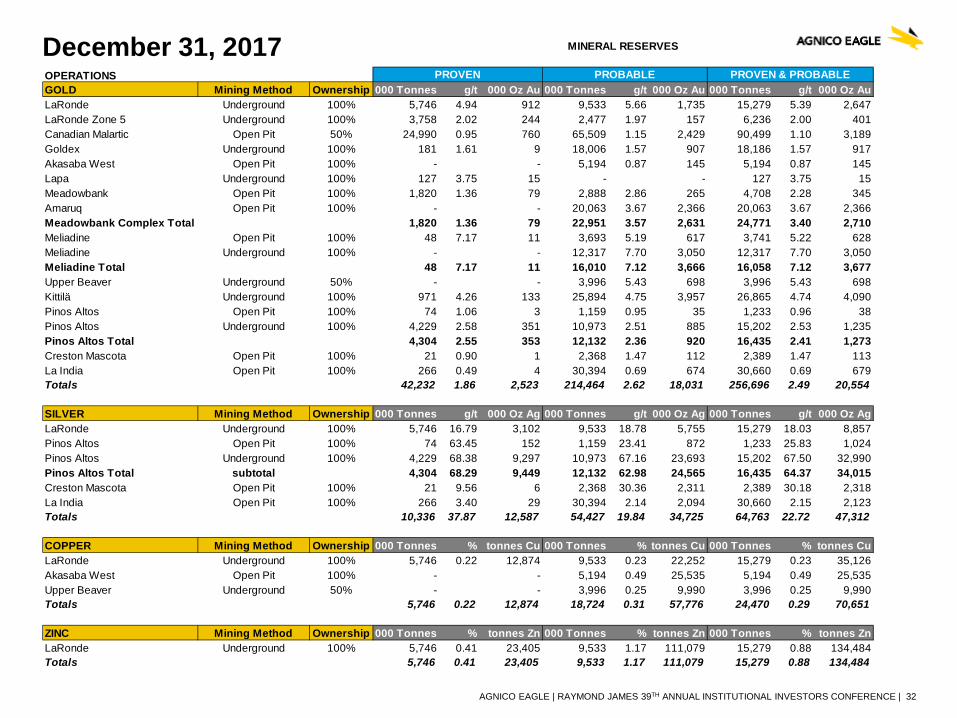
December 31, 2017 OPERATIONSGOLD Mining Method Ownership 000 Tonnes g/t 000 Oz Au 000 Tonnes g/t 000 Oz Au 000 Tonnes g/t 000 Oz AuLaRonde Underground 100% 5,746 4.94 912 9,533 5.66 1,735 15,279 5.39 2,647LaRonde Zone 5 Underground 100% 3,758 2.02 244 2,477 1.97 157 6,236 2.00 401Canadian Malartic Open Pit 50% 24,990 0.95 760 65,509 1.15 2,429 90,499 1.10 3,189Goldex Underground 100% 181 1.61 9 18,006 1.57 907 18,186 1.57 917Akasaba West Open Pit 100% - - 5,194 0.87 145 5,194 0.87 145Lapa Underground 100% 127 3.75 15 - - 127 3.75 15Meadowbank Open Pit 100% 1,820 1.36 79 2,888 2.86 265 4,708 2.28 345Amaruq Open Pit 100% - - 20,063 3.67 2,366 20,063 3.67 2,366Meadowbank Complex Total 1,820 1.36 79 22,951 3.57 2,631 24,771 3.40 2,710Meliadine Open Pit 100% 48 7.17 11 3,693 5.19 617 3,741 5.22 628Meliadine Underground 100% - - 12,317 7.70 3,050 12,317 7.70 3,050Meliadine Total 48 7.17 11 16,010 7.12 3,666 16,058 7.12 3,677Upper Beaver Underground 50% - - 3,996 5.43 698 3,996 5.43 698Kittilä Underground 100% 971 4.26 133 25,894 4.75 3,957 26,865 4.74 4,090Pinos Altos Open Pit 100% 74 1.06 3 1,159 0.95 35 1,233 0.96 38Pinos Altos Underground 100% 4,229 2.58 351 10,973 2.51 885 15,202 2.53 1,235Pinos Altos Total 4,304 2.55 353 12,132 2.36 920 16,435 2.41 1,273Creston Mascota Open Pit 100% 21 0.90 1 2,368 1.47 112 2,389 1.47 113La India Open Pit 100% 266 0.49 4 30,394 0.69 674 30,660 0.69 679Totals 42,232 1.86 2,523 214,464 2.62 18,031 256,696 2.49 20,554
SILVER Mining Method Ownership 000 Tonnes g/t 000 Oz Ag 000 Tonnes g/t 000 Oz Ag 000 Tonnes g/t 000 Oz AgLaRonde Underground 100% 5,746 16.79 3,102 9,533 18.78 5,755 15,279 18.03 8,857Pinos Altos Open Pit 100% 74 63.45 152 1,159 23.41 872 1,233 25.83 1,024Pinos Altos Underground 100% 4,229 68.38 9,297 10,973 67.16 23,693 15,202 67.50 32,990Pinos Altos Total subtotal 4,304 68.29 9,449 12,132 62.98 24,565 16,435 64.37 34,015Creston Mascota Open Pit 100% 21 9.56 6 2,368 30.36 2,311 2,389 30.18 2,318La India Open Pit 100% 266 3.40 29 30,394 2.14 2,094 30,660 2.15 2,123Totals 10,336 37.87 12,587 54,427 19.84 34,725 64,763 22.72 47,312
COPPER Mining Method Ownership 000 Tonnes % tonnes Cu 000 Tonnes % tonnes Cu 000 Tonnes % tonnes CuLaRonde Underground 100% 5,746 0.22 12,874 9,533 0.23 22,252 15,279 0.23 35,126Akasaba West Open Pit 100% - - 5,194 0.49 25,535 5,194 0.49 25,535Upper Beaver Underground 50% - - 3,996 0.25 9,990 3,996 0.25 9,990Totals 5,746 0.22 12,874 18,724 0.31 57,776 24,470 0.29 70,651
ZINC Mining Method Ownership 000 Tonnes % tonnes Zn 000 Tonnes % tonnes Zn 000 Tonnes % tonnes ZnLaRonde Underground 100% 5,746 0.41 23,405 9,533 1.17 111,079 15,279 0.88 134,484Totals 5,746 0.41 23,405 9,533 1.17 111,079 15,279 0.88 134,484
MINERAL RESERVES
PROVEN PROBABLE PROVEN & PROBABLE
AGNICO EAGLE | RAYMOND JAMES 39TH ANNUAL INSTITUTIONAL INVESTORS CONFERENCE | 33
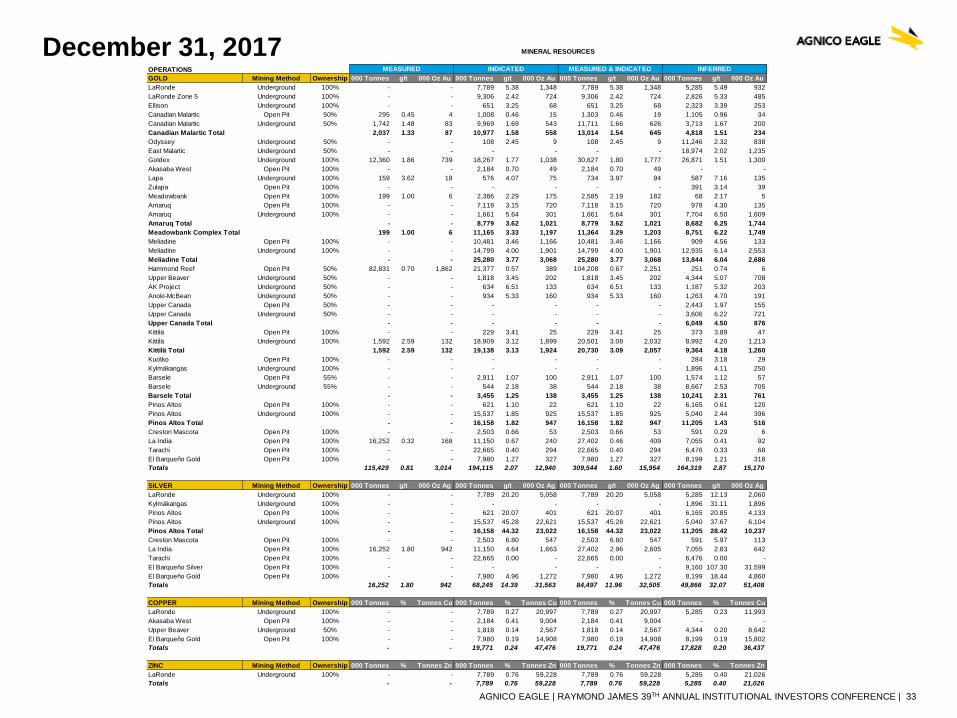
December 31, 2017OPERATIONSGOLD Mining Method Ownership 000 Tonnes g/t 000 Oz Au 000 Tonnes g/t 000 Oz Au 000 Tonnes g/t 000 Oz Au 000 Tonnes g/t 000 Oz AuLaRonde Underground 100% - - 7,789 5.38 1,348 7,789 5.38 1,348 5,285 5.49 932LaRonde Zone 5 Underground 100% - - 9,306 2.42 724 9,306 2.42 724 2,826 5.33 485Ellison Underground 100% - - 651 3.25 68 651 3.25 68 2,323 3.39 253Canadian Malartic Open Pit 50% 295 0.45 4 1,008 0.46 15 1,303 0.46 19 1,105 0.96 34Canadian Malartic Underground 50% 1,742 1.48 83 9,969 1.69 543 11,711 1.66 626 3,713 1.67 200Canadian Malartic Total 2,037 1.33 87 10,977 1.58 558 13,014 1.54 645 4,818 1.51 234Odyssey Underground 50% - - 108 2.45 9 108 2.45 9 11,246 2.32 838East Malartic Underground 50% - - - - - - 18,974 2.02 1,235Goldex Underground 100% 12,360 1.86 739 18,267 1.77 1,038 30,627 1.80 1,777 26,871 1.51 1,300Akasaba West Open Pit 100% - - 2,184 0.70 49 2,184 0.70 49 - -Lapa Underground 100% 159 3.62 18 576 4.07 75 734 3.97 94 587 7.16 135Zulapa Open Pit 100% - - - - - - 391 3.14 39Meadowbank Open Pit 100% 199 1.00 6 2,386 2.29 175 2,585 2.19 182 68 2.17 5Amaruq Open Pit 100% - - 7,118 3.15 720 7,118 3.15 720 978 4.30 135Amaruq Underground 100% - - 1,661 5.64 301 1,661 5.64 301 7,704 6.50 1,609Amaruq Total - - 8,779 3.62 1,021 8,779 3.62 1,021 8,682 6.25 1,744Meadowbank Complex Total 199 1.00 6 11,165 3.33 1,197 11,364 3.29 1,203 8,751 6.22 1,749Meliadine Open Pit 100% - - 10,481 3.46 1,166 10,481 3.46 1,166 909 4.56 133Meliadine Underground 100% - - 14,799 4.00 1,901 14,799 4.00 1,901 12,935 6.14 2,553Meliadine Total - - 25,280 3.77 3,068 25,280 3.77 3,068 13,844 6.04 2,686Hammond Reef Open Pit 50% 82,831 0.70 1,862 21,377 0.57 389 104,208 0.67 2,251 251 0.74 6Upper Beaver Underground 50% - - 1,818 3.45 202 1,818 3.45 202 4,344 5.07 708AK Project Underground 50% - - 634 6.51 133 634 6.51 133 1,187 5.32 203Anoki-McBean Underground 50% - - 934 5.33 160 934 5.33 160 1,263 4.70 191Upper Canada Open Pit 50% - - - - - - 2,443 1.97 155Upper Canada Underground 50% - - - - - - 3,606 6.22 721Upper Canada Total - - - - - - 6,049 4.50 876Kittilä Open Pit 100% - - 229 3.41 25 229 3.41 25 373 3.89 47Kittilä Underground 100% 1,592 2.59 132 18,909 3.12 1,899 20,501 3.08 2,032 8,992 4.20 1,213Kittilä Total 1,592 2.59 132 19,138 3.13 1,924 20,730 3.09 2,057 9,364 4.18 1,260Kuotko Open Pit 100% - - - - - - 284 3.18 29Kylmäkangas Underground 100% - - - - - - 1,896 4.11 250Barsele Open Pit 55% - - 2,911 1.07 100 2,911 1.07 100 1,574 1.12 57Barsele Underground 55% - - 544 2.18 38 544 2.18 38 8,667 2.53 705Barsele Total - - 3,455 1.25 138 3,455 1.25 138 10,241 2.31 761Pinos Altos Open Pit 100% - - 621 1.10 22 621 1.10 22 6,165 0.61 120Pinos Altos Underground 100% - - 15,537 1.85 925 15,537 1.85 925 5,040 2.44 396Pinos Altos Total - - 16,158 1.82 947 16,158 1.82 947 11,205 1.43 516Creston Mascota Open Pit 100% - - 2,503 0.66 53 2,503 0.66 53 591 0.29 6La India Open Pit 100% 16,252 0.32 168 11,150 0.67 240 27,402 0.46 409 7,055 0.41 92Tarachi Open Pit 100% - - 22,665 0.40 294 22,665 0.40 294 6,476 0.33 68El Barqueño Gold Open Pit 100% - - 7,980 1.27 327 7,980 1.27 327 8,199 1.21 318Totals 115,429 0.81 3,014 194,115 2.07 12,940 309,544 1.60 15,954 164,319 2.87 15,170
SILVER Mining Method Ownership 000 Tonnes g/t 000 Oz Ag 000 Tonnes g/t 000 Oz Ag 000 Tonnes g/t 000 Oz Ag 000 Tonnes g/t 000 Oz AgLaRonde Underground 100% - - 7,789 20.20 5,058 7,789 20.20 5,058 5,285 12.13 2,060Kylmäkangas Underground 100% - - - - - - 1,896 31.11 1,896Pinos Altos Open Pit 100% - - 621 20.07 401 621 20.07 401 6,165 20.85 4,133Pinos Altos Underground 100% - - 15,537 45.28 22,621 15,537 45.28 22,621 5,040 37.67 6,104Pinos Altos Total - - 16,158 44.32 23,022 16,158 44.32 23,022 11,205 28.42 10,237Creston Mascota Open Pit 100% - - 2,503 6.80 547 2,503 6.80 547 591 5.97 113La India Open Pit 100% 16,252 1.80 942 11,150 4.64 1,663 27,402 2.96 2,605 7,055 2.83 642Tarachi Open Pit 100% - - 22,665 0.00 - 22,665 0.00 - 6,476 0.00 -El Barqueño Silver Open Pit 100% - - - - - - 9,160 107.30 31,599El Barqueño Gold Open Pit 100% - - 7,980 4.96 1,272 7,980 4.96 1,272 8,199 18.44 4,860Totals 16,252 1.80 942 68,245 14.39 31,563 84,497 11.96 32,505 49,866 32.07 51,408
COPPER Mining Method Ownership 000 Tonnes % Tonnes Cu 000 Tonnes % Tonnes Cu 000 Tonnes % Tonnes Cu 000 Tonnes % Tonnes CuLaRonde Underground 100% - - 7,789 0.27 20,997 7,789 0.27 20,997 5,285 0.23 11,993Akasaba West Open Pit 100% - - 2,184 0.41 9,004 2,184 0.41 9,004 - -Upper Beaver Underground 50% - - 1,818 0.14 2,567 1,818 0.14 2,567 4,344 0.20 8,642El Barqueño Gold Open Pit 100% - - 7,980 0.19 14,908 7,980 0.19 14,908 8,199 0.19 15,802Totals - - 19,771 0.24 47,476 19,771 0.24 47,476 17,828 0.20 36,437
ZINC Mining Method Ownership 000 Tonnes % Tonnes Zn 000 Tonnes % Tonnes Zn 000 Tonnes % Tonnes Zn 000 Tonnes % Tonnes ZnLaRonde Underground 100% - - 7,789 0.76 59,228 7,789 0.76 59,228 5,285 0.40 21,026Totals - - 7,789 0.76 59,228 7,789 0.76 59,228 5,285 0.40 21,026
MINERAL RESOURCES
MEASURED INDICATED MEASURED & INDICATED INFERRED
AGNICO EAGLE | RAYMOND JAMES 39TH ANNUAL INSTITUTIONAL INVESTORS CONFERENCE | 34
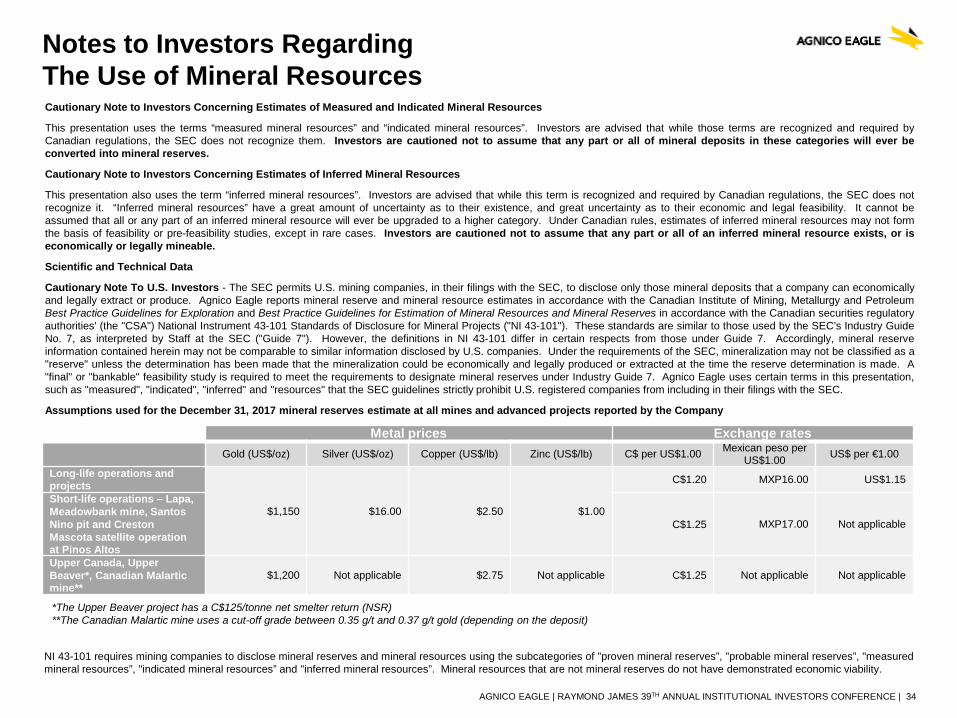
Notes to Investors Regarding The Use of Mineral ResourcesCautionary Note to Investors Concerning Estimates of Measured and Indicated Mineral Resources
This presentation uses the terms “measured mineral resources” and “indicated mineral resources”. Investors are advised that while those terms are recognized and required byCanadian regulations, the SEC does not recognize them. Investors are cautioned not to assume that any part or all of mineral deposits in these categories will ever beconverted into mineral reserves.
Cautionary Note to Investors Concerning Estimates of Inferred Mineral Resources
This presentation also uses the term “inferred mineral resources”. Investors are advised that while this term is recognized and required by Canadian regulations, the SEC does notrecognize it. “Inferred mineral resources” have a great amount of uncertainty as to their existence, and great uncertainty as to their economic and legal feasibility. It cannot beassumed that all or any part of an inferred mineral resource will ever be upgraded to a higher category. Under Canadian rules, estimates of inferred mineral resources may not formthe basis of feasibility or pre-feasibility studies, except in rare cases. Investors are cautioned not to assume that any part or all of an inferred mineral resource exists, or iseconomically or legally mineable.
Scientific and Technical Data
Cautionary Note To U.S. Investors - The SEC permits U.S. mining companies, in their filings with the SEC, to disclose only those mineral deposits that a company can economicallyand legally extract or produce. Agnico Eagle reports mineral reserve and mineral resource estimates in accordance with the Canadian Institute of Mining, Metallurgy and PetroleumBest Practice Guidelines for Exploration and Best Practice Guidelines for Estimation of Mineral Resources and Mineral Reserves in accordance with the Canadian securities regulatoryauthorities' (the "CSA") National Instrument 43-101 Standards of Disclosure for Mineral Projects ("NI 43-101"). These standards are similar to those used by the SEC’s Industry GuideNo. 7, as interpreted by Staff at the SEC ("Guide 7"). However, the definitions in NI 43-101 differ in certain respects from those under Guide 7. Accordingly, mineral reserveinformation contained herein may not be comparable to similar information disclosed by U.S. companies. Under the requirements of the SEC, mineralization may not be classified as a"reserve" unless the determination has been made that the mineralization could be economically and legally produced or extracted at the time the reserve determination is made. A"final" or "bankable" feasibility study is required to meet the requirements to designate mineral reserves under Industry Guide 7. Agnico Eagle uses certain terms in this presentation,such as "measured", "indicated", "inferred" and "resources" that the SEC guidelines strictly prohibit U.S. registered companies from including in their filings with the SEC.
Assumptions used for the December 31, 2017 mineral reserves estimate at all mines and advanced projects reported by the Company
Metal prices Exchange ratesGold (US$/oz) Silver (US$/oz) Copper (US$/lb) Zinc (US$/lb) C$ per US$1.00 Mexican peso per
US$1.00 US$ per €1.00
Long-life operations and projects
$1,150 $16.00 $2.50 $1.00
C$1.20 MXP16.00 US$1.15
Short-life operations – Lapa, Meadowbank mine, Santos Nino pit and Creston Mascota satellite operation at Pinos Altos
C$1.25 MXP17.00 Not applicable
Upper Canada, Upper Beaver*, Canadian Malarticmine**
$1,200 Not applicable $2.75 Not applicable C$1.25 Not applicable Not applicable
*The Upper Beaver project has a C$125/tonne net smelter return (NSR)**The Canadian Malartic mine uses a cut-off grade between 0.35 g/t and 0.37 g/t gold (depending on the deposit)
NI 43-101 requires mining companies to disclose mineral reserves and mineral resources using the subcategories of "proven mineral reserves”, "probable mineral reserves”, "measuredmineral resources”, "indicated mineral resources” and "inferred mineral resources”. Mineral resources that are not mineral reserves do not have demonstrated economic viability.
AGNICO EAGLE | RAYMOND JAMES 39TH ANNUAL INSTITUTIONAL INVESTORS CONFERENCE | 35
Notes to Investors Regarding The Use of Mineral ResourcesA mineral reserve is the economically mineable part of a measured and/or indicated mineral resource. It includes diluting materials and allowances for losses, which may occur whenthe material is mined or extracted and is defined by studies at pre-feasibility or feasibility level as appropriate that include application of modifying factors. Such studies demonstratethat, at the time of reporting, extraction could reasonably be justified.
Modifying factors are considerations used to convert mineral resources to mineral reserves. These include, but are not restricted to, mining, processing, metallurgical, infrastructure,economic, marketing, legal, environmental, social and governmental factors.
A proven mineral reserve is the economically mineable part of a measured mineral resource. A proven mineral reserve implies a high degree of confidence in the modifying factors. Aprobable mineral reserve is the economically mineable part of an indicated and, in some circumstances, a measured mineral resource. The confidence in the modifying factorsapplying to a probable mineral reserve is lower than that applying to a proven mineral reserve.
A mineral resource is a concentration or occurrence of solid material of economic interest in or on the Earth's crust in such form, grade or quality and quantity that there are reasonableprospects for eventual economic extraction. The location, quantity, grade or quality, continuity and other geological characteristics of a mineral resource are known, estimated orinterpreted from specific geological evidence and knowledge, including sampling.
A measured mineral resource is that part of a mineral resource for which quantity, grade or quality, densities, shape and physical characteristics are estimated with confidencesufficient to allow the application of modifying factors to support detailed mine planning and final evaluation of the economic viability of the deposit. Geological evidence is derived fromdetailed and reliable exploration, sampling and testing and is sufficient to confirm geological and grade or quality continuity between points of observation. An indicated mineralresource is that part of a mineral resource for which quantity, grade or quality, densities, shape and physical characteristics are estimated with sufficient confidence to allow theapplication of modifying factors in sufficient detail to support mine planning and evaluation of the economic viability of the deposit. Geological evidence is derived from adequatelydetailed and reliable exploration, sampling and testing and is sufficient to assume geological and grade or quality continuity between points of observation. An inferred mineralresource is that part of a mineral resource for which quantity and grade or quality are estimated on the basis of limited geological evidence and sampling. Geological evidence issufficient to imply but not verify geological and grade or quality continuity.
Investors are cautioned not to assume that part or all of an inferred mineral resource exists, or is economically or legally mineable.
A feasibility study is a comprehensive technical and economic study of the selected development option for a mineral project that includes appropriately detailed assessments ofapplicable modifying factors together with any other relevant operational factors and detailed financial analysis that are necessary to demonstrate, at the time of reporting, thatextraction is reasonably justified (economically mineable). The results of the study may reasonably serve as the basis for a final decision by a proponent or financial institution toproceed with, or finance, the development of the project. The confidence level of the study will be higher than that of a Pre-Feasibility Study.
The effective date for all of the Company's mineral resource and mineral reserve estimates in this presentation is December 31, 2017. Additional information about each of the mineralprojects that is required by NI 43-101, sections 3.2 and 3.3 and paragraphs 3.4 (a), (c) and (d) can be found in the Technical Reports filed by Agnico Eagle, which may be found atwww.sedar.com. Other important operating information can be found in the Company's AIF and Form 40-F.
The scientific and technical information relating to Agnico Eagle’s mineral reserves and mineral resources contained herein (other than the Canadian Malartic mine) has been approvedby Daniel Doucet, Eng., Senior Corporate Director, Reserve Development; and relating to mineral reserves and mineral resources at the Canadian Malartic mine contained herein hasbeen approved by Donald Gervais, P.Geo., Director of Technical Services at Canadian Malartic Corporation. Each of them is a "Qualified Person" for the purposes of NI 43-101.