raymond james 41st annual institutional investors …
TRANSCRIPT

Woody Woodall, CFO
March 2, 2020
RAYMOND JAMES 41ST ANNUAL INSTITUTIONAL INVESTORS CONFERENCE

2
DISCLOSURES
Forward-looking StatementsOur discussions today, including this presentation and any comments made by
management, contain “forward-looking statements” within the meaning of the U.S. federal
securities laws. Any statements that refer to future events or circumstances, including our
future strategies or results, or that are not historical facts, are forward-looking statements.
Actual results could differ materially from those projected in forward-looking statements due
to a variety of factors, including the risks and uncertainties set forth in our earnings press
release dated February 13, 2020, our annual report on Form 10-K for 2019 and our other
filings with the SEC. We undertake no obligation to update or revise any forward-looking
statements. Please see the Appendix for additional details on forward-looking statements.
Non-GAAP MeasuresThis presentation will reference certain non-GAAP financial information. For a description
and reconciliation of non-GAAP measures presented in this document, please see the
Appendix attached to this presentation or visit the Investor Relations section of the FIS
website at www.fisglobal.com.

3
FIS
• #1 Global Fintech Provider1
• Leader in Global eCommerce and
Integrated Payments
• Pioneer in Enterprise Bank Software and
Digital Banking
• End-to-End Financial Capabilities in
Capital Markets
• Pivot to Growth strategy accelerates
organic revenue growth with multiple
synergy opportunities
Invest
Pay
Bank
(1) Based on 2018 IDC Fintech Rankings.
ADVANCING THE WAY THE WORLD
PAYS, BANKS AND INVESTS
4
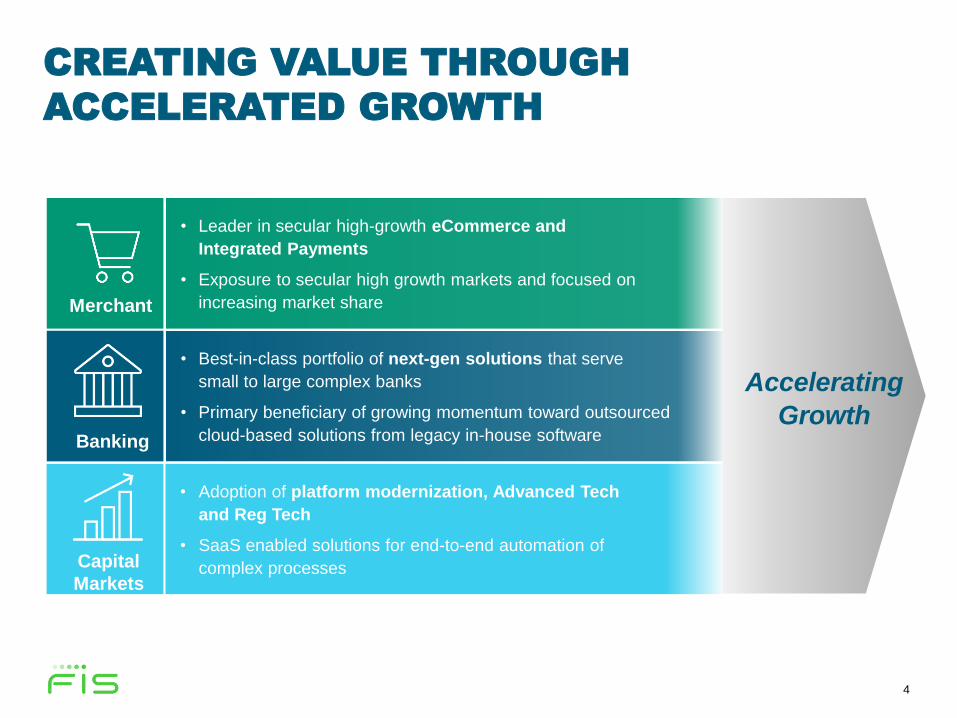
• Best-in-class portfolio of next-gen solutions that serve
small to large complex banks
• Primary beneficiary of growing momentum toward outsourced
cloud-based solutions from legacy in-house software
• Adoption of platform modernization, Advanced Tech
and Reg Tech
• SaaS enabled solutions for end-to-end automation of
complex processes
• Leader in secular high-growth eCommerce and
Integrated Payments
• Exposure to secular high growth markets and focused on
increasing market share
CREATING VALUE THROUGH
ACCELERATED GROWTH
Accelerating
Growth
Merchant
Banking
Capital
Markets

5
POWERFUL CLIENT VALUE PROPOSITION
ACCESS TO
INNOVATION
DATA AND
INSIGHTS
WORLD-CLASS
SCALE
Client
outcomesCreate innovative, secure,
enterprise-grade solutions
and position businesses
for success today and
in the future
Embrace our unique
approach to solving
business challenges
globally
Leverage our global reach
at a local level to drive
efficiencies at scale
FIS
solutionsSeamless experiences for
our clients and their
customers
Create new intersections
between markets,
technology and insights
that our clients are using
to drive growth and lower
costs
Connect the global
financial ecosystem to
enable clients’ access to
new products and enter
into new markets
CREATING SEAMLESS END-TO-END EXPERIENCES
ACROSS THE GLOBAL FINANCIAL ECOSYSTEM

6
COMPELLING FINANCIAL PROFILE
• Expanding revenue conversion into free cash flow (FCF)
• Near-term capital allocation priority to de-lever
• Potential for combined free cash flow to nearly double exiting 2022
• Continuous focus on achieving financial commitments
• Significantly lower interest rates achieved through superior execution
• One-to-many model and superior cost structure
• Acquisition-related cost synergies further increase operating
leverage and margin expansion
• Resilient business with high visibility and predictability
• Diverse customer base with long-term contracts
• Multiple secular opportunities to accelerate organic growth
High-Quality
Recurring
Revenue
Expanding
Margins
Sustainable
Earnings Growth
Strong Cash
Generation
For a description of non-GAAP measures and a reconciliation of GAAP to non-GAAP measures, see Appendix.

7
$2,984 $3,133
$4,204
34%
37%
41%
~44%
0.2
0.25
0.3
0.35
0.4
0.45
0.5
0.55
0.6
0.65
0.7
$-
$1,000
$2,000
$3,000
$4,000
$5,000
$6,000
$7,000
2017 2018 2019 2020 E
(1) 2018 revenue reflects the reported full year number, inclusive of divestitures.
(2) Organic growth adjusts for the impact of acquisitions and divestitures and excludes foreign currency exchange rate fluctuations.
For a description of non-GAAP measures and a reconciliation of GAAP to non-GAAP measures, see Appendix.
$8,668 $8,423
$10,333
2%
3%
6%
6% - 7%
0%
1%
2%
3%
4%
5%
6%
7%
8%
9%
10%
$-
$2,000
$4,000
$6,000
$8,000
$10,000
$12,000
$14,000
2017 2018 2019 2020 E
SUPERIOR FINANCIAL PERFORMANCE
REVENUE1 ADJUSTED EBITDA
($ Millions)($ Millions)
Organic Growth(2) Adjusted EBITDA MarginRevenue Adjusted EBITDA

8
INTEGRATION AHEAD OF SCHEDULE($ millions, annual run-rate achievement)
$465M Achieved
in 4Q ‘19
Close
$200M
$400M
Increasing YE ‘20
Target to $600M$600M
$465M
Increasing
Total YE ‘22
Goal to $675M
Cost Synergy Update1
• Achieved $465 million in annual run-rate cost
synergy exiting 4Q19, primarily through interest
expense savings and elimination of duplicate
corporate costs
• Accelerating integration efforts to enable focus
on revenue growth and strategic M&A
(1) Synergies are shown on an annual run-rate basis with future targets defined as expectations for achievement exiting 2020 and 2022, respectively.
Revenue Synergy Update1
$80M Achieved
in 4Q ‘19
Close
Increasing YE ‘20
Target to $200M
Increasing
Total YE ‘22
Goal to $550M
• Achieved $80 million in annual run-rate
revenue synergy exiting 4Q19, primarily due
to ramping benefit from debit card routing
• Increasing future targets to reflect multiple
cross-selling opportunities that combine
unique capabilities in Merchant and Banking
9
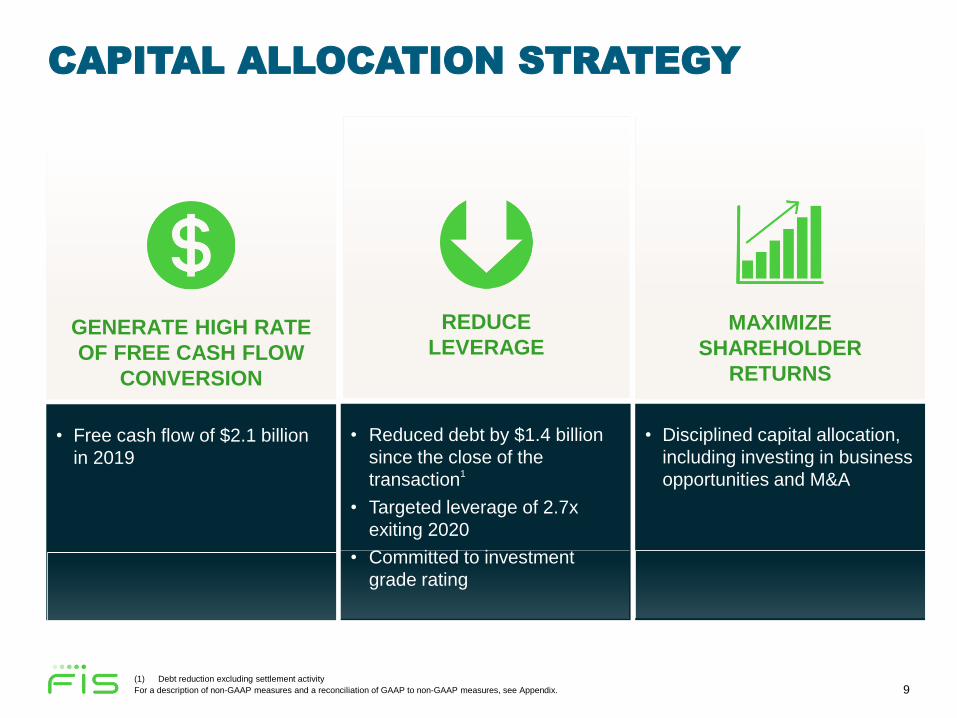
MAXIMIZE
SHAREHOLDER
RETURNS
REDUCE
LEVERAGEGENERATE HIGH RATE
OF FREE CASH FLOW
CONVERSION
• Free cash flow of $2.1 billion
in 2019
• Disciplined capital allocation,
including investing in business
opportunities and M&A
• Reduced debt by $1.4 billion
since the close of the
transaction1
• Targeted leverage of 2.7x
exiting 2020
• Committed to investment
grade rating
CAPITAL ALLOCATION STRATEGY
(1) Debt reduction excluding settlement activity
For a description of non-GAAP measures and a reconciliation of GAAP to non-GAAP measures, see Appendix.

10
2020 GUIDANCE
$ millions except per share data 1Q 2020 Guidance FY 2020 Guidance
Revenue $ 3,180 – $ 3,210 $ 13,550 – $ 13,675
Organic Revenue Growth 5% - 6% 6% - 7%
Adjusted EPS $ 1.30 – $ 1.34 $ 6.17 – $ 6.35
Adjusted EPS Growth 12% - 16% 10% - 13%
1Q 2020 Guidance Assumptions
• Immaterial F/X Impact to Revenue
• Depreciation and Amortization (excl. purchase
price amort): ~$985M
• Net Interest Expense: ~$310M
• Effective Tax Rate: ~16%
• FY Weighted Average Shares Outstanding: ~630M
FY 2020 Guidance Assumptions
For a description of non-GAAP measures and a reconciliation of GAAP to non-GAAP measures, see Appendix.
• Negative F/X Impact to Revenue: ~$10M
• Depreciation and Amortization (excl. purchase price
amort): ~$235M
• Net Interest Expense: ~$78M
• Effective Tax Rate: ~16%
• 1Q Weighted Average Shares Outstanding: ~625M

11
ACCELERATING GROWTH
STRATEGY
POWERINGTHE DIGITAL ECONOMY
POWERFUL CLIENT VALUE PROPOSITION
COMPELLINGFINANCIAL PROFILE
New wins and
revenue synergy
opportunities further
accelerating top-line
growth
Harnessing secular
growth tailwinds to
scale across
segments
Investing in
technology and
innovation to create
seamless client
experiences
Durable business
model created by
highly recurring
revenue streams
with low capital
intensity
COMPELLING INVESTMENT THESIS
For a description of non-GAAP measures and a reconciliation of GAAP to non-GAAP measures, see Appendix.

Q&A

13
APPENDIX

14
FORWARD-LOOKING STATEMENTS
This presentation and today’s webcast contain “forward-looking statements” within the meaning of the U.S. federal securities laws. Statements that
are not historical facts, including statements about anticipated financial outcomes, including any earnings guidance of the Company, projected
revenue or expense synergies, business and market conditions, outlook, foreign currency exchange rates, expected dividends and share
repurchases, the Company’s sales pipeline and anticipated profitability and growth, as well as other statements about our expectations, beliefs,
intentions, or strategies regarding the future, are forward-looking statements. These statements relate to future events and our future results, and
involve a number of risks and uncertainties. Forward-looking statements are based on management’s beliefs, as well as assumptions made by, and
information currently available to, management. Any statements that refer to beliefs, expectations, projections or other characterizations of future
events or circumstances and other statements that are not historical facts are forward-looking statements.
Actual results, performance or achievement could differ materially from those contained in these forward-looking statements. The risks and
uncertainties that forward-looking statements are subject to include the following, without limitation:
• the risk that the Worldpay transaction will not provide the expected benefits, or that we will not be able to achieve the cost or revenue synergies
anticipated;
• the risk that the integration of FIS and Worldpay will be more difficult, time-consuming or expensive than anticipated;
• the risk of customer loss or other business disruption in connection with the Worldpay transaction, or of the loss of key employees;
• the fact that unforeseen liabilities of FIS or Worldpay may exist;
• the risk that other acquired businesses will not be integrated successfully, or that the integration will be more costly or more time-consuming and
complex than anticipated;
• the risk that cost savings and other synergies anticipated to be realized from other acquisitions may not be fully realized or may take longer to
realize than expected;
• the risks of doing business internationally;
• changes in general economic, business and political conditions, including the possibility of intensified international hostilities, acts of terrorism,
pandemics, changes in either or both the United States and international lending, capital and financial markets, and currency fluctuations;
• the effect of legislative initiatives or proposals, statutory changes, governmental or other applicable regulations and/or changes in industry
requirements, including privacy and cybersecurity laws and regulations;
• the risks of reduction in revenue from the elimination of existing and potential customers due to consolidation in, or new laws or regulations
affecting, the banking, retail and financial services industries or due to financial failures or other setbacks suffered by firms in those industries;

15
FORWARD-LOOKING STATEMENTS
• changes in the growth rates of the markets for our solutions;
• failures to adapt our solutions to changes in technology or in the marketplace;
• internal or external security breaches of our systems, including those relating to unauthorized access, theft, corruption or loss of personal
information and computer viruses and other malware affecting our software or platforms, and the reactions of customers, card associations,
government regulators and others to any such events;
• the risk that implementation of software (including software updates) for customers or at customer locations or employee error in monitoring our
software and platforms may result in the corruption or loss of data or customer information, interruption of business operations, outages,
exposure to liability claims or loss of customers;
• the reaction of current and potential customers to communications from us or regulators regarding information security, risk management,
internal audit or other matters;
• competitive pressures on pricing related to the decreasing number of community banks in the U.S., the development of new disruptive
technologies competing with one or more of our solutions, increasing presence of international competitors in the U.S. market and the entry into
the market by global banks and global companies with respect to certain competitive solutions, each of which may have the impact of unbundling
individual solutions from a comprehensive suite of solutions we provide to many of our customers;
• the failure to innovate in order to keep up with new emerging technologies, which could impact our solutions and our ability to attract new, or
retain existing, customers;
• an operational or natural disaster at one of our major operations centers;
• failure to comply with applicable requirements of payment networks or changes in those requirements;
• fraud by merchants or bad actors; and
• other risks detailed in the “Risk Factors” and other sections of our Annual Report on Form 10-K for the fiscal year ended December 31, 2018, in
our quarterly reports on Form 10-Q and in our other filings with the Securities and Exchange Commission.
Other unknown or unpredictable factors also could have a material adverse effect on our business, financial condition, results of operations and
prospects. Accordingly, readers should not place undue reliance on these forward-looking statements. These forward-looking statements are
inherently subject to uncertainties, risks and changes in circumstances that are difficult to predict. Except as required by applicable law or
regulation, we do not undertake (and expressly disclaim) any obligation and do not intend to publicly update or review any of these forward-looking
statements, whether as a result of new information, future events or otherwise.

16
FIS USE OF NON-GAAP FINANCIAL INFORMATION
Generally Accepted Accounting Principles (GAAP) is the term used to refer to the standard framework of guidelines for financial accounting in the
United States. GAAP includes the standards, conventions, and rules accountants follow in recording and summarizing transactions and in the
preparation of financial statements. In addition to reporting financial results in accordance with GAAP, we have provided certain non-GAAP financial
measures.
These non-GAAP measures include adjusted revenue, constant currency revenue, organic revenue increase/decrease, EBITDA, adjusted EBITDA,
adjusted EBITDA margin, adjusted net earnings (including per share amounts), adjusted cash flows from operations and free cash flow. These non-
GAAP measures may be used in this release and/or in the attached supplemental financial information.
We believe these non-GAAP measures help investors better understand the underlying fundamentals of our business. As further described below,
the non-GAAP revenue and earnings measures presented eliminate items management believes are not indicative of FIS’ operating performance.
The constant currency and organic revenue increase/decrease measures adjust for the effects of exchange rate fluctuations, while organic revenue
increase/decrease also adjusts for acquisitions and divestitures, giving investors further insight into our performance. Finally, the non-GAAP cash
flow measures provide further information about the ability of our business to generate cash. For these reasons, management also uses these non-
GAAP measures in its assessment and management of FIS’ performance.
Adjusted revenue consists of revenue, increased to reverse the purchase accounting deferred revenue adjustment made upon the acquisition of
SunGard. The deferred revenue adjustment represents revenue that would have been recognized in the normal course of business by SunGard
under GAAP but was not recognized due to GAAP purchase accounting adjustments. The deferred revenue adjustment in purchase accounting was
made entirely in the Corporate and Other segment; reported GAAP results for the other operating segments are not affected by this adjustment and,
therefore, no adjusted revenue is presented for these segments.
Constant currency revenue represents (i) adjusted revenue, as defined above, in respect of the consolidated results and the Corporate and Other
segment and (ii) reported revenue in respect of the other operating segments, in each case excluding the impact of fluctuations in foreign currency
exchange rates in the current period.
Organic revenue growth is constant currency revenue, as defined above, for the current period compared to an adjusted revenue base for the prior
period, which is further adjusted to add pre-acquisition revenue of acquired businesses for a portion of the prior year matching the portion of the
current year for which the business was owned, and subtract pre-divestiture revenue for divested businesses for the portion of the prior year
matching the portion of the current year for which the business was not owned, for any acquisitions or divestitures by FIS.
EBITDA reflects earnings from continuing operations before interest, taxes, depreciation and amortization.

17
FIS USE OF NON-GAAP FINANCIAL INFORMATION
Adjusted EBITDA is EBITDA, as defined above, excluding certain costs and other transactions which management deems non-operational in
nature, the removal of which improves comparability of operating results across reporting periods. This measure is reported to the chief operating
decision maker for purposes of making decisions about allocating resources to the segments and assessing their performance. For this reason,
adjusted EBITDA, as it relates to our segments, is presented in conformity with Accounting Standards Codification 280, Segment Reporting, and is
excluded from the definition of non-GAAP financial measures under the Securities and Exchange Commission's Regulation G and Item 10(e) of
Regulation S-K.
Adjusted EBITDA margin reflects adjusted EBITDA divided by adjusted revenue.
Adjusted net earnings excludes the impact of certain costs and other transactions which management deems non-operational in nature, the removal
of which improves comparability of operating results across reporting periods. It also excludes the impact of acquisition-related purchase accounting
amortization and equity method investment earnings (loss), both of which are recurring.
Adjusted net earnings per diluted share, or Adjusted EPS, reflects adjusted net earnings from continuing operations divided by weighted average
diluted shares outstanding.
Adjusted cash flows from operations reflect net cash provided by operating activities adjusted for the net change in settlement assets and
obligations and exclude certain transactions that are closely associated with non-operating activities or are otherwise non-operational in nature and
not indicative of future operating cash flows.
Free cash flow reflects adjusted cash flows from operations less capital expenditures. Free cash flow does not represent our residual cash flow
available for discretionary expenditures, since we have mandatory debt service requirements and other non-discretionary expenditures that are not
deducted from the measure.
Any non-GAAP measures should be considered in context with the GAAP financial presentation and should not be considered in isolation or as a
substitute for GAAP measures. Further, FIS’ non-GAAP measures may be calculated differently from similarly titled measures of other companies.
Reconciliations of these non-GAAP measures to related GAAP measures, including footnotes describing the specific adjustments, are provided in
the attached schedules and in the Investor Relations section of the FIS website, www.fisglobal.com.

18
ORGANIC REVENUE GROWTH CALCULATION
($ millions, unaudited)
Amounts in tables may not sum or calculate due to rounding.
Capital
Merchant Banking Market
Solutions Solutions Solutions Consolidated
Revenue $ 1,116 $ 1,556 $ 669 $ 3,341
Currency translation adjustment 2 4 1 7
Constant currency (A) $ 1,118 $ 1,561 $ 670 $ 3,348
Capital
Merchant Banking Market
Solutions Solutions Solutions Consolidated
Adjusted Revenue $ 71 $ 1,474 $ 622 $ 2,167
M&A adjustment 949 19 - 968
Adjusted base (B) $ 1,020 $ 1,493 $ 622 $ 3,135
Organic revenue growth A / B 10% 5% 8% 7%
Three months ended December 31, 2019
Three months ended December 31, 2018

19
ORGANIC REVENUE GROWTH CALCULATION
($ millions, unaudited)
Amounts in tables may not sum or calculate due to rounding.
Capital
Merchant Banking Market Corporate
Solutions Solutions Solutions and Other Consolidated
Revenue $ 2,013 $ 5,873 $ 2,447 $ - $ 10,333
Currency translation adjustment 13 37 20 - 70
Constant currency (A) $ 2,025 $ 5,910 $ 2,467 $ - $ 10,403
Capital
Merchant Banking Market Corporate
Solutions Solutions Solutions and Other Consolidated
Revenue $ 276 $ 5,712 $ 2,391 $ 44 $ 8,423
Non-GAAP adjustments:
Acquisition deferred revenue adjustment - - - 4 4
Adjusted revenue $ 276 $ 5,712 $ 2,391 $ 48 $ 8,427
M&A adjustment 1,575 (112) (1) (48) 1,414
Adjusted base (B) $ 1,851 $ 5,600 $ 2,390 $ - $ 9,841
Organic revenue growth A / B 9% 6% 3% - 6%
Year ended December 31, 2019
Year ended December 31, 2018

20
RECONCILIATION OF GAAP TO NON-GAAP
($ millions, unaudited)
2019 2018 2019 2018
Net earnings (loss) attributable to FIS common stockholders (158)$ 299$ 298$ 846$
Provision (benefit) for income taxes (19) 85 100 208
Interest expense, net 95 72 337 297
Other, net 205 13 234 107
Operating income, as reported 123$ 469$ 969$ 1,458$
Depreciation and amortization, excluding purchase accounting amortization 217 178 809 688
Non-GAAP adjustments:
Purchase accounting amortization 740 183 1,635 732
Acquisition, integration and other costs 410 34 704 156
Asset impairments - - 87 95
Acquisition deferred revenue adjustment - - - 4
Adjusted EBITDA 1,490$ 864$ 4,204$ 3,133$
Three months ended
December 31,
Years ended
December 31,

21
RECONCILIATION OF GAAP TO NON-GAAP
($ millions, except per share amounts, unaudited)2019 2018 2019 2018
Earnings (loss) before income taxes and equity method investment earnings (loss) (183)$ 400$ 413$ 1,104$
Provision (benefit) for income taxes (19) 85 100 208
Equity method investment earnings (loss) 7 (4) (10) (15)
Net (earnings) loss attributable to noncontrolling interest (1) (12) (5) (35)
Net earnings (loss) attributable to FIS common stockholders (158)$ 299$ 298$ 846$
Non-GAAP adjustments:
Purchase accounting amortization 740 183 1,635 732
Acquisition, integration and other costs 410 34 768 156
Asset impairments - - 87 95
Acquisition deferred revenue adjustment - - - 4
Loss (gain) on sale of businesses and investments - 3 6 56
Debt financing activities - - 98 1
Non-operating (income) expense 211 - 47 -
Equity method investment (earnings) loss (7) 4 10 15
(Provision) benefit for income taxes on non-GAAP adjustments (219) 3 (419) (168)
Total non-GAAP adjustments 1,135$ 227$ 2,232$ 891$
Adjusted net earnings, net of tax 977$ 526$ 2,530$ 1,737$
Net earnings (loss) per share - diluted attributable to FIS common stockholders (0.26)$ 0.91$ 0.66$ 2.55$
Non-GAAP adjustments:
Purchase accounting amortization 1.19 0.56 3.63 2.20
Acquisition, integration and other costs 0.66 0.10 1.70 0.47
Asset impairments - - 0.19 0.29
Acquisition deferred revenue adjustment - - - 0.01
Loss (gain) on sale of businesses and investments - 0.01 0.01 0.17
Debt financing activties - - 0.22 -
Non-operating (income) expense 0.34 - 0.10 -
Equity method investment (earnings) loss (0.01) 0.01 0.02 0.05
(Provision) benefit for income taxes on non-GAAP adjustments (0.35) 0.01 (0.93) (0.51)
Adjusted net earnings per share - diluted attributable to FIS common stockholders 1.57$ 1.60$ 5.61$ 5.23$
Weighted average shares outstanding-diluted 623 329 451 332
Three months ended Years ended
December 31, December 31,
22
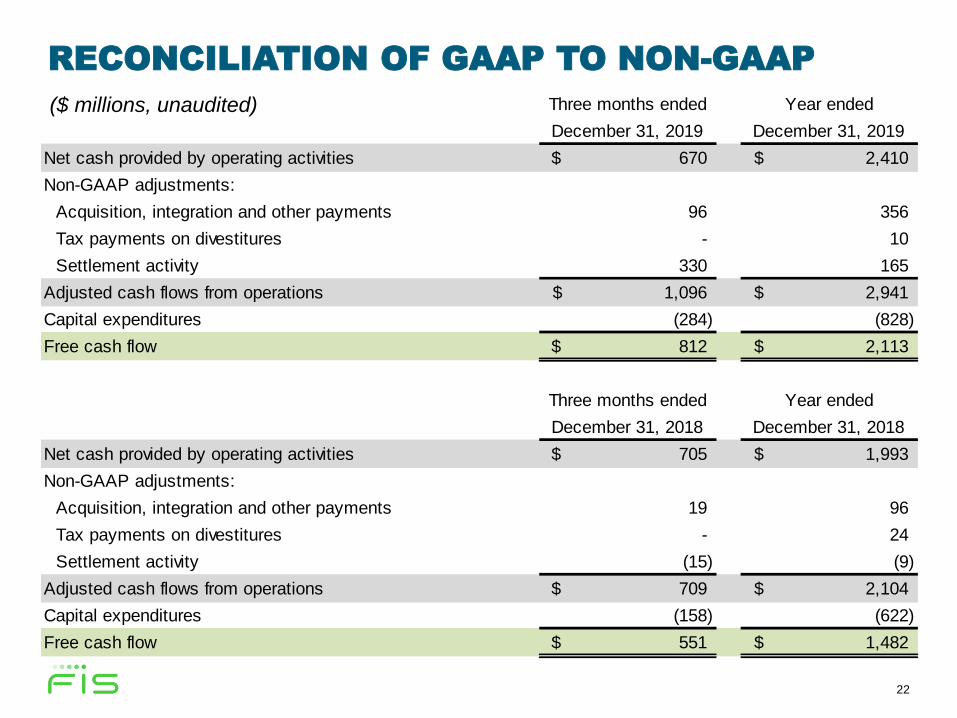
RECONCILIATION OF GAAP TO NON-GAAP
($ millions, unaudited) Three months ended Year ended
December 31, 2019 December 31, 2019
Net cash provided by operating activities 670$ 2,410$
Non-GAAP adjustments:
Acquisition, integration and other payments 96 356
Tax payments on divestitures - 10
Settlement activity 330 165
Adjusted cash flows from operations 1,096$ 2,941$
Capital expenditures (284) (828)
Free cash flow 812$ 2,113$
Three months ended Year ended
December 31, 2018 December 31, 2018
Net cash provided by operating activities 705$ 1,993$
Non-GAAP adjustments:
Acquisition, integration and other payments 19 96
Tax payments on divestitures - 24
Settlement activity (15) (9)
Adjusted cash flows from operations 709$ 2,104$
Capital expenditures (158) (622)
Free cash flow 551$ 1,482$
