rains-asia: an assessment model for air pollution …rains/asia1/chapter7.pdf(base case energy...
TRANSCRIPT
RAINS-ASIA:AN ASSESSMENT MODEL FOR AIR POLLUTION IN ASIA
Chapter 7
Scenarios of Future Acidification in Asia:Exploratory Calculations
Markus Amann, Janusz Cofala
Report on the World Bank Sponsored Project"Acid Rain and Emission Reductions in Asia"
December 1995


7. SCENARIOS OF FUTURE ACIDIFICATION IN ASIA: EXPLORATORYCALCULATIONS
Authors:Markus Amann, Janusz Cofala
TABLE OF CONTENTS
7.1 Introduction . . . . . . . . . . . . . . . . . . . . . . . . . . . . . . . . . . . . . . . . . . . . . . . . . . . . . VII-17.2 Energy pathways . . . . . . . . . . . . . . . . . . . . . . . . . . . . . . . . . . . . . . . . . . . . . . . . . VII-27.3 A reference emission scenario: base case energy path without additional measures
to control emissions . . . . . . . . . . . . . . . . . . . . . . . . . . . . . . . . . . . . . . . . . . . . . . VII-47.3.1 Sulfur deposition . . . . . . . . . . . . . . . . . . . . . . . . . . . . . . . . . . . . . . . . . . . VII-77.3.2 Achievement of critical loads for acid deposition . . . . . . . . . . . . . . . . . . VII-8
7.4 Exploring the technical potential for reducing SO emissions: The BAT (Best2
Available Technology) scenario . . . . . . . . . . . . . . . . . . . . . . . . . . . . . . . . . . . . VII-127.5 An advanced emission control technology (ACT) scenario . . . . . . . . . . . . . . . . VII-147.6 A ’basic control technology’ (BCT) scenario . . . . . . . . . . . . . . . . . . . . . . . . . . VII-177.7 A scenario with local applications of advanced technologies (LACT) . . . . . . . VII-217.8 Relocation of plants in sensitive regions . . . . . . . . . . . . . . . . . . . . . . . . . . . . . . VII-257.9 Implications of the energy efficiency pathway . . . . . . . . . . . . . . . . . . . . . . . . . VII-307.10 Conclusions . . . . . . . . . . . . . . . . . . . . . . . . . . . . . . . . . . . . . . . . . . . . . . . . . . . . VII-31References . . . . . . . . . . . . . . . . . . . . . . . . . . . . . . . . . . . . . . . . . . . . . . . . . . . . . . . . . . . VII-33
LIST OF TABLES
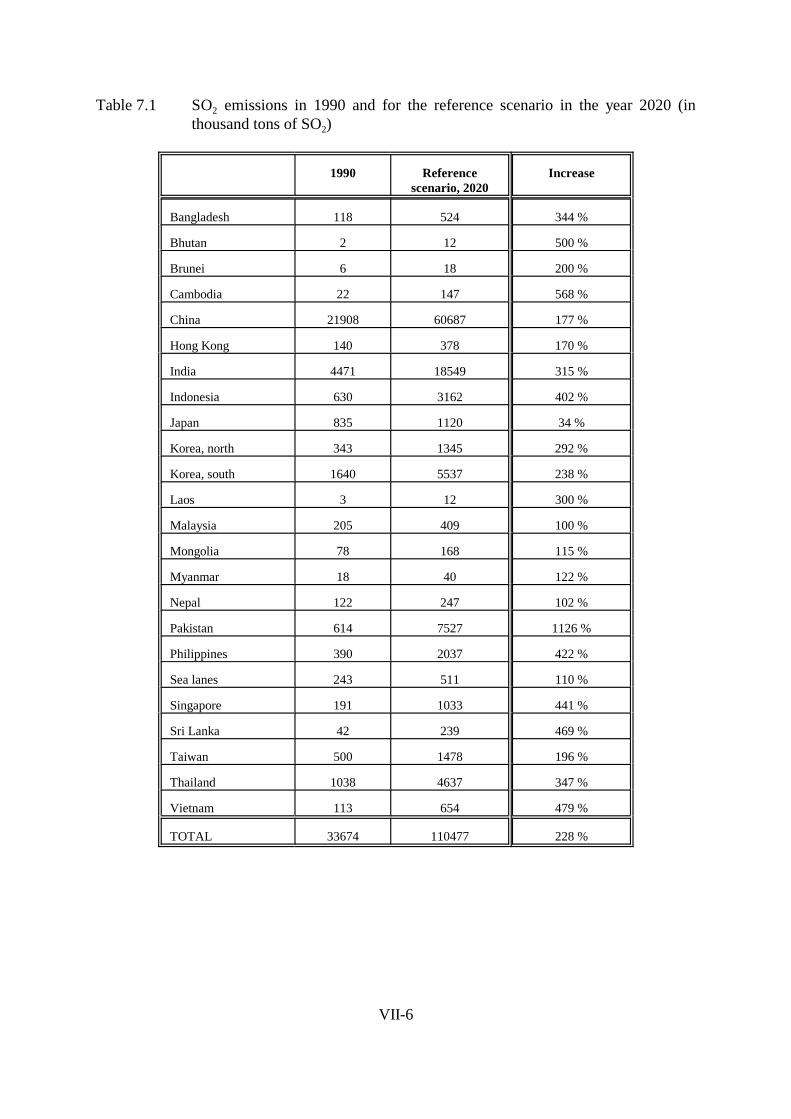
Table 7.1 SO emissions in 1990 and for the reference scenario in the year 2020 (in2
thousand tons of SO ) . . . . . . . . . . . . . . . . . . . . . . . . . . . . . . . . . . . . . . . VII-62
Table 7.2 Cost-effectiveness of available measures for area sources in the NorthHighlands region in Thailand . . . . . . . . . . . . . . . . . . . . . . . . . . . . . . . . . VII-16
Table 7.3 Emissions and control costs for the BAT, ACT and BCT scenarios in theyear 2020 . . . . . . . . . . . . . . . . . . . . . . . . . . . . . . . . . . . . . . . . . . . . . . . . VII-20
Table 7.4 Emissions and control costs in 2020 for China, India and Pakistan in theLACT scenario . . . . . . . . . . . . . . . . . . . . . . . . . . . . . . . . . . . . . . . . . . . . VII-22
Table 7.5 Contribution of sulfur deposition to two grids for the reference scenariofor the year 2020 in milligrams sulfur/m /year . . . . . . . . . . . . . . . . . . . VII-262
Table 7.6 Comparison of emissions and emission control costs for the base caseenergy pathway and the energy efficiency pathway . . . . . . . . . . . . . . . . VII-31
LIST OF FIGURES
Figure 7.1 Primary energy consumption in the region, Base case energy pathway(1000 PJ) . . . . . . . . . . . . . . . . . . . . . . . . . . . . . . . . . . . . . . . . . . . . . . . . . VII-3
Figure 7.2 Primary energy consumption in the region, Energy efficiency pathway(1000 PJ) . . . . . . . . . . . . . . . . . . . . . . . . . . . . . . . . . . . . . . . . . . . . . . . . . VII-3

Figure 7.3 SO emissions by fuel, reference scenario (million tons of SO ) . . . . . . VII-52 2
Figure 7.4 SO emissions by sector, reference scenario (million tons of SO ) . . . . VII-52 2
Figure 7.5 Sulfur deposition in 2020, Reference scenario (base case energy pathway,no further measures beyond current legislation assumed) . . . . . . . . . . . . VII-7
Figure 7.6 Growth in sulfur deposition between 1990 and 2020, Reference scenario(base case energy pathway, no further emission control measures currentlegislation assumed) . . . . . . . . . . . . . . . . . . . . . . . . . . . . . . . . . . . . . . . . . VII-8
Figure 7.7 Excess deposition above critical loads (all ecosystems) in 2020, Referencescenario (no further emission control beyond current legislation assumed).. . . . . . . . . . . . . . . . . . . . . . . . . . . . . . . . . . . . . . . . . . . . . . . . . . . . . . . . . VII-9
Figure 7.8 Excess deposition above critical loads for agricultural ecosystems in2020, Reference scenario (no further emission control beyond currentlegislation assumed). . . . . . . . . . . . . . . . . . . . . . . . . . . . . . . . . . . . . . . . VII-10
Figure 7.9 Ambient levels of SO concentrations in Asia, 2020, reference scenario2
(no emission control beyond current legislation assumed) . . . . . . . . . . VII-11Figure 7.10 Excess of critical loads for the BAT scenario in 2020 . . . . . . . . . . . . . . VII-13Figure 7.11 Excess deposition for the ACT strategy in the year 2020 . . . . . . . . . . . VII-17Figure 7.12 Excess sulfur deposition for the basic control technology (BCT) scenario
for the year 2020 . . . . . . . . . . . . . . . . . . . . . . . . . . . . . . . . . . . . . . . . . . VII-21Figure 7.13 Excess sulfur deposition for the LACT scenario (local application of
advanced control technologies) for the year 2020 . . . . . . . . . . . . . . . . . VII-24Figure 7.14 Sulfur deposition from the Lampang power station for the reference
scenario (no emission control assumed) for the year 2020 . . . . . . . . . . VII-27Figure 7.15 Excess sulfur deposition for a scenario in which some new power stations
in China and Thailand are moved to ecologically less sensitive regions VII-29

VII-1
7. SCENARIOS OF FUTURE ACIDIFICATION IN ASIA: EXPLORATORYCALCULATIONS
Authors:Markus Amann, Janusz Cofala
7.1 Introduction
This chapter presents the results of an initial application of the Regional Air PollutionInformation and Simulation (RAINS) model to explore the potential impacts on acidification offuture scenarios of energy development in Asia. The purpose of these initial applications istwofold.
First, these scenarios provide the first regionally-disaggregated and integrative picture of theconsequences of emissions and acid deposition under potential economic development andtechnological conditions for Asia during the coming two to three decades based on currentlyavailable knowledge.
Second, the scenario development provides a first practical test of the RAINS-Asia model, a newtool for the integrated assessment of sulfur emissions’ impacts and abatement strategies for Asia.
The database upon which the scenarios are based represents an extensive collection andcompilation effort carried out by a large number of institutions in Asia and Europe. The scenariogeneration process has provided an important step in sorting, organizing, assimilating, andupdating that data – a process which is still underway and, in fact, never ends.
This chapter is organized as follows: Section 7.2 describes the baseline development of futureenergy use in Asia according to national expectations (the base case energy pathway). As analternative, a scenario has been developed that explores the potential for increased energyefficiency and use of renewable resources (the energy efficiency pathway). Section 7.3 projectsfuture sulfur emissions for the baseline energy scenario without further measures to control SO2
emissions and analyzes regional sulfur deposition with critical loads, which have been definedin Chapter 6 of this report. Motivated by the serious threat imposed to many ecosystems by theuncontrolled growth of emissions, various features of the RAINS model are used to explorealternative strategies to keep sulfur deposition closer to critical loads. Section 7.4 examines costsand environmental impacts of a hypothetical strategy applying western emission standards to allAsian countries. Because of the high costs involved in such a policy, Section 7.5 appliesadvanced emission control measures only to the largest emission sources throughout the region.Since currently advanced control technologies are not legally required in most Asian countries,Section 7.6 investigates the costs and levels of ecosystem protection, if only domesticallyavailable emission control techniques would be applied. It will be shown that by selectivelyapplying advanced measures to those areas, which have significant impacts on sensitiveecosystems, similar environmental impacts could be achieved at lower costs (Section 7.7).Section 7.8 demonstrates the capability of the RAINS model to identify impacts of individualemission sources and to relocate large point sources to less sensitive sites. Section 7.9 explores

VII-2
the implications of energy efficiency strategies. Conclusions are drawn in Section 7.10.
7.2 Energy pathways
To provide a basis for the analysis of emissions and emission control strategies, the RESGENmodule of the RAINS model was used to develop two alternative energy pathways:
! The base case energy pathway, resembling ’business as usual’ practices. This pathwayassumes that each country would continue the current trends in energy policies, withoutstrong promotion of energy efficiency measures or fuel substitution to reduce theemissions of acidifying pollutants. Efforts were made to utilize energy demand forecastsmade by the government planning organizations or research institutions in each country.This pathway is the basis for the emission (control) scenarios analyzed in the followingsections 7.3 to 7.8.
! An energy efficiency pathway. This pathway explores the possible reduction of emissionsthrough a strong effort to use energy more efficiently. The efficiency improvementspossible through to 2020 are based primarily on the experiences of the industrializedcountries during the period 1973 – 1983 including the response to the sharp rise in energyprices, general improvements in technology, and increased use of renewable resources.The consequences of an energy efficiency pathway on SO emissions and control costs2
are further explored in Section 7.9.
These two pathways are based on a variety of assumptions on socio-economic development,population growth, technological progress, etc., which are documented in Chapter 3 of thisreport. RESGEN was used to develop energy pathways for all 23 countries considered in RAINS-Asia. Furthermore, the data of the largest countries was disaggregated into sub-national regions,totalling 94 over all of Asia. Chapter 3 provides details on the RESGEN model.
Figures 7.1 and 7.2 display total primary energy consumption by fuel for the two pathways.Reflecting the current expectations in the countries, total primary energy consumption in the basecase grows by 230 percent between 1990 and 2020 with a proportional increase in coalconsumption. In the efficiency case, primary energy consumption grows by about 150 percentin the same period, with an even lower increase in coal use.

VII-3
Figure 7.1 Primary energy consumption in the region, Base case energy pathway (1000 PJ)
Figure 7.2 Primary energy consumption in the region, Energy efficiency pathway (1000 PJ)

VII-4
7.3 A reference emission scenario: base case energy path without additional measures tocontrol emissions
In order to provide a reference for the further analysis, an emission scenario has been developedbased on the assumption that economic and energy development will follow the base casepathway and that -beyond the control measures required by current legislation in Japan andTaiwan - no further action will be taken for reducing SO emissions. Due to the strong growth2
in economic activities and, subsequently, energy consumption assumed in the base case energypath, the lack of measures to limit emissions would lead to a significant increase in SO2
emissions in the region: from 33.6 million tons in 1990 to more than 110 million tons in 2020,i.e., by about 230 percent. The increase in SO emissions is strongly connected to the use of coal.2
Coal combustion is responsible for about three quarters of the total emissions over the wholeperiod under study. About 20 percent of the emissions originate from the combustion of liquidfuels; the balance is a result of biomass combustion (Figure 7.3).
Figure 7.4 shows the development of emissions by economic sector. The highest growth inemissions comes from the power plant sector, due to the increased use of coal-based electricitygeneration. This sector’s contribution to total emissions increases from 30 percent in 1990 to 37percent in 2020. Thereby, also the relative importance of the various emission sourcesexperiences an important change: whereas in 1990 about 16 percent of total SO emissions in the2
region originated from the large point sources considered in the RAINS model (i.e., powerstations with large boilers), in 2020 this share is expected to constitute about 25 percent of totalemissions.
Differences among countries in the rates of economic development and the anticipated structuresof the energy supply cause a regionally inhomogeneous picture of future emissions growth. InJapan, SO emissions would increase by about 30 percent, whereas, e.g., in India, Indonesia,2
Philippines and Thailand the predicted expansions reach typically a factor of four to five(compare Table 7.1). For Pakistan, the expected growth in the consumption of high sulfur lignitewould increase SO emissions by a factor of 12, although compared to a low level in 1990.2

VII-5
Figure 7.3 SO emissions by fuel, reference scenario (million tons of SO ) 2 2
Figure 7.4 SO emissions by sector, reference scenario (million tons of SO ) 2 2
VII-6
Table 7.1 SO emissions in 1990 and for the reference scenario in the year 2020 (in2
thousand tons of SO )2
1990 Reference Increasescenario, 2020
Bangladesh 118 524 344 %
Bhutan 2 12 500 %
Brunei 6 18 200 %
Cambodia 22 147 568 %
China 21908 60687 177 %
Hong Kong 140 378 170 %
India 4471 18549 315 %
Indonesia 630 3162 402 %
Japan 835 1120 34 %
Korea, north 343 1345 292 %
Korea, south 1640 5537 238 %
Laos 3 12 300 %
Malaysia 205 409 100 %
Mongolia 78 168 115 %
Myanmar 18 40 122 %
Nepal 122 247 102 %
Pakistan 614 7527 1126 %
Philippines 390 2037 422 %
Sea lanes 243 511 110 %
Singapore 191 1033 441 %
Sri Lanka 42 239 469 %
Taiwan 500 1478 196 %
Thailand 1038 4637 347 %
Vietnam 113 654 479 %
TOTAL 33674 110477 228 %

VII-7
7.3.1 Sulfur deposition
The boost in SO emissions resulting from the high growth in energy consumption will cause a2
strong increase in sulfur deposition throughout the region. In 2020, virtually all eastern parts ofChina and large regions in India would experience deposition between two and five grams. Inmany industrialized and metropolitan areas in Thailand, the Philippines and Malaysia sulfurdeposition will exceed five grams to ten grams per square meter and year. Peak deposition ofsulfur would escalate in some industrialized areas in China to about 26 grams per square meterand year (Figure 7.5). For comparison, sulfur deposition observed in the well-known industrialareas of Central and Eastern Europe peaked at about 15 grams per square meter and year.
Figure 7.6 reveals a significant change in deposition for almost all of Asia: In major areas ineastern and southern China and in some parts of Japan, sulfur deposition will increase by a factorof two to three, with places with increases of up to a factor of five. A factor of five is alsoobserved in many regions India, Korea and Thailand. There are, however, also several sites inAsia for which an increase in sulfur deposition up to a factor of ten has to be expected. It shouldbe mentioned that changes in emissions from outside the region (e.g., from Siberia) are not takeninto account for this analysis.
Figure 7.5 Sulfur deposition in 2020, Reference scenario (base case energy pathway, nofurther measures beyond current legislation assumed)

VII-8
Figure 7.6 Growth in sulfur deposition between 1990 and 2020, Reference scenario (basecase energy pathway, no further emission control measures current legislationassumed)
7.3.2 Achievement of critical loads for acid deposition
One way to judge the potential environmental damage caused by increased sulfur deposition isto compare deposition with critical loads, which resemble the maximum deposition that will notcause chemical changes leading to harmful effects on ecosystem structure and function. Adetailed description of how critical loads have been estimated and how excess deposition can beinterpreted is provided in Chapter 6 of this report. Figure 7.7 displays excess deposition, i.e.,sulfur deposition above the critical loads, for the reference scenario for the year 2020. As aconservative assumption the 25 percentile of critical loads database has been used for thisanalysis, allowing for eventual uncertainties and data inaccuracies in the quantitative estimatesof the critical loads.
Figure 7.7 shows that under the reference emission scenario, i.e., in the do-nothing case, criticalloads will be exceeded in many regions in Asia, although not everywhere. Pakistan, the westernand central parts of India, western China, Myanmar and parts of Indonesia experience no or onlylittle excess deposition even under the highest emission scenarios considered in this paper. Inother areas, e.g., in southern and eastern China, in Korea and in northern Thailand, widespreadserious excess deposition has to be expected. In addition, many ’hot spots’ occur on the localscale.

VII-9
Figure 7.7 Excess deposition above critical loads (all ecosystems) in 2020, Referencescenario (no further emission control beyond current legislation assumed).
It must be emphasized that - under the assumptions of this scenario - excess deposition will reachunprecedented levels in some regions: The RAINS model calculates that critical loads will beexceeded by between two and five grams sulfur per square meter per year in large parts in centraland eastern China, in northern Thailand. Highest excess deposition (up to 15 to 20 grams sulfurper square meter per year) is calculated for some ecosystems in Korea, the Bangkok metropolitanregion, and in the Sichuan and Shanghai provinces. For comparison, total sulfur deposition inmany of these areas is currently in the range of two to three grams.
Although the current state of scientific knowledge does not yet allow drawing conclusions aboutthe environmental damage implied with such excess deposition, the fact that sulfur depositionwill be more than ten times above the sustainable levels in large areas may give reason for seriousconcern. To derive more specific information on potential environmental threats, the RAINSmodel enables the examination of conditions for various types of ecosystems individually. Toillustrate this feature, Figure 7.8 displays excess deposition only for agricultural ecosystems.Calculations show that the growth of sulfur deposition could have a severe negative influenceon the conditions of many important agricultural crops in Asia. The fact that the major ricegrowing areas in Asia (e.g., in China, India and Japan) will experience excess deposition up to15 grams per square meter and year may also give reason for serious concern.

VII-10
Figure 7.8 Excess deposition above critical loads for agricultural ecosystems in 2020,Reference scenario (no further emission control beyond current legislationassumed).
Obviously, deposition of air pollutants influencing the soil chemistry represents only onepotential cause for environmental damage. Analysis shows, however, that high deposition isalways linked to sufficiently high levels of ambient concentrations. The associated ambient SO2
levels in the rice growing regions in China are estimated to reach in this scenario up to 60micrograms SO /m (Figure 7.9). Although specific analysis of dose-response relationships for2
3
rice paddies is still lacking, a rough extrapolation of the threshold levels for similar ecosystems(which range usually from 20 to 30 micrograms/m , see e.g. IUFRO, 1978) would suggest an3
excess of these levels by a factor of two to three.
High ambient levels of SO concentrations resulting from this scenario do not only imply serious2
risks to natural and agricultural ecosystems, but impose also serious threat to human health. Oneof the first and most visible signals is the deterioration of urban air quality in large metropolitanagglomerations in Asia. Although the assessment of urban air pollution was excluded from thefirst phase of the RAINS-Asia work, Figure 7.9 suggests the unabated scenario to exceed theWHO guideline of 40-60 micrograms SO /m (annual average - WHO, 1979) in many Asian2
3
regions, even calculated as an average over grids with a size of one degree longitude by onedegree latitude resolution. Although a direct link to actual air quality in cities is not yet possible,experience shows that actual concentrations in the urban centers of a grid are usuallysubstantially higher than the grid average. Calculated on the same spatial resolution the modelshows that ambient levels of SO concentrations increase in many regions in Asia by a factor of2
four to five compared to the 1990 levels.

VII-11
As outlined above it can be expected that the growth in SO emissions associated with the2
envisaged evolution of energy use gives reason for serious concern about maintaining sustainableconditions for natural and agricultural ecosystems in Asia. Sulfur deposition will causesignificant changes in the soil chemistry over wide areas in Asia, affecting growing conditionsfor many natural ecosystems and agricultural crops. Ambient levels of SO will exceed WHO2
health guidelines not only in cities, but also in many rural regions. If no countermeasures weretaken, a degradation of the environmental quality to unprecedented levels has to be anticipated.
Figure 7.9 Ambient levels of SO concentrations in Asia, 2020, reference scenario (no2
emission control beyond current legislation assumed)
A major feature of the RAINS model is its capability to simulate SO emission control strategies2
and explore their costs and their regional environmental benefits in physical terms. In the model,emissions can be reduced by prescribing specific measures at selected sources, i.e., at specificeconomic sectors in individual regions or countries. Details of how emission control measuresand costs have been modelled in RAINS are provided in Chapter 4 of this report.
In response to the finding of the previous section, i.e., that realizing the officially anticipatedenergy development without any measures to control emissions might cause dramatic negativeenvironmental impacts, the following sections explores costs and environmental benefits ofalternative strategies for reducing SO emissions. Sections 7.4 and 7.5 discuss the impacts of2
applying certain packages of emission control measures throughout the region. Thereafter,

VII-12
The Best Available Technology (BAT)-scenario
! Flue gas desulfurization (wet limestone scrubbing) for all (existing and
new) large power stations (LPS) burning coal and oil
! Flue gas desulfurization (wet limestone scrubbing) for all large
industrial boilers
! Use of low sulfur fuels (coal, heavy fuel oil, gasoil) for all other users
Sections 7.6 to 7.8 explore the potential for cost savings offered by selective application oftechnologies guided by the different levels of environmental sensitivities.
7.4 Exploring the technical potential for reducing SO emissions: The BAT (Best2
Available Technology) scenario
To explore the potential, costs and ecological improvements offered by advanced technologicalmeans to reduce emissions a scenario has been developed which simulates for the base caseenergy pathway the application of advanced emission control technologies to all relevantemission sources throughout Asia. The measures considered in this scenario represent the currenttechnological standards in many industrialized countries. In particular, wet flue gasdesulfurization (WFGD) processes are assumed for all industrial and power plant boilers burningcoal and oil, including retrofits of the existing boiler stock. Since, for obvious technical reasons,in the residential/commercial (domestic) sector and in the transport sector the use of flue gasdesulfurization is not possible, the use of low sulfur fuels (low sulfur coal, low sulfur oil) hasbeen assumed for all small sources (Box 1).
Box 1: Measures assumed for the ’best available technology’ (BAT) scenario
The RAINS model shows that advanced emission control methods applied to the fuelconsumption levels as suggested by the reference energy scenario could drastically reduce SO2
emissions in Asia below the current levels. Between 1990 and 2020, SO emissions from the2
region would decline from 33.6 to 16.3 million tons, i.e., by 51 percent, despite the assumedgrowth in energy consumption by 230 percent. Since control technologies work most effectivelyat large sources, the relative contribution from large point sources declines from 16 percent in1990 to less than nine percent in 2020. Note, that this is much in contrast to the unabatedscenario, in which the share of large point sources increases to 25 percent.

VII-13
Different structural compositions in the emission sources create also a wide span in the evolutionof national emissions. For instance, as a result of such a policy, emissions from China, thePhilippines and Thailand would decline by 60 to 70 percent, whereas India’s emissions wouldstill increase by about one third compared to 1990 (Table 7.1).
Not surprisingly, declining emissions will also result in reduced sulfur deposition. Mostinteresting, however, is a comparison between the diminished deposition and the critical loads.As displayed in Figure 7.10, a general use of advanced emission control technologies will bringdown sulfur deposition below the critical loads almost everywhere in the regions. A majorexception is the border area between the Hunan and Jiangxi provinces in China, where sensitiveecosystems are located in regions with intense economic activity. Additional isolated ’hot spots’occur in India, Thailand and Korea.
The scenario shows that, despite the more than three-fold increase in energy consumptionexpected for the next few decades, sustainable conditions - at least in terms of sulfur deposition -could be achieved by advanced technologies for most of the Asian ecosystems.
Figure 7.10 Excess of critical loads for the BAT scenario in 2020
The success in ecosystem’s protection achievable with advanced control technologies, however,has its price. The RAINS model also enables analysis of the costs involved in various emissioncontrol technologies. As discussed in Chapter 4, the cost evaluation of the RAINS model hasbeen restricted to the incremental costs caused by emission control measures and does not includethe total costs of the energy system. Furthermore, as outlined before, cost estimates reflect

1For gasoil the limit adopted in the ACT strategy is 0.3 percent. Limits for other fuels are as for the BAT strategy.
VII-14
annualized full life cycle costs (including investments and operating costs).
In the year 2020 full application of advanced emission control technologies would require 90billion US $ per year, which is about 0.59 percent of the regional GDP assumed for theunderlying energy scenario. For comparison, the relative costs for the latest agreement onreducing sulfur emissions in Europe (the Oslo protocol) were only about one third of this level(0.21 percent of the GDP; Amann et al., 1994). It should be pointed out that there exists a widerange in burdens to the various national economies: Whereas for some countries with lowconsumption of fossil fuels (e.g., Myanmar) or highly developed economies (e.g., Japan) theabatement costs are comparably low (0.05 and 0.06 percent, respectively), developing countrieswith a heavy reliance on coal face substantially higher burdens (e.g., China, 1.7 percent). InEurope, the highest share of GDP for the latest agreement was 0.79 percent.
Since the environmental benefits of such a strategy cannot yet be quantified in monetary terms,a definite answer about the cost-benefit ratio of fully applying western emission control standardscannot be derived yet. It has to be observed, however, that the costs associated with such astrategy would put significant burdens on many developing economies in the region.Consequently, the following sections use the RAINS model to search for alternative, perhapsmore cost-effective, solutions to reduce source emissions in Asia.
7.5 An advanced emission control technology (ACT) scenario
Section 7.4 has explored a scenario that applies best available emission control technologies toall emission sources in Asia. As a consequence, emissions would be greatly reduced, resultingin a fall in sulfur deposition levels below the critical loads for most of Asia. An obvious optionfor cost-savings would be to reduce the overachievement of the critical loads by selecting onlythe most cost-effective measures to reduce emissions. If structural changes in the energy system,such as energy conservation measures and fuel substitution, are left aside for a moment, theremaining technologies show a wide range of cost-effectiveness, i.e., they reduce differentamounts of sulfur for the same amount of money (Table 7.2). A rational policy could thereforerequest only the most cost-effective measures, thereby reducing the achieved emission reductionsto some degree, but to a greater extent also the involved costs.
To follow this idea further, a scenario has been developed which assumes the application ofadvanced control technologies (wet flue gas desulfurization WFGD) only for new, large emissionsources in the power plant, the industrial and refinery sectors. Emissions from existing powerstations and from small sources in the industry are assumed to be controlled through the use oflow sulfur fuels (50 percent share of low sulfur coal and oil). Also in the domestic and transport1
sectors low sulfur fuels are prescribed (see Box 2). For Japan and Taiwan, however, the scenarioassumes compliance with current national legislation.

VII-15
The Advanced Control Technology (ACT)-scenario
! Flue gas desulfurization (wet limestone scrubbing) for all new power
stations
! Flue gas desulfurization (wet limestone scrubbing) for all large
industrial boilers in refineries
! Low sulfur fuels for boilers in industry (100% of liquid fuels and 50%
of coal consumption)
! Low sulfur fuels for the domestic and transport sectors (100% of total
consumption)
Box 2: Measures for the advanced emission control scenario
As expected, restricting advanced measures to certain sources lowers the emission reductions.Whereas the BAT strategy will be able to cut total SO emissions in Asia by half up to 2020, the2
ACT scenario produces a 50 percent increase of emissions at a level of 50.4 million tons.However, this level is still less than half of the unabated level of 110 million tons.
Selecting only the most cost-effective measures cuts down costs. From more than 90 billion US$/year (costs for the BAT scenario in 2020) costs drop to 39 billion US $/year, i.e., by about 57percent. Consequently, compared to GDP the strategy would only take a share of 0.25 percent,which is already close to the 0.21 percent level currently discussed in Europe.
It has been pointed out earlier that, due to country-specific structural differences, the actualsituation varies considerably among countries. In China, where the BAT strategy would consume1.7 percent of GDP, limiting measures to the more cost-effective technologies will reduce theshare to 0.59 percent of the GDP. Thereby, the burden is comparable to other countries such asIndia, Indonesia, the Philippines and Thailand, which all are in a range between 0.51 to 0.57percent of GDP.

VII-16
Table 7.2 Cost-effectiveness of available measures for area sources in the North Highlandsregion in Thailand
Fuel Sector Control technology Cost, US $/ton SO removed2
Unit costs Marginal costs
Brown coal Power plants WFGD 208 208
Heavy fuel oil Power plants WFGD 403 403
Heavy fuel oil Conversion WFGD 468 468Industry
Brown coal Industry WFGD 689 689
Heavy fuel oil Domestic LSHF 1084 1084Transport
Gasoil All sectors LSMD1 1823 1823
Hard coal Industry WFGD 2710 2710
Brown coal Power plant RFGD 287 2792
Heavy fuel oil Power Plant RFGD 732 11150
Gasoil All sectors LSMD2 5469 15677
Heavy fuel oil Industry RFGD 997 17742Conversion
Brown coal Industry RFGD 1565 29311
Hard coal Industry RFGD 6720 133729
Legend:
Control technologies: WFGD - Wet flue gas desulfurizationRFGD - Regenerative flue gas desulfurizationLSHF - Low sulfur heavy fuel oilLSMD1, LSMD2 - Low sulfur medium distillates (0.3% S and 0.05% S respectively)
Unit cost shows the average cost of reducing one ton of SO if a given technology is applied from the unabated case.2
Marginal cost shows the incremental cost of reducing additional ton of SO if technologies are applied according to their2
cost - effectiveness.
VII-17
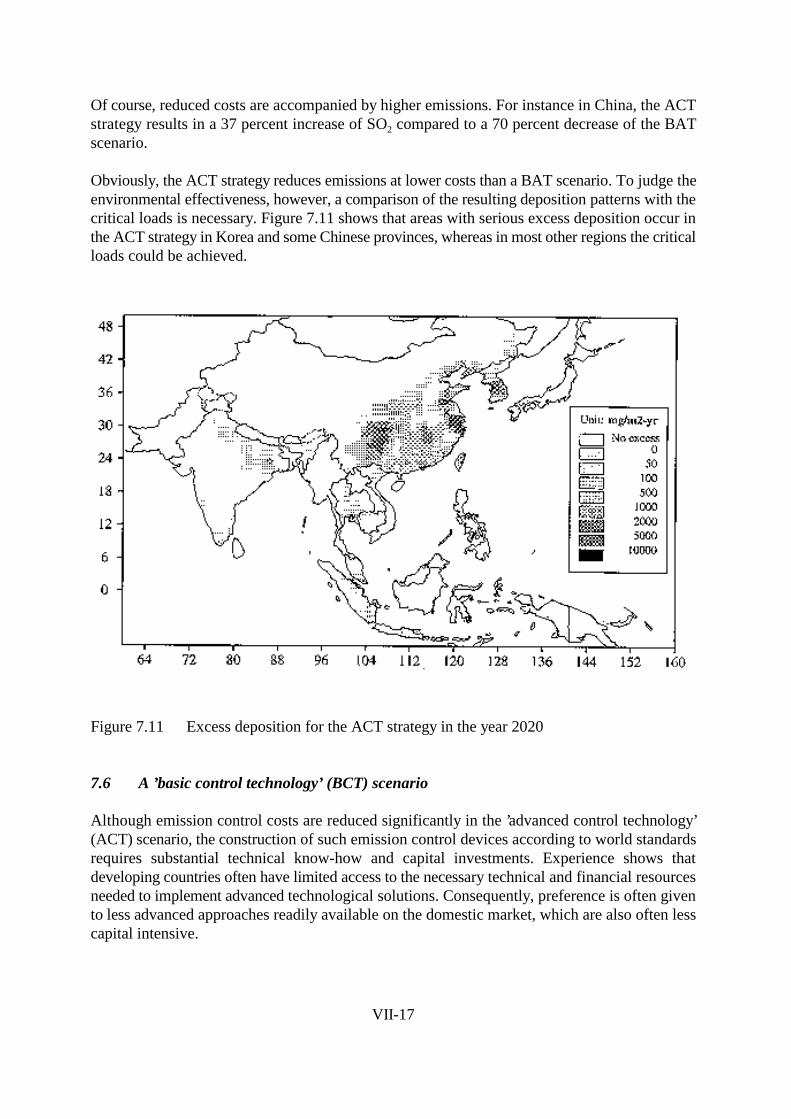
Of course, reduced costs are accompanied by higher emissions. For instance in China, the ACTstrategy results in a 37 percent increase of SO compared to a 70 percent decrease of the BAT2
scenario.
Obviously, the ACT strategy reduces emissions at lower costs than a BAT scenario. To judge theenvironmental effectiveness, however, a comparison of the resulting deposition patterns with thecritical loads is necessary. Figure 7.11 shows that areas with serious excess deposition occur inthe ACT strategy in Korea and some Chinese provinces, whereas in most other regions the criticalloads could be achieved.
Figure 7.11 Excess deposition for the ACT strategy in the year 2020
7.6 A ’basic control technology’ (BCT) scenario
Although emission control costs are reduced significantly in the ’advanced control technology’(ACT) scenario, the construction of such emission control devices according to world standardsrequires substantial technical know-how and capital investments. Experience shows thatdeveloping countries often have limited access to the necessary technical and financial resourcesneeded to implement advanced technological solutions. Consequently, preference is often givento less advanced approaches readily available on the domestic market, which are also often lesscapital intensive.

VII-18
The Basic Control Technology (BCT) - scenario
! China, India and Pakistan:
! Domestic technologies with low capital requirements (e.g., lime
stone injection) for all new coal fired power stations
! Use of low sulfur fuels as in the ACT (Advanced Controls)
scenario for the industrial and domestic sector
! All other countries:
- Controls as in the ACT scenario
To explore the economic and ecological features of strategies that give preference to domestictechnologies an example scenario was constructed, in which use is made of domestically availablecontrol technologies. Therefore, instead of installing standard flue gas desulfurization units atlarge power stations, emissions from these sources would be controlled through more basictechnologies with low capital requirements. As an example for such technical solutions, theRAINS model considers the lime stone injection process, which achieves emission reductions ofabout 50 percent. Investment requirements are low but, due to the significant amount of wastematerial to be handled, operating costs may be higher than for the standard flue gasdesulfurization method.
The ’basic control technology’ (BCT) scenario assumes that in China, India and Pakistan emissionsfrom new large point sources are controlled by domestic technology (with a typical removalefficiency of about 50 percent) rather than by advanced flue gas cleaning methods (withefficiencies of more than 90 percent). For small sources in the industrial and domestic sector theuse of low sulfur fuels is assumed (Box 3).
Due to the application of less efficient control technologies, the remaining emissions in all threecountries will be higher than in the advanced technology scenario. For China, SO emissions in2
the year 2020 would amount to 38.1 million tons (i.e., an increase of 77 percent), for India 13million tons (+190 percent) and for Pakistan 3.6 million tons (+490 percent). In the ACT scenariocomparable growth rates are 37 percent in China, 135 percent in India and 210 percent inPakistan, respectively.
Box 3: Measures assumed for the basic technology scenario

VII-19
Most interesting, however, is the fact that total costs are close to the levels of the ACT scenario.This can be explained by the fact that the RAINS model calculates and compares total life cyclecosts of emission control equipment: in the case of the currently used domestic controltechnologies the lower investments are compensated by higher operating costs, in particular forthe treatment and disposal of waste material. Obviously, costs for waste disposal are stronglyinfluenced by local conditions and legislation. Therefore, the RAINS model can only providegeneric estimates of such costs, which in fact reflects the situation in developed countries. Lowerlegal standards for waste disposal facilities may reduce the costs considerably, however at higherenvironmental hazards caused by the deposits. To avoid a transfer of the air pollution problem toother media, such as a contamination of soils and ground water, the RAINS model bases its costestimates on standards which strive to minimize such risks.
Figure 7.12 shows excess deposition for the basic technology scenario. Compared to the ACTscenario the increase in emissions from the large point sources results in a situation whereby manyparts of eastern China face excess deposition of more than two grams per square meter and year,with peak exceedances in the Sichuan and Shanghai provinces of about ten grams. Consequently,it can be concluded that in the long run a strategy relying solely on control technologies withmodest removal efficiencies will not be able to preserve important agricultural areas from seriousexcess deposition.
Table 7.3 summarizes emissions and costs from the three emission control scenarios discussedup to now. Obviously, there is a clear trade-off between emission levels, control costs andecosystem’s protection.

VII-20
Table 7.3 Emissions and control costs for the BAT, ACT and BCT scenarios in the year2020
Country SO Emissions SO Control Costs 2
(thousand tons of SO ) (million US $/yr)2
2
BAT ACT BCT BAT ACT BCT
Bangladesh 165 258 258 475 228 228
Bhutan 3 4 4 7 9 9
Brunei 15 17 17 15 2 2
Cambodia 22 69 69 487 123 123
China 6672 29932 38124 34230 11975 12712
Hong Kong 24 68 68 574 255 255
India 5906 10522 13054 17055 6328 6213
Indonesia 438 785 785 6121 2255 2255
Japan 393 1047 1047 6132 3458 3458
Korea, north 75 7075 7075 3087 1089 1089
Korea, south 552 1469 1469 3769 3214 3214
Laos 5 7 7 9 6 6
Malaysia 66 246 246 843 163 163
Mongolia 13 81 81 138 56 56
Myanmar 32 37 37 32 5 5
Nepal 218 230 230 53 12 12
Pakistan 606 1907 3609 4333 3095 3703
Philippines 146 440 440 1201 1063 1063
Sea lanes 102 307 307 445 222 222
Singapore 65 221 221 860 635 635
Sri Lanka 37 53 53 222 173 173
Taiwan 245 827 827 2999 1249 1249
Thailand 336 813 813 6485 2916 2916
Vietnam 183 345 345 853 338 338
TOTAL 16321 50396 62822 90424 38877 40108

VII-21
Figure 7.12 Excess sulfur deposition for the basic control technology (BCT) scenario for theyear 2020
7.7 A scenario with local applications of advanced technologies (LACT)
The analyses carried out in the preceding sections shows that there is a clear trade-off betweenecosystem protection and emission control costs. Furthermore, it became clear that differentstrategies have different cost-effectiveness, i.e., some of them achieve different protection levelsfor similar costs. The important question arises of how the cost-effectiveness of strategies couldbe further increased.
Ultimately, the integrated assessment process enables the optimization of emission controlmeasures, e.g., in order to minimize costs for achieving exogenously specified target depositionor ecosystems protection levels. Earlier versions of the RAINS model implemented for Europecontain such optimization procedures and have been used to identify optimized abatementscenarios as a starting point for international negotiations (Amann et al., 1993).
Although the present implementation of the RAINS model for Asia does not provide thiscapability, the model can already be used to search for cost-effective strategies. Section 7.4 (theadvanced control technology scenario) made a step towards increasing cost-effectiveness incomparison to the best available technology (BAT) scenario by selecting only the most effectivemeasures. A further reduction of costs, without increasing environmental damage, could beachieved by directing advanced control measures to ecologically sensitive areas and relaxingcontrol requirements at less sensitive locations. It should be mentioned that China is currently

VII-22
exploring similar approaches by requesting only power stations in ecologically sensitive regionsto reduce emissions (rational siting of plants, Zhao et al., 1995).
As an illustrative example, a scenario is constructed for China, India and Pakistan that appliesadvanced emission control measures to only those provinces where significant excess depositionwould occur without such measures (compare Box 4). Emissions and control costs for these threecountries in the LACT scenario are shown in Table 7.4. In this scenario the emissions from low-income countries (e.g., Bangladesh, Cambodia or Sri Lanka) remain uncontrolled. Countries withhigher per capita income (e.g., Indonesia, Japan, South Korea or Thailand) control their emissionsas in the ACT scenario.
Table 7.4 Emissions and control costs in 2020 for China, India and Pakistan in the LACTscenario
Country Emissions Costs, million US $(thousand tons SO )2
LACT BCT ACT LACT BCT ACT
China 37904 38124 29932 8505 12609 12063
India 13434 13054 10522 3870 6214 6386
Pakistan 5592 3609 1908 857 3702 3102
Sum 56930 54787 42362 13232 22535 21551

VII-23
NO CONTROL ADVANCED EMISSIONCONTROL (ACT)
China:
FujianGuandong-Hainan
GuanxiHebei-Anhui-Henah
Inner MongoliaNorth-eastern plain, Heilongjiang
ShenyangWest Tibet-Quinghai
Yunnan
BeijingChongquing
GuangzhouGuyang
GuizhouHubei
HunanJiangsu
JianxiShanghai
Shaanxi-GansuShandong
Shanxi Sichuan
Taiyuan Tianjin
Wuhan Zhejiang
India
Andra Pradesh
BombayKarnataka-Goa
KeralaMadras
Maharasthra-Dadra-NagarPunjab-Chandigarh
Western Himalaya-Jammu-Kashmir
West Bengal
Bihar Calcutta
DelhiEastern Himalaya-Assam
Guijarat Haryana
Madhya Pradesh Orissa
Tamil Nadu-Pondicherry Uttar Pradesh
Pakistan
Lahore
North-western frontier provincesPunjab
Sind
Karachi
Box 4: Regional emission control strategies for the Local ACT scenario in China, India andPakistan

VII-24
From Table 7.4 it can be derived that focusing advanced emission control measures onecologically sensitive regions would result, for China and India, in emissions roughly comparableto the basic technology case, however, at only two thirds of the costs. Avoiding expensive - andenvironmentally less effective - controls in a group of low-income countries would save about 3billion US $ in the year 2020.
As shown before in Figure 7.11, the ACT scenario reduces excess sulfur deposition in large areasof Asia, i.e., ecosystems would not be under threat. In the LACT case, ecosystems protection isslightly lower than in the ACT scenario, while costs decline substantially (Figure 7.13).
The scenario demonstrates that targeting emission control measures could substantially increasethe cost-effectiveness of strategies. Taking China as an example, focusing measures to theecologically sensitive regions could achieve environmental impacts roughly comparable to theBasic Control Technology (BCT) case while costs declining to 0.41 percent of GDP.
Figure 7.13 Excess sulfur deposition for the LACT scenario (local application of advancedcontrol technologies) for the year 2020

VII-25
7.8 Relocation of plants in sensitive regions
An alternative approach to protect sensitive ecosystems - or to avoid the occurrence of ’hot spots’,i.e., areas with peak excess deposition - would be to locate new power stations in less sensitiveregions. The RAINS model facilitates the analysis necessary for such strategies in various ways:
! The DEPOSITION module of RAINS provides an easy option to explore the dispersionof pollutants for each individual emission source considered in the model, i.e., the spreadof emissions could be displayed for each of the 94 area sources and the 355 large pointsources separately. Thereby, it is possible to identify whether a specific source has strongimpacts on sensitive ecosystems.
! The DEPOSITION module of RAINS also enables the identification of the sourcescontributing to the deposition at a specific location.
! By using the energy module RESGEN the user can create new energy scenarios with adifferent regional allocation of newly built power station capacities, while maintaining theinternal consistencies of the regional energy balances.
! To enable fast exploration of the environmental impacts of re-located power stations, theDEPOSITION module of RAINS offers the option to change the location of individualpower stations without performing consistency checks on the energy balances.
This section provides examples of model use, aimed at a re-location of power stations with strongimpacts on sensitive ecosystems to less sensitive regions. Excess deposition of the referencescenario (base case energy pathway, no further emission control beyond current legislation, year2020) has been shown in Figure 7.7. ’Hot spots’, with exceedance of critical loads of more thanten grams sulfur/m /year occur, inter alia, in the Chinese Sichuan province and in the central and2
northern part of Thailand. Table 7.5 lists the contributions to deposition in the year 2020 for twogrids, based on the RAINS calculations.
Table 7.5 shows that some point sources make a significant, and often dominant, contribution tolocal deposition (e.g., the Chengdu power station contributes about 30 percent of total depositionto grid 105/30). Consequently, measures that focus on a few specific sources could significantlyimprove the local situation. However, emissions do not only have a local impact, but are dispersedvia the atmosphere to a larger area. To explore this feature, the RAINS model has been used tocreate Figure 7.14, displaying the spread of emissions and the resulting deposition from theLampang power station expected for the year 2020 under the reference scenario.

VII-26
Table 7.5 Contribution of sulfur deposition to two grids for the reference scenario for theyear 2020 in milligrams sulfur/m /year (note that some of the power stations are2
only foreseen for the year 2020 and do not yet exist!)
Grid 105/30 (Sichuan) Grid 100/18 (Northern Thailand)
Area sources:
China, Sichuan 10324 Thailand, Northern Highlands 1047
China, Chongquing 1085 Thailand, Bangkok 18
China, Yunnan 115 Thailand, other area sources 14
China, Shaanxi-G. 47
China, Guizhou 94 India (all sources) 15
China, Guiyang 28 China (all sources) 27
China, West Tibet 16 Bangladesh (all sources 3
China, Hubei 16 Other countries 3
China, Hebei 8
China, Hunan 5
China, Other Provinces 11
India, all sources 6
Large Point Sources
China, LPS N25 (Chengdu) 5901 Thailand, LPS 1 (Lampang) 2696
China, LPS N24 (Jianqou) 993 Thailand LPS 2 (Mae Moh) 4231
China, LPS 56 (Baima) 189 Thailand, 2 other LPS 10
China, LPS 4 (Chongqing) 129
China, LPS N1 (Luohang) 118
China, LPS N65 (Douba) 89
China, LPS N66 (Huayinshan) 65
China, LPS N59 (Xigu) 13
China, LPS 11 (Qinzhen) 13
China, LPS N22 (Jingyuan) 11
China, 10 other LPS 27
TOTAL 19303 TOTAL 8064
Critical load (25 percentile) 4035 Critical load (25 percentile) 490

VII-27
Figure 7.14 Sulfur deposition from the Lampang power station for the reference scenario (noemission control assumed) for the year 2020
The RAINS model could be used to explore the impact of reducing emissions at these powerstations by introducing various emission control options. Another way to limit environmentalimpacts could be to move individual stations to less sensitive areas. To illustrate the capacity ofthe model, this scenario assumes that some coal power stations, which make significantcontributions to excess deposition in sensitive ecosystems in the baseline scenario, are moved toless sensitive regions in the same country. Starting from the baseline scenario (no further emissioncontrol beyond current legislation) such moves have been assumed in China and Thailand (Box5). In China, four sources planned for construction in the heavily polluted region of the Sichuanprovince have been moved to the northern part of the country. For Thailand, the scenario exploresthe effects of moving two large point sources from the north of the country to the southernpeninsula. One of those sources has been simultaneously switched from lignite to imported hardcoal. It should be stressed that this scenario only illustrates the capabilities of the RAINS model:it does not suggest the technical, economic or political feasibility of such moves. To answer suchquestions, more detailed case studies on local energy supply, demand and power transmissionoptions will be necessary.

VII-28
Emissions in
2020, thousand
tons of SO2
Location
(long/lat)
before
move
after
move
China:
Sichuan, LPS N24
(Jianqou)
330 104/31 106/39
Sichuan, LPS N25
(Chengdu)
406 104/30 109/40
Sichuan, LPS 56
(Baima)
469 105/29 112/39
Sichuan, LPS N65
(Douba)
333 104/28 113/40
Thailand:
Centr. Valley, LPS 3
(Ao Phai)
542 100/13 98/8
North Highlands,
LPS 1 (Lampang)
617 99/18 99/9
Box 5: Relocations of power plants assumed in the scenario
It is outside of the scope of the RAINS model to determine the costs of such modified expansionplans. The model can, however, explore the environmental improvements, in terms of criticalloads achievement, of such measures. Even under the assumption that the relocated power stationswould not be equipped with desulfurization technologies, excess deposition in the hot spotsdeclines compared to the baseline reference scenario. For instance, in the Sichuan province inChina excess deposition in the grids affected by the moved sources decreased by about five to sixg/m -yr, whereas, due to the large tolerance of acid deposition of the ecosystems in the new2
locations, no major areas would experience excess deposition as a result of this measure (Figure7.15). Environmental improvements also occur in Thailand, where excess deposition in thenorthern part declines by about 50 percent.
It should be stressed again that this scenario has only an illustrative character, since the necessarysupport studies on the site conditions of the energy supply systems have not been carried out.

VII-29
Figure 7.15 Excess sulfur deposition for a scenario in which some new power stations in Chinaand Thailand are moved to ecologically less sensitive regions

VII-30
7.9 Implications of the energy efficiency pathway
All the six scenarios discussed above are based on certain assumptions about the development ofthe economies and of energy intensities. As will be shown, however, the volumes and thestructural composition of energy supply have a critical influence on the level of emissions. Thismeans that not only will emission levels be crucially dependent on the energy scenario, but alsothat energy policies promoting energy efficiency and use of cleaner fuels are importantinstruments to reduce pollution and pollution control costs.
To illustrate this fact this section compares calculations for some of the emission control scenariosdiscussed above, which are all based on the reference energy pathway, with control strategiesbased on the energy efficiency pathway. Table 7.6 shows that, due to a lower consumption offuels, SO emissions in the energy efficiency pathway are consistently lower than in the base case2
energy path. Consequently, emission control strategies based on the energy efficiency pathwayprovide better protection for the ecosystems than would result from the base case.
Furthermore, the table shows that, despite the lower emission levels resulting from the variouscontrol scenarios, the costs for achieving the (lower) emissions are also about 30 percent belowthe costs of the base case energy pathway. Since, as has been pointed out in Chapter 3 of thisreport, both energy pathways are based on the same economic development assumptions (e.g., thegrowth of GDP), the energy efficiency pathway would also alleviate the burdens imposed by SO2
control measures on the national economies. To carry the example case further, the cost of theabatement measures for the focused application of advanced control technologies (LACT)scenario based on the energy efficiency pathway in China, would amount to 0.29 percent of GDPinstead of the 0.41 percent calculated for the base case. At the same time China would face lessexcess deposition than in the reference case.

VII-31
Table 7.6 Comparison of emissions and emission control costs for the base case energypathway and the energy efficiency pathway
Emission control scenario
Energy Control Technology Technology Technologypathway (NFC) (BCT) (ACT) (BAT)
No Basic Advanced BestFurther Control Control Available
Emissions Base case 110.5 62.8 50.4 16.3(milliontons SO )2
Efficiency 80.1 47.1 39.1 12.4
Costs Base case 3.9 40.1 38.8 90.4(billion US$/yr)
Efficiency 2.0 26.9 25.5 65.6
7.10 Conclusions
If no countermeasures were taken, an initial analysis with the RAINS-Asia model indicates thatcurrently observed trends in energy consumption will impose significant environmental threatsto a variety of ecosystems in large parts of Asia. Within the next two to three decades, regionalSO emissions are expected to triple in Southeast Asia. In many areas, sulfur deposition will2
increase by more than a factor of five and exceed the levels observed in the most polluted areasin central and eastern Europe.
This increase in SO emissions, which is strongly connected with the presently observed and2
expected future growth of economic activities and energy consumption, will severely threaten thesustainable basis of many natural and agricultural ecosystems in the region. Taking the criticalloads estimated in this study as an indicator for sustainable levels of acid deposition, future sulfurdeposition will exceed critical loads by more than a factor of ten in wide parts of Asia.
The exploratory analysis carried out for this study demonstrates that there is a variety of measuresthat can be taken to reduce SO emissions and thereby avoid widespread excess deposition in the2
region. Advanced emission control technologies could reduce emissions below current levels evenin a high growth energy scenario, albeit at extremely high costs. Illustrative scenarios demonstratethe potential for an increase in the cost-effectiveness of strategies if measures are focused onspecific fuels, technologies, economic sectors, emission sources or ecologically sensitive regions.
The analysis shows that energy planning is also an important factor for controlling adverseenvironmental effects, in particular acidification. The development of carefully designed energysystems is of particular importance for controlling emissions in those countries considering an

VII-32
expansion or replacement of the present energy infrastructure.
RAINS-Asia is now available as a tool for the integrated assessment of strategies to keep SO2
emissions from energy use at acceptable levels. The model enables the comparison of regionalemissions, deposition and ecosystem protection levels resulting from different energydevelopment pathways and from different emission control strategies. It simulates the effects ofspecific technologies and measures for a variety of fuel types and economic sectors, applicableto any of the 94 regions and 355 large point sources considered in the RAINS-Asia model. Themodel provides estimates of the emission control costs for each source, and assesses protectionlevels for up to 31 types of different ecosystems in Asia.
The analysis presented in this study has to be seen as an initial attempt to develop the necessarytools required for an integrated assessment of regional energy development that takesenvironmental impacts at different spatial and temporal scales into consideration. Although majorprogress towards this goal has been achieved, several aspects have to be further improved oradded into the analysis. Special attention should be devoted to validation of the various modelsand databases developed in the first phase of the project. An important element currently missingis the development of the huge urban agglomerations in Southeast Asia, which may put severepressure on local and regional air quality. Furthermore, refined methods of uncertainty androbustness analysis will have to be developed to assess the accuracy and reliability of modelresults.

VII-33
References
Amann M., Klaassen G., Schoepp W., 1993: Closing the Gap Between the 1990 Deposition andthe Critical Sulfur Deposition Values. Background Paper for the UN/ECE Task Force onIntegrated Assessment Modelling, UN/ECE, Geneva, Switzerland.
IUFRO (International Union of Forest Research Organizations), 1978: Resolution über MaximaleImmissionsraten zum Schutze der Wälder. Fachtagung Laibach/Jugoslawien 18 - 23 September1978.
WHO (World Health Organization), 1979: Environmental Health Criteria 8 - Sulfur Dioxide.Geneva, Switzerland.
Zhao D., Mao J., Xiong J., Zhuang X., Yang J., 1995: Critical Load of Sulfur Deposition forEcosystem and its Application in China. Research Center for Eco-Environmental Sciences,Academia Sinica, Beijing, China, pp.23.