quantitative method: multiple linear regression with interaction
TRANSCRIPT

Quantitative Methods
Multiple Linear Regression
with Interaction Terms
(2005)
Keiko Ono, Ph.D. 1

2
Review bivariate/multiple regression
Multiple regression with interaction terms
3
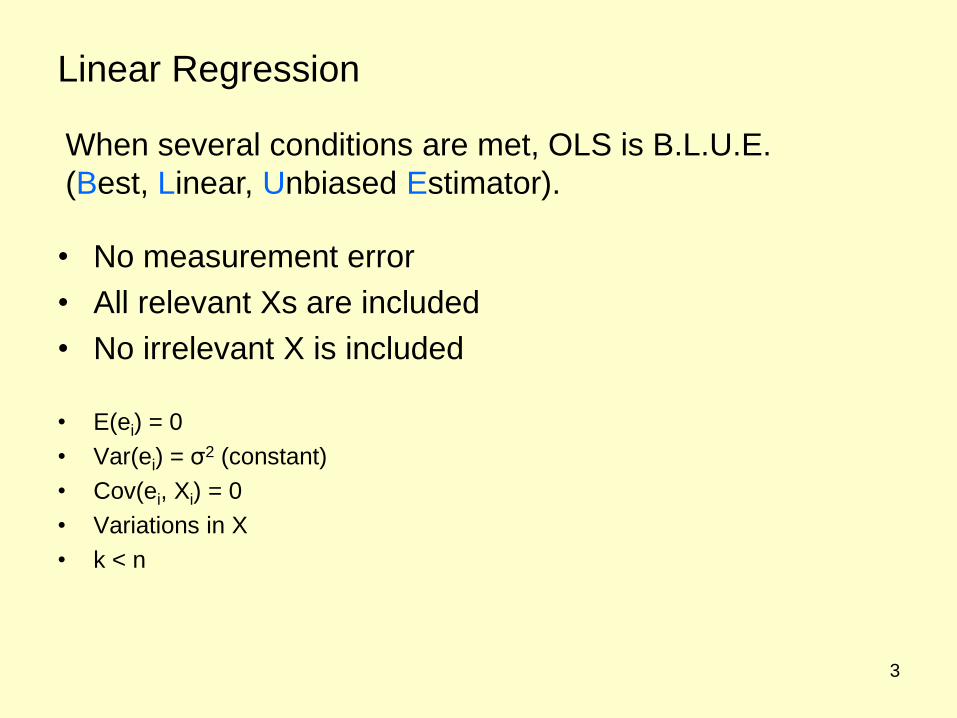
Linear Regression
• No measurement error
• All relevant Xs are included
• No irrelevant X is included
• E(ei) = 0
• Var(ei) = σ2 (constant)
• Cov(ei, Xi) = 0
• Variations in X
• k < n
When several conditions are met, OLS is B.L.U.E.
(Best, Linear, Unbiased Estimator).

4
0.00 5.00 10.00 15.00 20.00 25.00
Percent workers who are union members
30.0
40.0
50.0
60.0P
erc
en
t vo
tin
g f
or
Kerr
y 2
00
4
Linear Regression: which line fits the data best?

5
Y
constant
0 X
Y = α + β X
Y = αhat+ βhatXi + εi
. .
.
. The OLS regression line
minimizes the sum of
squared errors. Error =
Linear Regression

6
Linear Regression
Linear Regression
5.00 10.00 15.00 20.00 25.00
Percent workers who are union members
30.0
40.0
50.0
60.0P
erc
en
t v
oti
ng
fo
r K
err
y 2
004
Percent voting for Kerry 2004 = 35.54 + 0.87 * union
R-Square = 0.34

7
Bivariate and Multiple Regression
Arm length
Studies have shown repeatedly that children with longer arms reason
better than those with shorter arms. Should we start giving kids
calcium supplement to grow arms so they will do better in school?
Intelligence
?
Age
Intelligence = α + βAge*Age + βArm length *Arm length

8
Multiple Regression with two interval level
independent variables
X1
X2
Y
We can’t visualize
multiple regression
with more than two
independent variables
for obvious reason. X1i
X2j
Yi
Y = α+ β1X1 +β2X2
α
9
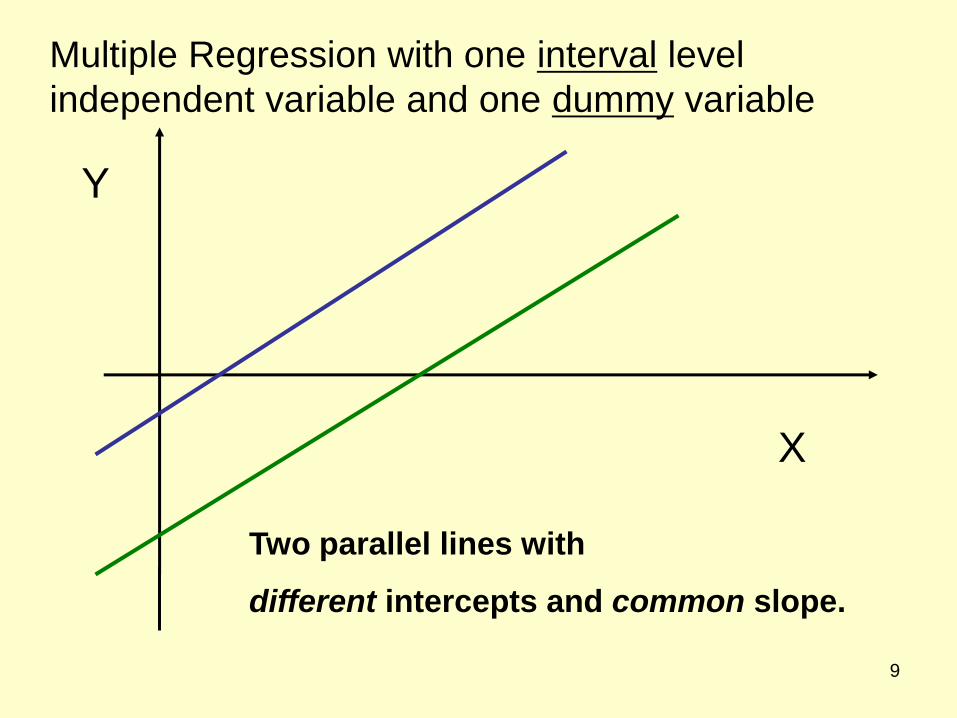
Y
X
Two parallel lines with
different intercepts and common slope.
Multiple Regression with one interval level
independent variable and one dummy variable

10
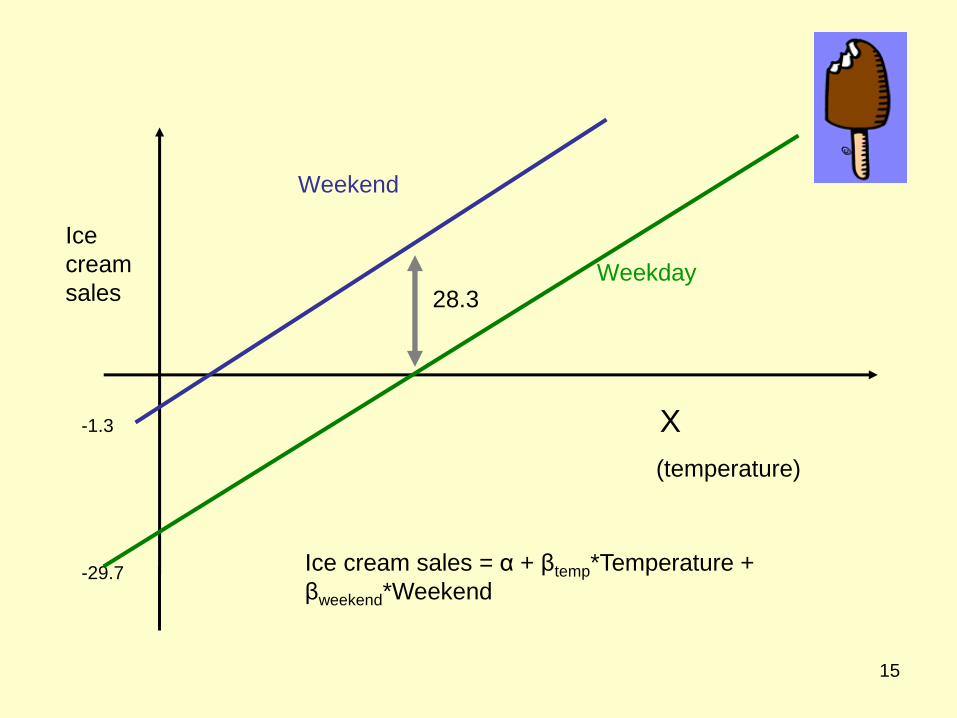
Weekend
Weekday
-1.3 X
(temperature)
-29.7
28.3
Multiple Regression with dummy variable
Other example (1)
Ice
cream
sales
Ice cream sales = α + βtemp*Temperature +
βweekend*Weekend

11
Multiple Regression with dummy variable
Other examples (2)
Pay
($)
Experience
Pay = α + βexperience*Experience + βmale*Male
Male-female
difference

12
Hillary FT
Dem Party (or Bill Clinton) FT
Multiple Regression with multiple interval level independent
variables and multiple dummy variables
12.7
12.7- 5.6 = 7.1
12.7- 5.6 – 2.9 = 4.2
12.7- 2.9 = 9.8

13
Hillary FT
Dem Party (or Bill Clinton) FT
Multiple Regression with multiple interval level independent
variables and multiple dummy variables
12.7
12.7- 5.6 = 7.1
12.7- 5.6 – 2.9 = 4.2
12.7- 2.9 = 9.8
Non-white female Non-white male
White female
White male

14
Hillary FT
Democrat Party ID Republican
Multiple Regression with multiple interval level independent
variables and multiple dummy variables
12.7
12.7- 5.6 = 7.1
12.7- 5.6 – 2.9 = 4.2
12.7- 2.9 = 9.8 Non-white female
Non-white male White female
White male
15
Weekend
Weekday
-1.3 X
(temperature)
-29.7
28.3
Ice
cream
sales
Ice cream sales = α + βtemp*Temperature +
βweekend*Weekend

16
Interaction example (1)
Ice
cream
sales
Weekend
Weekday
Weekend
Weekday
Temperature
Temperature

17
Interaction example (2)
Pay
($)
Experience
Pay
($)
Experience

18
Interaction example (3)
Bone
density
Cola Consumption
Alcohol
tolerance
Body weight
Male
Female
19
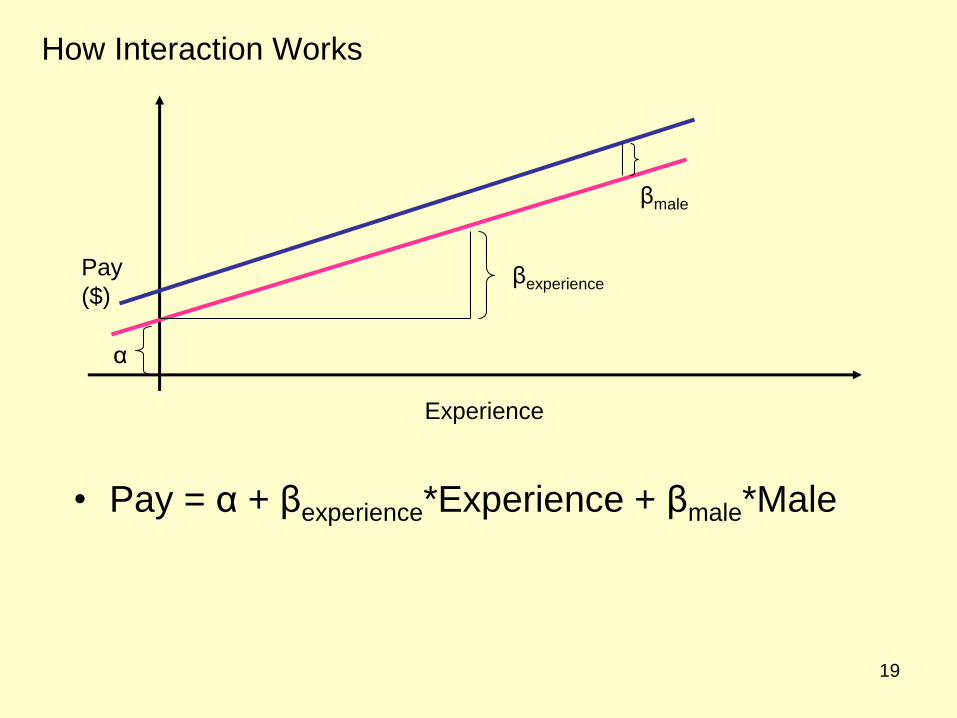
How Interaction Works
• Pay = α + βexperience*Experience + βmale*Male
Pay
($)
Experience
α
βexperience
βmale
20
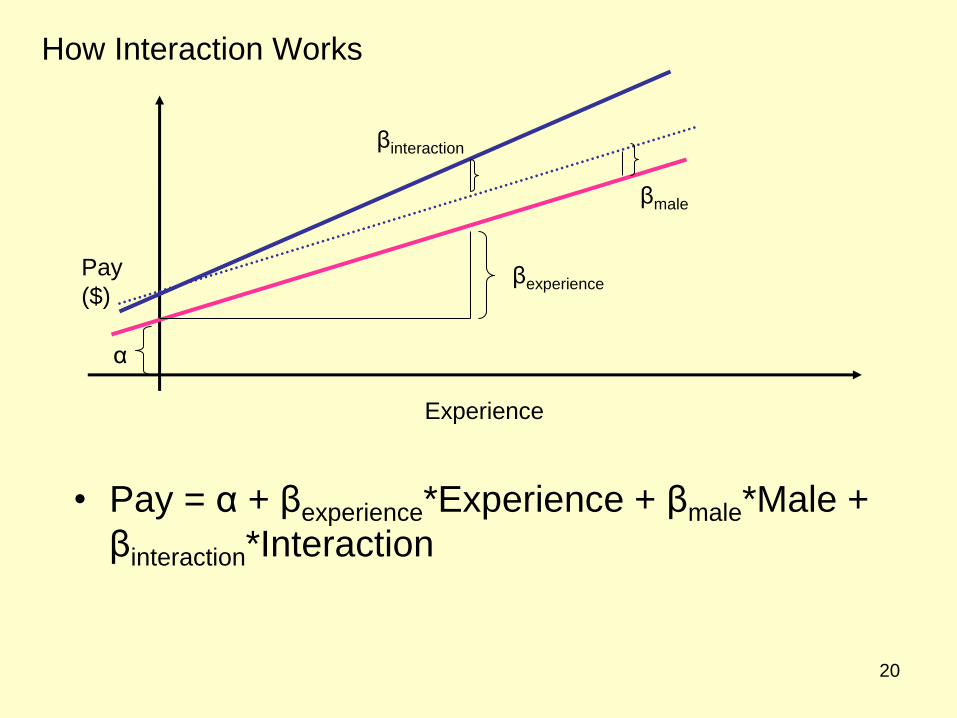
How Interaction Works
• Pay = α + βexperience*Experience + βmale*Male +
βinteraction*Interaction
Pay
($)
Experience
α
βexperience
βmale
βinteraction
21
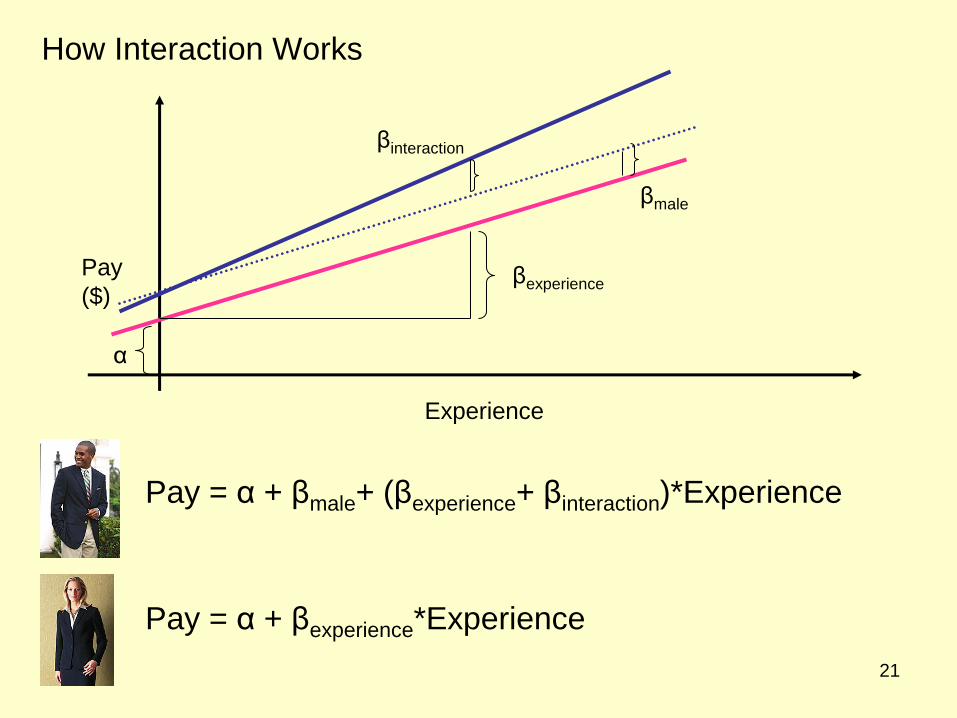
How Interaction Works
Pay = α + βmale+ (βexperience+ βinteraction)*Experience
Pay = α + βexperience*Experience
Pay
($)
Experience
α
βexperience
βmale
βinteraction

22
How Interaction Works
Both cases (male, female) can be summarized by the
following single equation.
Pay = α + βexperience*Experience + βmale*Male +
βinteraction*Interaction
Interaction : Male*Experience
Pay
($)
Experience
α
βexperience
βmale
βinteraction

23
Multiple Regression with Interaction
• Interaction term is a variable
• It allows slopes to diverge between Group 1 (1) and
Group 2 (0)
• It measures the difference in slope b/w Group 1 (1) and
Group 2 (0)
• It is created by multiplying dummy variable and the
interval level variable of interest
• When βinteraction > 0, the effect of X on Group 1 is greater
than its effect on Group 2. The slope will be steeper.
• When βinteraction < 0, the effect of X on Group 1 is smaller
than its effect on Group 2. The slope will be less steep.
•
24
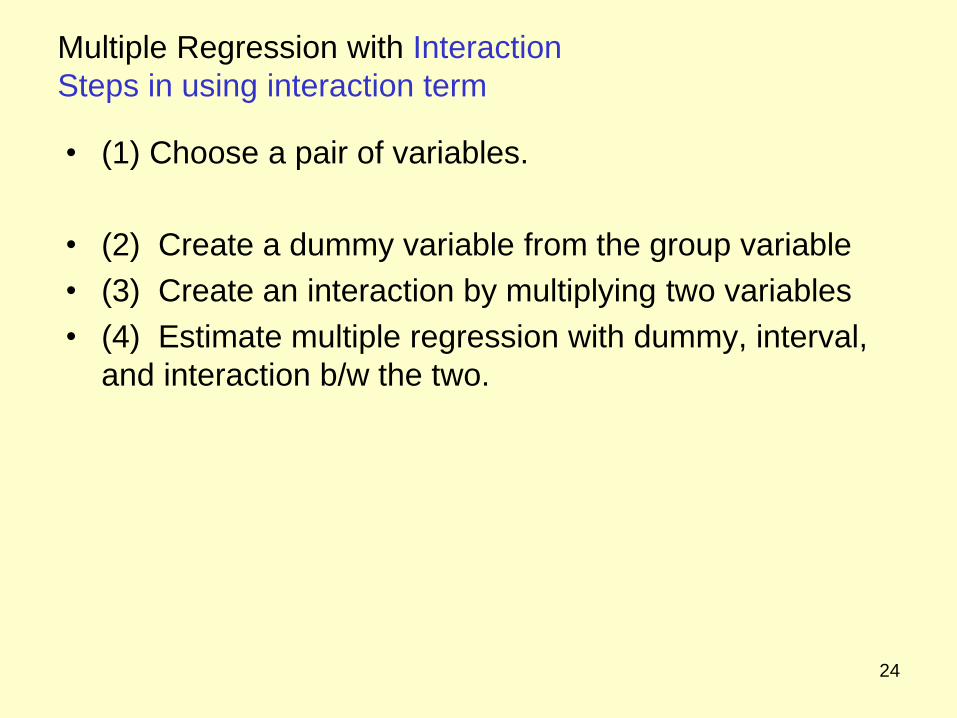
Multiple Regression with Interaction
Steps in using interaction term
• (1) Choose a pair of variables.
• (2) Create a dummy variable from the group variable
• (3) Create an interaction by multiplying two variables
• (4) Estimate multiple regression with dummy, interval,
and interaction b/w the two.

25
Multiple Regression with Interaction

26
Example: Democratic Presidential Vote and African
American % in States (2000)
• Dependent variable?
• Independent variable?
27
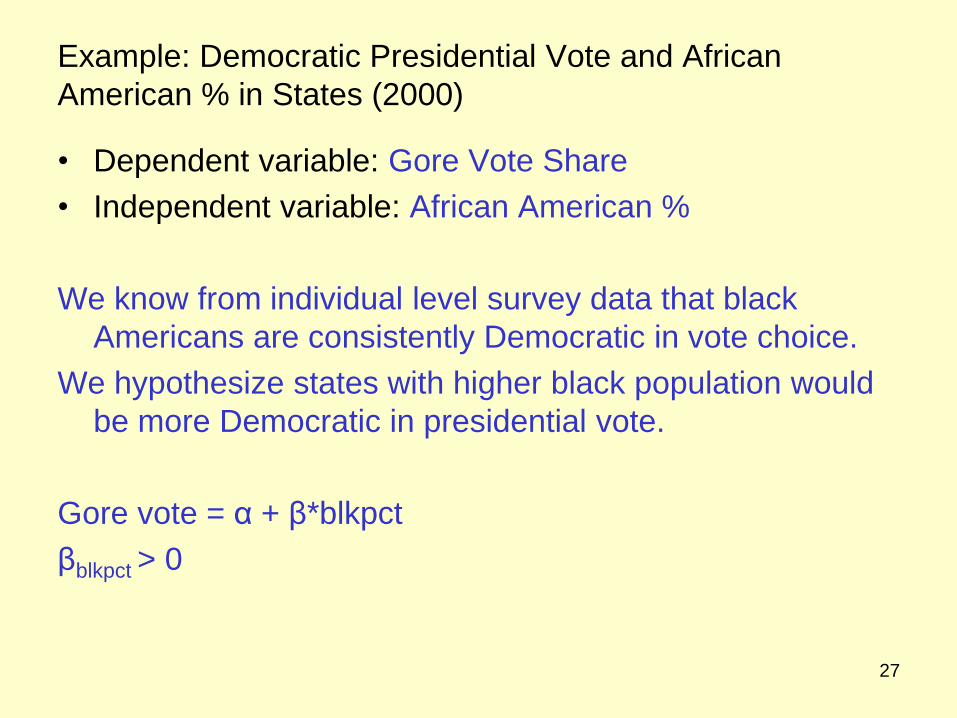
Example: Democratic Presidential Vote and African
American % in States (2000)
• Dependent variable: Gore Vote Share
• Independent variable: African American %
We know from individual level survey data that black
Americans are consistently Democratic in vote choice.
We hypothesize states with higher black population would
be more Democratic in presidential vote.
Gore vote = α + β*blkpct
βblkpct > 0

28
Example: Democratic Presidential Vote and African
American % in States (2000)
0.00 10.00 20.00 30.00
Percent black
30.00
40.00
50.00
60.00P
erc
en
t v
oti
ng
fo
r G
ore
2000
AL
AK
AZAR
CA
CO
CTDE
FL
GA
HI
ID
IL
IN
IA
KS
KY
LA
ME
MD
MA
MI
MN
MS
MO
MT NE
NVNH
NJ
NM
NY
NC
ND
OH
OK
OR
PA
RI
SC
SD
TN
TX
UT
VT
VA
WA
WV
WI
WY

29
Example: Democratic Presidential Vote and African
American % in States (2000)
Linear Regression
0.00 10.00 20.00 30.00
Percent black
30.00
40.00
50.00
60.00
Perc
en
t v
oti
ng
fo
r G
ore
20
00
AL
AK
AZAR
CA
CO
CTDE
FL
GA
HI
ID
IL
IN
IA
KS
KY
LA
ME
MD
MA
MI
MN
MS
MO
MT NE
NVNH
NJ
NM
NY
NC
ND
OH
OK
OR
PA
RI
SC
SD
TN
TX
UT
VT
VA
WA
WV
WI
WY
Percent voting for Gore 2000 = 43.40 + 0.18 * blkpct
R-Square = 0.04

30
Example: Democratic Presidential Vote and African
American % in States (2000)
Gore vote = α + β*blkpct
βblkpct > 0

31
Example: Democratic Presidential Vote and African
American % in States (2000)
Gore vote = α + β*blkpct + β*south
βblkpct > 0
βsouth < 0

32
Example: Democratic Presidential Vote and
African American % in States (2000)
state blkpct gore00 region south
Alabama 26.01 41.57 3 South
Alaska 3.91 27.67 4 West
Arizona 3.62 44.73 4 West
Arkansas 16.08 45.86 3 South
California 7.52 53.45 4 West
Colorado 4.33 42.39 4 West
Connecticut 9.29 55.91 1 Northeast
Delaware 19.35 54.96 3 South
Florida 15.21 48.84 3 South
Georgia 28.54 42.98 3 South
Hawaii 2.93 55.79 4 West
Idaho 0.57 27.64 4 West
Illinois 15.28 54.60 2 Midwest
Indiana 8.32 41.01 2 Midwest
Iowa 1.99 48.54 2 Midwest
Kansas 5.90 37.24 2 Midwest
Kentucky 7.24 41.37 3 South
Louisiana 32.20 44.88 3 South
Maine 0.48 49.09 1 Northeast

33
Example: Democratic Presidential Vote and
African American % in States (2000) state blkpct gore00 region south
Alabama 26.01 41.57 3 South 1
Alaska 3.91 27.67 4 West 0
Arizona 3.62 44.73 4 West 0
Arkansas 16.08 45.86 3 South 1
California 7.52 53.45 4 West 0
Colorado 4.33 42.39 4 West 0
Connecticut 9.29 55.91 1 Northeast 0
Delaware 19.35 54.96 3 South 1
Florida 15.21 48.84 3 South 1
Georgia 28.54 42.98 3 South 1
Hawaii 2.93 55.79 4 West 0
Idaho 0.57 27.64 4 West 0
Illinois 15.28 54.60 2 Midwest 0
Indiana 8.32 41.01 2 Midwest 0
Iowa 1.99 48.54 2 Midwest 0
Kansas 5.90 37.24 2 Midwest 0
Kentucky 7.24 41.37 3 South 1
Louisiana 32.20 44.88 3 South 1
Maine 0.48 49.09 1 Northeast 0
There are 16 “South” states (includes a few non-Confederate states such as WV, MD, KY, DE).
34
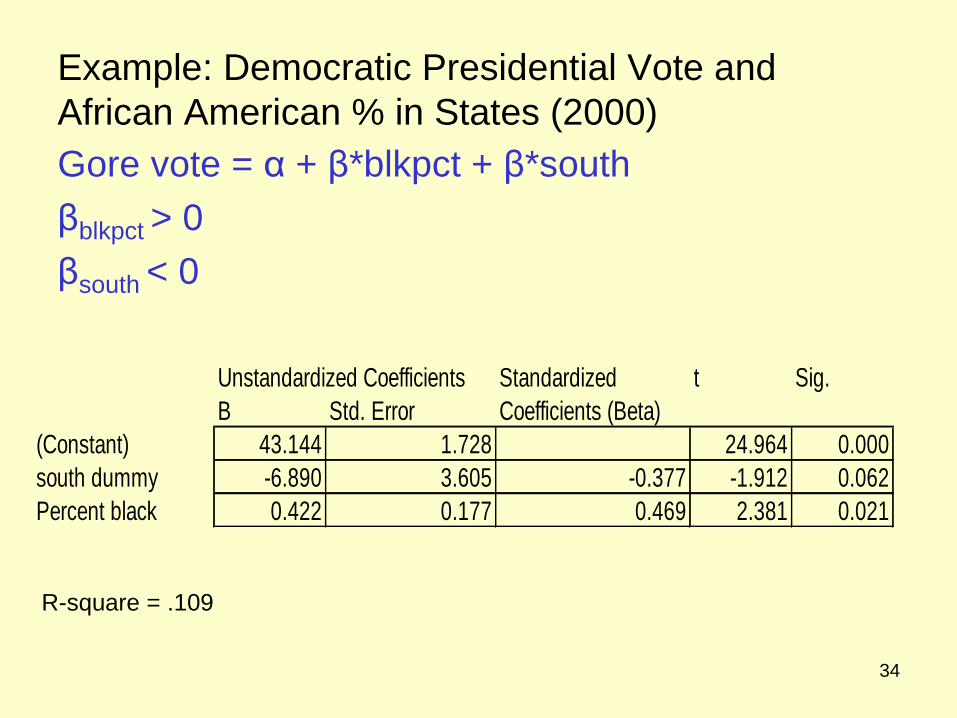
Example: Democratic Presidential Vote and
African American % in States (2000)
Unstandardized Coefficients Standardized t Sig.
B Std. Error Coefficients (Beta)
(Constant) 43.144 1.728 24.964 0.000
south dummy -6.890 3.605 -0.377 -1.912 0.062
Percent black 0.422 0.177 0.469 2.381 0.021
Gore vote = α + β*blkpct + β*south
βblkpct > 0
βsouth < 0
R-square = .109

35
Example: Democratic Presidential Vote and African
American % in States (2000)
0.00 10.00 20.00 30.00
Percent black
30.00
40.00
50.00
60.00P
erc
en
t v
oti
ng
fo
r G
ore
2000
AL
AK
AZAR
CA
CO
CTDE
FL
GA
HI
ID
IL
IN
IA
KS
KY
LA
ME
MD
MA
MI
MN
MS
MO
MT NE
NVNH
NJ
NM
NY
NC
ND
OH
OK
OR
PA
RI
SC
SD
TN
TX
UT
VT
VA
WA
WV
WI
WY
South
Non-
South
36
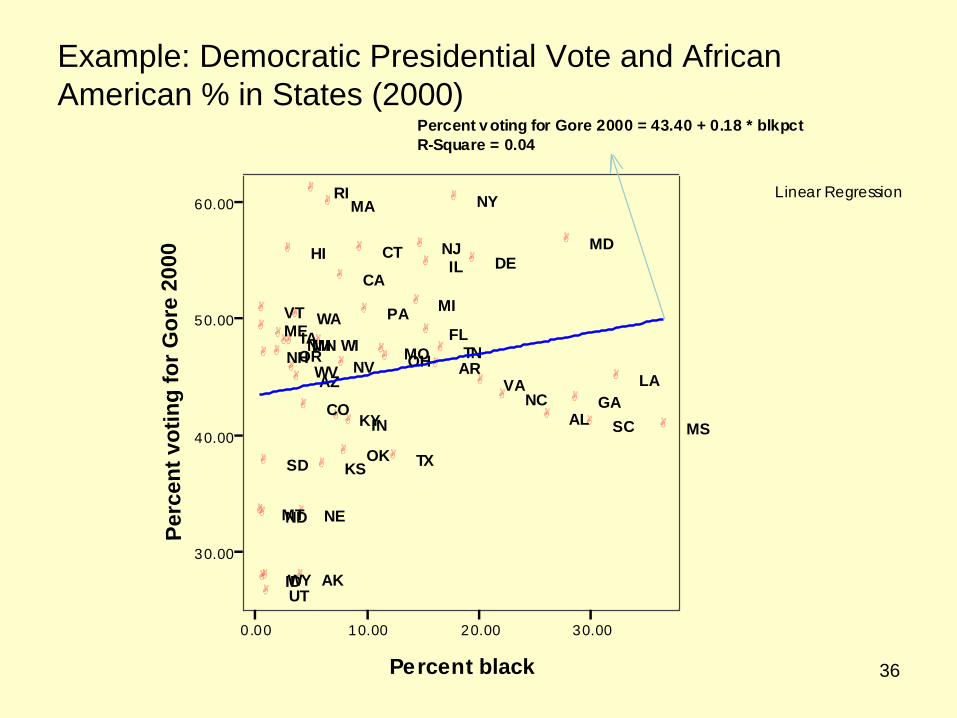
Example: Democratic Presidential Vote and African
American % in States (2000)
Linear Regression
0.00 10.00 20.00 30.00
Percent black
30.00
40.00
50.00
60.00
Perc
en
t v
oti
ng
fo
r G
ore
20
00
AL
AK
AZAR
CA
CO
CTDE
FL
GA
HI
ID
IL
IN
IA
KS
KY
LA
ME
MD
MA
MI
MN
MS
MO
MT NE
NVNH
NJ
NM
NY
NC
ND
OH
OK
OR
PA
RI
SC
SD
TN
TX
UT
VT
VA
WA
WV
WI
WY
Percent voting for Gore 2000 = 43.40 + 0.18 * blkpct
R-Square = 0.04

37
Example: Democratic Presidential Vote and African
American % in States (2000)
Gore vote = α + β*blkpct + β*south + β*interaction
(south*blkpct)
βblkpct > 0
βsouth < 0
βinteraction < 0
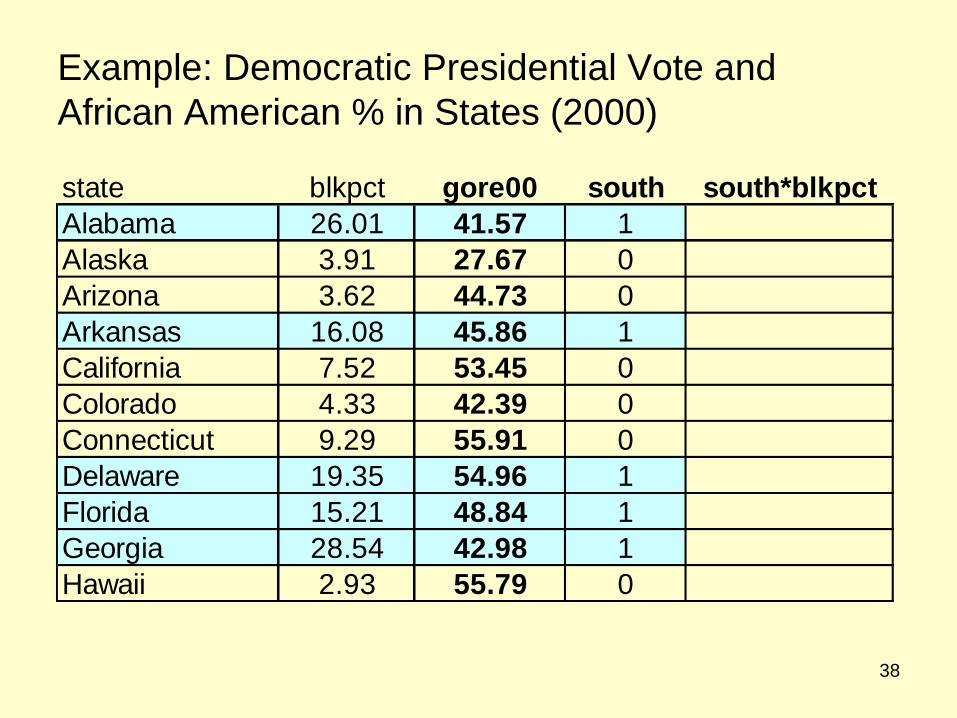
38
Example: Democratic Presidential Vote and
African American % in States (2000)
state blkpct gore00 south south*blkpct
Alabama 26.01 41.57 1
Alaska 3.91 27.67 0
Arizona 3.62 44.73 0
Arkansas 16.08 45.86 1
California 7.52 53.45 0
Colorado 4.33 42.39 0
Connecticut 9.29 55.91 0
Delaware 19.35 54.96 1
Florida 15.21 48.84 1
Georgia 28.54 42.98 1
Hawaii 2.93 55.79 0
39
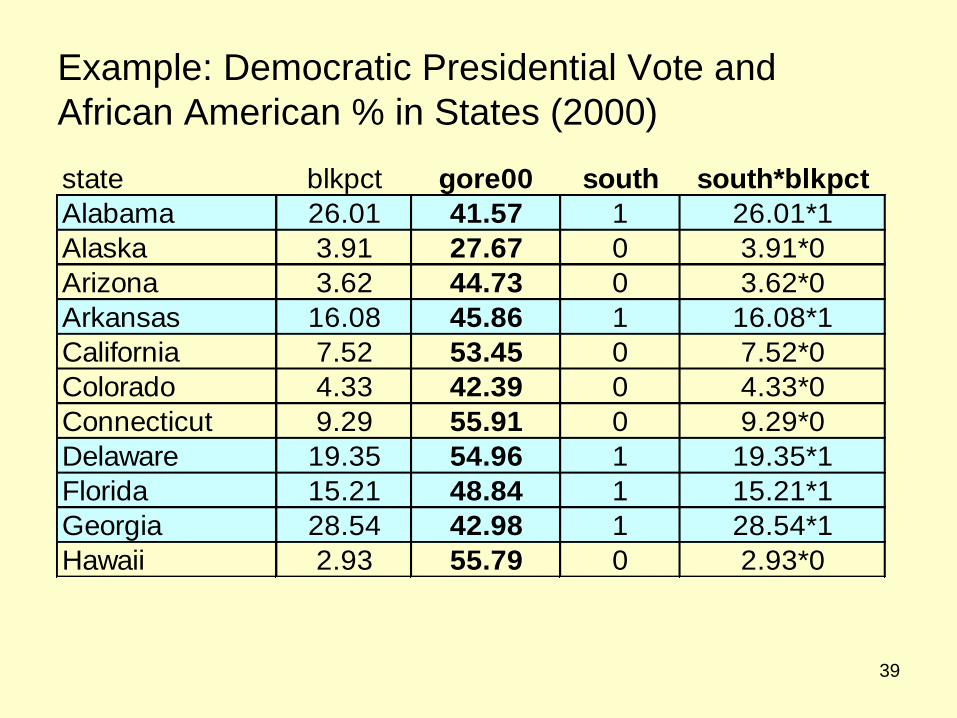
Example: Democratic Presidential Vote and
African American % in States (2000)
state blkpct gore00 south south*blkpct
Alabama 26.01 41.57 1 26.01*1
Alaska 3.91 27.67 0 3.91*0
Arizona 3.62 44.73 0 3.62*0
Arkansas 16.08 45.86 1 16.08*1
California 7.52 53.45 0 7.52*0
Colorado 4.33 42.39 0 4.33*0
Connecticut 9.29 55.91 0 9.29*0
Delaware 19.35 54.96 1 19.35*1
Florida 15.21 48.84 1 15.21*1
Georgia 28.54 42.98 1 28.54*1
Hawaii 2.93 55.79 0 2.93*0
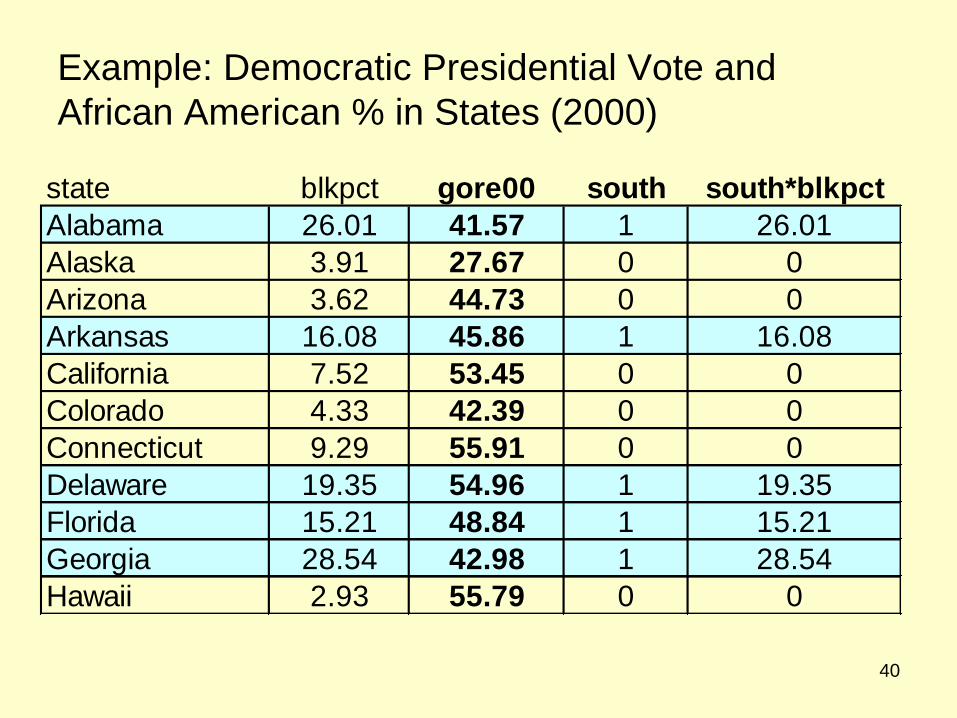
40
Example: Democratic Presidential Vote and
African American % in States (2000)
state blkpct gore00 south south*blkpct
Alabama 26.01 41.57 1 26.01
Alaska 3.91 27.67 0 0
Arizona 3.62 44.73 0 0
Arkansas 16.08 45.86 1 16.08
California 7.52 53.45 0 0
Colorado 4.33 42.39 0 0
Connecticut 9.29 55.91 0 0
Delaware 19.35 54.96 1 19.35
Florida 15.21 48.84 1 15.21
Georgia 28.54 42.98 1 28.54
Hawaii 2.93 55.79 0 0

41
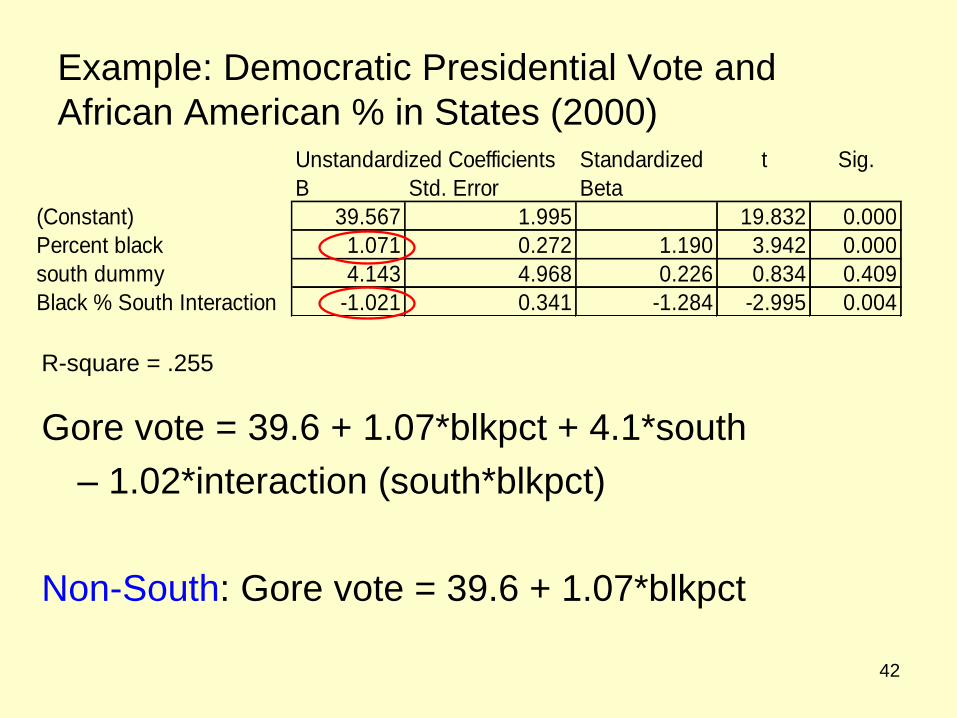
Example: Democratic Presidential Vote and
African American % in States (2000)
Unstandardized Coefficients Standardized t Sig.
B Std. Error Beta
(Constant) 39.567 1.995 19.832 0.000
Percent black 1.071 0.272 1.190 3.942 0.000
south dummy 4.143 4.968 0.226 0.834 0.409
Black % South Interaction -1.021 0.341 -1.284 -2.995 0.004
R-square = .255
Gore vote = 39.6 + 1.07*blkpct + 4.1*south
– 1.02*interaction (south*blkpct)
42
Example: Democratic Presidential Vote and
African American % in States (2000) Unstandardized Coefficients Standardized t Sig.
B Std. Error Beta
(Constant) 39.567 1.995 19.832 0.000
Percent black 1.071 0.272 1.190 3.942 0.000
south dummy 4.143 4.968 0.226 0.834 0.409
Black % South Interaction -1.021 0.341 -1.284 -2.995 0.004
R-square = .255
Gore vote = 39.6 + 1.07*blkpct + 4.1*south
– 1.02*interaction (south*blkpct)
Non-South: Gore vote = 39.6 + 1.07*blkpct

43
Example: Democratic Presidential Vote and
African American % in States (2000) Unstandardized Coefficients Standardized t Sig.
B Std. Error Beta
(Constant) 39.567 1.995 19.832 0.000
Percent black 1.071 0.272 1.190 3.942 0.000
south dummy 4.143 4.968 0.226 0.834 0.409
Black % South Interaction -1.021 0.341 -1.284 -2.995 0.004
R-square = .255
Gore vote = 39.6 + 1.07*blkpct + 4.1*south
– 1.02*interaction (south*blkpct)
South: Gore vote = 39.6 + 4.1 + (1.07-1.02)*blkpct
Non-South: Gore vote = 39.6 + 1.07*blkpct

44
Example: Democratic Presidential Vote and African
American % in States (2000)
0.00 10.00 20.00 30.00
Percent black
30.00
40.00
50.00
60.00P
erc
en
t v
oti
ng
fo
r G
ore
2000
AL
AK
AZAR
CA
CO
CTDE
FL
GA
HI
ID
IL
IN
IA
KS
KY
LA
ME
MD
MA
MI
MN
MS
MO
MT NE
NVNH
NJ
NM
NY
NC
ND
OH
OK
OR
PA
RI
SC
SD
TN
TX
UT
VT
VA
WA
WV
WI
WY
South
Non-
South