a (second-order) multiple regression model with interaction terms
TRANSCRIPT

A (second-order) multiple regression model with interaction terms

A example in which the predictors do not interact
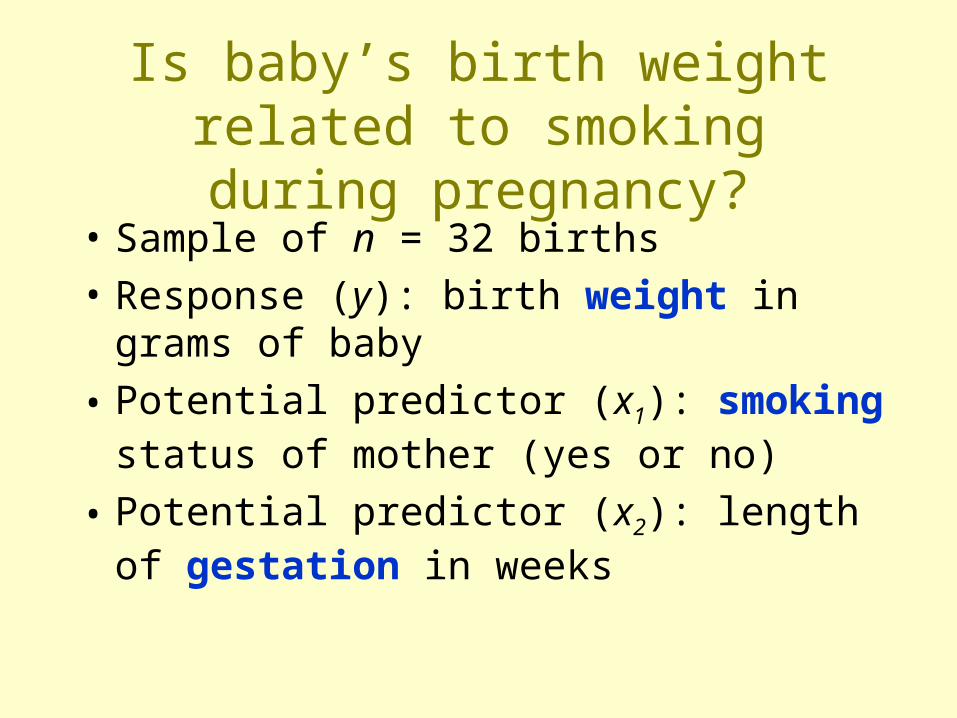
Is baby’s birth weight related to smoking during pregnancy?
• Sample of n = 32 births
• Response (y): birth weight in grams of baby
• Potential predictor (x1): smoking status of mother (yes or no)
• Potential predictor (x2): length of gestation in weeks
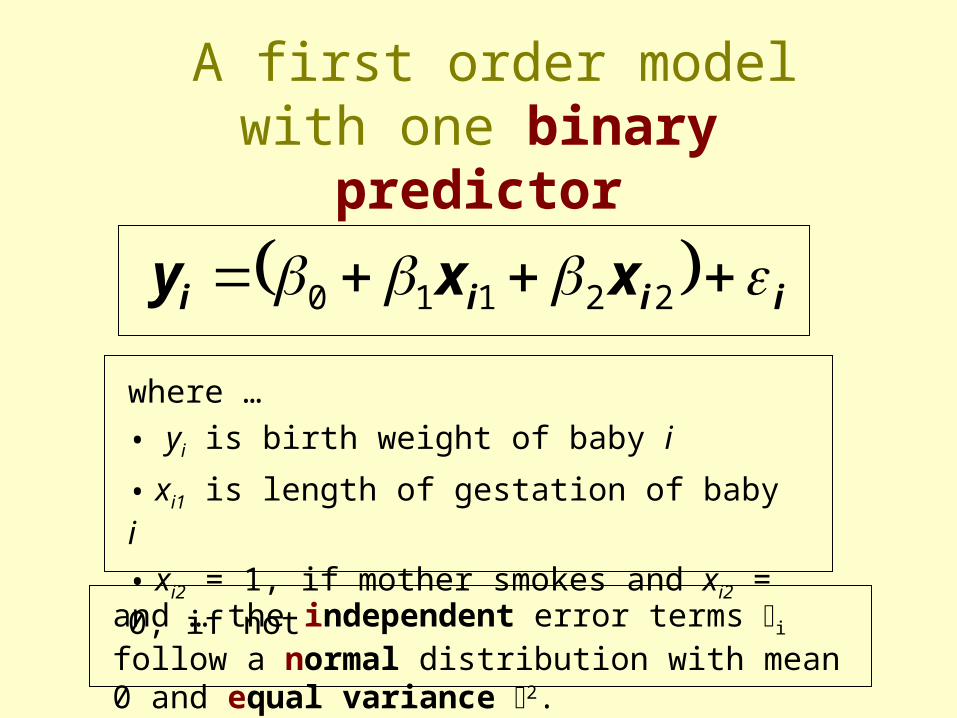
A first order modelwith one binary predictor
iiii xxy 22110
where …
• yi is birth weight of baby i
• xi1 is length of gestation of baby i
• xi2 = 1, if mother smokes and xi2 = 0, if not
and … the independent error terms i follow a normal distribution with mean 0 and equal variance 2.

Estimated first order modelwith one binary predictor
0 1
424140393837363534
3700
3200
2700
2200
Gestation (weeks)
Wei
ght (
gram
s)
The regression equation isWeight = - 2390 + 143 Gest - 245 Smoking

In what way do the predictors have an “additive effect” on the response?
• The effect of smoking on the mean birth weight is the same for all gestation lengths. (Exhibited by parallel lines.)
• The effect of gestation length on the mean birth weight is the same for smokers and non-smokers. (Exhibited by parallel lines.)
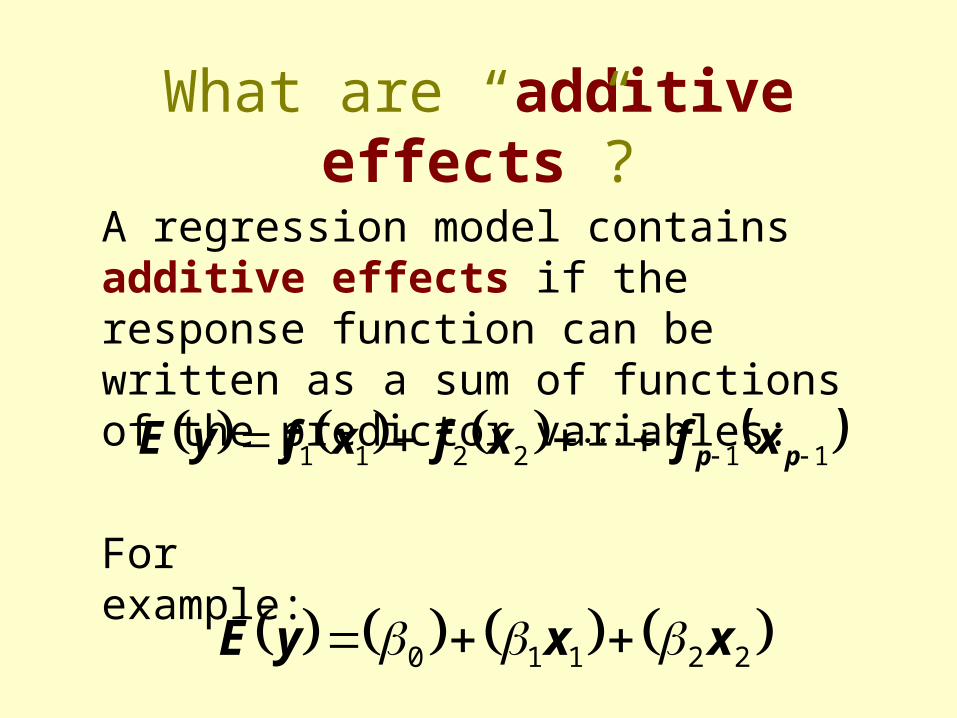
What are “additive effects”?
A regression model contains additive effects if the response function can be written as a sum of functions of the predictor variables:
112211 pp xfxfxfyE
22110 xxyE
For example:

An example where including “interaction terms” is appropriate

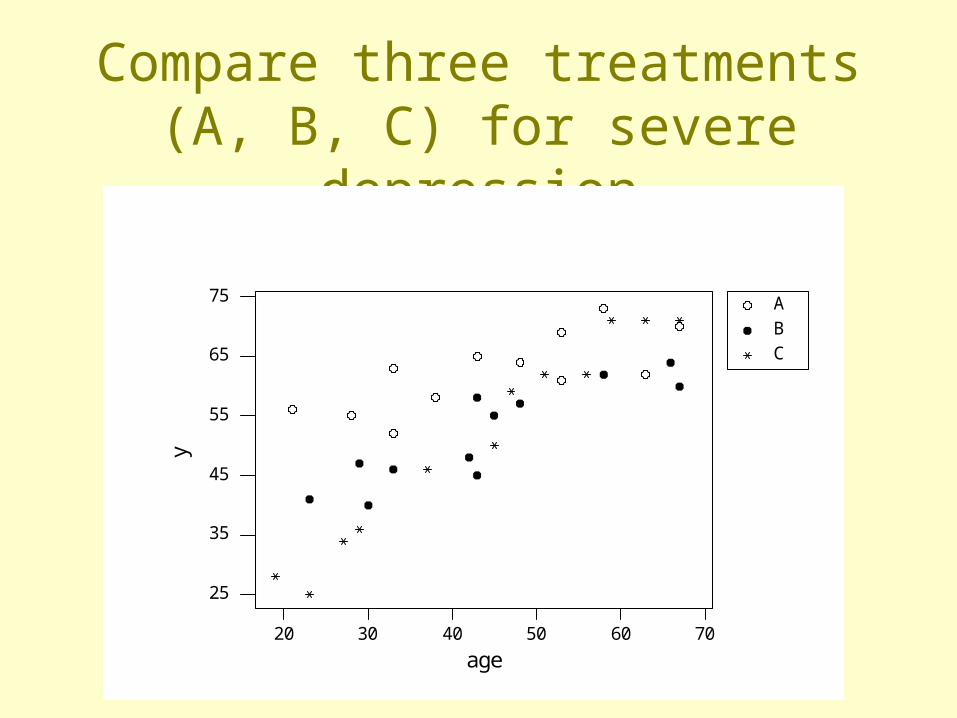
Compare three treatments (A, B, C) for severe depression
• Random sample of n = 36 severely depressed individuals.
• y = measure of treatment effectiveness
• x1 = age (in years)
• x2 = 1 if patient received A and 0, if not
• x3 = 1 if patient received B and 0, if not
Compare three treatments (A, B, C) for severe depression
A B C
706050403020
75
65
55
45
35
25
age
y
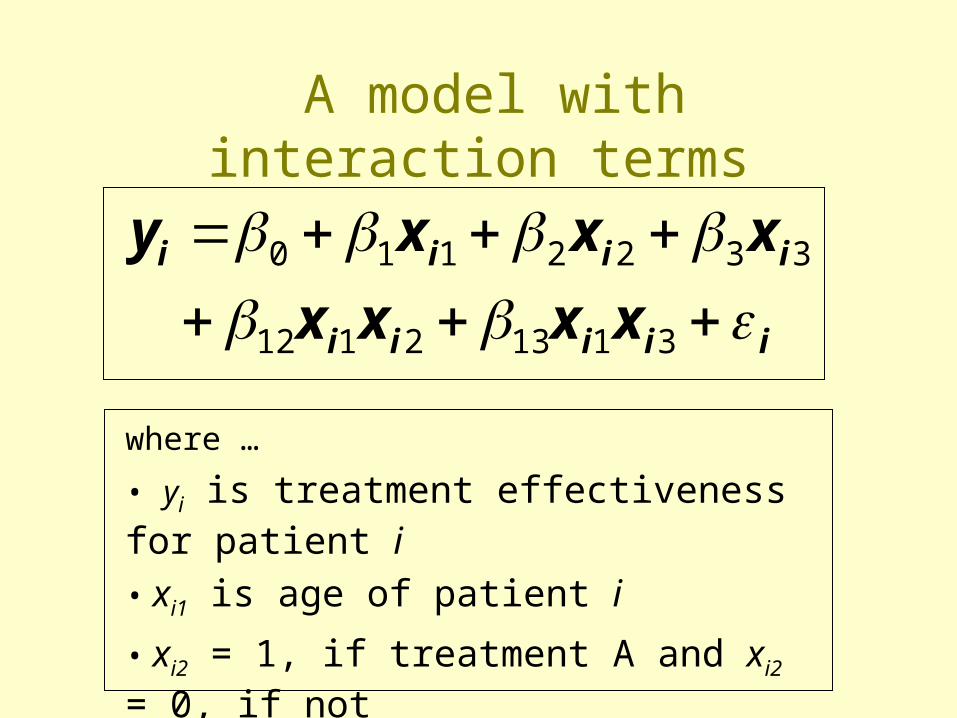
A model with interaction terms
iiiii
iiii
xxxx
xxxy
31132112
3322110
where …
• yi is treatment effectiveness for patient i
• xi1 is age of patient i
• xi2 = 1, if treatment A and xi2 = 0, if not
• xi3 = 1, if treatment B and xi3 = 0, if not

If patient received B (xi2 = 0, xi3 = 1):
If patient received A (xi2 = 1, xi3 = 0): 112120 ii xyE
iiiiiiiii xxxxxxxy 311321123322110
113130 ii xyE
If patient received C (xi2 = 0, xi3 = 0): 110 ii xyE
In what way do the predictors have an “interaction effect” on the response?

In what way do the predictors have an “interaction effect” on the response?
• The effect of treatment on the treatment’s effectiveness depends on the individual’s age. (Exhibited by non-parallel lines.)
• The effect of the individual’s age on the treatment’s effectiveness depends on the treatment. (Exhibited by non-parallel lines.)

What does it mean for two predictors “to interact”?
• In general, two predictors interact if the effect on the response variable of one predictor depends on the value of the other.
• A slope parameter can no longer be interpreted as the change in the mean response for each unit increase in the predictor, while the other predictors are held constant.

What are “interaction effects”?
A regression model contains interaction effects if the response function cannot be written as a sum of functions of the predictor variables:
211222110 xxxxyE
For example:
112211 pp xfxfxfyE
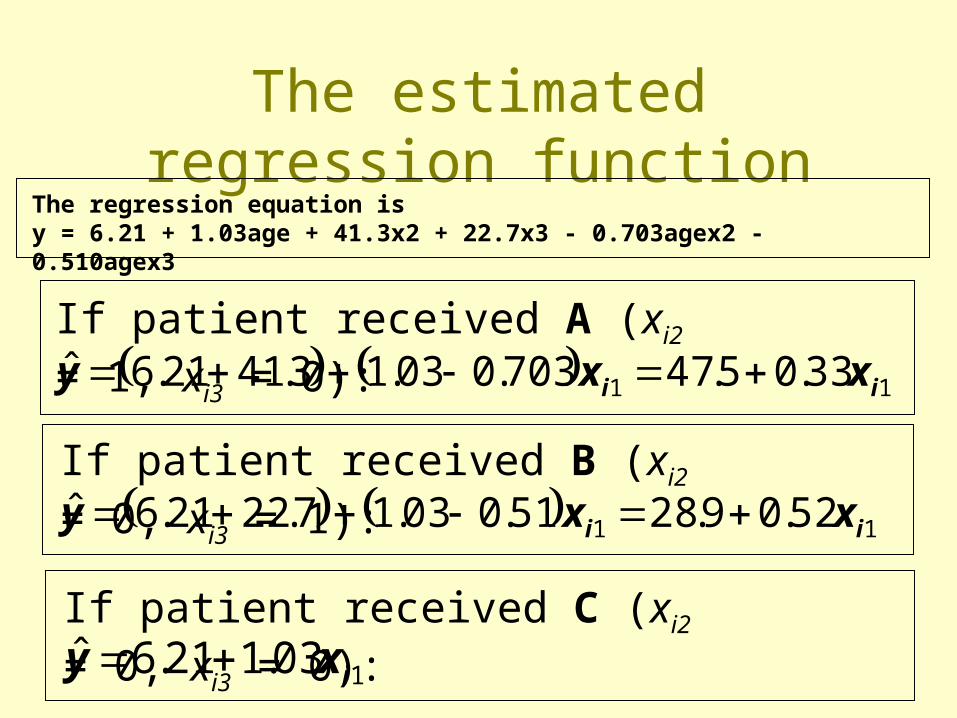
The estimated regression function
If patient received B (xi2 = 0, xi3 = 1):
If patient received A (xi2 = 1, xi3 = 0): 11 33.05.47703.003.13.4121.6ˆ ii xxy
If patient received C (xi2 = 0, xi3 = 0):
103.121.6ˆ ixy
The regression equation isy = 6.21 + 1.03age + 41.3x2 + 22.7x3 - 0.703agex2 - 0.510agex3
11 52.09.2851.003.17.2221.6ˆ ii xxy

The estimated regression function
A B
C
706050403020
80
70
60
50
40
30
20
age
y
y = 47.5 + 0.33x
y = 6.21 + 1.03x
y = 28.9 + 0.52x

Recall the appropriateregression analysis steps
• Model building– Model formulation– Model estimation– Model evaluation
• Model use
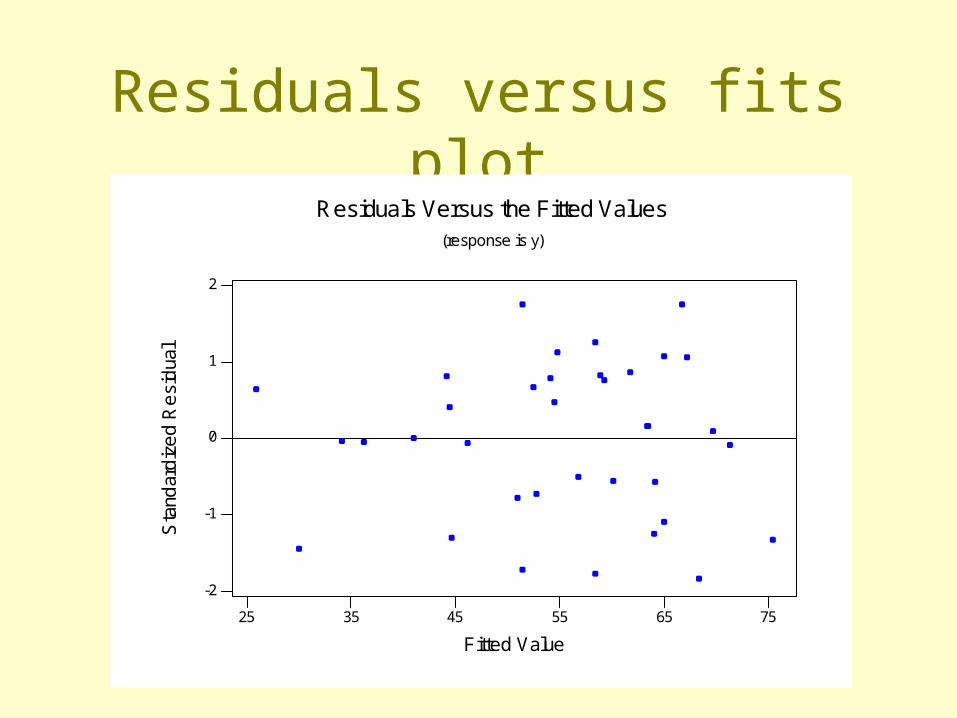
Residuals versus fits plot
756555453525
2
1
0
-1
-2
Fitted Value
Sta
ndar
diz
ed
Re
sid
ual
Residuals Versus the Fitted Values(response is y)

Normal probability plot
P-Value (approx): > 0.1000R: 0.9866W-test for Normality
N: 36StDev: 3.63376Average: -0.0000000
50-5
.999
.99
.95
.80
.50
.20
.05
.01
.001
Pro
babi
lity
RESI1
Normal Probability Plot

Is there a difference in the mean effectiveness for the three treatments?
If patient received B (xi2 = 0, xi3 = 1):
If patient received A (xi2 = 1, xi3 = 0): 112120 ii xYE
iiiiiiiii xxxxxxxY 311321123322110
113130 ii xYE
If patient received C (xi2 = 0, xi3 = 0): 110 ii xYE
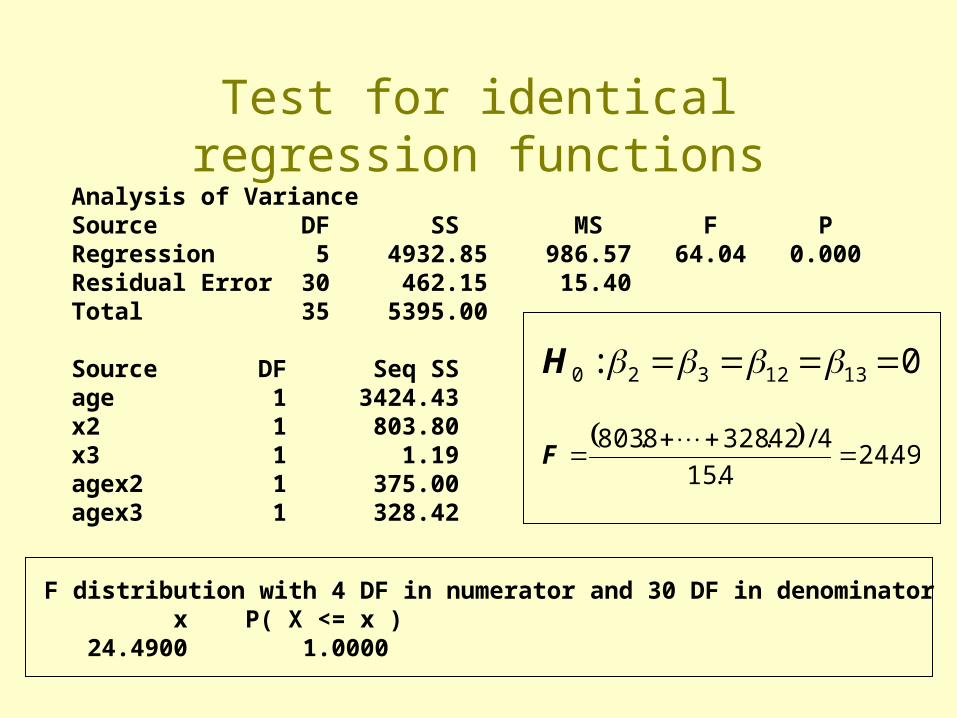
Test for identical regression functionsAnalysis of VarianceSource DF SS MS F PRegression 5 4932.85 986.57 64.04 0.000Residual Error 30 462.15 15.40Total 35 5395.00
Source DF Seq SSage 1 3424.43x2 1 803.80x3 1 1.19agex2 1 375.00agex3 1 328.42
0: 1312320 H
49.24
4.15
4/42.3288.803
F
F distribution with 4 DF in numerator and 30 DF in denominator x P( X <= x ) 24.4900 1.0000

Does the effect of age on the treatment’s effectiveness depend on treatment?
If patient received B (xi2 = 0, xi3 = 1):
If patient received A (xi2 = 1, xi3 = 0): 112120 ii xYE
iiiiiiiii xxxxxxxY 311321123322110
113130 ii xYE
If patient received C (xi2 = 0, xi3 = 0): 110 ii xYE

Test for significant interactionAnalysis of VarianceSource DF SS MS F PRegression 5 4932.85 986.57 64.04 0.000Residual Error 30 462.15 15.40Total 35 5395.00
Source DF Seq SSage 1 3424.43x2 1 803.80x3 1 1.19agex2 1 375.00agex3 1 328.42
0: 13120 H
84.22
4.15
2/42.328375
F
F distribution with 2 DF in numerator and 30 DF in denominator x P( X <= x ) 22.8400 1.0000
Another example
A model with one qualitative predictor and two quantitative
predictors
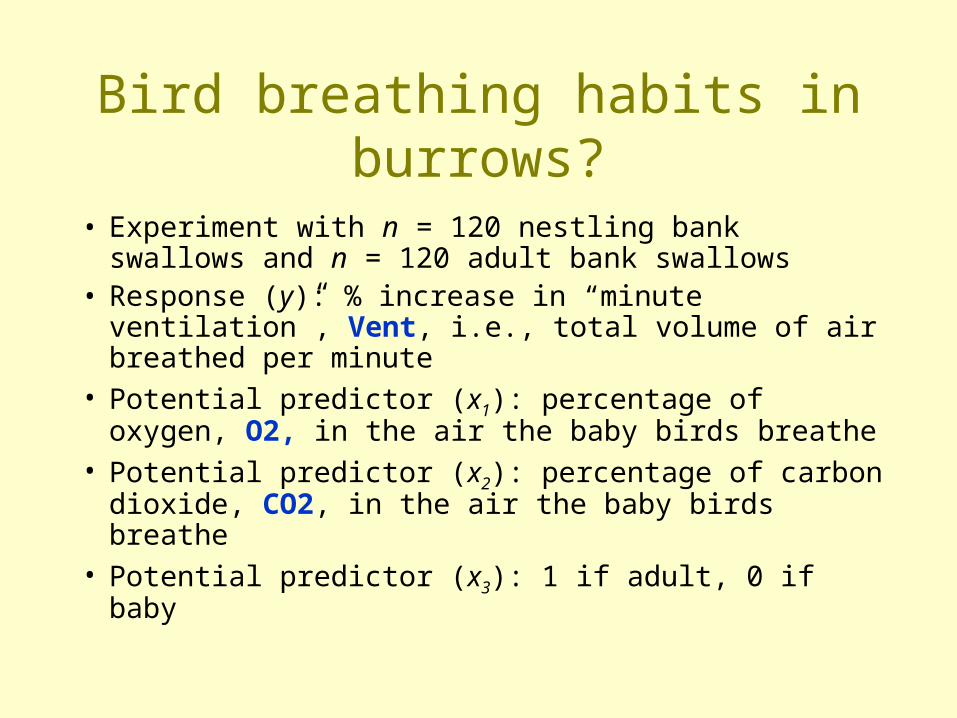
Bird breathing habits in burrows?
• Experiment with n = 120 nestling bank swallows and n = 120 adult bank swallows
• Response (y): % increase in “minute ventilation”, Vent, i.e., total volume of air breathed per minute
• Potential predictor (x1): percentage of oxygen, O2, in the air the baby birds breathe
• Potential predictor (x2): percentage of carbon dioxide, CO2, in the air the baby birds breathe
• Potential predictor (x3): 1 if adult, 0 if baby

Primary research question
• Is there any evidence that the adult birds differ from the baby birds in terms of their minute ventilation as a function of oxygen and carbon dioxide?

A formulated model
iiiii xxxy 3322110
where …
• yi is percentage of minute ventilation
• xi1 is percentage of oxygen
• xi2 is percentage of carbon dioxide
• xi3 is type of bird (0, if baby and 1, if adult)
and … the independent error terms i follow a normal distribution with mean 0 and equal variance 2.

An aside
An example that illustrates the impact of leaving a necessary interaction
term out of the model

Suggests x is related to y?Suggests there is a treatment effect?
0 1
109876543210
10
5
0
x
y

A formulated model
iiii xxy 22110
where …
• yi is the response
• xi1 is the variable you want to “adjust for”
• xi2 is treatment (0 or 1)
and … the independent error terms i follow a normal distribution with mean 0 and equal variance 2.
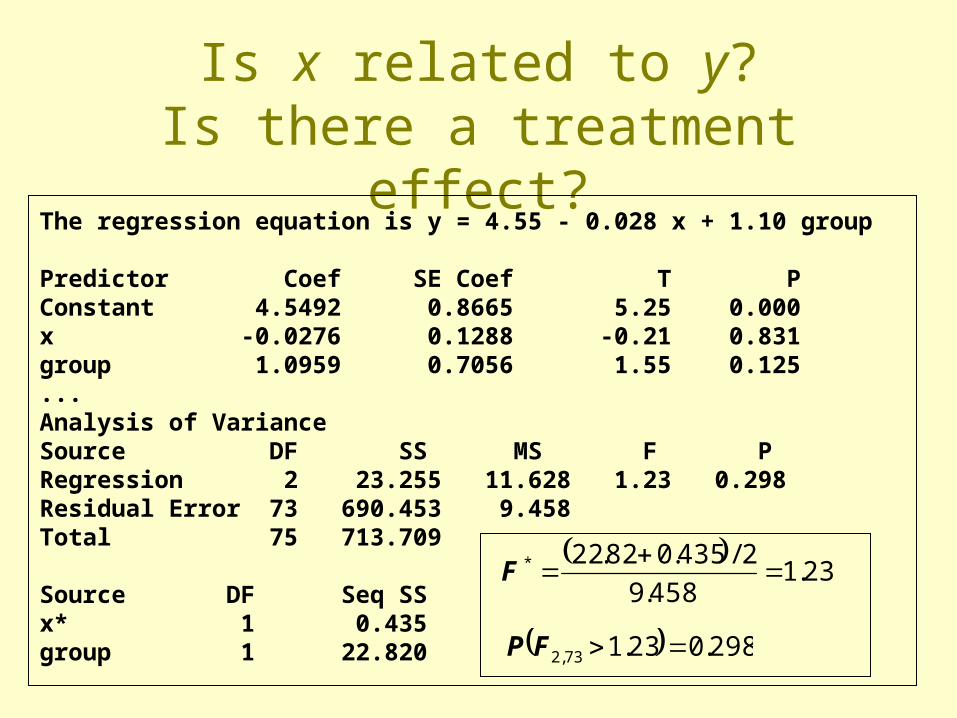
Is x related to y?Is there a treatment effect?
The regression equation is y = 4.55 - 0.028 x + 1.10 group
Predictor Coef SE Coef T PConstant 4.5492 0.8665 5.25 0.000x -0.0276 0.1288 -0.21 0.831group 1.0959 0.7056 1.55 0.125...Analysis of VarianceSource DF SS MS F PRegression 2 23.255 11.628 1.23 0.298Residual Error 73 690.453 9.458Total 75 713.709
Source DF Seq SSx* 1 0.435group 1 22.820
23.1
458.9
2/435.082.22*
F
298.023.173,2 FP
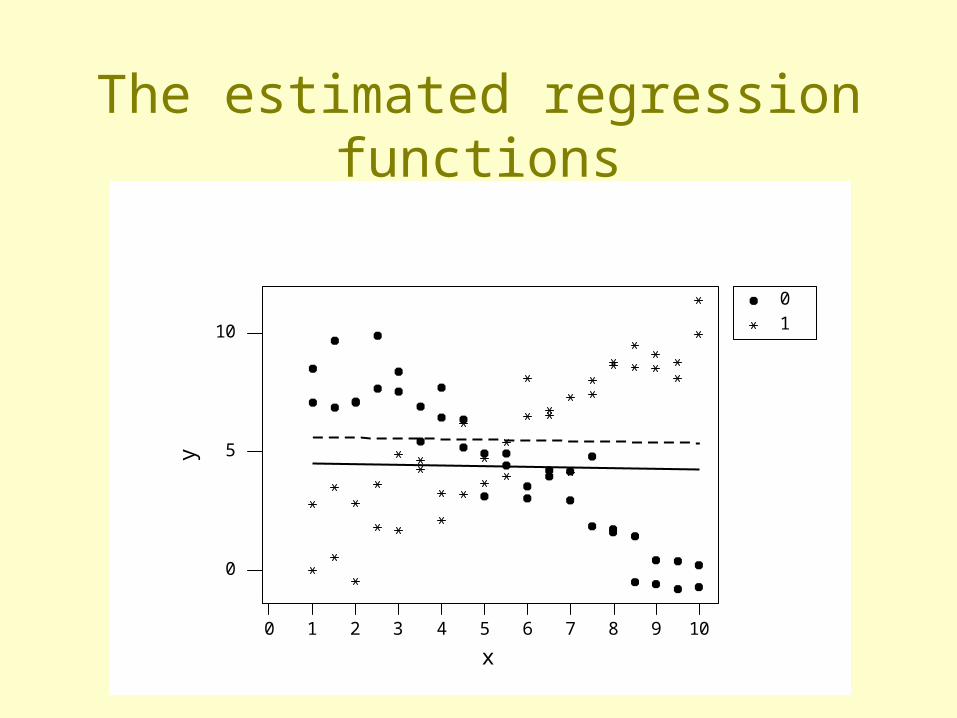
The estimated regression functions
0 1
109876543210
10
5
0
x
y
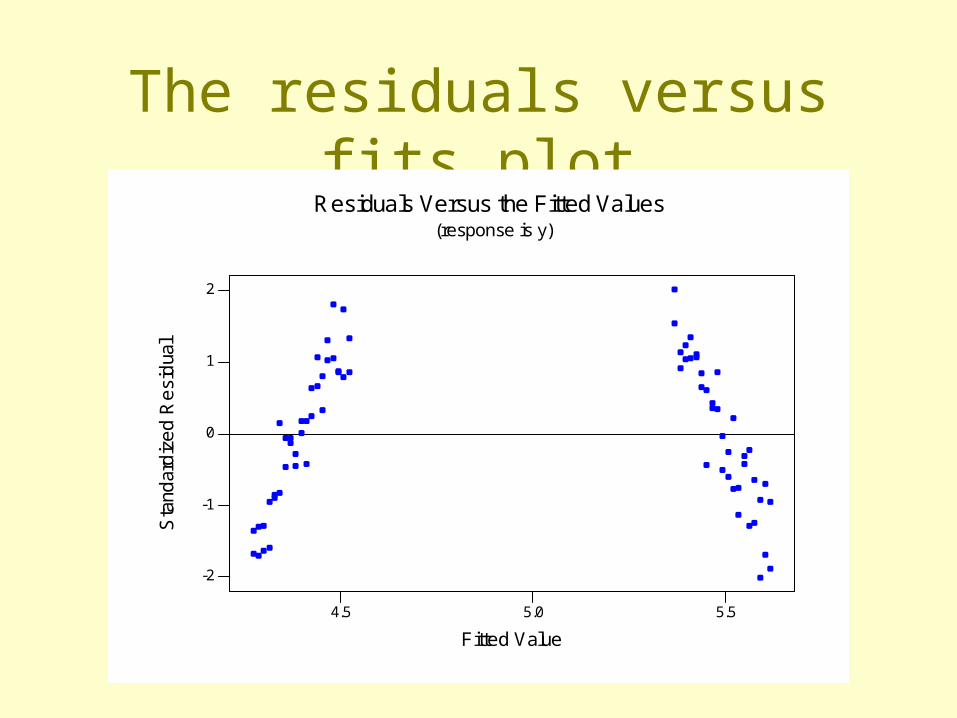
The residuals versus fits plot
5.55.04.5
2
1
0
-1
-2
Fitted Value
Sta
ndar
diz
ed
Re
sid
ual
Residuals Versus the Fitted Values(response is y)

A more appropriately formulated model
iiiiii xxxxy 211222110
where …
• yi is the response
• xi1 is the variable you want to “adjust for”
• xi2 is treatment (0 or 1)
• xi1 xi2 is the “missing” interaction term
and … the independent error terms i follow a normal distribution with mean 0 and equal variance 2.

The estimated regression function
0 1
109876543210
10
5
0
x
y
The regression equation isy = 10.1 - 1.04 x - 10.1 group + 2.03 groupx

The residuals versus fits plot
0 5 10
-2
-1
0
1
2
Fitted Value
Sta
ndar
diz
ed
Re
sid
ual
Residuals Versus the Fitted Values(response is y)

Is x related to y?Is there a treatment effect?
The regression equation isy = 10.1 - 1.04 x - 10.1 group + 2.03 groupx
Predictor Coef SE Coef T PConstant 10.1401 0.4320 23.47 0.000x -1.04416 0.07031 -14.85 0.000group -10.0859 0.6110 -16.51 0.000groupx 2.03307 0.09944 20.45 0.000
S = 1.187 R-Sq = 85.8% R-Sq(adj) = 85.2%
Analysis of VarianceSource DF SS MS F PRegression 3 612.26 204.09 144.84 0.000Residual Error 72 101.45 1.41Total 75 713.71
Back to the bird example

A more appropriately formulated model
iiiiiiiiiii xxxxxxxxxy 3223311321123322110
where …
• yi is percentage of minute ventilation
• xi1 is percentage of oxygen
• xi2 is percentage of carbon dioxide
• xi3 is type of bird (0, if baby and 1, if adult)
and … the independent error terms i follow a normal distribution with mean 0 and equal variance 2.

The model yields two response functions
For baby birds (xi3 = 0):
211222110 iiiii xxxxyE
For adult birds (xi3 = 1):
21122232113130 iiiii xxxxyE

Is there a significant interaction between type and O2? between type and CO2?
between O2 and CO2? The regression equation isVent = - 18 + 1.19 O2 + 54.3 CO2 + 112 Type - 7.01 TypeO2 + 2.31 TypeCO2 - 1.45 CO2O2
Predictor Coef SE Coef T PConstant -18.4 160.0 -0.11 0.909O2 1.189 9.854 0.12 0.904CO2 54.28 25.99 2.09 0.038Type 111.7 157.7 0.71 0.480TypeO2 -7.008 9.560 -0.73 0.464TypeCO2 2.311 7.126 0.32 0.746CO2O2 -1.449 1.593 -0.91 0.364
S = 165.6 R-Sq = 27.2% R-Sq(adj) = 25.3%

Is there a significant interaction between type and O2? between type and CO2?
between O2 and CO2?
Analysis of Variance
Source DF SS MS F PRegression 6 2387540 397923 14.51 0.000Residual Error 233 6388603 27419Total 239 8776143
Source DF Seq SSO2 1 93651CO2 1 2247696Type 1 5910TypeO2 1 14735TypeCO2 1 2884CO2O2 1 22664
49.0
27419
3/22664288414735*
F
69.049.0233,3 FP
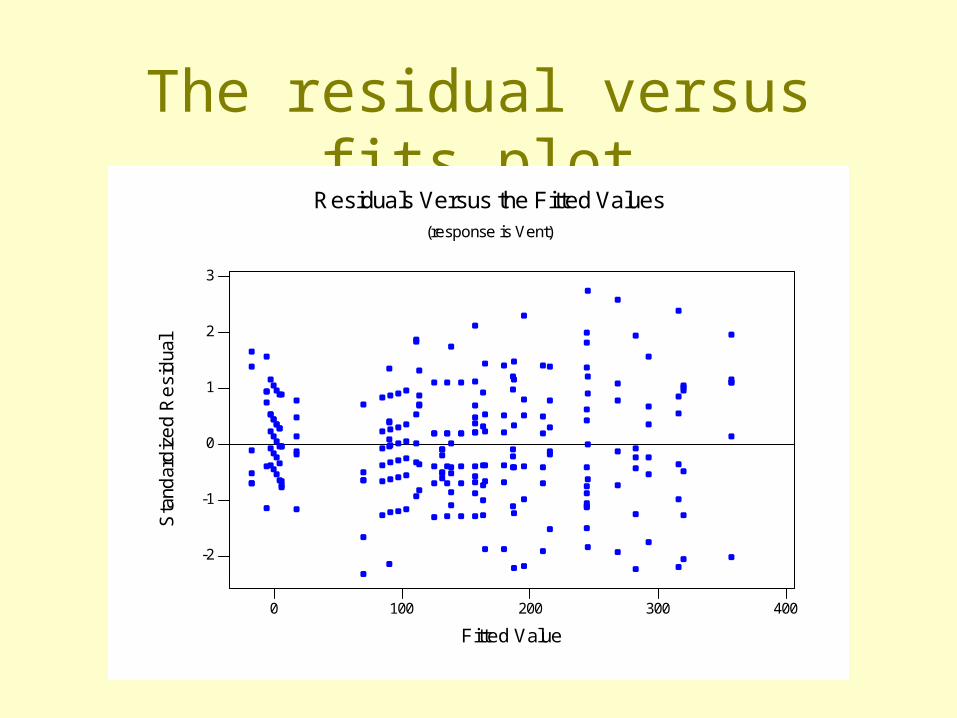
The residual versus fits plot
4003002001000
3
2
1
0
-1
-2
Fitted Value
Sta
ndar
diz
ed
Re
sid
ual
Residuals Versus the Fitted Values(response is Vent)
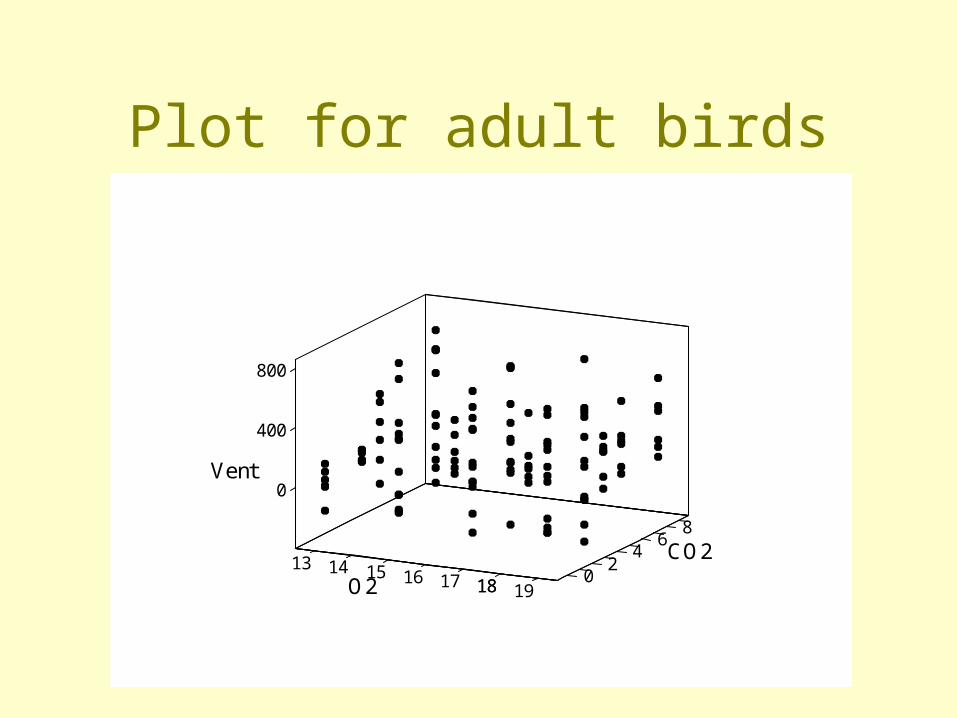
Plot for adult birds
13 14
0
400
15
800
16 17
Vent
18O2
86
4 CO22
18 019

Plot for baby birds
13-200
0
14
200
400
15 16 17 18
Vent
O2
400
600
86
4 CO22
18 019
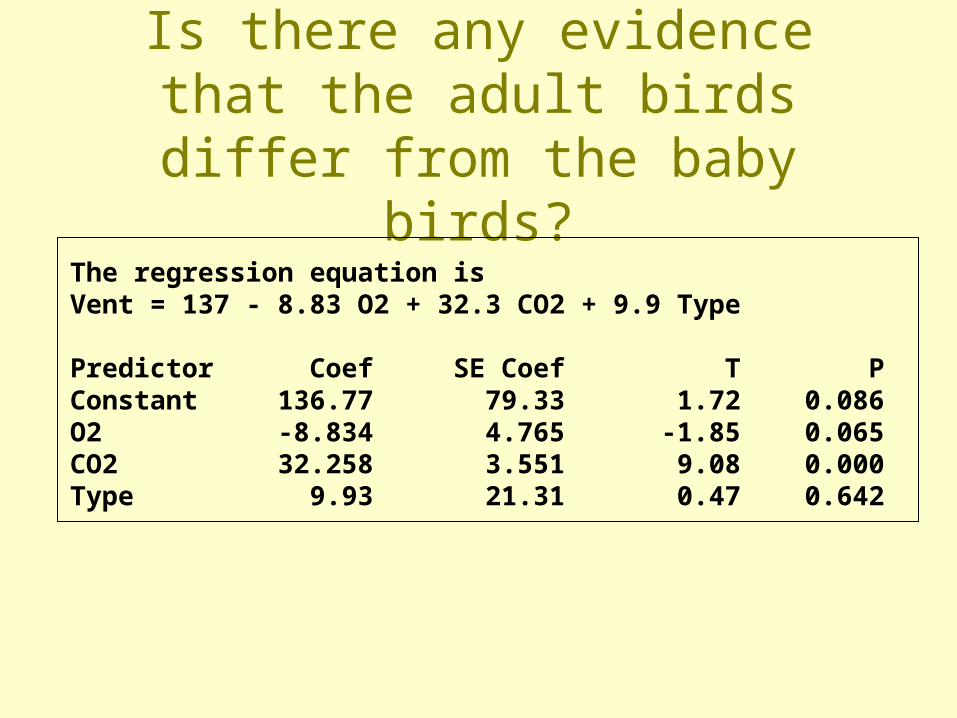
Is there any evidence that the adult birds differ from the baby birds?
The regression equation isVent = 137 - 8.83 O2 + 32.3 CO2 + 9.9 Type
Predictor Coef SE Coef T PConstant 136.77 79.33 1.72 0.086O2 -8.834 4.765 -1.85 0.065CO2 32.258 3.551 9.08 0.000Type 9.93 21.31 0.47 0.642

The residuals versus fits plot
3002001000
3
2
1
0
-1
-2
Fitted Value
Sta
ndar
diz
ed
Re
sid
ual
Residuals Versus the Fitted Values(response is Vent)

The normal probability plot
P-Value (approx): > 0.1000R: 0.9978W-test for Normality
N: 240StDev: 164.009Average: 0.0000000
4003002001000-100-200-300-400
.999
.99
.95
.80
.50
.20
.05
.01
.001
Pro
babi
lity
RESI2
Normal Probability Plot
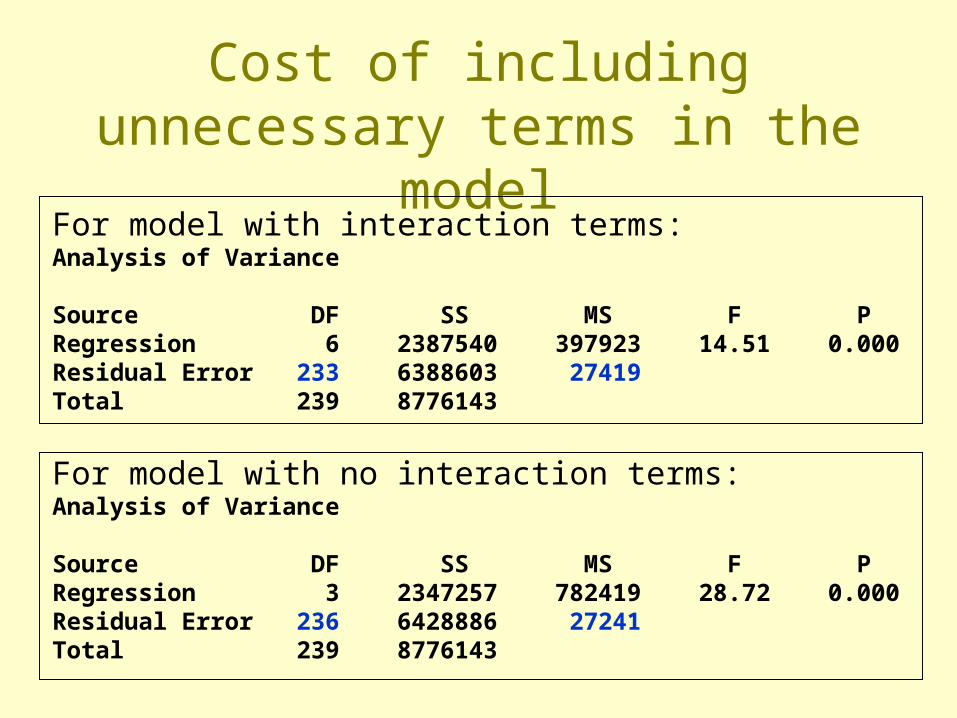
Cost of including unnecessary terms in the model
For model with interaction terms: Analysis of Variance
Source DF SS MS F PRegression 6 2387540 397923 14.51 0.000Residual Error 233 6388603 27419Total 239 8776143
For model with no interaction terms: Analysis of Variance
Source DF SS MS F PRegression 3 2347257 782419 28.72 0.000Residual Error 236 6428886 27241Total 239 8776143
Another comment about multiple testing
• Be aware of impact of multiple testing, but don’t be so extreme about it that your hands are tied.
• The serious danger is when you have many predictors -- not a small number associated with specific research questions.
• You can test multiple parameters simultaneously to reduce the number of tests you have to perform.
• You can reduce individual test’s α level.