quantitative measures of healthy aging and biological age · diseases and disorders of aging have...
TRANSCRIPT
Dow
nloadedfrom
https://journals.lww.com
/har-journalbyBhD
Mf5ePH
Kav1zEoum1tQ
fN4a+kJLhEZgbsIH
o4XMi0hC
ywCX1AW
nYQp/IlQ
rHD3Xr2jqKQ
QBA4yT/7R
RoM
ITLc3wXYe1V2Ba2xItvS3Q
aw=on
08/28/2018
Downloadedfromhttps://journals.lww.com/har-journalbyBhDMf5ePHKav1zEoum1tQfN4a+kJLhEZgbsIHo4XMi0hCywCX1AWnYQp/IlQrHD3Xr2jqKQQBA4yT/7RRoMITLc3wXYe1V2Ba2xItvS3Qaw=on08/28/2018
Healthy Aging Research | www.har-journal.com Kim et al. 2015 | 4:26 1
Quantitative measures of healthy aging and biological age Sangkyu Kim 1*, S. Michal Jazwinski 1 1 Tulane Center for Aging and Department of Medicine, Tulane University Health Sciences Center, New Orleans, LA, USA
Abstract
Numerous genetic and non-genetic factors contribute to aging. To facilitate the study of these factors, various descriptors of biological aging, including ‘successful aging’ and ‘frailty’, have been put forth as integrative functional measures of aging. A separate but related quantitative approach is the ‘frailty index’, which has been operationalized and frequently used. Various frailty indices have been constructed. Although based on different numbers and types of health variables, frailty indices possess several common properties that make them useful across different studies. We have been using a frailty index termed FI34 based on 34 health variables. Like other frailty indices, FI34 increases non-linearly with advancing age and is a better indicator of biological aging than chronological age. FI34 has a substantial genetic basis. Using FI34, we found elevated levels of resting metabolic rate linked to declining health in nonagenarians. Using FI34 as a quantitative phenotype, we have also found a genomic region on chromosome 12 that is associated with healthy aging and longevity. Citation: Kim S, Jazwinski SM (2015) Quantitative measures of healthy aging and biological age. Healthy Aging Research 4:26. doi:10.12715/har.2015.4.26
Received: January 31, 2015; Accepted: March 11, 2015; Published: April 23, 2015
Copyright: © 2015 Kim et al. This is an open access article distributed under the terms of the Creative Commons Attribution License, which permits unrestricted use, distribution, and reproduction in any medium, provided the original work is properly cited.
Competing interests: The authors have declared that no competing interests exist.
Sources of funding: The studies using FI34 described in this article were supported by grants from the National Institute on Aging of the National Institutes of Health (NIH) (K01AG027905 to SK and P01AG022064 to SMJ); the NIH National Institute of General Medical Sciences (P20GM103629 to SMJ and SK); the Louisiana Board of Regents through the Millennium Trust Health Excellence Fund (HEF[2001–06]-02 to SMJ), and by the Louisiana Board of Regents RC/EEP Fund through the Tulane–LSU CTRC at LSU Interim University Hospital. * Email: [email protected]
Introduction The importance of health span as opposed to life span has gained substantial recognition over the past decade. Health span is defined as the period of life spent in relative good health. This definition carries with it the necessity to quantify ‘healthy’ versus ‘unhealthy’ aging, in order to understand the variables contributing to health span. The problem of how to quantify health span has occupied researchers for some three decades, and it has both basic scientific as well as applied clinical ramifications.
Much work in the field of the biology of aging has focused on individual cellular and molecular mechanisms as causal factors restricting longevity. This has led to a wealth of information that has gained particular predictive value with the introduction of
genetics, especially in lower organisms. However, there has always been an appreciation for aging as a manifestation of the organism as a whole, which immediately calls attention to integrated function and its decline in the form of physiologic dysregulation. Thus, the search for descriptors of this whole-organism functional decline has resulted in the elaboration of various indices of healthy versus unhealthy aging. This search has taken into account the heterogeneity of the aging phenotype from individual to individual over space and time; a remarkable feature of aging common to a number of species [1]. The tendency to view healthy aging in a holistic sense is fundamentally a systems biology perspective on aging and health [2].
Healthy Aging Research | www.har-journal.com Kim et al. 2015 | 4:26 2
The anecdotal finding of reduced disease burden in long-lived individuals has been frequently mentioned in the scientific literature, and has been underpinned by the quantitative classification of centenarians as survivors, delayers, or escapers of major diseases [3]. However, careful analysis has shown that there is no difference between centenarians and young controls in the frequencies of genetic variants predisposing individuals to major diseases of aging [4]. Nevertheless, it has been shown recently that individuals from families enriched for persons displaying exceptional survival exhibited a marked delay in the onset of age-related diseases and comorbidities [5], suggesting a genetic component. Indeed, such genetic factors have been identified [6]. Diseases and disorders of aging have figured into other measures of healthy aging, but in and of itself, absence of disease is not useful when categorizing healthy aging, since few people escape unscathed with increasing age.
The concept of ‘successful aging’ [7] is an attempt to quantify health span as opposed to life span. Successful aging is defined as having a low level of disease and/or disease-related disability, relatively high physical and cognitive functioning, and active and productive engagement in life activities. This construct has been operationalized and used directly in genetic studies of aging [8].
Frailty is considered a clinical syndrome that distinguishes elderly individuals at risk for adverse outcomes. It does so by quantifying the functional loss that results during aging [9, 10]. This has led to several frailty indices. Frailty was defined by Fried et al. [11] based on the presence of at least three of a possible total of five deficits: weight loss, exhaustion, muscle weakness, slow walking speed, and low physical activity. As expected, the prevalence of frailty increases with age. Studies designed to uncover genes that play a role in frailty have been based on assumptions about the underlying mechanisms; i.e., the secondary phenotypes or endophenotypes involved [12, 13].
The clinical syndrome of frailty as defined above is most appropriately considered a phenotype. It is considered distinct from disability, which is often measured in the elderly as impairment in the performance of activities of daily living (ADL). It is
also distinguished from comorbidity. There is some overlap between the three conditions across a cohort of older individuals [11]. The major difference between the frailty phenotype and disability or comorbidity is that with frailty, there is the assumption of decreased functional reserve and physiologic dysregulation that results in a reduced ability to recover from destabilizing stress. This suggests that the frailty phenotype is useful for uncovering underlying biological mechanisms. It is also predictive of disability [14], which may allow its use in understanding the factors determining individual trajectories of disability [15].
A somewhat different approach to quantifying frailty involves a frailty index (FI), consisting of the fraction of deficits accumulated by an individual out of a total of 92 health variables [16]. These variables encompass a broad array of indicators of decline in various physiologic systems throughout the body, and they group together symptoms, laboratory measurements, diseases and disabilities. FI is a better predictor of longevity than chronologic age – in essence, it is a measure of biologic age. Subsequently, it was determined that far fewer variables need be included to achieve an informative index, as long as they reflected the function of a spectrum of physiologic systems [17, 18]. In some studies, the term ‘deficit index’, rather than frailty index has been used [19]. One feature that can complicate use of the FI is its inclusion of disability and comorbidity among its variables. However, their use in the index can be constrained when the relationship of frailty to disability and comorbidity is examined. Claims that use of FI to describe frailty make investigation of underlying mechanisms impossible are unwarranted, as will be seen below.
Recently, a hybrid approach to frailty was applied to two distinct geographic populations [20]. This clustering approach incorporates select features of successful aging, frailty phenotype, and FI. It successfully classifies individuals into different frailty groups differing by mortality risk. It displays a narrow sense (additive) heritability of 0.43 – this compares favorably with the heritability of longevity, which ranges from 0.15 to 0.35 in different estimates [21, 22]. However, the genetic contribution to longevity increases with age [23].
Healthy Aging Research | www.har-journal.com Kim et al. 2015 | 4:26 3
A concept that developed concurrently with frailty is ‘allostatic load’ [24], which attempts to characterize the effect of cumulative biological burden as the body adapts to life stress. When this load exceeds a hypothetical threshold, the resulting wear and tear compromises the physiologic regulatory systems, leading to failure to adapt. Allostatic load has a strong biologic rationale, and it incorporates assessments of ten biomarkers that reflect the operation of several regulatory systems and processes. Baseline allostatic load predicts longitudinal mortality, as well as changes in physical and cognitive functioning.
Another approach utilizing biomarkers attempts to quantify the physiologic dysregulation that is at the root of frailty. These biomarkers were selected in two separate groupings [25]. The ‘statistical suite’ of biomarkers was selected on the basis of the significant increase with age of the deviation of the biomarker from the population average value at baseline. The ‘biological suite’ consisted of those biomarkers most strongly associated with the first axis of variation in a principle component analysis that was stable across three different populations. Individuals were classified by the multivariate statistical difference of their deviation (DM) from the centroid of a reference population characterized by healthy physiology. It was shown that DM accelerates with age, and is associated with increased risk of various health outcomes including mortality and frailty, after adjusting for age. The effort to uncover biomarkers of aging has also encompassed the epigenetic level in the form of DNA methylation marks of human cells and tissues [26].
A related multivariate approach to those listed above utilized principal component analysis to identify endophenotypes of a long and healthy life [27]. The individual variables incorporated into the analysis included an array of measures of physical and cognitive function, as well as physical examination and laboratory measures. The most dominant principal component accounted for 14.3% of the variability across the sample, and was composed of measures of physical function, metabolic health, and pulmonary function. It had a narrow sense heritability of 0.39. Interestingly, average and maximum handgrip strength, and HDL cholesterol levels, which were included in this principal component, had somewhat
higher heritability. The importance of physical function ability in predicting survival is well known [28], thus the inclusion of physical function in this principal component is not surprising.
In this article, we describe the derivation and properties of an FI we are using in our analyses of genetic and phenotypic aspects of healthy aging. We highlight its performance juxtaposed to the performance of various other measures of healthy aging, in cases in which this is possible due to the availability of relevant comparable information.
The frailty index The semi-quantitative approach to frailty based on a small number of items may allow relatively quick screening of frail people and affected body domains [17, 29]. However, it is not considered to be comprehensive or sufficiently quantitative, rendering it less useful in assessing healthy aging at the whole organism level [30]. The FI introduced by Mitnitski et al., which is based on a set of 92 health variables, includes many different health variables reflecting different types of body systems [16]. It was intended to compile a broad spectrum of age-related changes that occur in multiple biological domains. Thus, rather than focusing on single markers of aging that may vary widely and give biased characterization of aging, this FI aims to characterize aging in an integrative and systemic way for the whole organism. Since then, various FIs or deficit indices with different numbers and types of health variables have been used and studied [17, 18, 31-33].
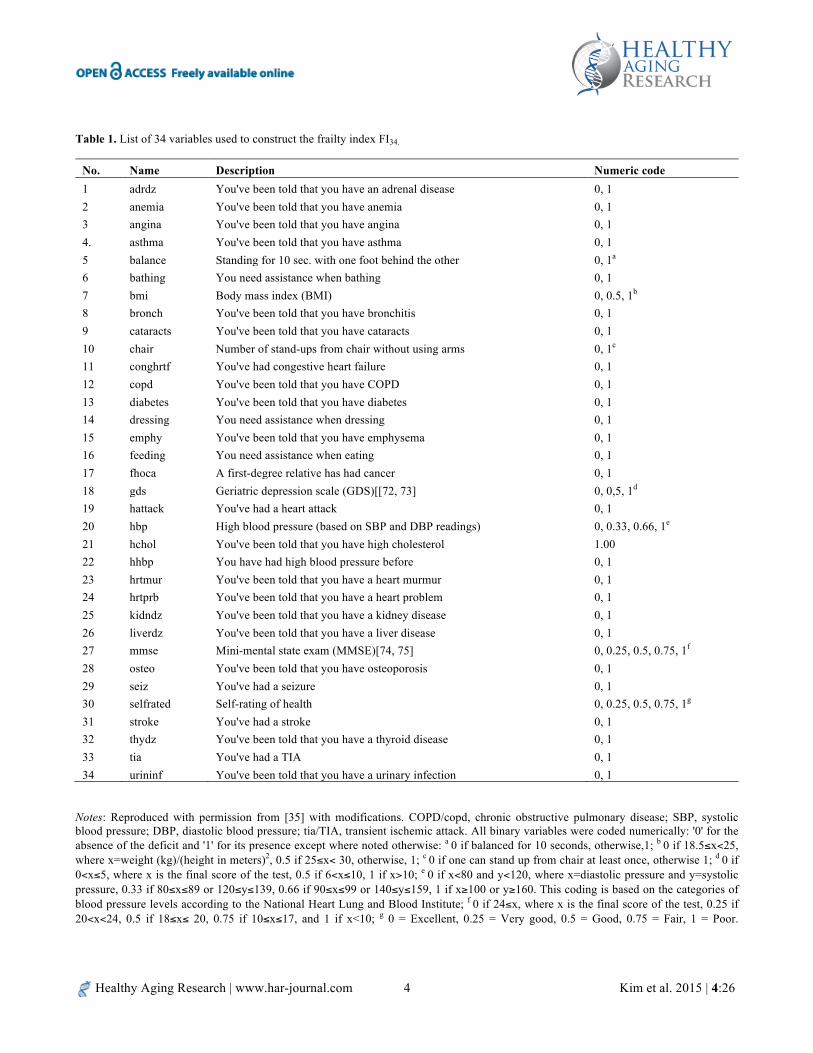
An individual’s FI score is the proportion of any deficient health variables in a set of health variables surveyed for the individual at a given age. Collected data for health variables are usually quantitative measures, either continuous or discrete, or categorical responses from medical history questionnaires. Binary categorical responses are numerically coded; 0 for the absence of the deficit and 1 for the presence of the deficit. Quantitative data and multi-categorical responses are re-coded in the same way as reported previously [33, 34], or with appropriate modifications as shown in Table 1.
Healthy Aging Research | www.har-journal.com Kim et al. 2015 | 4:26 4
Table 1. List of 34 variables used to construct the frailty index FI34.
No. Name Description Numeric code 1 adrdz You've been told that you have an adrenal disease 0, 1 2 anemia You've been told that you have anemia 0, 1 3 angina You've been told that you have angina 0, 1 4. asthma You've been told that you have asthma 0, 1 5 balance Standing for 10 sec. with one foot behind the other 0, 1a 6 bathing You need assistance when bathing 0, 1 7 bmi Body mass index (BMI) 0, 0.5, 1b 8 bronch You've been told that you have bronchitis 0, 1 9 cataracts You've been told that you have cataracts 0, 1 10 chair Number of stand-ups from chair without using arms 0, 1c
11 conghrtf You've had congestive heart failure 0, 1 12 copd You've been told that you have COPD 0, 1 13 diabetes You've been told that you have diabetes 0, 1 14 dressing You need assistance when dressing 0, 1 15 emphy You've been told that you have emphysema 0, 1 16 feeding You need assistance when eating 0, 1 17 fhoca A first-degree relative has had cancer 0, 1 18 gds Geriatric depression scale (GDS)[[72, 73] 0, 0,5, 1d 19 hattack You've had a heart attack 0, 1 20 hbp High blood pressure (based on SBP and DBP readings) 0, 0.33, 0.66, 1e 21 hchol You've been told that you have high cholesterol 1.00 22 hhbp You have had high blood pressure before 0, 1 23 hrtmur You've been told that you have a heart murmur 0, 1 24 hrtprb You've been told that you have a heart problem 0, 1 25 kidndz You've been told that you have a kidney disease 0, 1 26 liverdz You've been told that you have a liver disease 0, 1 27 mmse Mini-mental state exam (MMSE)[74, 75] 0, 0.25, 0.5, 0.75, 1f 28 osteo You've been told that you have osteoporosis 0, 1 29 seiz You've had a seizure 0, 1 30 selfrated Self-rating of health 0, 0.25, 0.5, 0.75, 1g 31 stroke You've had a stroke 0, 1 32 thydz You've been told that you have a thyroid disease 0, 1 33 tia You've had a TIA 0, 1 34 urininf You've been told that you have a urinary infection 0, 1
Notes: Reproduced with permission from [35] with modifications. COPD/copd, chronic obstructive pulmonary disease; SBP, systolic blood pressure; DBP, diastolic blood pressure; tia/TIA, transient ischemic attack. All binary variables were coded numerically: '0' for the absence of the deficit and '1' for its presence except where noted otherwise: a 0 if balanced for 10 seconds, otherwise,1; b 0 if 18.5≤x<25, where x=weight (kg)/(height in meters)2, 0.5 if 25≤x< 30, otherwise, 1; c 0 if one can stand up from chair at least once, otherwise 1; d 0 if 0<x≤5, where x is the final score of the test, 0.5 if 6<x≤10, 1 if x>10; e 0 if x<80 and y<120, where x=diastolic pressure and y=systolic pressure, 0.33 if 80≤x≤89 or 120≤y≤139, 0.66 if 90≤x≤99 or 140≤y≤159, 1 if x≥100 or y≥160. This coding is based on the categories of blood pressure levels according to the National Heart Lung and Blood Institute; f 0 if 24≤x, where x is the final score of the test, 0.25 if 20<x<24, 0.5 if 18≤x≤ 20, 0.75 if 10≤x≤17, and 1 if x<10; g 0 = Excellent, 0.25 = Very good, 0.5 = Good, 0.75 = Fair, 1 = Poor.

Healthy Aging Research | www.har-journal.com Kim et al. 2015 | 4:26 5
Thus, FI scores range from 0, which means no deficient variable in all the health variables surveyed, to 1, which means deficiency in all the health variables surveyed. Accordingly, we constructed an FI based on 34 health variables (FI34) and studied its properties as a composite phenotype of healthy aging [35]. Our 34 variables include diseases and symptoms throughout the body, deficiencies in physical and cognitive functioning, and self-rated health status (Table 1). We have been using FI34 in genetic and phenotypic analyses of healthy aging.
Properties of FI34 and other frailty indices Most of the data on FIs are from cross-sectional studies; hence the exact age trajectory of some of their properties may differ over time. Nevertheless, some interesting statistical and demographic properties have emerged from comparisons of different FIs available in the literature. The foremost features, which make the FI extremely useful across different studies, is that
it is robust and consistent from study to study, as long as the number of health variables is statistically valid and sufficiently diverse to represent multiple body domains [16, 18].
Distribution of FI scores
The distribution of FI scores is usually positively skewed (Figure 1A), which is best fit by the gamma density function where two parameters determining shape and scale are involved [16]. Demographically, the distribution of FI scores changes depending on the age groups considered (Figure 1B–D). Since the FI is highly correlated with age, the skewed distribution reflects the presence of healthy groups (gamma distribution) and unhealthy frail groups (normal distribution). Longitudinally, the two-parameter distribution might represent two-stage changes, where the first stage corresponds to individuals’ resilience to the deleterious changes, and the second stage to the deteriorating stage of declining function with age [16].
Figure 1. Distribution of FI34 scores of individuals in the Louisiana Healthy Aging Study (LHAS) and the Healthy Aging Family Study (HAFS). The FI34 scores were compiled for subjects in LHAS [76] and HAFS [35], according to the methods described [35]. Shown are all the age groups (A), 459 young individuals (20–60 years old) (B); 348 middle-aged (60–90 years old) (C), and 382 old (90–104 years old) (D).

Healthy Aging Research | www.har-journal.com Kim et al. 2015 | 4:26 6
Non-linear increase in the rate of deficit accumulation
FI is highly correlated with age and increases non-linearly with increasing age. The non-linear relationship is best fit either by an exponential function or by a quadratic equation [16, 36]. Interestingly the rates of accumulation of deficits with age calculated from different numbers of health variables (e.g., from 20 to 92) are all close to ~2–3% per year. With FI34, the instantaneous rate of deficit accumulation falls within this range (Figure 2). The seemingly narrow range of rates may reflect insensitivity of the FI to the choice of particular items. This robustness may also come from the redundancy of variables, which may further reflect inter-relationships of different body systems. Thus, redundancy is a statistical phenomenon, but it may well be based on functional relatedness between variables. It is important to remember that this continuous increase in FI34 is a population phenomenon. We have found that FI34 can increase,
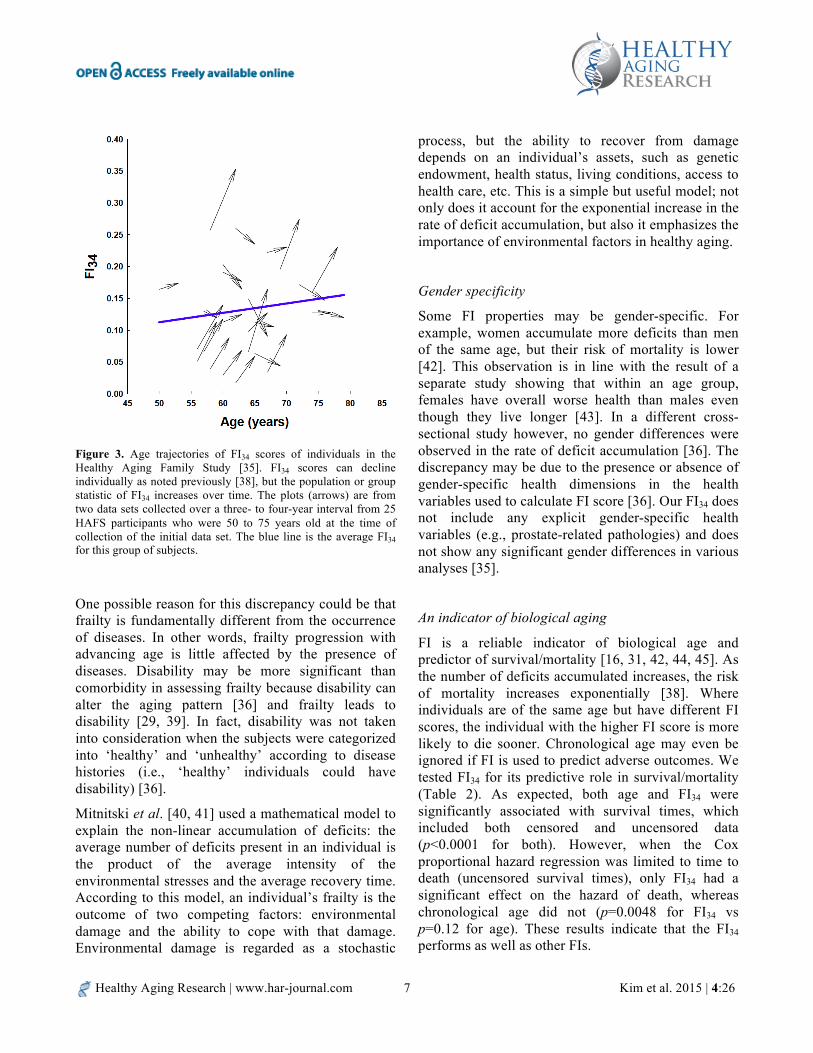
decrease, or remain unchanged over a period of three to five years (Figure 3).
The non-linear increase in FI with age may represent increased vulnerability to stressors as health deteriorates [37]. Indeed, the chance of having higher numbers of deficits increases as the number of deficits accumulated increases [38]. This acceleration is an example of a feed-forward mechanism, and is characteristic of the operation of a complex system in which there are multiple interactions among its individual components. Interestingly, however, no differences in the rate of deficit accumulation were observed between ‘healthy’ individuals who did not contract any of 21 major diseases and ‘unhealthy’ individuals who contracted at least one of these [36]. In this case, the numbers of health deficits at baseline were higher in the unhealthy than in the healthy individuals. If contracting one or more of the major diseases is associated with frailty, then the rate of deficit accumulation in the unhealthy should be higher than that in the healthy.
Figure 2. Scatter plots of FI34 scores by age in the “offspring of long-lived parents” (OLLP) of the Healthy Aging Family Study and the “offspring of short-lived parents” (OSLP) of the Louisiana Healthy Aging Study. Using the FI34 as a dependent variable and age as an independent variable, the exponential function a•e(b•age) was fitted to estimate the parameters a and b. The value of a=0.034 for OLLP and 0.026 for OSLP. Shown are the estimated b values with corresponding p values under the null hypothesis that slope =0. Reproduced with permission from [35] with modifications.
Healthy Aging Research | www.har-journal.com Kim et al. 2015 | 4:26 7
Figure 3. Age trajectories of FI34 scores of individuals in the Healthy Aging Family Study [35]. FI34 scores can decline individually as noted previously [38], but the population or group statistic of FI34 increases over time. The plots (arrows) are from two data sets collected over a three- to four-year interval from 25 HAFS participants who were 50 to 75 years old at the time of collection of the initial data set. The blue line is the average FI34 for this group of subjects.
One possible reason for this discrepancy could be that frailty is fundamentally different from the occurrence of diseases. In other words, frailty progression with advancing age is little affected by the presence of diseases. Disability may be more significant than comorbidity in assessing frailty because disability can alter the aging pattern [36] and frailty leads to disability [29, 39]. In fact, disability was not taken into consideration when the subjects were categorized into ‘healthy’ and ‘unhealthy’ according to disease histories (i.e., ‘healthy’ individuals could have disability) [36].
Mitnitski et al. [40, 41] used a mathematical model to explain the non-linear accumulation of deficits: the average number of deficits present in an individual is the product of the average intensity of the environmental stresses and the average recovery time. According to this model, an individual’s frailty is the outcome of two competing factors: environmental damage and the ability to cope with that damage. Environmental damage is regarded as a stochastic
process, but the ability to recover from damage depends on an individual’s assets, such as genetic endowment, health status, living conditions, access to health care, etc. This is a simple but useful model; not only does it account for the exponential increase in the rate of deficit accumulation, but also it emphasizes the importance of environmental factors in healthy aging.
Gender specificity
Some FI properties may be gender-specific. For example, women accumulate more deficits than men of the same age, but their risk of mortality is lower [42]. This observation is in line with the result of a separate study showing that within an age group, females have overall worse health than males even though they live longer [43]. In a different cross-sectional study however, no gender differences were observed in the rate of deficit accumulation [36]. The discrepancy may be due to the presence or absence of gender-specific health dimensions in the health variables used to calculate FI score [36]. Our FI34 does not include any explicit gender-specific health variables (e.g., prostate-related pathologies) and does not show any significant gender differences in various analyses [35].
An indicator of biological aging
FI is a reliable indicator of biological age and predictor of survival/mortality [16, 31, 42, 44, 45]. As the number of deficits accumulated increases, the risk of mortality increases exponentially [38]. Where individuals are of the same age but have different FI scores, the individual with the higher FI score is more likely to die sooner. Chronological age may even be ignored if FI is used to predict adverse outcomes. We tested FI34 for its predictive role in survival/mortality (Table 2). As expected, both age and FI34 were significantly associated with survival times, which included both censored and uncensored data (p<0.0001 for both). However, when the Cox proportional hazard regression was limited to time to death (uncensored survival times), only FI34 had a significant effect on the hazard of death, whereas chronological age did not (p=0.0048 for FI34 vs p=0.12 for age). These results indicate that the FI34 performs as well as other FIs.

Healthy Aging Research | www.har-journal.com Kim et al. 2015 | 4:26 8
A tool to identify physiologic factors associated with healthy aging
As a quantitative proxy of aging and longevity, the FI can be used to examine various physiologic or genetic factors for their contribution to healthy aging. To do so, we turned our attention to energy metabolism, which is indispensable to life [46]. Total daily energy expenditure (TDEE) in mammals can be divided into three major components: resting metabolic rate (RMR), activity energy expenditure (AEE), and diet-induced thermogenesis [47-49]. RMR, which accounts for the bulk (60–70%) of TDEE, refers to the amount of energy for maintenance of body systems [49]. AEE and diet-induced thermogenesis constitute
approximately 20–30% and 10% of TDEE, respectively. These essential components of energy metabolism are highly associated with age (Figure 4), and in examining their relationship with FI34, we included several covariates known to be related to the independent or dependent variables. These variables include age, gender, fat mass, fat-free mass, the thyroid hormones T3 and T4, insulin-like growth factor 1 (IGF1), and creatine phosphokinase (CPK). Of these, IGF1 has the potential to affect RMR by inducing skeletal muscle growth through activation of the Akt-mTOR pathway [50, 51]. CPK is a clinical indicator of muscle damage [52-54].
Table 2. Cox regression for time to death as a function of FI34 or age in the Louisiana Healthy Aging Study
Variable b Exp (b) p value R2 Wald test p FI34 2.236 9.355 0.0048 0.039 0.00482 age 0.01695 1.017 0.124 0.014 0.124
Notes: Reproduced with permission from [35] with modifications. The coefficient (b) and its exponentiated value, Exp (b), are for a unit increase in FI34. FI34 scores range from 0 to 1, but a FI34 score of 1 is practically impossible. Therefore, to better estimate the effect of the covariate, we should compute the values for a fractional increase, i.e., 0.1 rather than the whole unit [1]. In this case, e(0.1•b)=1.25, which means an increase in the hazard by 25% for a tenth of the unit increase in FI34
Figure 4. Energy expenditure components are inversely correlated with age in the Louisiana Healthy Aging Study. Energy expenditure associated with physical activity is represented by the energy expenditure summary index (EESI) in the Yale Physical Activity survey. The plots were generated using data from 109 study participants aged 80-98. RMR, resting metabolic rate; TDEE, total daily energy expenditure.
Healthy Aging Research | www.har-journal.com Kim et al. 2015 | 4:26 9
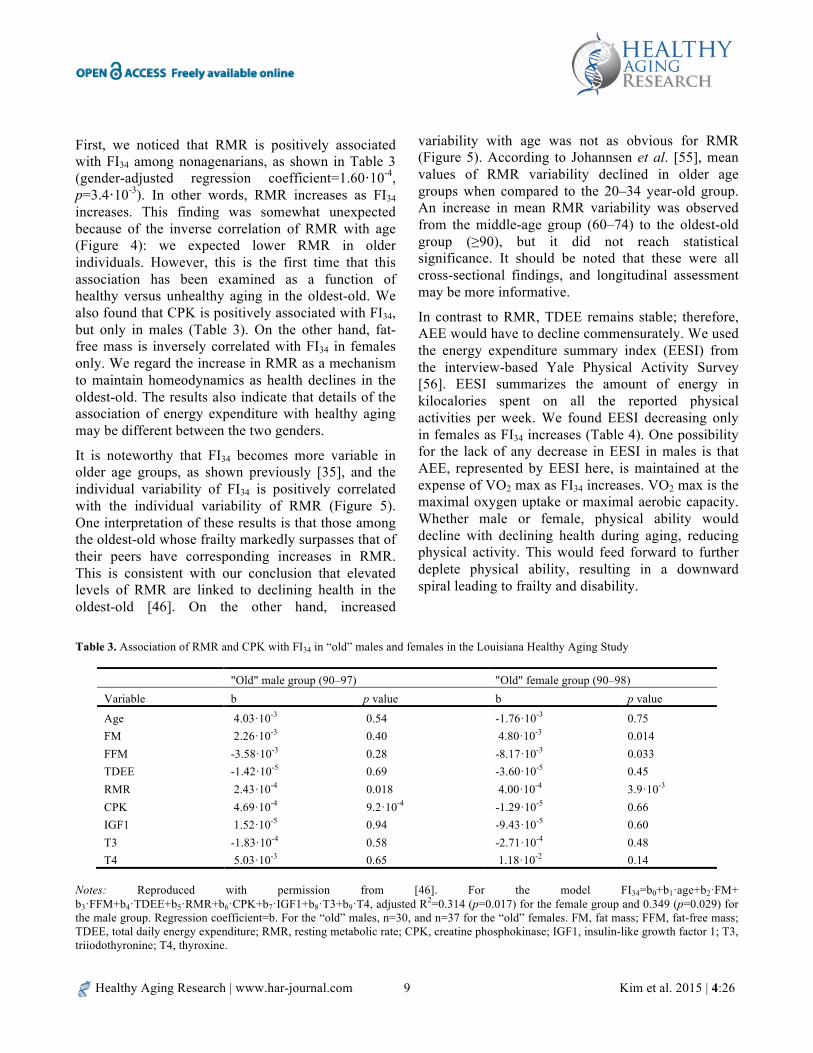
First, we noticed that RMR is positively associated with FI34 among nonagenarians, as shown in Table 3 (gender-adjusted regression coefficient=1.60·10-4, p=3.4·10-3). In other words, RMR increases as FI34 increases. This finding was somewhat unexpected because of the inverse correlation of RMR with age (Figure 4): we expected lower RMR in older individuals. However, this is the first time that this association has been examined as a function of healthy versus unhealthy aging in the oldest-old. We also found that CPK is positively associated with FI34, but only in males (Table 3). On the other hand, fat-free mass is inversely correlated with FI34 in females only. We regard the increase in RMR as a mechanism to maintain homeodynamics as health declines in the oldest-old. The results also indicate that details of the association of energy expenditure with healthy aging may be different between the two genders.
It is noteworthy that FI34 becomes more variable in older age groups, as shown previously [35], and the individual variability of FI34 is positively correlated with the individual variability of RMR (Figure 5). One interpretation of these results is that those among the oldest-old whose frailty markedly surpasses that of their peers have corresponding increases in RMR. This is consistent with our conclusion that elevated levels of RMR are linked to declining health in the oldest-old [46]. On the other hand, increased
variability with age was not as obvious for RMR (Figure 5). According to Johannsen et al. [55], mean values of RMR variability declined in older age groups when compared to the 20–34 year-old group. An increase in mean RMR variability was observed from the middle-age group (60–74) to the oldest-old group (≥90), but it did not reach statistical significance. It should be noted that these were all cross-sectional findings, and longitudinal assessment may be more informative.
In contrast to RMR, TDEE remains stable; therefore, AEE would have to decline commensurately. We used the energy expenditure summary index (EESI) from the interview-based Yale Physical Activity Survey [56]. EESI summarizes the amount of energy in kilocalories spent on all the reported physical activities per week. We found EESI decreasing only in females as FI34 increases (Table 4). One possibility for the lack of any decrease in EESI in males is that AEE, represented by EESI here, is maintained at the expense of VO2 max as FI34 increases. VO2 max is the maximal oxygen uptake or maximal aerobic capacity. Whether male or female, physical ability would decline with declining health during aging, reducing physical activity. This would feed forward to further deplete physical ability, resulting in a downward spiral leading to frailty and disability.
Table 3. Association of RMR and CPK with FI34 in “old” males and females in the Louisiana Healthy Aging Study
"Old" male group (90–97) "Old" female group (90–98) Variable b p value b p value
Age 4.03·10-3 0.54 -1.76·10-3 0.75
FM 2.26·10-3 0.40 4.80·10-3 0.014
FFM -3.58·10-3 0.28 -8.17·10-3 0.033 TDEE -1.42·10-5 0.69 -3.60·10-5 0.45 RMR 2.43·10-4 0.018 4.00·10-4 3.9·10-3
CPK 4.69·10-4 9.2·10-4 -1.29·10-5 0.66 IGF1 1.52·10-5 0.94 -9.43·10-5 0.60 T3 -1.83·10-4 0.58 -2.71·10-4 0.48 T4 5.03·10-3 0.65 1.18·10-2 0.14
Notes: Reproduced with permission from [46]. For the model FI34=b0+b1·age+b2·FM+ b3·FFM+b4·TDEE+b5·RMR+b6·CPK+b7·IGF1+b8·T3+b9·T4, adjusted R2=0.314 (p=0.017) for the female group and 0.349 (p=0.029) for the male group. Regression coefficient=b. For the “old” males, n=30, and n=37 for the “old” females. FM, fat mass; FFM, fat-free mass; TDEE, total daily energy expenditure; RMR, resting metabolic rate; CPK, creatine phosphokinase; IGF1, insulin-like growth factor 1; T3, triiodothyronine; T4, thyroxine.

Healthy Aging Research | www.har-journal.com Kim et al. 2015 | 4:26 10
Table 4. Association of physical-activity-related energy expenditure (EESI) with FI34 in female nonagenarians in the Louisiana Healthy Aging Study
Gender b SE(b) P value R2 Female -0.917•10-6 3.06•10-6 0.0058 0.47 (p = 0.00052) Male -0.1.20•10-6 4.08•10-6 0.77 0.40 (p = 0.0081)
Notes: For the model FI34=b0+b1·age+b2·FM+b3·FFM+b4·TDEE+b5·RMR+b6·CPK+b7·EESI, regression coefficient=b, SE(b) is the standard error of the coefficient. For the “old” males, n=30, and n=37 for the “old” females.
Figure 5. Age-dependent variation of FI34 and RMR. The “resid.FI34” on the y axis represents residuals (the differences between the observed FI34 scores and the predicted FI34 scores) from a linear regression of FI34 on age with adjustments for sex, fat mass and fat-free mass. Likewise, “resid.RMR” on the x axis represents residuals (the differences between the observed RMR scores and the predicted RMR scores) from a linear regression of RMR on age with adjustments for sex, fat mass and fat-free mass. A, 28 subjects aged 22–34 (“young”); B, 42 subjects aged 60–74 (“middle”); C, 67 nonagenarians. FI34 (y axis) becomes more variable (spread) in older age groups (p=5.8·10-7 for “young” vs. “middle”; p=0.019 for “middle” vs. nonagenarian; p=7.2·10-11 for “young” vs. nonagenarian, according to an F test to compare the variances). On the other hand, RMR (x axis) does not exhibit much change over the three age groups (p >> 0.05). Note that the red dotted line in each plot represents the correlation between resid.FI34 and resid.RMR. This “residual” correlation is significant only in the oldest-old group as indicated.
Genetic basis of frailty
Aging involves numerous genetic and environmental factors, each making a small contribution to the gradual development of the phenotype. Thus, no single factor would be sufficient to account for the heritable variation in aging, and longevity alone falls short of being a reliable descriptor of the actual aging process, especially in view of quality of life. This is
why the idea and application of biological aging has been frequently explored in the literature [12, 57-59].
Aging accompanies progressive accumulation of age-related changes at various biological levels that decrease functional abilities and vitality [60]. Thus, genetic analysis of aging can be carried out using a single biomarker, a combination of intermediate traits, or the more inclusive FI, as long as each of these traits

Healthy Aging Research | www.har-journal.com Kim et al. 2015 | 4:26 11
or measures is a significant contributor to biological aging. Incorporation of tissue-specific biomarkers, such as skeletal biomarkers, into statistical modeling and genetic analysis of underlying candidate genes has been described [59]. Skeletal muscle aging is a risk factor for geriatric diseases, and a number of factors involved in skeletal muscle metabolism, such as myokines, influence aging and life span [61]. Not surprisingly then, physical exercise stimulates autophagy [62], mitochondrial biogenesis [63], and changes DNA methylation patterns in the brain [64], along with its known effects on improvement of cognitive function [65]. It is also feasible to choose endophenotypes of healthy aging from a large number of health variables using appropriate statistical methods, such as principal component analysis [27]. No single dominant principal component could explain the bulk of the variance, but those variables that were highly correlated with the first two principal components showed high heritability.
Recent studies have shown an association between individual molecular events and frailty measures. For example, oxidative stress, as revealed by lipid and protein oxidation, is associated with phenotypic frailty based on the five standard criteria [66]. Production of interleukin-12 and interleukin-23, which play important roles in the innate immune response, is compromised in frail individuals categorized by a comprehensive geriatric assessment [67]. Analysis of the genetic factors involved in these molecular and cellular processes may help us to better understand the genetics of healthy aging. For our understanding of organismal aging, however, the use of individual biomarkers or endophenotypes is likely to yield less accurate and reliable results than does the use of comprehensive healthy aging measures [68]. Thus, it is considered to be more informative and productive to use the FI for an integrative genetic analysis than to use single or a small number of health variables.
The number of genetic studies using quantitative measures of healthy aging is small, and most of these studies are limited to linkage analysis. Reed et al. [69] employed a phenotype of healthy aging based on a small number of variables: reaching age of at least 70 and the absence of medical history of several major diseases. Edwards et al. [70] used Rowe and Kahn’s three categories of successful aging based on nine study instruments. The outcomes of these two linkage
studies are different and await corroboration. Importantly, the properties of these two phenotypic measures used in linkage analyses, especially their genetic basis, are unknown. In a different approach, assuming that inflammation and muscle maintenance are associated with frailty, Ho et al. took a candidate gene-association approach to find SNPs and genes associated with frailty [13]. In this study, estimation of frailty was based on the five-item frailty phenotype.
We examined the genetic properties of FI34 [35]. First, we noted that the rates of deficit accumulation differ significantly between the offspring of long-lived parents (≥90 years old) and those of short-lived parents (<76 years old at death), indicating that FI34 is associated with parental longevity (Figure 2). Using 86 full sib pairs, we estimated the sib correlation coefficient to be 0.459 (95% CI=0.273–0.611) and the narrow sense heritability to be 0.39 (standard error=0.21). These results indicate that FI34 has a substantial genetic basis and can be used as a phenotypic measure suitable for genetic analyses of healthy aging. This has allowed us to perform a linkage analysis to identify genomic regions associated with healthy aging [71]. One such region was detected on chromosome 12. In a follow-up association analysis using a separate population, we identified three discrete healthy aging-associated sites in this genomic region coinciding with loci associated with exceptional survival [71].
Conclusions Various measures of biological aging have been described and used, but FI stands out for its fully quantitative nature and robustness. FIs, based on statistically valid numbers of health variables chosen to cover diverse health and body dimensions, bear common features that qualify them as reliable descriptors of healthy aging and predictors of longevity. These features of FI include its close correlation with chronological age, but its better predictive power of survival and mortality in comparison with chronological age. Using FI34, we found resting metabolic rate is an important physiologic factor associated with healthy aging in the oldest-old. In addition, we showed that the FI has a substantial genetic basis, which renders it suitable for genetic analysis of healthy aging and longevity. Thus,
Healthy Aging Research | www.har-journal.com Kim et al. 2015 | 4:26 12
the FI can be extremely useful to study various physiologic, genetic, and epigenetic factors underlying aging and longevity.
References
1. Jones OR, Scheuerlein A, Salguero-Gomez R, Camarda CG, Schaible R, Casper BB, et al. Diversity of ageing across the tree of life. Nature. 2014;505(7482):169-73.
2. Yashin AI, Jazwinski SM, editors. Aging and Health - A Systems Biology Perspective. Basel: Karger; 2015.
3. Evert J, Lawler E, Bogan H, Perls T. Morbidity profiles of centenarians: survivors, delayers, and escapers. J Gerontol A Biol Sci Med Sci. 2003;58(3):232-7.
4. Beekman M, Nederstigt C, Suchiman HE, Kremer D, van der Breggen R, Lakenberg N, et al. Genome-wide association study (GWAS)-identified disease risk alleles do not compromise human longevity. PNAS. 2010;107(42):18046-9.
5. Sebastiani P, Sun FX, Andersen SL, Lee JH, Wojczynski MK, Sanders JL, et al. Families Enriched for Exceptional Longevity also have Increased Health-Span: Findings from the Long Life Family Study. Frontiers in public health. 2013;1:38.
6. Iakoubov L, Mossakowska M, Szwed M, Puzianowska-Kuznicka M. A Common Copy Number Variation Polymorphism in the CNTNAP2 Gene: Sexual Dimorphism in Association with Healthy Aging and Disease. Gerontology. 2015;61(1):24-31.
7. Rowe JW, Kahn RL. Successful aging. The Gerontologist. 1997;37(4):433-40.
8. Edwards DR, Gilbert JR, Hicks JE, Myers JL, Jiang L, Cummings AC, et al. Linkage and association of successful aging to the 6q25 region in large Amish kindreds. Age (Dordr). 2013;35(4):1467-77.
9. Rockwood K, Fox RA, Stolee P, Robertson D, Beattie BL. Frailty in elderly people: an evolving concept. CMAJ. 1994;150(4):489-95.
10. Rockwood K, Stadnyk K, MacKnight C, McDowell I, Hebert R, Hogan DB. A brief clinical instrument to classify frailty in elderly people. Lancet. 1999;353(9148):205-6.
11. Fried LP, Tangen CM, Walston J, Newman AB, Hirsch C, Gottdiener J, et al. Frailty in older adults: evidence for a phenotype. J Gerontol A Biol Sci Med Sci. 2001;56(3):M146-56.
12. Glatt SJ, Chayavichitsilp P, Depp C, Schork NJ, Jeste DV. Successful aging: from phenotype to genotype. Biological psychiatry. 2007;62(4):282-93.
13. Ho YY, Matteini AM, Beamer B, Fried L, Xue QL, Arking DE, et al. Exploring biologically relevant pathways in frailty. J Gerontol A Biol Sci Med Sci. 2011;66(9):975-9.
14. Rodriguez-Manas L, Fried LP. Frailty in the clinical scenario. Lancet. 2014.
15. Gill TM, Gahbauer EA, Han L, Allore HG. Trajectories of disability in the last year of life. The New England journal of medicine. 2010;362(13):1173-80.
16. Mitnitski AB, Mogilner AJ, Rockwood K. Accumulation of deficits as a proxy measure of aging. ScientificWorldJournal. 2001;1:323-36.
17. Rockwood K, Andrew M, Mitnitski A. A comparison of two approaches to measuring frailty in elderly people. J Gerontol A Biol Sci Med Sci. 2007;62(7):738-43.
18. Rockwood K, Mitnitski A. Frailty in relation to the accumulation of deficits. J Gerontol A Biol Sci Med Sci. 2007;62(7):722-7.
19. Kulminski AM, Ukraintseva SV, Culminskaya IV, Arbeev KG, Land KC, Akushevich L, et al. Cumulative deficits and physiological indices as predictors of mortality and long life. J Gerontol A Biol Sci Med Sci. 2008;63(10):1053-9.
20. Dato S, Montesanto A, Lagani V, Jeune B, Christensen K, Passarino G. Frailty phenotypes in the elderly based on cluster analysis: a longitudinal study of two Danish cohorts. Evidence for a genetic influence on frailty. Age (Dordr). 2012;34(3):571-82.
21. Herskind AM, McGue M, Holm NV, Sorensen TI, Harvald B, Vaupel JW. The heritability of human longevity: a population-based study of 2872 Danish twin pairs born 1870-1900. Hum Genet. 1996;97(3):319-23.
22. Mitchell BD, Hsueh WC, King TM, Pollin TI, Sorkin J, Agarwala R, et al. Heritability of life span in the Old Order Amish. Am J Med Genet. 2001;102(4):346-52.
23. Passarino G, Montesanto A, Dato S, Giordano S, Domma F, Mari V, et al. Sex and age specificity of susceptibility genes modulating survival at old age. Human heredity. 2006;62(4):213-20.
24. Seeman TE, McEwen BS, Rowe JW, Singer BH. Allostatic load as a marker of cumulative biological risk: MacArthur studies of successful aging. Proceedings of the National Academy of Sciences of the United States of America. 2001;98(8):4770-5.
25. Milot E, Morissette-Thomas V, Li Q, Fried LP, Ferrucci L, Cohen AA. Trajectories of physiological dysregulation predicts mortality and health outcomes in a consistent manner across three populations. Mechanisms of ageing and development. 2014;141-142C:56-63.
26. Horvath S. DNA methylation age of human tissues and cell types. Genome biology. 2013;14(10):R115.
27. Matteini AM, Fallin MD, Kammerer CM, Schupf N, Yashin AI, Christensen K, et al. Heritability estimates of endophenotypes of long and health life: the Long Life Family Study. J Gerontol A Biol Sci Med Sci. 2010;65(12):1375-9.
28. Studenski S, Perera S, Patel K, Rosano C, Faulkner K, Inzitari M, et al. Gait speed and survival in older adults. Jama. 2011;305(1):50-8.
Healthy Aging Research | www.har-journal.com Kim et al. 2015 | 4:26 13
29. Fried LP, Tangen CM, Walston J, Newman AB, Hirsch C, Gottdiener J, et al. Frailty in older adults: evidence for a phenotype. J Gerontol A Biol Sci Med Sci. 2001;56(3):M146-56.
30. Kulminski AM, Ukraintseva SV, Kulminskaya IV, Arbeev KG, Land K, Yashin AI. Cumulative deficits better characterize susceptibility to death in elderly people than phenotypic frailty: lessons from the Cardiovascular Health Study. J Am Geriatr Soc. 2008;56(5):898-903.
31. Kulminski A, Ukraintseva SV, Akushevich I, Arbeev KG, Land K, Yashin AI. Accelerated accumulation of health deficits as a characteristic of aging. Exp Gerontol. 2007;42(10):963-70.
32. Kulminski A, Yashin A, Arbeev K, Akushevich I, Ukraintseva S, Land K, et al. Cumulative index of health disorders as an indicator of aging-associated processes in the elderly: results from analyses of the National Long Term Care Survey. Mech Ageing Dev. 2007;128(3):250-8.
33. Searle SD, Mitnitski A, Gahbauer EA, Gill TM, Rockwood K. A standard procedure for creating a frailty index. BMC Geriatr. 2008;8:24.
34. Mitnitski A, Song X, Skoog I, Broe GA, Cox JL, Grunfeld E, et al. Relative fitness and frailty of elderly men and women in developed countries and their relationship with mortality. J Am Geriatr Soc. 2005;53(12):2184-9.
35. Kim S, Welsh DA, Cherry KE, Myers L, Jazwinski SM. Association of healthy aging with parental longevity. Age (Dordr). 2013;35(5):1975-82.
36. Kulminski AM, Arbeev KG, Christensen K, Mayeux R, Newman AB, Province MA, et al. Do gender, disability, and morbidity affect aging rate in the LLFS? Application of indices of cumulative deficits. Mech Ageing Dev. 2011;132(4):195-201.
37. Yang Y, Lee LC. Dynamics and heterogeneity in the process of human frailty and aging: evidence from the U.S. older adult population. J Gerontol B Psychol Sci Soc Sci. 2010;65B(2):246-55.
38. Mitnitski A, Bao L, Rockwood K. Going from bad to worse: a stochastic model of transitions in deficit accumulation, in relation to mortality. Mech Ageing Dev. 2006;127(5):490-3.
39. Buchner DM, Wagner EH. Preventing frail health. Clin Geriatr Med. 1992;8(1):1-17.
40. Mitnitski A, Song X, Rockwood K. Assessing biological aging: the origin of deficit accumulation. Biogerontology. 2013;14(6):709-17.
41. Mitnitski A, Rockwood K. Aging as a process of deficit accumulation: its utility and origin. Interdiscip Top Gerontol. 2015;40:85-98.
42. Mitnitski AB, Mogilner AJ, MacKnight C, Rockwood K. The mortality rate as a function of accumulated deficits in a frailty index. Mech Ageing Dev. 2002;123(11):1457-60.
43. Oksuzyan A, Juel K, Vaupel JW, Christensen K. Men: good health and high mortality. Sex differences in health and aging. Aging Clin Exp Res. 2008;20(2):91-102.
44. Mitnitski AB, Graham JE, Mogilner AJ, Rockwood K. Frailty, fitness and late-life mortality in relation to chronological and biological age. BMC Geriatr. 2002;2:1.
45. Kulminski AM, Ukraintseva SV, Akushevich IV, Arbeev KG, Yashin AI. Cumulative index of health deficiencies as a characteristic of long life. J Am Geriatr Soc. 2007;55(6):935-40.
46. Kim S, Welsh DA, Ravussin E, Welsch MA, Cherry KE, Myers L, et al. An elevation of resting metabolic rate with declining health in nonagenarians may be associated with decreased muscle mass and function in women and men, respectively. J Gerontol A Biol Sci Med Sci. 2014;69(6):650-6.
47. Henry CJ. Mechanisms of changes in basal metabolism during ageing. Eur J Clin Nutr. 2000;54 Suppl 3:S77-91.
48. Wilson MM, Morley JE. Invited review: Aging and energy balance. J Appl Physiol. 2003;95(4):1728-36.
49. Ruggiero C, Ferrucci L. The endeavor of high maintenance homeostasis: resting metabolic rate and the legacy of longevity. J Gerontol A Biol Sci Med Sci. 2006;61(5):466-71.
50. Jacinto E, Hall MN. Tor signalling in bugs, brain and brawn. Nat Rev Mol Cell Biol. 2003;4(2):117-26.
51. Schiaffino S, Mammucari C. Regulation of skeletal muscle growth by the IGF1-Akt/PKB pathway: insights from genetic models. Skelet Muscle. 2011;1(1):4.
52. Lehmann P, Hartung W, Fleck M. [Rhabdomyolysis and creatine kinase elevation]. Z Rheumatol. 2013;72(3):236-41.
53. Guzy PM. Creatine phosphokinase-MB (CPK-MB) and the diagnosis of myocardial infarction. West J Med. 1977;127(6):455-60.
54. Melli G, Chaudhry V, Cornblath DR. Rhabdomyolysis: an evaluation of 475 hospitalized patients. Medicine (Baltimore). 2005;84(6):377-85.
55. Johannsen DL, DeLany JP, Frisard MI, Welsch MA, Rowley CK, Fang X, et al. Physical activity in aging: comparison among young, aged, and nonagenarian individuals. J Appl Physiol. 2008;105(2):495-501.
56. Dipietro L, Caspersen CJ, Ostfeld AM, Nadel ER. A survey for assessing physical activity among older adults. Med Sci Sports Exerc. 1993;25(5):628-42.
57. Furukawa T, Inoue M, Kajiya F, Inada H, Takasugi S. Assessment of biological age by multiple regression analysis. J Gerontol. 1975;30(4):422-34.
58. Borkan GA, Norris AH. Assessment of biological age using a profile of physical parameters. J Gerontol. 1980;35(2):177-84.
59. Karasik D, Demissie S, Cupples LA, Kiel DP. Disentangling the genetic determinants of human aging: biological age as an alternative to the use of survival

Healthy Aging Research | www.har-journal.com Kim et al. 2015 | 4:26 14
measures. J Gerontol A Biol Sci Med Sci. 2005;60(5):574-87.
60. Finch CE. Longevity, senescence, and the genome. Chicago: University of Chicago Press; 1990.
61. Demontis F, Piccirillo R, Goldberg AL, Perrimon N. The influence of skeletal muscle on systemic aging and lifespan. Aging Cell. 2013;12(6):943-9.
62. He C, Sumpter R, Jr., Levine B. Exercise induces autophagy in peripheral tissues and in the brain. Autophagy. 2012;8(10):1548-51.
63. Steiner JL, Murphy EA, McClellan JL, Carmichael MD, Davis JM. Exercise training increases mitochondrial biogenesis in the brain. Journal of applied physiology. 2011;111(4):1066-71.
64. Martinowich K, Hattori D, Wu H, Fouse S, He F, Hu Y, et al. DNA methylation-related chromatin remodeling in activity-dependent BDNF gene regulation. Science. 2003;302(5646):890-3.
65. Leckie RL, Oberlin LE, Voss MW, Prakash RS, Szabo-Reed A, Chaddock-Heyman L, et al. BDNF mediates improvements in executive function following a 1-year exercise intervention. Frontiers in human neuroscience. 2014;8:985.
66. Ingles M, Gambini J, Carnicero JA, Garcia-Garcia FJ, Rodriguez-Manas L, Olaso-Gonzalez G, et al. Oxidative stress is related to frailty, not to age or sex, in a geriatric population: lipid and protein oxidation as biomarkers of frailty. J Am Geriatr Soc. 2014;62(7):1324-8.
67. Compte N, Zouaoui Boudjeltia K, Vanhaeverbeek M, De Breucker S, Tassignon J, Trelcat A, et al. Frailty in old age is associated with decreased interleukin-12/23 production in response to toll-like receptor ligation. PLoS One. 2013;8(6):e65325.
68. Kulminski AM, Arbeev KG, Culminskaya IV, Ukraintseva SV, Christensen K, Yashin AI. Health-related phenotypes and longevity in danish twins. J Gerontol A Biol Sci Med Sci. 2009;64(1):1-8.
69. Reed T, Dick DM, Uniacke SK, Foroud T, Nichols WC. Genome-wide scan for a healthy aging phenotype provides support for a locus near D4S1564 promoting healthy aging. J Gerontol A Biol Sci Med Sci. 2004;59(3):227-32.
70. Edwards DR, Gilbert JR, Jiang L, Gallins PJ, Caywood L, Creason M, et al. Successful aging shows linkage to chromosomes 6, 7, and 14 in the Amish. Ann Hum Genet. 2011;75(4):516-28.
71. Kim S, Welsh DA, Myers L, Cherry KE, Wyckoff J, Jazwinski SM. Non-coding genomic regions possessing enhancer and silencer potential are associated with healthy aging and exceptional survival. Oncotarget. 2015;6(6):3600-12.
72. Yesavage JA, Brink TL, Rose TL, Lum O, Huang V, Adey M, et al. Development and validation of a geriatric depression screening scale: a preliminary report. J Psychiatr Res. 1982;17(1):37-49.
73. Sheikh JY, JA. Geriatric Depression Scale (GDS): recent findings and development of a shorter version. Brink T, editor. New York: Howarth Press; 1986.
74. Folstein MF, Folstein SE, McHugh PR. "Mini-mental state". A practical method for grading the cognitive state of patients for the clinician. J Psychiatr Res. 1975;12(3):189-98.
75. Rovner BW, Folstein MF. Mini-mental state exam in clinical practice. Hosp Pract (Off Ed). 1987;22(1A):99, 103, 6, 10.
76. Jazwinski SM, Kim S, Dai J, Li L, Bi X, Jiang JC, et al. HRAS1 and LASS1 with APOE are associated with human longevity and healthy aging. Aging Cell. 2010;9(5):698-708.