q4 2016 - skanska · operating income amounted to sek 8.2 billion (6.5); adjusted for currency...
TRANSCRIPT

Q4 2016Press release, February 3, 2017, 7:30 a.m. CET
We build for a better society.M25, London, UK

Operating cash flow from operations
SEK bn
-4
-2
0
2
4
6
8
20162015201420132012
Revenue
0
50
100
150
200
20162015201420132012
SEK bn
Operating income
SEK bn
0
2
4
6
8
10
20162015201420132012
• Construction, 38%• Residential Development, 17%• Commercial Property Development, 25%• Infrastructure Development, 20%
Operating income per segment, Dec 31, 2016
Highlights Revenue amounted to SEK 151.3 billion (154.9); adjusted for currency effects, revenue decreased 1 percent.
Operating income amounted to SEK 8.2 billion (6.5); adjusted for currency effects, operating income increased by 27 percent. Impairments in Project Development amounted to about SEK 500 M. The comparable period includes writedowns in the Construction stream amounting to SEK 750 M.
Earnings per share increased by 33 percent to SEK 15.89 (11.96).
The Board of Directors proposes a dividend of SEK 8.25 (7.50) per share.
Operating cash flow from operations amounted to SEK –1.2 billion (7.7).
Operating net financial assets totaled SEK 10.6 billion (Sep. 30, 2016: 9.2).
Order bookings in Construction amounted to SEK 170.2 billion (122.1); adjusted for currency effects, order bookings increased by 40 percent. The order backlog amounted to SEK 196.3 billion (Sep. 30, 2016: 191.6).
Operating income in Construction amounted to SEK 3.5 billion (3.9), corresponding to an operating margin of 2.6 percent (2.8); adjusted for currency effects, operating income decreased by 7 percent.
Operating income in Project Development amounted to SEK 5.8 billion (4.0); adjusted for currency effects, operating income increased by 44 percent.
Return on capital employed in Project Development was 18.4 percent (14.9).
Net divestments in Project Development amounted to SEK 0.8 billion (3.9).
Performance analysisTables referring to segment reporting are in shaded background, for more information see page 15. For definitions of non-IFRS financial measures see page 16-18.
SEK M Jan-Dec 2016 Jan-Dec 2015 Change, % Oct-Dec 2016 Oct-Dec 2015 Change, %
Revenue
Construction 138,001 140,648 –2 38,827 37,979 2
Residential Development 13,264 12,298 8 4,529 3,197 42
Commercial Property Development 10,226 9,034 13 2,673 5,405 –51
Infrastructure Development 237 106 124 35 29 21
Central and eliminations –10,421 –7,151 46 –3,827 –3,363 14
Skanska Group 151,307 154,935 –2 42,237 43,247 –2
Operating income
Construction 3,546 3,874 –8 1,264 1,398 –10
Residential Development 1,605 1,174 37 680 326 109
Commercial Property Development 2,336 1,947 20 322 1,271 –75
Infrastructure Development 1,818 863 111 1,475 458 222
Central –1,140 –1,346 –15 –431 –391 10
Eliminations 34 –51 – –10 –2 400
Operating income 8,199 6,461 27 3,300 3,060 8
Net financial items –118 –313 –62 –60 58 –
Income after financial items 8,081 6,148 31 3,240 3,118 4
Taxes –1,555 –1,219 28 –537 –584 –8
Profit for the period 6,526 4,929 32 2,703 2,534 7
Earnings for the period per share, SEK 15.89 11.96 33 6.59 6.15 7
Earnings for the period per share according to IFRSs, SEK 13.96 11.63 20 5.65 6.27 –10
Operating cash flow from operations –1,154 7,660 – 1,328 9,467 –86
Interest-bearing net receivables(+)/net debt(–) 1,219 6,317 –81 1,219 6,317 –81
Return on capital employed in Project Development, % 18.4 14.9
Operating net financial assets(+)/liabilities(–) 10,595 13,818 –23
Return on equity, % 28.3 22.5
Year-end report, January–December 2016
2 Press release, February 3, 2017, 7:30 a.m. CET

Skanska Year-end report, January–December 2016 3
Comments from Skanska’s President and CEO Johan Karlström:
Throughout 2016 we delivered a very strong earnings growth and increased investments in our Project Development business while maintaining a solid financial position. We clearly met the return targets in Project Development and for the Group but did not reach the operating margin target in Construction. Based on these results the Board is proposing to
increase the dividend to SEK 8.25 per share.
In our Construction stream the performance in 2016 was strong in our largest units by revenue, Sweden and USA Building. In Poland, the performance was weak due to a rapidly declining market; leading to a rightsizing of the organization in the third quarter, as well as a reduced operating margin in certain projects during the year. In USA Civil the performance was negatively impacted by lower revenue, increased S&A costs and extended negotiations with clients regarding design changes. We see great potential to over time improve the operating margin in the Construction stream by continuing to focus on improving the performance in units not delivering at their fullest potential.
Order bookings were very strong during 2016, especially in the U.S., as well as in Sweden and the UK. Our order backlog reached an all-time high by the end of the year, SEK 196.3 billion. This is the result of a structured bidding process in favorable but competitive market conditions.
Our Residential Development stream continued to improve its performance during the year, reaching an all-time high in operating income and clearly overshooting its return targets.
Our strong performance is a combination of favorable market conditions and improved operational efficiency. I would like to highlight BoKlok, the affordable homes business, which due to its high operational efficiency, is able to combine an affordable offer to our customers with great returns.
In our Commercial Property Development stream the divestment gains of SEK 3.1 billion in 2016 surpassed the all-time high level achieved during 2015. By the end of 2016, all three geographies, the U.S., Nordics and Central Europe, contributed to this success. Given the good market conditions and our momentum in leasing activity the pipeline for start-up of new projects in 2017 looks promising.
In the Infrastructure Development stream we ended the year with the realization of the value created in one of the investments in our PPP-portfolio — the M25 motorway in London. This is a perfect example of the great operational synergies within Skanska. The initial investment did not only generate a very large and profitable construction contract, but also a very attractive development gain. And we have more to come, as communicated earlier we plan to divest the A1 motorway project in Poland during 2017. We have the ambition to continue to invest in PPP-projects and we continue to bid on new projects, especially in the U.S. where we currently see the biggest potential.
In 2016 our earnings grew significantly and we have a strong financial position, but we cannot be fully satisfied. In our Construction stream we still have a few units that can perform much better and it is a top priority to make sure that this materializes. Overall we have good and improving market conditions that supports the business, and with our strong performance and increased activity in our Project Development streams, we look forward to the years ahead of us.
Q4 2016Press release, February 3, 2017, 7:30 a.m. CET
We build for a better society.M25, London, UK
M25 Motorway, one of the UK’s largest ever public-private partnerships, is one of the world’s largest orbital motorways and carries 15 percent of the UK’s motorway traffic, or 200,000 vehicles a day. This project demonstrates the synergies within Skanska, both financially and operationally. It involved both Skanska’s Infrastructure Development stream and Construction stream. The free working capital in Construction combined with the profits generated by the Group enables the financing of investments in development projects such as M25 and the investment generated both a profitable construction contract and a solid development gain.

4 Skanska Year-end report, January–December 2016
Nordic countries
Sweden
Norway
Finland
Central Europe
Building, non-residential
Building, residential Civil
Nordic countries
Sweden
Norway
Finland
Other European countries
Poland
Czech Republic 1
United Kingdom –
North America
USA –
The View, Nacka Strand, Sweden.
A1 Motorway, Poland.
Market outlook, next 12 months
1 Including Slovakia.
Nordic countries
Sweden
Norway
Finland
Denmark
Central Europe
Poland
Czech Republic
Hungary
Romania
North America
USA
Weaker outlook compared to previous quarter. Unchanged outlook compared to previous quarter. Improved outlook compared to previous quarter.
Very strong market coming 12m Strong market coming 12m Stable market coming 12m Weak market coming 12m Very weak market coming 12m
Atrium 2, Warsaw, Poland.
All countries
ConstructionThe overall construction market outlook continues to be positive.
The non-residential and civil markets in Sweden are very strong, although the landscape is competitive. The residential building market continues to be strong. In Norway, the outlook for the civil market remains positive, but with significant and increasing competition in new bids. The non-residential market also benefits from increased public investments, while the residential building market is stable with the exception of certain regions that are dependent on the energy sector. The overall market situation in Finland remains relatively weak, but the non-residential building market is improving.
The civil market remains strong in the UK, whilst the uncertainty in the non-residential building market post Brexit continues. The civil market in Poland and Czech Republic are still impacted by delays in the allocation of designated EU funds.
In the U.S. the market is strong and the new U.S. President is over time expected to increase investments into infrastructure even further. The market for large and complex civil construction projects remains good, although competition is intense. The building construction market is strong in the aviation, education, data center, life science and healthcare sectors.
Residential Development The Swedish residential market is still strong and the new amortization requirements have led to a more balanced market. The Norwegian market is stable but is being negatively affected by low oil prices in certain regions that are dependent on the energy sector. There are signs of improvement in the Finnish market.
In Central Europe the market is solid, with high transaction volumes and stability in sales prices.
Common to all home markets, except for Finland, is the challenge to acquire and develop land due to increasing prices and long permitting processes.
Commercial Property DevelopmentVacancy rates for office space in most of the Nordic and Central European cities where Skanska has operations are stable. Vacancy rates are low in Sweden in particular. Demand for office space is strong in Poland and continues to improve in other parts of Central Europe. In the U.S., demand from tenants continues to improve in Washington D.C. and remains strong in Boston and Seattle, while demand in Houston is weaker due to low oil prices.
Modern properties with high quality tenants are in demand from property investors, resulting in attractive valuations for these properties. Investor appetite remains strong in the Nordics, especially Sweden, the U.S. and Central Europe. In Poland the foreign investor appetite is still strong but has softened somewhat due to the political turbulence.
In all home markets, except for Finland, there is a challenge to acquire and develop land due to increasing prices and long permitting processes.
Infrastructure Development The public-private partnership (PPP) market in the U.S. is strong, albeit with considerable competition. In the other markets the pipeline is thin, with the Norwegian market showing signs of improvement.
Slightly improving market conditions during the quarter.

Skanska Year-end report, January–December 2016 5
Group
Performance analysis
Revenue decreased by 2 percent and amounted to SEK 151.3 billion (154.9); adjusted for currency effects, revenue decreased by 1 percent.
Operating income increased by 27 percent and amounted to SEK 8.2 billion (6.5); there were no currency effects during the period. The increase is mainly attributable to Project Development.
In the fourth quarter the divestment of the investment in the M25 motorway project in the UK contributed positively, while impair-ments in the Commercial Property and Infrastructure Development streams amounting to about SEK 500 M contributed negatively. The comparable period includes writedowns in the U.S. Construction operations amounting to SEK 750 M.
Central expenses totaled SEK –1,140 M (–1,346). As of January 1, 2013, the Latin American operation is included in Central. In the comparable period costs amounting to SEK 0.3 billion incurred in connection with closing down the Latin American operations. Skanska has no ongoing projects in Latin America. The elimination of gains in Intra-Group projects amounted to SEK 34 M (–51).
Net financial items amounted to SEK –118 M (–313). Lower inter-est costs and the absence of negative currency effects are the main reasons for the decrease. Non-recurring costs impacted the first quarter of 2016 by SEK –24 M, stemming from negative change in market value on interest rate swaps and in the comparable period by SEK –80 M, relating to a currency hedge closed prior to maturity.
For a specification of net financial items according to IFRS, see page 20.
Taxes for the period amounted to SEK –1,555 M (–1,219), corre-sponding to an effective tax rate of about 19 (20) percent.
Revenue and earnings
SEK MJan-Dec
2016Jan-Dec
2015Change,
%Oct-Dec
2016Oct-Dec
2015Change,
%
Revenue 151,307 154,935 –2 42,237 43,247 –2
Operating income 1, 2 8,199 6,461 27 3,300 3,060 8
Net financial items –118 –313 –60 58
Income after financial items 8,081 6,148 31 3,240 3,118 4
Taxes –1,555 –1,219 –537 –584
Profit for the period 6,526 4,929 32 2,703 2,534 7
Earnings for the period per share, SEK3 15.89 11.96 33 6.59 6.15 7
Earnings for the period per share according to IFRSs, SEK3 13.96 11.63 20 5.65 6.27 –10
1 Central, SEK –1,140 M (–1,346). 2 Eliminations, SEK 34 M (–51).3 Earnings for the period attributable to equity holders divided by the average number of
shares outstanding.
Changes and currency rate effects
Jan-Dec 2016 / Jan-Dec 2015
Change in SEKChange in local
currency Currency effect
Revenue –2% –1% –1%
Operating income 27% 27% 0%
Revenue per segment, January–December 2016
Operating income per segment, January–December 2016
• Construction, 86%• Residential Development, 8%• Commercial Property Development, 6%• Infrastructure Development, 0%
• Construction, 38%• Residential Development, 17% • Commercial Property Development, 25%• Infrastructure Development, 20%
Revenue and operating income, rolling 12 months
SEK bn, operating income SEK bn, revenue
0
2
4
6
8
10
0
40
80
120
160
200
Q22013Q1Q4Q3Q2
2012Q1 Q4Q3Q2
2016Q1Q4Q3Q2
2015Q1Q4Q3Q2
2014Q1Q4Q3
RevenueOperating income
The operating income in the first quarter of 2012 includes a profit of SEK 4.5 billion from the sale of Autopista Central in Chile.

6 Skanska Year-end report, January–December 2016
Operating cash flow from operations amounted to SEK –1,154 M (7,660). Net investments totaled SEK –719 M (2,685). Change in working capital impacted cash flow negatively in the amount of SEK –1,328 M (3,312), and is a result of the divestment of the investment in the M25 motorway project, where the payment of SEK 3.1 billion will be received in the first quarter of 2017. This together with the change in net investments is the main reason for the lower operating cash flow from operations compared to the same period 2015.
Taxes paid in business operations amounted to SEK –1,237 M (–966). Commercial Property and Infrastructure Development assets
sold but not yet transferred will have a positive effect on cash flow of about SEK 5.9 billion in 2017, of which SEK 4.3 billion in the first quarter of 2017.
Group
Cash flow
The free working capital in Construction amounted to SEK 22.5 billion (20.5) with the average free working capital in relation to rev-enue in Construction in the past 12 months at 13.9 percent. The free working capital in Construction has increased due to improved cash flow profile in a number of projects and the maintained focus on cash generation in the Construction stream. Cash flow due to changes in working capital in Construction amounted to SEK 1,051 M (2,375).
2nd Avenue Subway, New York, U.S.
Operating cash flow
SEK MJan-Dec
2016Jan-Dec
2015Change,
%Oct-Dec
2016Oct-Dec
2015Change,
%
Cash flow from business operations 2,302 3,077 –25 466 939 –50
Change in working capital –1,328 3,312 – 627 4,312 –85
Net divestments(+) /investments(–) –719 2,685 – 636 4,338 –85
Cash flow adjustment –96 –68 41 –65 –21 210
Cash flow from business operations before taxes paid 159 9,006 –98 1,664 9,568 –83
Taxes paid in business operations –1,237 –966 28 –258 –132 95
Cash flow from financing operations –76 –380 –80 –78 31 –
Operating cash flow from operations –1,154 7,660 – 1,328 9,467 –86
Net strategic divest-ments(+)/investments(–) 862 456 89 524 88 495
Dividend etc –3,874 –3,226 20 –135 –102 32
Cash flow before change in interest-bearing receivables and liabilities –4,166 4,890 – 1,717 9,453 –82
Change in interest-bearing receivables and liabilities –2,400 –2,235 7 –852 –337 153
Cash flow for the period –6,566 2,655 – 865 9,116 –91
Operating cash flow from operations
• Operating cash flow from operations, quarterly Rolling 12 months
-6
-4
-2
0
2
4
6
8
10
SEK bn
Q22013Q1Q4Q3Q2
2012Q1 Q4Q3Q2
2016Q1Q4Q3
2015Q1Q4Q3Q2
2014Q1Q4Q3 Q2
Free working capital in Construction
• Free working capital, SEK bn • Free working capital, end of Q4, SEK bn
Average free working capital/Construction revenue, rolling 12 months, %
0
5
10
15
20
25
SEK bn
0
2
4
6
8
10
12
14
16
18
%
Q22013Q1Q4Q3Q2
2012Q1 Q4Q3Q2
2016Q1Q4Q3Q2
2015Q1Q4Q3Q2
2014Q1Q4Q3

Skanska Year-end report, January–December 2016 7
ensure a strong financial capacity for the Group. External loans to housing co-ops totaled SEK 4.8 billion (Sep. 30, 2016: 5.4) and the net pension liabilities totaled SEK 4.5 billion (Sep. 30, 2016: 7.1), a decrease by SEK 2.6 billion mainly due to higher discount rates in the UK and Sweden. At the end of the quarter, capital employed amounted to SEK 42.6 billion (Sep. 30, 2016: 38.7).
Equity
Financial position
The operating net financial assets amounted to SEK 10.6 billion (Sep. 30, 2016: 9.2). The interest-bearing net receivables amounted to SEK 1.2 billion (Sep. 30, 2016: –3.2). Commercial Property and Infrastructure Development assets sold but not yet transferred will have a positive effect of about SEK 5.9 billion in 2017, of which SEK 4.3 billion in the first quarter of 2017.
Skanska’s committed unutilized credit facilities of SEK 5.7 billion, in combination with operating net financial assets of SEK 10.6 billion,
Balance sheet – Summary
SEK bnDec 31,
2016Dec 31,
2015
Total assets 106.5 97.7
Total equity 27.5 24.2
Interest-bearing net receivables (+)/net debt (–) 1.2 6.3
Operating net financial assets(+)/liabilities(–) 10.6 13.8
Capital employed, closing balance 42.6 38.4
Equity/assets ratio, % 25.8 24.8
Change in interest-bearing receivables and liabilities
SEK MJan-Dec
2016Jan-Dec
2015Oct-Dec
2016Oct-Dec
2015
Opening balance interest-bearing net receivables(+)/net debt(–) 6,317 698 –3,210 –3,376
Cash flow for the period –6,566 2,655 865 9,116
Less change in interest-bearing receivables and liabilities 2,400 2,235 852 337
Cash flow before change in interest- bearing receivables and liabilities –4,166 4,890 1,717 9,453
Translation differences, net receivables/net debt 972 266 605 –189
Remeasurements of pension liabilities –1,022 608 2,641 395
Interest-bearing liabilites acquired/divested –663 120 –568 58
Other changes, interest-bearing net receivables/net debt –219 –265 34 –24
Change in interest-bearing net receivables/net debt –5,098 5,619 4,429 9,693
Closing balance interest-bearing net receivables(+)/net debt(–) 1,219 6,317 1,219 6,317
Pension liability, net 4,537 3,740 4,537 3,740
Loans to housing co-ops 4,839 3,761 4,839 3,761
Closing balance operating net financial assets(+)/liabilities(–) 10,595 13,818 10,595 13,818
Changes in equity
SEK MJan-Dec
2016Jan-Dec
2015Oct-Dec
2016Oct-Dec
2015
Opening balance 24,206 21,405 21,221 21,440
Dividend to shareholders –3,075 –2,775 0 0
Other changes in equity not included in total comprehensive income for the year –513 –192 –66 –34
Profit for the period 5,735 4,791 2,318 2,582
Other comprehensive income
Translation differences 1,209 47 277 –387
Effects of remeasurements of pensions –938 610 2,292 378
Effects of cash flow hedges 882 320 1,464 227
Closing balance 27,506 24,206 27,506 24,206
The Group’s equity amounted to SEK 27.5 billion (24.2), the equity/assets ratio was 25.8 percent (24.8) and the net debt/equity ratio amounted to –0.0 (–0.3).
The effects of remeasurements of pensions amounted to SEK –938 M (610). The change is mainly related to lower discount rates in the UK and Sweden during the year. The effects of cash flow hedges, SEK 882 M (320) are mainly related to changes in the interest-rate swaps attributable to Infrastructure Development projects, including effects of the interest-rate swaps from the divestment of the investment in the M25 motorway project no longer being included in the cash flow hedges.
Translation differences amounted to SEK 1,209 M (47) mainly due to a strengthening U.S. dollar. As of December 31, 2015, Skanska no longer hedges its equity in foreign subsidiaries against the Swedish krona.
The unrealized surplus values less standard tax in the development units amounted to SEK 9.3 billion (Sep. 30, 2016: 10.9), of which SEK 0.6 billion is realized according to segment reporting.
Operating net financial assets/liabilities
0
2
4
6
8
10
12
14
16
SEK bn
Q22013 Q1Q4Q3Q2
2012 Q1 Q4Q3Q2
2016 Q1Q4Q3Q2
2015 Q1Q4Q3Q2
2014 Q1Q4Q3
Adjusted equity, less standard tax of 10 percent
0
5
10
15
20
25
30
35
40
Dec 31, 2016Sep 30, 2016Dec 31, 2015
SEK bn
• Effect in unrealized equity in Infrastructure Development
• Unrealized Commercial Property Development gains
• Unrealized surplus land value in Residential Development
• Equity attributable to equity holders

8 Skanska Year-end report, January–December 2016
The Group’s investments amounted to SEK –20,799 M (–17,611). Divestments amounted to SEK 20,942 M (20,752) and the Group’s net divestments amounted to SEK 143 M (3,141).
In Construction, investments totaled SEK –1,829 M (–1,645). The investments were mainly related to property, plant and equipment for the Group’s own production. Net investments in Construction amounted to SEK –1,234 M (–975). Depreciation of property, plant and equipment amounted to SEK –1,271 M (–1,391).
In Residential Development, investments totaled SEK –9,148 M (–6,675), of which about SEK –1,994 M (–1,351) relates to the acqui-sition of land corresponding to 5,759 building rights. Divestments amounted to SEK 7,517 M (8,630). Net investments in Residential Development amounted to SEK –1,631 M (1,955).
In Commercial Property Development, investments totaled SEK –8,364 M (–8,826) of which SEK –1,936 M (–1,240) related to invest-ments in new land. Divestments amounted to SEK 9,043 M (9,914). Net divestments in Commercial Property Development amounted to SEK 679 M (1,088).
Investments in Infrastructure Development amounted to SEK –1,336 M (–234). Divestments amounted to SEK 3,102 M (1,114).
The increased capital employed in Infrastructure Development is due to the SEK 3.1 billion receivable for the divestment of the invest-ment in the M25 motorway project. Payment is scheduled for the first quarter 2017.
Investments and divestments
Investment in office project at Universitetsholmen in Malmö, Sweden. Divestment of Hotel Westin Warsaw, Poland.
Investments, divestments and net divestments/investments
SEK MJan-Dec
2016Jan-Dec
2015Change,
%Oct-Dec
2016Oct-Dec
2015Change,
%
Investments
Construction –1,829 –1,645 11 –549 –418 31
Residential Development –9,148 –6,675 37 –2,951 –1,605 84
Commercial Property Development –8,364 –8,826 –5 –2,683 –2,879 –7
Infrastructure Development –1,336 –234 471 –576 –90 540
Other –122 –231 –16 –66
Total –20,799 –17,611 18 –6,775 –5,058 34
Divestments
Construction 595 670 –11 107 467 –77
Residential Development 7,517 8,630 –13 2,463 1,693 45
Commercial Property Development 9,043 9,914 –9 1,761 6,222 –72
Infrastructure Development 3,102 1,114 178 3,087 1,103 180
Other 685 424 517 –1
Total 20,942 20,752 1 7,935 9,484 –16
Net divestments(+)/investments(–)
Construction –1,234 –975 27 –442 49 –
Residential Development –1,631 1,955 – –488 88 –
Commercial Property Development 679 1,088 –38 –922 3,343 –
Infrastructure Development 1,766 880 101 2,511 1,013 148
Other 563 193 501 –67
Total 143 3,141 –95 1,160 4,426 –74
Of which strategic 862 456 524 88
Capital employed in Development Streams
SEK M Dec 31, 2016 Sep 30, 2016 Dec 31, 2015
Residential Development 11,607 10,707 9,277
Commercial Property Development 19,936 18,517 16,510
Infrastructure Development 5,434 2,071 1,843
Total in Development Streams 36,977 31,295 27,630
Investments and divestments
-8
-6
-4
-2
0
2
4
6
8
10
SEK bn
• Divestments, quarterly
• Investments, quarterly
Net investments, rolling 12 months
Q22013Q1Q4Q3Q2
2012Q1 Q4Q3Q2
2016Q1Q4Q3Q2
2015Q1Q4Q3Q2
2014Q1Q4Q3

Skanska Year-end report, January–December 2016 9
Order bookings and order backlog in Construction
SEK bn Jan-Dec 2016 Jan-Dec 2015 Oct-Dec 2016 Oct-Dec 2015
Order bookings 170.2 122.1 39.6 29.9
Order backlog 1 196.3 158.2 – –
1 Refers to the end of each period.
Changes and currency rate effects
Change in SEKChange
in local currency Currency effect
Jan-Dec 2016 / Jan-Dec 2015
Order bookings 39% 40% –1%
Dec 31, 2016 / Sep 30, 2016
Order backlog 2% 0% 2%
Construction – Order situation
ESS Research Facility, Lund, Sweden.
Major orders in the quarter
Business Unit Contract Amount SEK M Client
Skanska Sweden & Skanska UK
Research Facility
2,500 European Spallation Source (ESS)
Skanska UK Rail 1,900 Network Rail
Skanska USA Building
Hospital 1,200 University of Virginia
Skanska UK Highway maintenance
820 Devon County Council
Skanska USA Civil Highway 750 California Department of Transportation
Skanska UK Hospital 700 Great Ormond Street Hospital
Performance analysis, business streams
Order bookings amounted to SEK 170.2 billion (122.1); adjusted for currency effects, order bookings increased by 40 percent. All Busi-ness Units, except Finland, had higher order bookings than revenue in 2016. On a rolling 12 months basis the book-to-build ratio was 123 percent (Sep. 30, 2016: 117). Order bookings in the U.S. business were especially strong, driven by the LaGuardia Airport project.
At the end of the quarter, the order backlog amounted to SEK 196.3 billion, compared to 191.6 billion at the end of the previous quarter. The order backlog corresponds to about 17 months of pro-duction (Sep. 30, 2016: 17).
Order backlog, revenue and order bookings
SEK bn
0
50
100
150
200
• Order backlog
Order bookings, rolling 12 monthsRevenue, rolling 12 months
Order bookings per quarter
Q22013Q1Q4Q3Q2
2012Q1 Q4Q3Q2
2016Q1Q4Q3Q2
2015Q1Q4Q3Q2
2014Q1Q4Q3

10 Skanska Year-end report, January–December 2016
Revenue in the Construction business stream decreased by 2 percent and amounted to SEK 138.0 billion (140.6); adjusted for currency effects, the revenue decreased by 1 percent. Operating income amounted to SEK 3,546 M (3,874); adjusted for currency effects, operating income decreased by 7 percent. The operating margin was 2.6 percent (2.8). The comparable period includes writedowns in the U.S. Construction operations amounting to SEK 750 M.
The majority of the Construction units had a stable performance, with Sweden and USA Building standing out as the top performers. However, as communicated earlier the market in Poland has been negatively impacted by delays in the allocation of designated EU funds, leading to a rapid decrease of small to medium sized projects. A restructuring and rightsizing of the organization was done in the third quarter. This, together with continued weak performance in certain projects, affected the Polish operating margin negatively during the year. Long-term, the Polish market is viewed as being robust as EU funds are in place.
In USA Civil the operating margin continues to be affected by lower revenue, increased S&A costs and extended negotiations with clients regarding design changes.
Changes and currency rate effects
Jan-Dec 2016 / Jan-Dec 2015
Change in SEKChange in local
currency Currency effect
Revenue –2% –1% –1%
Operating income –8% –7% –1%
Revenue and earnings
SEK MJan-Dec
2016Jan-Dec
2015Change,
%Oct-Dec
2016Oct-Dec
2015Change,
%
Revenue 138,001 140,648 –2 38,827 37,979 2
Gross income 10,080 10,039 0 2,975 3,077 –3
Selling and adminis-trative expenses –6,567 –6,198 6 –1,722 –1,685 2
Income from joint ventures and associa-ted companies 33 33 11 6
Operating income 3,546 3,874 –8 1,264 1,398 –10
Gross margin, % 7.3 7.1 7.7 8.1
Selling and adminis-trative expenses, % –4.8 –4.4 –4.4 –4.4
Operating margin, % 2.6 2.8 3.3 3.7
Employees 40,991 42,193
Construction
Waterloo and South West Upgrade, UK.
SEK bn
Revenue and operating margin, rolling 12 months
%
0
1
2
3
4
5
6
0
25
50
75
100
125
150
RevenueOperating margin
Q22013Q1Q4Q3Q2
2012Q1 Q4Q3Q2
2016Q1Q4Q3Q2
2015Q1Q4Q3Q2
2014Q1Q4Q3

Skanska Year-end report, January–December 2016 11
Breakdown of carrying amounts
SEK M Dec 31, 2016 Sep 30, 2016 Dec 31, 2015
Completed projects 631 847 934
Ongoing projects 6,955 6,112 4,329
Undeveloped land and development properties 6,364 5,799 5,107
Total 13,950 12,758 10,370
Residential Development
Revenue and earnings
SEK MJan-Dec
2016Jan-Dec
2015Change,
%Oct-Dec
2016Oct-Dec
2015Change,
%
Revenue 13,264 12,298 8 4,529 3,197 42
Gross income 2,164 1,724 26 813 453 79
Selling and adminis-trative expenses –559 –550 2 –133 –127 5
Income from joint ventures and associa-ted companies 0 0 0 0
Operating income 1,605 1,174 37 680 326 109
Gross margin, % 16.3 14.0 18.0 14.2
Selling and adminis-trative expenses, % –4.2 –4.5 –2.9 –4.0
Operating margin, % 12.1 9.5 15.0 10.2
Return on capital employed, % 1 17.1 14.4 – –
1 See definition on page 17.
Revenue in the Residential Development business stream amounted to SEK 13,264 M (12,298). The number of homes sold totaled 4,603 (4,093) in 2016. Operating income amounted to SEK 1,605 M (1,174). The operating margin increased to 12.1 percent (9.5) and was espe-cially strong in Sweden. In Central Europe a non-recurring cost related to adjustment of land value was taken in the second quarter.
The return on capital employed increased to 17.1 percent (14.4).
A breakdown of the carrying amounts is presented in the table above. Undeveloped land and development properties amounted to SEK 6.4 billion (Sep. 30, 2016: 5.8), with an estimated market value of around SEK 7.4 billion (Sep. 30, 2016: 6.8). The undeveloped land and development properties correspond to Skanska-owned building rights for 24,900 homes and 700 building rights held by joint ven-tures. In addition, subject to certain conditions, the business stream has the right to purchase 10,800 building rights.
At the end of the quarter, there were 7,421 homes (Sep. 30, 2016: 6,680) under construction. Of these, 77 percent (Sep. 30, 2016: 79) were sold. The number of completed, unsold homes totaled 158 (Sep. 30, 2016: 174) and most of these homes are in Finland and Norway. Efforts to reduce the number of unsold completed units in Finland and Norway remain. In 2016, construction was started on 4,848 homes (4,000).
Homes under construction and unsold
Dec 31, 2016 Dec 31, 2015
Homes under construction 7,421 5,689
of which sold, % 77 76
Completed unsold, number of homes 158 237
Homes sold and started
Jan-Dec 2016 Jan-Dec 2015
Homes sold 4,603 4,093
Homes started 4,848 4,000
Revenue and operating margin, rolling 12 months
% SEK bn
-15
-10
-5
0
5
10
15
0
3
6
9
12
15
18
Q22013Q1Q4Q3Q2
2012Q1 Q4Q3Q2
2016Q1Q4Q3Q2
2015Q1Q4Q3Q2
2014Q1Q3 Q4
RevenueOperating margin
Homes sold and started, rolling 12 months
0
1,000
2,000
3,000
4,000
5,000Homes
Q22013 Q1Q4Q3Q2
2012 Q1 Q4Q3Q2
2016 Q1Q4 Q3 Q2
2015 Q1 Q4Q3Q2
2014 Q1 Q4 Q3
SoldStarted
Homes under contruction and unsold
0
1,000
2,000
3,000
4,000
5,000
6,000
7,000
8,000
Homes
• Sold under construction • Unsold under contruction • Unsold completed
Q22013 Q1Q4Q3Q2
2012 Q1 Q4Q3Q2
2016 Q1 Q4 Q3Q2
2015 Q1 Q4 Q3Q2
2014 Q1 Q4Q3

12 Skanska Year-end report, January–December 2016
Revenue and earnings
SEK MJan-Dec
2016Jan-Dec
2015Change,
%Oct-Dec
2016Oct-Dec
2015Change,
%
Revenue 10,226 9,034 13 2,673 5,405 –51
of which from divest-ment of properties 9,555 8,457 13 2,495 5,190 –52
Gross income 3,067 2,661 15 536 1,523 –65
Selling and administra-tive expenses –751 –677 11 –229 –207 11
Income from joint ventures and associated companies 20 –37 15 –45
Operating income 2,336 1,947 20 322 1,271 –75
of which from divest-ment of properties 3,111 2,564 21 721 1,513 –52
Return on capital employed, % 1 14.8 15.6
1 See definition on page 17.
Commercial Property Development
In the Commercial Property Development business stream, divest-ments worth SEK 9,555 M (8,457) were made in 2016. Operating income amounted to SEK 2,336 M (1,947), and included gains from property divestments totaling SEK 3,111 M (2,564). In the fourth quarter writedowns in two projects in Houston, USA, amounting
to about SEK 200 M were taken. The return on capital employed decreased to 14.8 percent (15.6).
At the end of the quarter, Commercial Property Development had 47 ongoing projects out of which two projects are developed in joint ventures. In the fourth quarter, nine new projects were started, and five projects were completed. The 47 ongoing projects represent leasable space of about 728,000 sq m with an occupancy rate of 41 percent, measured in rent. The degree of completion is 43 percent. Their investment value upon completion is expected to total SEK 20.3 billion, with an estimated market value of SEK 25.5 billion upon completion.
Of the ongoing projects, seven were divested according to segment reporting. These projects represent an investment value upon com-pletion of SEK 1.5 billion, with a market value of SEK 1.9 billion.
The market value of completed projects, excluding properties divested but not yet transferred to the buyers, was SEK 5.7 billion. The occupancy rate measured in rent totaled 72 percent.
At the end of the quarter the unrealized gains, excluding properties divested but not yet transferred to the buyers, totaled SEK 6.6 billion divided by SEK 4.8 billion in ongoing projects, SEK 1.5 billion in com-pleted projects and SEK 0.3 billion in undeveloped land and develop-ment properties. Realized gains accumulated to SEK 3.1 billion (2.6).
Accumulated eliminations of intra-Group project gains amounted to SEK 285 M at the end of the period. These eliminations are released at Group level as each project is divested.
During 2016 new leases were signed for 379,000 sq m (375,000).
Breakdown of investment value and market value
SEK M
Investment value, end
of period
Investment value upon completion
Market value 1
Occupancy rate, %
Degree of comple-tion, %
Ongoing projects 2 8,703 20,340 25,534 41 43
Completed projects 3 5,107 5,107 6,840 72 100
Undeveloped land and development properties 7,912 7,912 8,202
Total 21,722 33,359 40,576
of which carrying amount 4 20,699 32,099
of which completed projects sold according to segment reporting 896 896 1,154
of which ongoing projects sold according to segment reporting 873 1,524 1,929
1 Market value according to appraisal on December 31, 2016. Estimated market value at completion fully leased.
2 Skanskas share of total production cost in JVs is SEK 804 M (end of period) and SEK 1,107 M (upon completion).
3 Skanska’s share of total production cost in JVs is SEK 935 M end of period and upon completion.4 Includes Skanska’s total equity investment in JV of SEK 716 M (end of period) and SEK 782 M
(upon completion) and tenant improvement and leasing commissions in CDUS of 217 MSEK (Completed projects) and 38 MSEK (Ongoing projects).
Revenue and operating income from property divestments
0
2
4
6
8
10
12
14
SEK bn
• Revenue from divestments, rolling 12 months
Q22013Q1 Q4Q3Q2
2012 Q1 Q4 Q3 Q2
2016Q1 Q4 Q3 Q2
2015 Q1 Q4 Q3 Q2
2014 Q1 Q4 Q3
Operating income from divestments, rolling 12 months
Leasing
0
50
100
150
200
250
300
350
400
450
000 sq m
• Leasing, quarterly Leasing, rolling 12 months
Q22013 Q1Q 4Q3Q2
2012 Q1 Q4 Q3 Q2
2016 Q1 Q4 Q3 Q2
2015 Q1 Q4 Q3 Q2
2014 Q1 Q4 Q3
Unrealized and realized gains
0
1
2
3
4
5
6
7
SEK bn
Unrealized gains in: • Land • Ongoing projects • Completed projects Realized gains, rolling 12 months
Q22013Q1 Q4Q3Q2
2012 Q1 Q4 Q3 Q2
2016 Q1 Q4 Q3 Q2
2015 Q1 Q4 Q3 Q2
2014 Q1 Q4 Q3

Skanska Year-end report, January–December 2016 13
Infrastructure Development
The operating income for the Infrastructure Development business stream totaled SEK 1,818 M (863). The return on capital employed increased to 41.1 percent (12.7). In the fourth quarter Skanska divested its investment in the M25 motorway project for about SEK 3.1 billion.
The net present value of projects at the end of the period decreased to SEK 4.3 billion (Dec. 31, 2015: 4.8). The decrease is attributable to investments/divestments, consisting of the divestment of the invest-ment in the M25 motorway project, investments in existing projects, as well as impairments amounting to about SEK 300 M in two opera-tional wind power projects in Sweden and for investments in one project no longer pursued in UK. The increase in derisk/time value is partly attributable to a revaluation of the A1 motorway according to the agreed price in the signed Sale and Purchase Agreement.
The remaining investment obligations relating to ongoing Infra-structure Development projects amounted to about SEK –0.9 billion (Dec. 31, 2015: –1.3).
At the end of the period, the carrying amount of shares, participa-tions, subordinated receivables and concessions in Infrastructure Development before cash-flow hedges was SEK 2.9 billion (Dec. 31, 2015: 3.1). At the end of the quarter, unrealized development gains totaled about SEK 1.4 billion (Dec. 31, 2015: 1.7).
Cash flow hedges, for which the change in value is recognized as other comprehensive income, reduced the carrying amount and thereby also equity, by an amount of SEK 0.6 billion (Dec. 31, 2015: 1.6).
Elizabeth River Tunnels, Virginia, U.S.
Revenue and earnings
SEK MJan-Dec
2016Jan-Dec
2015Change,
%Oct-Dec
2016Oct-Dec
2015Change,
%
Revenue 237 106 124 35 29 21
Gross income 56 –128 – 1 –41 –
Selling and administra-tive expenses –147 –156 –6 –34 –44 –23
Income from joint ventures and associated companies 1,909 1,147 66 1,508 543 178
Operating income 1,818 863 111 1,475 458 222
of which gains from divestments of shares in projects 1,729 420 312 1,729 420 312
Return on capital employed, %1 41.1 12.7
1 See definition on page 17.
Unrealized development gains
SEK bn Dec 31, 2016 Sep 30, 2016 Dec 31, 2015
Present value of cash flow from projects 5.2 6.5 6.1
Present value of remaining investments –0.9 –0.8 –1.3
Net present value of projects 4.3 5.7 4.8
Carrying amount before Cash flow hedge / Carrying amount –2.9 –3.8 –3.1
Unrealized development gain 1.4 1.9 1.7
Cash flow hedge 0.6 2.1 1.6
Effect in unrealized equity 1 2.0 4.0 3.3
1 Tax effects not included.
Estimated present value of cash flow from projects per geographic area
• Nordics, 28%• Other European countries, 27%• United States, 45%
Changes in net present value
SEK bn
0
1
2
3
4
5
6
4.8
-1.7
4.3
1.0
Dec 31, 2016Currency effect
Investments/Divestments
Derisk/Time value
Dec 31, 2015
0.2

14 Skanska Year-end report, January–December 2016
PersonnelDuring the period, the average number of employees in the Group was 42,903 (48,470). The decrease is mainly attributable to the closing down of the operations in Latin America. At the end of the quarter the number of employees amounted to 40,642 (Sep. 30, 2016: 42,128). The decrease is mainly attributable to adjustments in the Polish organization.
Transactions with related partiesFor the nature and extent of transactions with related parties, see the Annual Report. There were no new significant transactions during the quarter.
Material risks and uncertaintiesThe Construction and Project Development business involves a con-siderable amount of risk management. Almost every project is unique. Size, shape, the environment – everything is different for each new assignment. The Construction and Project Development business dif-fers in this way from typical manufacturing, which operates in perma-nent facilities with long production runs.
In Skanska’s operations, there are many different types of risks. Identifying, managing and pricing these risks is of fundamental importance to the Group’s profitability. Risks are normally of a techni-cal, legal and financial nature, but political, ethical, social and envi-ronmental considerations are also part of assessing potential risks.
To ensure a systematic and uniform assessment of risks and oppor-tunities, the entire Skanska Group uses a shared procedure for identi-fying and managing risks. With the aid of this model, Skanska evalu-ates projects continuously – from preparation of tenders to completion of assignments.
From time to time, disputes arise with customers about contractual terms related to both ongoing and completed projects. Their outcomes are often difficult to predict.
For further information about risks and a description of key estimates and judgments, see the Report of the Directors and Notes 2 and 6 in the 2015 Annual Report, as well as the section above on market outlook.
Update on Skanska Brasil and Czech RepublicAs announced in March 2015, Skanska Brasil became involved in investigations by the Brazilian Comptroller General (CGU) and the Administrative Council of Economic Defense (CADE). These inves-tigations focused on corruption and competition matters in relation to certain Petrobras projects. In late 2015, the two entities initiated administrative proceedings against Skanska Brasil and twenty other companies. In June 2016, the CGU (now known as the Ministry of Transparency, Inspection and Control) excluded Skanska from public procurement for a period of no less than 2 years. The CADE proceeding remains in its early stages and is expected to carry on for a number of years.
Other authorities have also commenced proceedings arising from the same investigation. As Skanska announced in April 2016, the Brazilian Federal Government (AGU) brought a civil suit against seven companies, including Skanska Brasil, as well as seven indi-viduals unrelated to Skanska. That proceeding focused on allegedly improper payments by one of Skanska Brasil’s joint venture partners. The Judge has decided to reject the claim against Skanska Brasil. In
the case going forward, one of our joint venture partners will remain defendant in the lawsuit. This decision has been appealed by AGU.
There is considerable uncertainty as to how all of these proceed-ings will develop and when they will conclude.
In July 2014, and prior to these Brazilian proceedings, Skanska decided to exit the Latin American market, following several years of financial losses. Skanska replaced the local management in Latin America and appointed qualified personnel from Sweden to direct the closing of the Latin American operations. Skanska has had no ongoing projects in Latin America since March 2016.
Skanska has been informed by the prosecutor in Stockholm that this authority has initiated a preliminary investigation into matters relating to Skanska’s businesses in Brazil and the Czech Republic.
Malta project claimSkanska has in December 2016 received a claim from the Maltese government regarding defective concrete in the Mater Dei Hospital, a hospital project on Malta that Skanska International was involved in starting 1995. Skanska refutes this claim in its entirety.
Other matters
Repurchase of sharesAt the Board meeting on April 6, 2016, the Board resolved to exercise the Annual General Meeting’s authorization concerning the repur-chase of shares on the following terms: on one or several occasions, but no later than the Annual General Meeting in 2017, not more than 4,000,000 Series B shares in Skanska may be acquired, the aim of which is to secure delivery of shares to participants in Skanska’s Employee Ownership Program, Seop (2014 – 2016).
The Board resolved also to exercise the Annual General Meeting’s authorization concerning the repurchase of shares on the follow-ing terms: on one or several occasions, but no later than the Annual General Meeting in 2017, not more than 1,500,000 Series B shares in Skanska may be acquired, the aim of which is to secure delivery of shares to participants in Skanska’s Employee Ownership Program, Seop (2017 – 2019).
Further the Board resolved to exercise the Annual General Meet-ing’s authorization concerning transfer of shares on the following terms: on one or several occasions, but no longer than the Annual General Meeting in 2017, not more than 763,000 Series B shares in Skanska may be transferred, the aim of which is to cover mainly social security costs that may occur in relation to Skanska’s Employee Own-ership Program, Seop (2011 – 2013) and Seop (2014 – 2016).
Acquisition, or transfer, may only be made on Nasdaq Stockholm within the price interval prevailing at any given time, meaning the interval between the highest purchase price and the lowest selling price. On December 31, Skanska held 10,594,644 Series B shares in its own custody.
Annual Meeting The Annual General Meeting will be held at 10:00 a.m. CET on April 4, 2017 at Stockholm Waterfront Congress Centre, Stockholm, Swe-den. The invitation to attend the meeting will be published latest on March 7, 2017.

Skanska Year-end report, January–December 2016 15
Accounting principlesFor the Group, this interim report has been prepared in compliance with IAS 34 Interim Financial Reporting, the Annual Accounts Act and the Securities Market Act. For the Parent Company, the interim report has been prepared in compliance with the Annual Accounts Act and the Securities Market Act, which is pursuant to the Swedish Financial Reporting Board’s Recommendation RFR 2. The account-ing principles and assessment methods presented in the Annual Report for 2015 have been applied.
Relation between consolidated operating cash flow statement and consolidated cash flow statementThe difference between the operating cash flow statement and the summary cash flow statement in compliance with IAS 7 Cash flow Statements, is presented in the 2015 Annual Report, Note 35.
Segment and IFRS reportingSkanska’s business streams Construction, Residential Development, Commercial Property Development and Infrastructure Development represent the group’s operating segments. Tables in this report that refer to segment reporting are shown with a shaded background. In certain cases the segment reporting differs from the consolidated results presented in accordance with International Financial Report-ing Standards, IFRS.
Construction includes both building construction and civil con-struction. Revenues and earnings are reported under the percentage of completion (“PoC”) method for both segment and IFRS reporting.
Residential Development develops residential projects for imme-diate sale. Homes are adapted to selected customer categories. The units are responsible for planning and selling the projects. The related construction assignments are performed by the construction units in the Construction segment in each market. In the segment reporting Residential Development recognizes revenue and earnings when bind-ing contracts are signed for the sale of homes. In the IFRS reporting revenues are instead recognized when the buyer takes possession of the homes.
Commercial Property Development initiates, develops, leases and divests commercial property projects. In most markets the construc-tion assignments are performed by Skanska’s Construction segment. In the segment reporting Commercial Property Development recog-nizes revenue and earnings when binding contracts are signed for the sale of the properties. In the IFRS reporting revenues are instead rec-ognized when the buyer takes possession of the property.
Infrastructure Development specializes in identifying, developing and investing in privately financed infrastructure projects, such as highways, hospitals and power-generation plants. The business stream focuses on creating new potential projects, mainly in the markets where the Group has operations. Construction assignments are in most markets performed by Skanska’s Construction segment. Rev-enues and earnings are reported under the percentage of completion (“PoC”) method for both segment and IFRS reporting.
Joint ventures are reported under the proportional method in the segment reporting of Residential Development, whereas all other streams/operating segments apply the equity method.
Intra-Group pricing between operating segments occurs on market terms.
The Parent Company in a Swedish Group prepares its accounts in compliance with the Swedish Financial Reporting Board’s Recom-mendation RFR 2 Accounting for Legal Entities (“RFR 2”). Accord-ing to RFR 2, the annual accounts of the legal entity must apply IFRS as far as this is possible within the framework of the Annual Accounts Act and taking into account the connection between accounting and taxation.
In 2014, Skanska decided to wind down the E&C part and divest the O&M part of the Latin American operation. As a consequence, starting in the third quarter of 2014, Skanska Latin America is moved from the Construction stream to Central in the segment reporting. For comparison reasons, historical reported numbers were adjusted accordingly from January 1, 2013.
Dividend The Board of Directors proposes a dividend of SEK 8.25 (7.50) per share. The proposal is equivalent to a regular dividend payout totaling SEK 3,377 M (3,075). The Board of Directors proposes April 6 as the record date for the dividend. The total dividend amount may change up to the record date, depending on share repurchases and transfers.
Events after the end of the report period No events after the end of the period.
Financial reportsSkanska’s interim reports and year-end reports are available for download on Skanska’s website, www.skanska.com/investors. The 2016 Annual Report will be available on Skanska’s website in the week commencing March 13, 2017.
The Group’s reports in 2017 will be published on the following dates:
May 5, 2017 Three Month ReportJuly 20, 2017 Six Month ReportOctober 27, 2017 Nine Month Report
Stockholm February 3, 2017
Johan KarlströmPresident and Chief Executive Officer
This year-end report has not been subject to a review by the company’s auditors.

16 Skanska Year-end report, January–December 2016
Non-IFRS financial measures Definition Reason for use
The following measures are used as it is viewed as the best and most accurate way to measure Skanska's operations reflecting our business model and strategy and thus assist investors and management in analyzing trends and performance in Skanska.
Revenue Segment Revenue segment is the same as revenue IFRS in all streams except for the Residential Development stream and the Commercial Property Development stream, where revenue is recognised for when signing binding agreement for sale of homes and properties. As segment reporting of joint ventures in Residential Development applies the proportional method, revenue segment is affected by this.
Measure revenue generated in current market environment.
Gross income Revenue minus cost of sales. Measure profit generated from projects.
Gross margin Gross income as a percentage of revenue. Measure profitability in projects.
Selling and admin expenses % Selling and administrative expenses as a percentage of revenue. Measure cost efficiency in selling and administrative expenses.
Operating income Revenue minus cost of sales, selling and administrative expenses and income from joint ventures and associated companies.
Measure profit generated from operations.
Operating income segment Revenue minus cost of sales, selling and administrative expenses and income from joint ventures and associated companies, according to segment reporting, and where Residential Development applies the proportional method for reporting of joint ventures.
Measure profit generated from operations in current market environment.
Operating income rolling 12 months
Revenue minus cost of sales, selling and administrative expenses and income from joint ventures and associated companies, rolling 12 months.
Measure profit generated from operations.
Operating margin Operating income as a percentage of revenue. Measure profitability in operations.
Net financial items The net of interest income, financial net pension cost, interest expense, capitalized expense, change in fair value and other net financial items.
Measure total net for financial activities.
Income after financial items Operating income minus net financial items. Measure profit generated before taxes.
Earnings per share, segment Profit for the period, segment, attributable to equity holders divided by the average number of shares outstanding
Measure earnings per share, segment
Book-to-build, rolling 12 months Order bookings divided by construction revenue, rolling 12 months. Measures to which extent new orders are replacing work put in place.
Unrealized gains, Commercial Property Development (CD)
Market value minus investment value upon completion for ongoing projects, completed projects and land. Excluding projects sold according to segment reporting.
Measure potential realization of future gains in Commercial Property Development.
Capital employed, Group Total assets minus non-interest-bearing liabilities. Measure capital usage and efficiency.
Capital employed, Stream Total assets less tax assets, deposits in Skanska’s treasury unit and pension receivable minus non-interest-bearing liabilities excluding tax liabilities. Capitalized interest expense is removed from total assets for the Residential Development and Commercial Property Development segments.
Measure capital usage and efficiency in a Stream.
Capital employed Residential Development (RD)SEK M
Total assets- tax assets- deposits in internal bank- pension receivable- non-interest-bearing liabilities (excluding tax liabilities)- capitalized interest expense
16,588–257
–78–18
–4,560–68
11,607
Measure capital usage and efficiency in Residential Development.
Capital employed Commerical Property Development (CD)SEK M
Total assets- tax assets- deposits in internal bank- pension receivable- non-interest-bearing liabilities (excluding tax liabilities)- capitalized interest expense
22,491–422
–10
–1,955–177
19,936
Measure capital usage and efficiency in Commercial Property Development.
Capital employed Infrastructure Development (ID)SEK M
Total assets- tax assets- deposits in internal bank- pension receivable- non-interest-bearing liabilities (excluding tax liabilities)
5,874–126
00
–314
5,434
Measure capital usage and efficiency in Infrastructure Development.
DefinitionsFor further definitions, see Note 44 in the 2015 Annual Report.

Skanska Year-end report, January–December 2016 17
Non-IFRS financial measures Definition Reason for use
Capital employed average Calculated on the basis of five measuring points; see below.
ROCE in Project Development, segment
Adjusted profit (operating income, financial income minus interest income from Skanska’s treasury unit (internal bank) and other financial items. For the RD and CD segments, capitalized interest expense is removed from operating income so that the return reflects the unleveraged return) as a percentage of average capital employed. When calculating Roce for Infrastructure Development the financial income minus interest income from Skanska’s treasury unit (internal bank) and other financial items are reversed. The average capital employed is adjusted for IAS39 and for tax in our US projects, that are set up as Limited liability companies, non-taxable legal entities.
Measure the performance (profitability and capital efficiency) in Project Development.
ROCE in RD segment, rolling 12 months excluding RD UK (as this is closing down)SEK M
Operating income+ capitalized interest expense+/- financial income and other financial items — interest income from internal bank
Adjusted profit
Capital employed average*
ROCE RD
1,593131
12–7
1,729
10,139
17.1%
Measure the performance (profitability and capital efficiency) in RD.
* Capital employed averageQ4 2016 11,642 x 0.5 5,821Q3 2016 10,743 10,743Q2 2016 10,280 10,280Q1 2016 9,171 9,171Q4 2015 9,082 x 0.5 4,541
40,556 / 4 10,139
ROCE in CD segment, rolling 12 monthsSEK M
For the Commercial Property Development the profit is adjusted so that the change in value of projects in progress and the difference between the market value and selling price for the year is reflected.
Operating income+/- adjustments as mentioned above + capitalized interest expense+/- financial income and other financial items- interest income from internal bank
Adjusted profit
Capital employed average*
ROCE CD
2,336232101–11
0
2,658
17,992
14.8%
Measure the performance (profitability and capital efficiency) in CD.
* Capital employed averageQ4 2016 19,936 x 0.5 9,968Q3 2016 18,517 18,517Q2 2016 17,144 17,144Q1 2016 18,086 18,086Q4 2015 16,510 x 0.5 8,255
71,969 / 4 17,992
ROCE in ID segment, rolling 12 monthsSEK M
For Infrastructure Development the profit is adjusted so that the change in value of projects in progress and the difference between the market value and selling price for the year is reflected.
Operating income+/- adjustments as mentioned above
Adjusted profit
Capital employed average*+/— adjustments as mentioned above
Adjusted Capital Employed
ROCE ID
1,818–365
1,453
2,1631,375
3,538
41.1%
Measure the performance (profitability and capital efficiency) in ID.
* Capital employed averageQ4 2016 5,434 x 0.5 2,717Q3 2016 2,071 2,071Q2 2016 1,420 1,420Q1 2016 1,524 1,524Q4 2015 1,843 x 0.5 921
8,653 / 4 2,163

18 Skanska Year-end report, January–December 2016
Non-IFRS financial measures Definition Reason for use
ROCE in PD SegmentSEK M
The total ROCE from RD, CD and ID. Measure profitability and capital efficiency.
Adjusted profit CE avg ROCE
RD 1,729 10,139 17.1%CD 2,658 17,992 14.8%ID 1,453 3,538 41.1%
5,840 31,669 18.4%
Return on equity segment, rolling 12 monthsSEK M
Profit attributable to equity holders as a percentage of average equity attributable to equity holders.6 513 / 22 986 = 28.3%
Measure profitability on invested equity.
Equity average attributable to equity holdersSEK M
Calculated on the basis of five measuring points.
Q4 2016 27,350 x 0.5 13,675Q3 2016 21,069 21,069Q2 2016 21,794 21,794Q1 2016 23,368 23,368Q4 2015 24,079 x 0.5 12,040
91,946 / 4 22,986
Operating cash flow from operations
Cash flow from business operations including taxes paid and cash flow from financing operations.
Measure total cash flow generated from operations.
Net divestments/investment Total investments minus total divestments. Measure the balance between investments and divestments.
Free working capital in Construction
Non-interest-bearing receivables less non-interest-bearing liabilities excluding taxes.
Measure the funding stemming from the negative working capital generated in Construction.
Average free working capital in ConstructionSEK M
Calculated on the basis of five measuring points.
–19,243
Measure the funding stemming from the negative working capital generated in Construction.
Q4 2016 –22,460 x 0.5 –11,230Q3 2016 –18,943 –18,943Q2 2016 –17,708 –17,708Q1 2016 –18,819 –18,819Q4 2015 –20,542 x 0.5 –10,271
–76,971 / 4
Interestbearing net receivables/net debt
Interest-bearing assets minus interest-bearing liabilities. Measure financial position.
Operating net financial assets/liabilities (ONFAL)
Interest-bearing net receivables/liabilities excluding construction loans to cooperative housing associations and interest-bearing pension liabilities.
Measure financial position and investment capacity. The latter is derived by comparing ONFAL to limits set by the Board of Directors.
Equity/assets ratio Equity including non-controlling interest as a percentage of total assets.
Measure financial position.
Net debt/equity ratio Interest-bearing net liabilities divided by equityincluding non-controlling interest.
Measure leverage of financial position.
Adjusted equity attributable to equity holdersSEK bn
Equity attributable to equity holdersUnrealized surplus land value in Residential DevelopmentUnrealized Commercial Property Development gainsEffect in unrealized equity in Infrastructure DevelopmentLess standard corporate tax, 10%
Adjusted equity
27.41.07.22.0
–1.0
36.6
Measure financial position adjusted for surplus values in Project Development net taxes.

Skanska Year-end report, January–December 2016 19
SEK MSegment
Jan-Dec 2016IFRS
Jan-Dec 2016Segment
Jan-Dec 2015IFRS
Jan-Dec 2015Segment
Oct-Dec 2016IFRS
Oct-Dec 2016Segment
Oct-Dec 2015IFRS
Oct-Dec 2015
Revenue
Construction 138,001 138,001 140,648 140,648 38,827 38,827 37,979 37,979
Residential Development 13,264 7,571 12,298 8,724 4,529 2,487 3,197 1,764
Commercial Property Development 10,226 9,711 9,034 10,488 2,673 1,940 5,405 6,435
Infrastructure Development 237 237 106 106 35 35 29 29
Central and eliminations –10,421 –10,155 –7,151 –6,917 –3,827 –3,739 –3,363 –3,295
Skanska Group 151,307 145,365 154,935 153,049 42,237 39,550 43,247 42,912
Operating income
Construction 3,546 3,546 3,874 3,874 1,264 1,264 1,398 1,398
Residential Development 1,605 746 1,174 728 680 347 326 68
Commercial Property Development1 2,336 2,199 1,947 2,200 322 180 1,271 1,575
Infrastructure Development 1,818 1,818 863 863 1,475 1,475 458 458
Central –1,140 –1,141 –1,346 –1,346 –431 –431 –391 –391
Eliminations1 34 52 –51 –29 –10 1 –2 16
Operating income 8,199 7,220 6,461 6,290 3,300 2,836 3,060 3,124
Net financial items –118 –119 –313 –314 –60 –61 58 57
Income after financial items 8,081 7,101 6,148 5,976 3,240 2,775 3,118 3,181
Taxes –1,555 –1,366 –1,219 –1,185 –537 –457 –584 –599
Profit for the period 6,526 5,735 4,929 4,791 2,703 2,318 2,534 2,582
Earnings for the period per share, SEK2 15.89 11.96 6.59 6.15
Earnings for the period per share according to IFRSs, SEK2 13.96 11.63 5.65 6.27
1 Of which gains from divestments of commercial properties reported in:
Commercial Property Development 3,111 3,114 2,564 2,797 721 717 1,513 1,797
Eliminations 173 187 190 225 43 57 109 139
2 Earnings for the period attributable to equity holders divided by the average number of shares outstanding.
Reconciliation between segment reporting and IFRSs
External revenue Intra–Group revenue Total revenue Operating income
SEK M Jan-Dec 2016 Jan-Dec 2015 Jan-Dec 2016 Jan-Dec 2015 Jan-Dec 2016 Jan-Dec 2015 Jan-Dec 2016 Jan-Dec 2015
Construction 127,1131 129,9931 10,888 10,655 138,001 140,648 3,546 3,874
Residential Development 13,255 12,298 9 0 13,264 12,298 1,605 1,174
Commercial Property Development 10,208 8,995 18 39 10,226 9,034 2,336 1,947
Infrastructure Development 237 106 0 0 237 106 1,818 863
Total operating segments 150,813 151,392 10,915 10,694 161,728 162,086 9,305 7,858
Central 494 3,543 943 995 1,437 4,538 –1,140 –1,346
Eliminations 0 0 –11,858 –11,689 –11,858 –11,689 34 –51
Total Group 151,307 154,935 0 0 151,307 154,935 8,199 6,461
Reconciliation to IFRSs 2 –5,942 –1,886 0 0 –5,942 –1,886 –979 –171
Total IFRSs 145,365 153,049 0 0 145,365 153,049 7,220 6,290
1 Of which external revenue from joint ventures in Infrastructure Development, SEK 7,220 M (6,045).
2 Of which effect from joint ventures in Residential Development proportionally –1,548 –854 –298 –137
Of which effect of different revenue recognitions –4,394 –1,032 –681 –34

20 Skanska Year-end report, January–December 2016
The Skanska Group
Summary income statement (IFRS)
SEK M Jan-Dec 2016 Jan-Dec 2015 Oct-Dec 2016 Oct-Dec 2015
Revenue 145,365 153,049 39,550 42,912
Cost of sales –131,119 –139,160 –35,772 –37,969
Gross income 14,246 13,889 3,778 4,943
Selling and administrative expenses –9,152 –8,869 –2,560 –2,387
Income from joint ventures and associated companies 2,126 1,270 1,618 568
Operating income 7,220 6,290 2,836 3,124
Financial income 119 127 9 50
Financial expenses –238 –441 –70 7
Net financial items1 –119 –314 –61 57
Income after financial items 7,101 5,976 2,775 3,181
Taxes –1,366 –1,185 –457 –599
Profit for the period 5,735 4,791 2,318 2,582
1 Of which
Interest income 71 88 18 11
Financial net pension costs –101 –93 –24 –22
Interest expenses –245 –327 –73 –9
Capitalized interest expenses 176 194 45 44
Net interest items –99 –138 –34 24
Change in fair value 2 –25 16 4
Other net financial items –22 –151 –43 29
Net financial items –119 –314 –61 57
Profit attributable to:
Equity holders 5,722 4,780 2,313 2,577
Non-controlling interests 13 11 5 5
Earnings per share, SEK 2 13.96 11.63 5.65 6.27
Earnings per share after dilution, SEK3 13.88 11.53 5.63 6.22
2 Earnings for the period attributable to equity holders divided by the average number of shares outstanding.3 Earnings for the period attributable to equity holders divided by the average number of shares outstanding after dilution.
Statement of profit or loss and other comprehensive income (IFRS)
SEK M Jan-Dec 2016 Jan-Dec 2015 Oct-Dec 2016 Oct-Dec 2015
Profit for the period 5,735 4,791 2,318 2,582
Other comprehensive income
Items that will not be reclassified to profit and loss
Remeasurements of defined benefit plans –1,127 785 2,866 489
Tax related to items that will not be reclassified to profit and loss 189 –175 –574 –111
–938 610 2,292 378
Items that have been or will be reclassified to profit and loss
Translation differences attributable to equity holders 1,165 71 179 –360
Translation differences attributable to non-controlling interests 8 –3 –1 –3
Hedging of exchange rate risk in foreign operations 36 –21 99 –24
Effects of cash flow hedges 1 31 54 –4 19
Share of other comprehensive income of joint ventures and associated companies 2 855 281 1,467 209
Tax related to items that have been or will be reclassified to profit and loss –4 –15 1 –1
2,091 367 1,741 –160
Other comprehensive income after tax 1,153 977 4,033 218
Total comprehensive income 6,888 5,768 6,351 2,800
Total comprehensive income attributable to
Equity holders 6,867 5,760 6,347 2,798
Non-controlling interests 21 8 4 2
1 Of which transferred to income statement 0 0 0 0
2 Of which transferred to income statement 1,851 516 1,366 48
Skanska Year-end report, January–December 2016 21
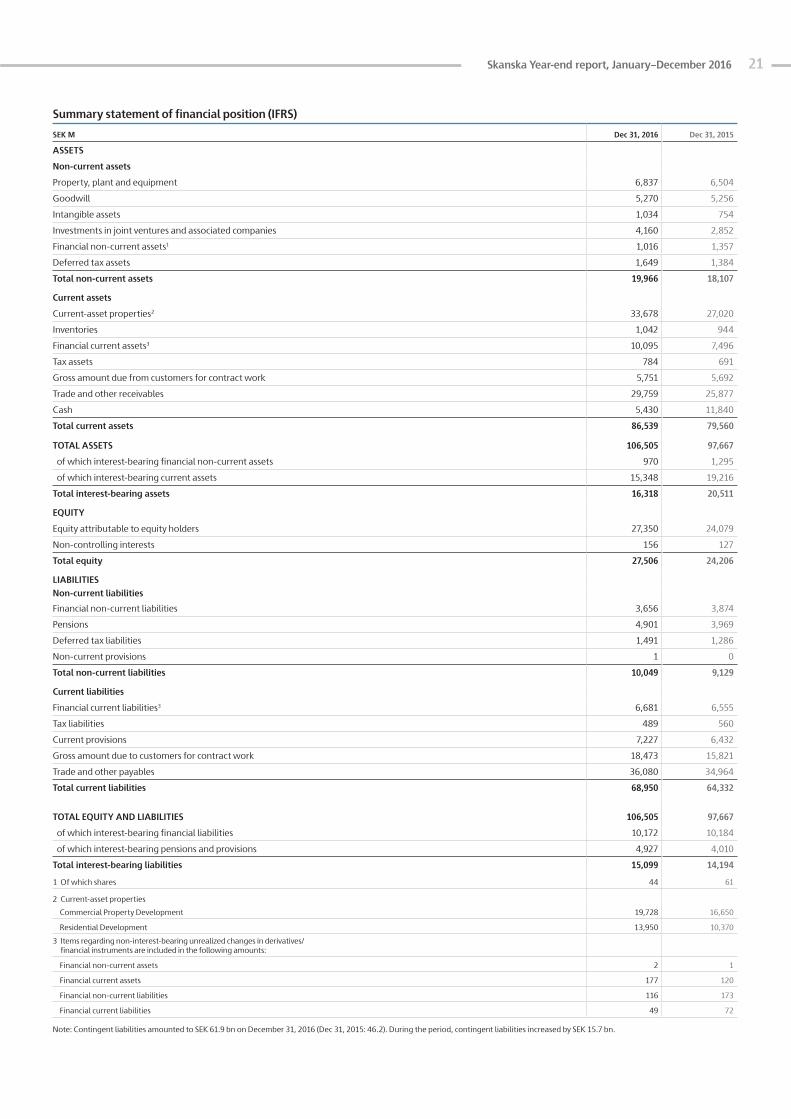
Note: Contingent liabilities amounted to SEK 61.9 bn on December 31, 2016 (Dec 31, 2015: 46.2). During the period, contingent liabilities increased by SEK 15.7 bn.
Summary statement of financial position (IFRS)
SEK M Dec 31, 2016 Dec 31, 2015
ASSETS
Non-current assets
Property, plant and equipment 6,837 6,504
Goodwill 5,270 5,256
Intangible assets 1,034 754
Investments in joint ventures and associated companies 4,160 2,852
Financial non-current assets1 1,016 1,357
Deferred tax assets 1,649 1,384
Total non-current assets 19,966 18,107
Current assets
Current-asset properties2 33,678 27,020
Inventories 1,042 944
Financial current assets3 10,095 7,496
Tax assets 784 691
Gross amount due from customers for contract work 5,751 5,692
Trade and other receivables 29,759 25,877
Cash 5,430 11,840
Total current assets 86,539 79,560
TOTAL ASSETS 106,505 97,667
of which interest-bearing financial non-current assets 970 1,295
of which interest-bearing current assets 15,348 19,216
Total interest-bearing assets 16,318 20,511
EQUITY
Equity attributable to equity holders 27,350 24,079
Non-controlling interests 156 127
Total equity 27,506 24,206
LIABILITIESNon-current liabilities
Financial non-current liabilities 3,656 3,874
Pensions 4,901 3,969
Deferred tax liabilities 1,491 1,286
Non-current provisions 1 0
Total non-current liabilities 10,049 9,129
Current liabilities
Financial current liabilities3 6,681 6,555
Tax liabilities 489 560
Current provisions 7,227 6,432
Gross amount due to customers for contract work 18,473 15,821
Trade and other payables 36,080 34,964
Total current liabilities 68,950 64,332
TOTAL EQUITY AND LIABILITIES 106,505 97,667
of which interest-bearing financial liabilities 10,172 10,184
of which interest-bearing pensions and provisions 4,927 4,010
Total interest-bearing liabilities 15,099 14,194
1 Of which shares 44 61
2 Current-asset properties
Commercial Property Development 19,728 16,650
Residential Development 13,950 10,370
3 Items regarding non-interest-bearing unrealized changes in derivatives/ financial instruments are included in the following amounts:
Financial non-current assets 2 1
Financial current assets 177 120
Financial non-current liabilities 116 173
Financial current liabilities 49 72

22 Skanska Year-end report, January–December 2016
Summary statement of changes in equity (IFRS)
SEK M Jan-Dec 2016 Jan-Dec 2015 Oct-Dec 2016 Oct-Dec 2015
Opening balance 24,206 21,405 21,221 21,440
of which non-controlling interests 127 154 152 125
Dividend to shareholders –3,075 –2,775 0 0
Change in group composition 14 0 0 0
Dividend to non-controlling interests –6 –35 0 0
Effects of equity-settled share-based payments 272 259 69 68
Repurchase of shares –793 –416 –135 –102
Total comprehensive income attributable to
Equity holders 6,867 5,760 6,347 2,798
Non-controlling interests 21 8 4 2
Closing balance 27,506 24,206 27,506 24,206
of which non-controlling interests 156 127 156 127
Summary consolidated cash flow statement (IAS 7) (IFRS)SEK M Jan-Dec 2016 Jan-Dec 2015 Oct-Dec 2016 Oct-Dec 2015
Cash flow from operating activities before change in working capital, according to IAS 7 1,100 2,180 225 853
Cash flow from change in working capital, according to IAS 7 –1,983 6,404 –682 7,823
Net investments in property, plant and equipment and intangible assets –160 –475 1880 807
Tax payments on property, plant and equipment and intangible assets divested and divest-ments of assets in Infrastructure Development –35 –69 –17 –47
Cash flow from business operations including taxes paid according to operating cash flow –1,078 8,040 1,406 9,436
Less net investments in property, plant and equipment and intangible assets 160 475 –1,880 –807
Less tax payments on property, plant and equipment and intangible assets divested and divestments of assets in Infrastructure Development 35 69 17 47
Cash flow from operating activities, according to IAS 7 –883 8,584 –457 8,676
Cash flow from strategic investments according to operating cash flow 862 456 524 88
Net investments in property, plant and equipment and intangible assets –160 –475 1,880 807
Increase and decrease in interest-bearing receivables –2,260 –1,297 –804 138
Taxes paid on property, plant and equipment and intangible assets divested and divestments of assets in Infrastructure Development –35 –69 –17 –47
Cash flow from investing activities, according to IAS 7 –1,593 –1,385 1,583 986
Cash flow from financing operations according to operating cash-flow statement –76 –380 –78 31
Change in interest-bearing receivables and liabilities –2,400 –2,235 –852 –337
Increase and decrease in interest-bearing liabilities 2,260 1,297 804 –138
Dividend etc.1 –3,874 –3,226 –135 –102
Cash flow from financing activities, according to IAS 7 –4,090 –4,544 –261 –546
Cash flow for the period –6,566 2,655 865 9,116
1 Of which repurchases of shares SEK -793 M.

Skanska Year-end report, January–December 2016 23
Cash flow (IFRS)
Operating cash flow
SEK M Jan-Dec 2016 Jan-Dec 2015 Oct-Dec 2016 Oct-Dec 2015
Construction
Cash flow from business operations 4,925 5,486 1,532 1,677
Change in working capital 1,051 2,375 3,166 4,634
Net divestments(+)/investments(–) –1,414 –1,058 –442 –34
Cash flow adjustment 0 0 0 0
Total Construction 4,562 6,803 4,256 6,277
Residential Development
Cash flow from business operations –677 –536 –177 –137
Change in working capital 1,198 88 92 –687
Net divestments(+)/investments(–) –1,631 1,955 –488 88
Cash flow adjustment –100 2 –7 2
Total Residential Development –1,210 1,509 –580 –734
Commercial Property Development
Cash flow from business operations –706 –506 –343 –198
Change in working capital –664 406 313 503
Net divestments(+)/investments(–) 679 1,088 –922 3,343
Cash flow adjustment 4 –71 –58 –24
Total Commercial Property Development –687 917 –1,010 3,624
Infrastructure Development
Cash flow from business operations 154 3 3 –34
Change in working capital –2,965 375 –2,983 17
Net divestments(+)/investments(–) 1,766 880 2,511 1,013
Cash flow adjustment 0 0 0 0
Total Infrastructure Development –1,045 1,258 –469 996
Central and eliminations
Cash flow from business operations –1,394 –1,370 –549 –369
Change in working capital 52 68 39 –155
Net divestments(+)/investments(–) –119 –180 –23 –72
Cash flow adjustment 0 1 0 1
Total central and eliminations –1,461 –1,481 –533 –595
Total cash flow from business operations 2,302 3,077 466 939
Total change in working capital –1,328 3,312 627 4,312
Total net divestments(+)/investments(–) –719 2,685 636 4,338
Total cash flow adjustment –96 –68 –65 –21
Cash flow from business operations before taxes paid 159 9,006 1,664 9,568
Taxes paid in business operations –1,237 –966 –258 –132
Cash flow from business operations including taxes paid –1,078 8,040 1,406 9,436
Net interest items and other net financial items –108 –542 –111 45
Taxes paid in financing operations 32 162 33 –14
Cash flow from financing operations –76 –380 –78 31
Operating cash flow from operations –1,154 7,660 1,328 9,467
Net strategic divestments(+)/investments(–) 862 456 524 88
Dividend etc.1 –3,874 –3,226 –135 –102
Cash flow before change in interest-bearing receivables and liabilities –4,166 4,890 1,717 9,453
Change in interest-bearing receivables and liabilities –2,400 –2,235 –852 –337
Cash flow for the period –6,566 2,655 865 9,116
Cash and cash equivalents at the beginning of the period 11,840 9,107 4,480 2,773
Exchange rate differences in cash and cash equivalents 156 78 85 –49
Cash and cash equivalents at the end of the period 5,430 11,840 5,430 11,840
1 Of which repurchases of shares SEK –793 M.

24 Skanska Year-end report, January–December 2016
Capital employed in Development Streams (IFRS)
SEK M Dec 31, 2016 Sep 30, 2016 Dec 31, 2015
Residential Development 11,607 10,707 9,277
Commercial Property Development 19,936 18,517 16,510
Infrastructure Development 5,434 2,071 1,843
Total in Development Streams 36,977 31,295 27,630
Group net divestments/investments (IFRS)SEK M Jan-Dec 2016 Jan-Dec 2015 Oct-Dec 2016 Oct-Dec 2015
OPERATIONS – INVESTMENTS
Intangible assets –394 –392 –148 –150
Property, plant and equipment –1,636 –1,485 –455 –338
Assets in Infrastructure Development –1,336 –234 –576 –90
Shares and participations –325 –136 –138 –96
Current-asset properties –17,108 –15,364 –5,458 –4,384
of which Residential Development –9,005 –6,645 –2,920 –1,603
of which Commercial Property Development –8,103 –8,719 –2,538 –2,781
Investments in operations –20,799 –17,611 –6,775 –5,058
Total Investments –20,799 –17,611 –6,775 –5,058
OPERATIONS – DIVESTMENTS
Intangible assets 2 0 1 0
Property, plant and equipment 411 636 109 376
Assets in Infrastructure Development 3,102 1,114 3,087 1,103
Shares and participations 16 22 0 1
Current-asset properties 16,549 18,524 4,214 7,916
of which Residential Development 7,508 8,622 2,454 1,705
of which Commercial Property Development 9,041 9,902 1,760 6,211
Divestments in operations 20,080 20,296 7,411 9,396
STRATEGIC DIVESTMENTS
Businesses 862 456 524 88
Strategic divestments 862 456 524 88
Total divestments 20,942 20,752 7,935 9,484
TOTAL NET DIVESTMENTS(+)/INVESTMENTS(–) 143 3,141 1,160 4,426
Depreciation, non-current assets –1,439 –1,579 –374 –402
Skanska Year-end report, January–December 2016 25
Parent Company The parent company’s revenue consists mainly of amounts billed to Group companies. The balance sheet consists of financial instruments almost exclusively
in the form of intra-Group receivables and liabilities. The parent company does not report any significant events during the period.
Summary income statement (IFRS)
SEK M Jan-Dec 2016 Jan-Dec 2015 Oct-Dec 2016 Oct-Dec 2015
Revenue 674 679 589 600
Selling and administrative expenses –752 –773 –517 –521
Operating income –78 –94 72 79
Net financial items 3,522 2,475 1,079 22
Income after financial items 3,444 2,381 1,151 101
Taxes –15 9 –60 –40
Profit for the period 3,429 2,390 1,091 61
Total comprehensive income 3,429 2,390 1,091 61
Summary balance sheet (IFRS)
SEK M Dec 31, 2016 Dec 31, 2015
ASSETS
Intangible non-current assets 19 1
Property, plant and equipment 2 3
Financial non-current assets1 11,504 11,495
Total non-current assets 11,525 11,499
Current receivables 167 176
Total current assets 167 176
TOTAL ASSETS 11,692 11,675
EQUITY AND LIABILITIES
Equity 6,360 6,474
Provisions 283 310
Non-current interest-bearing liabilities1 4,918 4,769
Current liabilities 131 122
TOTAL EQUITY AND LIABILITIES 11,692 11,675
1 Of these amounts, SEK 253 M (Dec 31, 2015: 216) were intra-Group receivables and SEK 4,918 M (Dec 31, 2015: 4,769) intra-Group liabilities.
Note: The Parent Company’s contingent liabilities totaled SEK 162.2 bn (Dec 31, 2015: 122.5), of which SEK 131.9 bn (Dec 31, 2015: 101.7) was related to obligations on behalf of Group companies. Other obligations, SEK 30.3 bn (Dec 31 2015: 20.8), were related to commitments to outside parties.

26 Skanska Year-end report, January–December 2016
Exchange rates for the most important currenciesAverage exchange rates Exchange rates on the closing day
SEK Jan-Dec 2016 Jan-Dec 2015 Dec 31, 2016 Dec 31, 2015
U.S. dollar 8.56 8.43 9.06 8.40
British pound 11.59 12.89 11.15 12.43
Norwegian krone 1.02 1.05 1.05 0.96
Euro 9.47 9.36 9.57 9.17
Czech koruna 0.35 0.34 0.35 0.34
Polish zloty 2.17 2.24 2.17 2.16
Share dataJan-Dec 2016 Jan-Dec 2015 Oct-Dec 2016 Oct-Dec 2015
Earnings per share according to segment reporting, SEK1 15.89 11.96 6.59 6.15
Earnings per share, SEK1 13.96 11.63 5.65 6.27
Earnings per share after dilution, SEK 2 13.88 11.53 5.63 6.22
Equity per share, SEK 3 66.82 58.58
Adjusted equity per share, SEK 4 89.43 81.70
Average number of shares outstanding 409,896,419 411,059,056
Average number of shares outstanding after dilution 412,174,095 414,445,854
Average dilution, % 0.55 0.82
Number of shares, at balance sheet date 419,903,072 419,903,072
of which Series A and Series B shares 419,903,072 419,903,072
Average price of total repurchased shares, SEK 132.18 121.02
Number of total Series B shares repurchased 24,103,228 19,758,228
of which repurchased during the year 4,345,000 2,340,000 645,000 600,000
Number of shares in Skanska's own custody 10,594,644 8,866,223
Number of shares outstanding 409,308,428 411,036,849
1 Earnings for the period attributable to equity holders divided by the average number of shares outstanding. 2 Earnings for the period attributable to equity holders divided by the average number of shares outstanding after dilution.3 Equity attributable to equity holders divided by the number of shares outstanding.4 Adjusted equity divided by the number of shares outstanding.
Five-year Group financial summary SEK M Jan-Dec 2016 Jan-Dec 2015 Jan-Dec 2014 Jan-Dec 2013 Jan-Dec 2012
Revenue 151,307 154,935 145,029 136,446 131,931
Operating income 8,199 6,461 5,766 5,144 4,605
Profit for the period 6,526 4,929 4,108 3,473 3,305
Earnings per share, SEK 15.89 11.96 9.98 8.43 8.00
Return on capital employed, % 21.8 17.8 16.5 14.9 14.8
Return on equity, % 28.3 22.5 20.1 17.4 17.5
Operating margin, % 5.4 4.2 4.0 3.8 3.5
Return on capital employed according to IFRSs, % 19.2 17.4 15.5 16.1 13.0
Cash flow per share according to IFRSs, SEK 1 –10.16 11.90 2.20 4.94 –11.53
1 Cash flow before change in interest-bearing receivables and liabilites divided by the average number of shares outstanding.

Skanska Year-end report, January–December 2016 27
Revenue by business/reporting unit
SEK M Jan-Dec 2016 Jan-Dec 2015 Oct-Dec 2016 Oct-Dec 2015
Sweden 31,736 31,303 9,539 9,157
Norway 12,182 11,909 3,530 2,863
Finland 7,055 6,343 2,007 1,758
Poland 8,234 9,915 2,968 3,364
Czech Republic 4,987 5,409 1,561 1,585
UK 19,443 18,429 4,799 5,139
USA Building 35,867 37,023 9,438 9,161
USA Civil 18,497 20,317 4,985 4,952
Total 138,001 140,648 38,827 37,979
Operating income Operating margin, %
SEK M Jan-Dec 2016 Jan-Dec 2015 Oct-Dec 2016 Oct-Dec 2015 Jan-Dec 2016 Jan-Dec 2015 Oct-Dec 2016 Oct-Dec 2015
Sweden 1,482 1,425 558 363 4.7 4.6 5.8 4.0
Norway 383 382 125 117 3.1 3.2 3.5 4.1
Finland 265 241 69 80 3.8 3.8 3.4 4.6
Poland –293 472 –50 247 neg 4.8 neg 7.3
Czech Republic 134 121 81 43 2.7 2.2 5.2 2.7
UK 406 443 115 124 2.1 2.4 2.4 2.4
USA Building 649 309 265 200 1.8 0.8 2.8 2.2
USA Civil 520 481 101 224 2.8 2.4 2.0 4.5
Total 3,546 3,874 1,264 1,398 2.6 2.8 3.3 3.7
Revenue and earnings
SEK M Jan-Dec 2016 Jan-Dec 2015 Oct-Dec 2016 Oct-Dec 2015
Revenue 138,001 140,648 38,827 37,979
Gross income 10,080 10,039 2,975 3,077
Selling and administrative expenses –6,567 –6,198 –1,722 –1,685
Income from joint ventures and associated companies 33 33 11 6
Operating income 3,546 3,874 1,264 1,398
Investments –1,829 –1,645 –549 –418
Divestments 595 670 107 467
Net divestments(+)/investments(–) –1,234 –975 –442 49
Gross margin, % 7.3 7.1 7.7 8.1
Selling and administrative expenses, % –4.8 –4.4 –4.4 –4.4
Operating margin, % 2.6 2.8 3.3 3.7
Order bookings, SEK bn 170.2 122.1 39.6 29.9
Order backlog, SEK bn 196.3 158.2 – –
Employees 40,991 42,193 – –
Construction
Order backlog Order bookings Book-to build
SEK M Dec 31, 2016 Dec 31, 2015 Jan-Dec 2016 Jan-Dec 2015 Oct-Dec 2016 Oct-Dec 2015 Dec 31, 2016 Dec 31, 2015
Sweden 35,416 31,398 36,041 32,989 11,174 7,983 114 105
Norway 12,573 10,268 13,406 13,207 3,301 3,720 110 111
Finland 6,118 6,341 6,537 7,208 1,918 1,434 93 114
Poland 6,487 4,851 9,848 9,348 2,821 2,086 120 94
Czech Republic 5,614 4,716 5,616 5,685 1,110 1,360 113 105
UK 26,297 27,705 20,860 19,250 6,893 2,501 107 105
USA Building 55,786 36,789 51,036 22,592 10,018 8,261 142 61
USA Civil 47,963 36,180 26,900 11,825 2,380 2,596 145 58
Total 196,254 158,248 170,244 122,104 39,615 29,941 123 87

28 Skanska Year-end report, January–December 2016
Revenue
SEK M Jan-Dec 2016 Jan-Dec 2015 Oct-Dec 2016 Oct-Dec 2015
Sweden 7,069 7,406 2,533 1,930
Norway 2,511 1,947 657 406
Finland 2,707 2,135 1,049 566
Nordics 12,287 11,488 4,239 2,902
Central Europe 977 810 290 295
Total 13,264 12,298 4,529 3,197
Homes under constructionCompleted unsold, number of homes
Homes under construction of which sold, %
Dec 31, 2016 Dec 31, 2015 Dec 31, 2016 Dec 31, 2015 Dec 31, 2016 Dec 31, 2015
Sweden 4,305 3,441 12 10 82 86
Norway 723 462 60 95 94 73
Finland 1,452 968 79 122 61 55
Nordics 6,480 4,871 151 227 78 79
Central Europe 941 818 7 10 68 60
Total 7,421 5,689 158 237 77 76
Residential Development
Revenue and earnings
SEK M Jan-Dec 2016 Jan-Dec 2015 Oct-Dec 2016 Oct-Dec 2015
Revenue 13,264 12,298 4,529 3,197
Gross income 2,164 1,724 813 453
Selling and administrative expenses –559 –550 –133 –127
Income from joint ventures and associated companies 0 0 0 0
Operating income 1,605 1,174 680 326
Operating margin, % 12.1 9.5 15.0 10.2
Investments –9,148 –6,675 –2,951 –1,605
Divestments 7,517 8,630 2,463 1,693
Net divestments(+)/investments(–) –1,631 1,955 –488 88
Capital employed, SEK bn 11.6 9.3 – –
Return on capital employed, % 17.1 14.4 – –
Employees 434 389 – –
Operating income 1 Operating margin, % 1
SEK M Jan-Dec 2016 Jan-Dec 2015 Oct-Dec 2016 Oct-Dec 2015 Jan-Dec 2016 Jan-Dec 2015 Oct-Dec 2016 Oct-Dec 2015
Sweden 1,060 799 484 206 15.0 10.8 19.1 10.7
Norway 279 143 94 33 11.1 7.3 14.3 8.1
Finland 170 122 63 31 6.3 5.7 6.0 5.5
Nordics 1,509 1,064 641 270 12.3 9.3 15.1 9.3
Central Europe 96 110 39 56 9.8 13.6 13.4 19.0
Total 1,605 1,174 680 326 12.1 9.5 15.0 10.2
1 Development gain only. Construction margin reported under Construction.
Homes started Homes sold
Jan-Dec 2016 Jan-Dec 2015 Oct-Dec 2016 Oct-Dec 2015 Jan-Dec 2016 Jan-Dec 2015 Oct-Dec 2016 Oct-Dec 2015
Sweden 2,861 2,257 1,097 594 2,562 2,191 991 514
Norway 437 368 96 59 553 390 132 96
Finland 1,081 830 470 162 991 839 389 240
Nordics 4,379 3,455 1,663 815 4,106 3,420 1,512 850
Central Europe 469 545 259 134 497 673 113 208
Total 4,848 4,000 1,922 949 4,603 4,093 1,625 1,058

Skanska Year-end report, January–December 2016 29
Revenue of which from divestments
SEK M Jan-Dec 2016 Jan-Dec 2015 Oct-Dec 2016 Oct-Dec 2015 Jan-Dec 2016 Jan-Dec 2015 Oct-Dec 2016 Oct-Dec 2015
Nordics 4,063 3,281 537 531 3,706 3,007 441 450
Europe 2,141 3,414 2,037 2,608 1,981 3,254 1,981 2,544
U.S. 4,022 2,339 99 2,266 3,868 2,196 73 2,196
Total 10,226 9,034 2,673 5,405 9,555 8,457 2,495 5,190
Revenue and earnings
SEK M Jan-Dec 2016 Jan-Dec 2015 Oct-Dec 2016 Oct-Dec 2015
Revenue 10,226 9,034 2,673 5,405
of which from divestment of properties 9,555 8,457 2,495 5,190
Gross income 3,067 2,661 536 1,523
Selling and administrative expenses –751 –677 –229 –207
Income from joint ventures and associated companies 20 –37 15 –45
Operating income 2,336 1,947 322 1,271
of which gain from divestment of properties1 3,111 2,564 721 1,513
of which writedowns/reversal of writedowns –198 –56 –198 0
1 Additional gains included in eliminations 173 190 43 109
Investments –8,364 –8,826 –2,683 –2,879
Divestments 9,043 9,914 1,761 6,222
Net divestments(+)/investments(–) 679 1,088 –922 3,343
Capital employed, SEK bn 19.9 16.5 – –
Return on capital employed, % 14.8 15.6 – –
Employees 364 344 – –
Commercial Property Development
Operating income of which from divestments
SEK M Jan-Dec 2016 Jan-Dec 2015 Oct-Dec 2016 Oct-Dec 2015 Jan-Dec 2016 Jan-Dec 2015 Oct-Dec 2016 Oct-Dec 2015
Nordics 1,003 792 51 29 1,127 1,004 96 96
Europe 284 505 472 488 561 751 561 608
U.S. 1,049 650 –201 754 1,423 809 64 809
Total 2,336 1,947 322 1,271 3,111 2,564 721 1,513
Infrastructure Development
Capital employed
SEK M Dec 31, 2016 Dec 31, 2015
Nordics 8,175 6,582
Europe 6,307 3,897
U.S. 5,454 6,031
Total 19,936 16,510
Revenue and earnings
SEK M Jan-Dec 2016 Jan-Dec 2015 Oct-Dec 2016 Oct-Dec 2015
Revenue 237 106 35 29
Gross income 56 –128 1 –41
Selling and administrative expenses –147 –156 –34 –44
Income from joint ventures and associated companies 1,909 1,147 1,508 543
Operating income 1,818 863 1,475 458
of which gains from divestments of shares in projects 1,729 420 1,729 420
Investments –1,336 –234 –576 –90
Divestments 3,102 1,114 3,087 1,103
Net divestments(+)/investments(-) 1,766 880 2,511 1,013
Capital employed, SEK bn 5.4 1.8 – –
Return on capital employed, % 41.1 12.7 – –
Employees 102 111 – –

30 Skanska Year-end report, January–December 2016
About Skanska
Skanska is one of the world’s leading construction and project development companies, focused on selected home markets in the Nordic region, other European countries and North America. Supported by global trends in urbanization and demographics, and by being at the forefront in sustainability, Skanska offers competitive solutions for both simple and the most complex assignments, helping to build a sustainable future for customers and communities.
Skanska’s business model
Operational and financial synergies are, amongst other things, achieved through investments in Project Development generating internal contracts for Skanska’s Construction stream, as well as through the collaboration between Business Units from different markets. Currently, SEK 30.0 billion of Skanska’s total order backlog are contracts involving more than one Business Unit and revenue from internal contracts amounted to SEK 17.6 billion in 2016.
Karolinska University Hospital’s world-class new facility is structured as a PPP project — An investment from Skanska Infrastructure Development generated a construction contract for Skanska Sweden and Skanska UK.
LaGuardia Airport Central Terminal B, structured as a PPP project — An investment from Skanska Infrastructure Development generated Skanska’s largest construction contract ever for Skanska USA Building and Skanska USA Civil.
New Karolinska Solna, Stockholm, Sweden. LaGuardia, New York, U.S.
Construction revenue from internal Project Development contracts amounted to:
Value of orders in backlog generated in cooperation between Business Units:
Internal contracts and cooperation
SEK 30.0 billionSEK 17.6 billion
Investment opportunities
Internal contracts
Free working capital
Construction Project development
◀Revenue with associated contract profits
Development gains are generated and are realized upon divestment
◀◀◀
Operating margin ≥3.5%◀
Operating margin 2.6%
Return on capital employed ≥10%
Return on capital employed 18.4%
Dividend 40–70% of profit
Return on equity 28.3%
Return on equity ≥18%◀
◀
◀
Revenue from external customers
Dividend 52% of profit
Financial targets 2016-2020
Outcome 2016

United States of America
Sweden
Finland
Norway
United Kingdom
Denmark
Poland
Czech RepublicSlovakia
HungaryRomania
Skanska ABwww.skanska.com/investors
For further information, please contact: Peter Wallin, Executive Vice President and CFO, Skanska AB, tel +46 10 448 8900
André Löfgren, Senior Vice President, Investor Relations, Skanska AB, tel +46 10 448 1363
Katarina Grönwall, Senior Vice President, Communications, Skanska AB, tel +46 10 448 8877
Edvard Lind, Group Press Officer, Skanska AB, tel +46 10 448 8808
This report will also be presented via a telephone conference and webcast at 8.30 a.m. (CET) on February 3. The telephone conference will be webcasted live at www.skanska.com/investors, where a recording of the conference will also be available later. To participate in the telephone conference, please dial +46 8 505 564 74, +44 2033 645 374, or +1 855 753 2230. This and previous releases can also be found at www.skanska.com/investors.
The information provided herein is such as Skanska AB is obligated to disclose pursuant to the EU market securities act (EU) no. 596/2014.
Skanska’s home markets