promoting positive post-click experience for in-stream yahoo gemini users
TRANSCRIPT
Promoting Positive Post-Click Experience for In-Stream Yahoo
Gemini Users
Janette Lehmann Freie Universität Berlin
Berlin, Germany
Mounia Lalmas Yahoo Labs London, UK
Guy Shaked Yahoo
Tel Aviv, Israel
Gabriele Tolomei Yahoo Labs London, UK
Fabrizio Silvestri Yahoo Labs London, UK

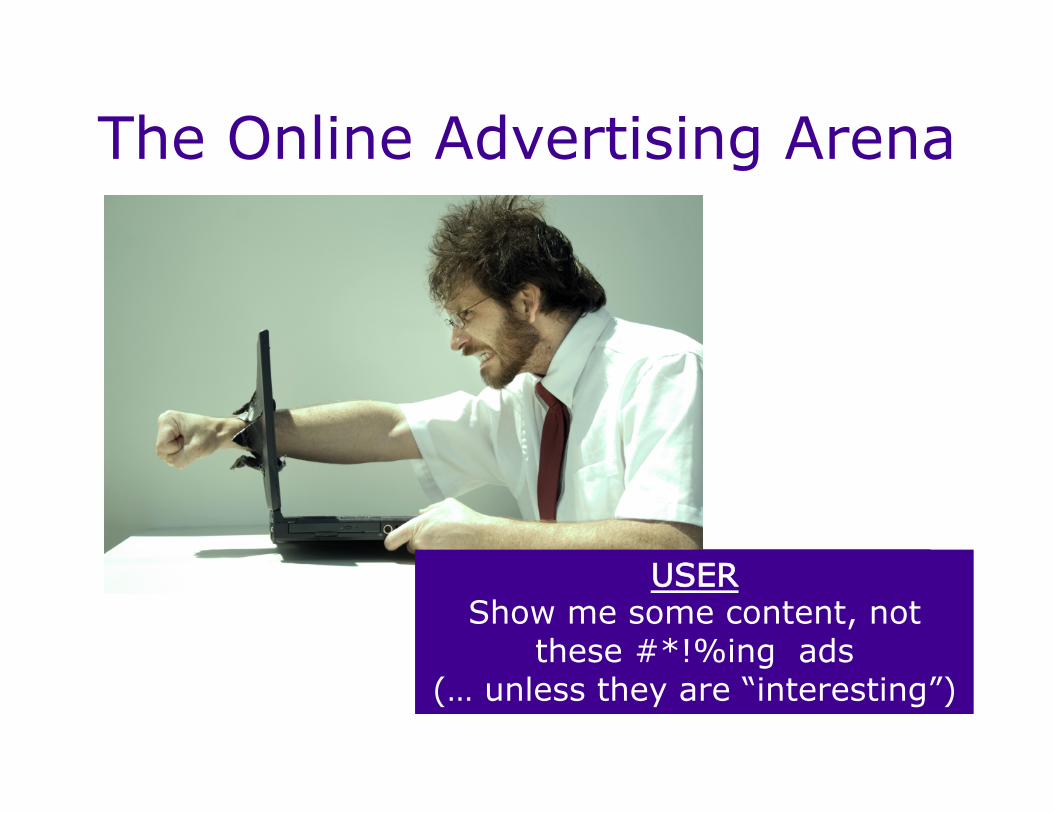
The Online Advertising Arena
PUBLISHER Maximise revenue from
online advertising

The Online Advertising Arena
ADVERTISER Maximise ROI from his ad
campaigns
PUBLISHER Maximise revenue from
online advertising
The Online Advertising Arena
ADVERTISER Maximise ROI from his ad
campaigns
PUBLISHER Maximise revenue from
online advertising
USER Show me some content, not
these #*!%ing ads (… unless they are “interesting”)

The Online Advertising Arena
We want of course to maximise our revenue and guaranteeing ROI to our advertisers without negatively
impacting on user experience
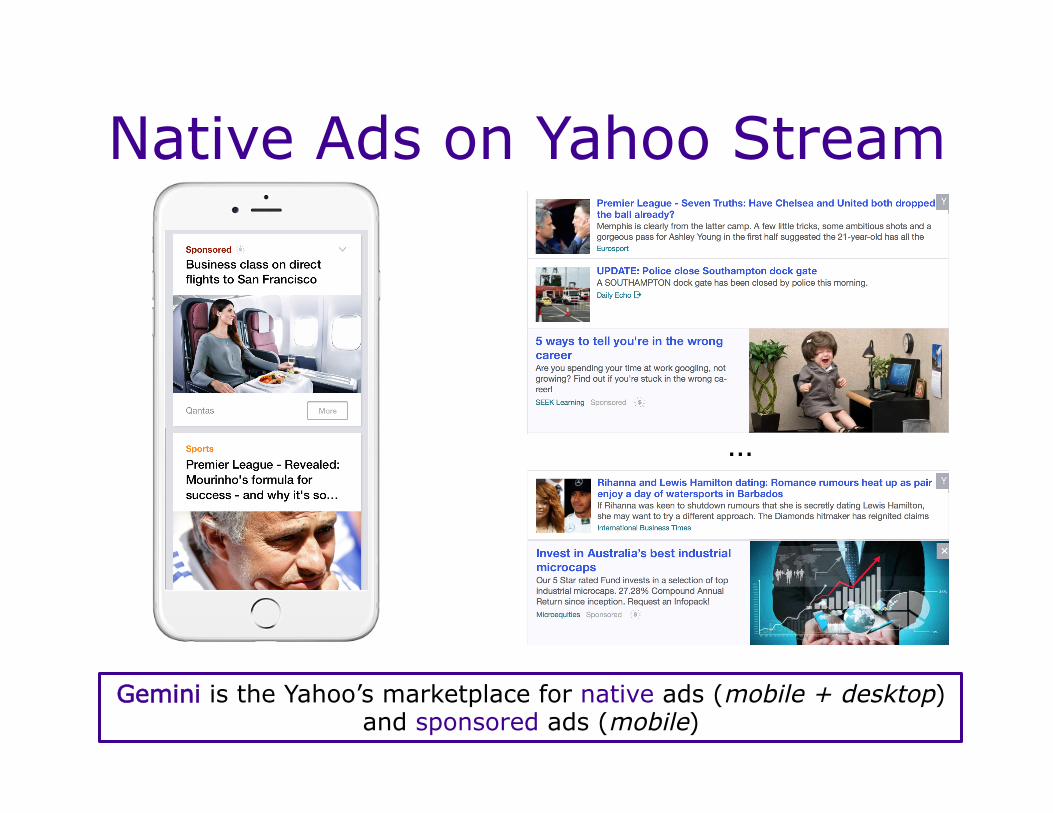
Native Ads on Yahoo Stream
Gemini is the Yahoo’s marketplace for native ads (mobile + desktop) and sponsored ads (mobile)
…

Native Ads on Yahoo Stream
Gemini is the Yahoo’s marketplace for native ads (mobile + desktop) and sponsored ads (mobile)

Based on eCPM (expected Cost Per Mille Impressions)
CPC (Cost Per Click)
CPC is the amount of money (bid) the advertiser is willing to pay for 1 click on its ad
eCPM is computed from the underlying pricing model
rank(ad) = eCPM(ad)
Ad Ranking
rank(ad) = CPC(ad) * eCTR(ad) [* 1000]
P(click|ad)

Beyond CTR Optimisation Ranking via CTR optimisation is an attempt to maximise revenue on the short-term
Trade-off between provider’s and advertiser’s need
What about the user?
Better to include a “quality” factor so to optimise for ads having “high quality”
rank(ad) = CPC(ad) * eCTR(ad)
P(click|ad) P(hq|click)
* eHQ(ad)

How Do We Estimate Quality? “High Quality” is a shorthand for “High Quality Post-Click User Experience”
Intuitively a high quality ad is one whose conversion rate is high
Estimating the probability of conversion is hard!
- Conversion data is unavailable for a large set of advertisers - Conversion data is not missing at random
Use “proxy” metrics of post-click quality like dwell time and bounce rate on the ad landing page

Post-Click Quality Metrics
tad-click tback-to-stream
dwell time = tback-to-stream – tad-click
bounce rate = P(dwell time < th)
th = 5 secs. (mobile)
12 secs. (desktop)

Is Dwell Time A Good Proxy?
mobile 200K ad clicks Ø It needs less time
to get the same probability of a second click
desktop (Yahoo toolbar) 30K ad clicks Ø 23.3% of users visit other
websites than the ad landing page before returning to Yahoo
Ø this goes down to 7.4% for dwell time up to 3 mins.
Probability of a second click increases with dwell time

Optimise for High Quality Ads
Estimating P(hq|click) turns into estimating:
P(dwell time > tδ)
P(bounce rate < τβ)
Can we build a model which is able to predict if an ad is high quality according to the definitions above?
è high quality = high dwell time
è high quality = low bounce rate or
rank(ad) = CPC(ad) * eCTR(ad)
P(click|ad) P(hq|click)
* eHQ(ad)

Binary Classification Problem
AD
1
2
…
i
…
m
ad landing page Xi
class label Yi
+1 if hq(i)
-1 o.w.
dwell time > tδ or
bounce rate < τβ
f(Xi)
Feature-based representation
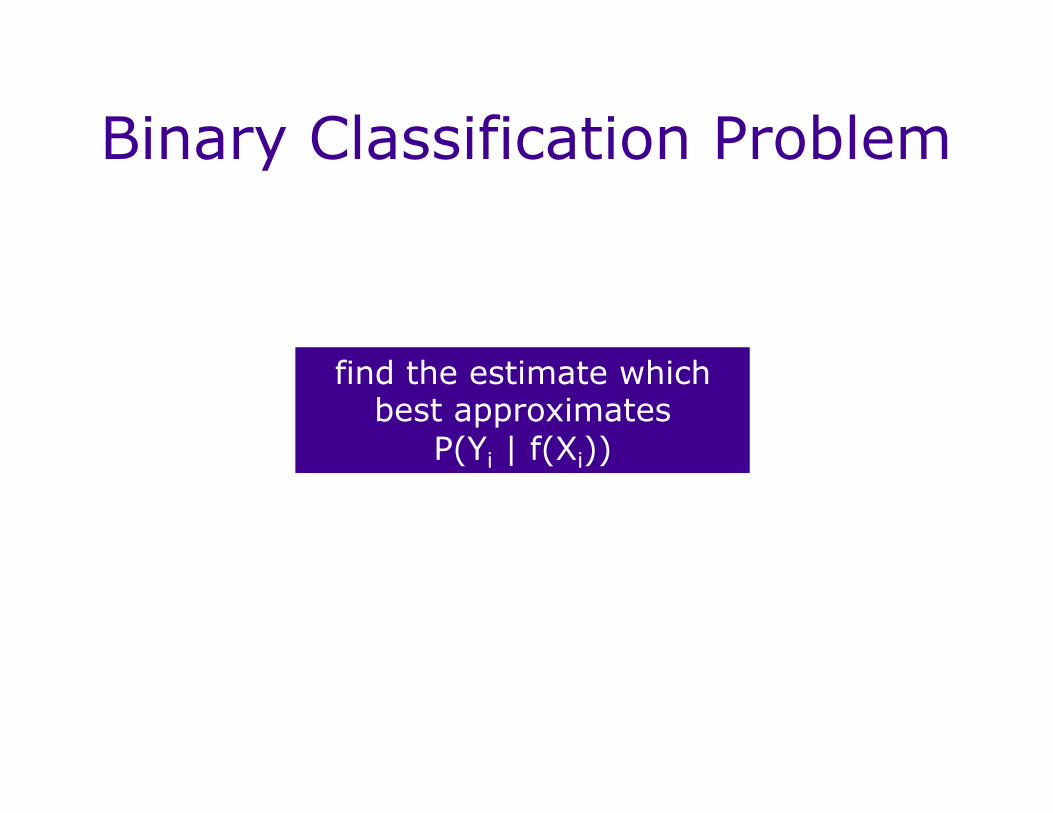
Binary Classification Problem
find the estimate which best approximates
P(Yi | f(Xi))

Features
How do we represent an ad landing page Xi?
CONTENT
clickToCall
numClickable
tokenCount
numImages
…
isMobileOptimised
SIMILARITY
cosineCreativeLandingPageNouns
cosineCreativeLandingPageWiki
HISTORICAL
numImpressions
numClicks
bouncerate
avgDwellTime
avgDwellTimeNonShort
ctr
cpc

Offline Experiments: Setup(1)
*Class probability obtained using Platt scaling
3 Learning Methods - LogReg: L1-norm; C=100; stopping criterion = 10-2
- SVM*: RBF kernel; pen. of error = 1.0; stopping criterion = 10-3
- GBDT: 100 trees; max depth = 4; learning rate = 10-2
3 Quality Measures - Area Under the ROC Curve (AUC) - F1
- Matthews Correlation Coefficient (MCC)

Offline Experiments: Setup(2)
Datasets (random samples) - Training Set à 1,500 ads shown in March 2014 - Test Set à 550 ads shown in April 2014
Thresholds used for labelling
- Dwell Time (tδ) à [35,45] secs.
- Bounce Rate (τβ) à [.20,.25]
40 secs. is the median dwell time in our training set

Offline Evaluation P(dwell time > tδ) P(bounce rate < τβ)
All the learning methods perform similarly
Similarity features do not improve the performance (in fact, they can
demote it)
Content features alone achieve good performance
Historic features boost performance but they can be
sparse

Feature Ranking Top-15 ranked features using GBDT classifier
No similarity feature in the top-15 when GBDT is trained on C-S-H (first and only one is ranked 11th for C-S)
Content features are crucial
Historic features are the top-3 ranked for C-S-H

Online Bucket Testing
A/B Testing
Baseline Bucket (control) High-Quality Bucket (treatment)
Ø LogReg implementation in production
Ø P(dwell time > tδ) [tδ = 40 secs.] Ø Only for Yahoo iOS App (mobile)

Online Experiments: Setup
2 Datasets (random samples) - Time range: May-June 2014
- D1: contains clicks on ads served by the baseline bucket
- D2: contains clicks on ads served by the high-quality bucket
3 Analyses - (ad-)click-level
- ad-level
- user-level
- All à ads/users appearing in D1 or D2
- Shared à ads/users appearing in D1 and D2
- Unique à ads/users appearing in D1 xor D2
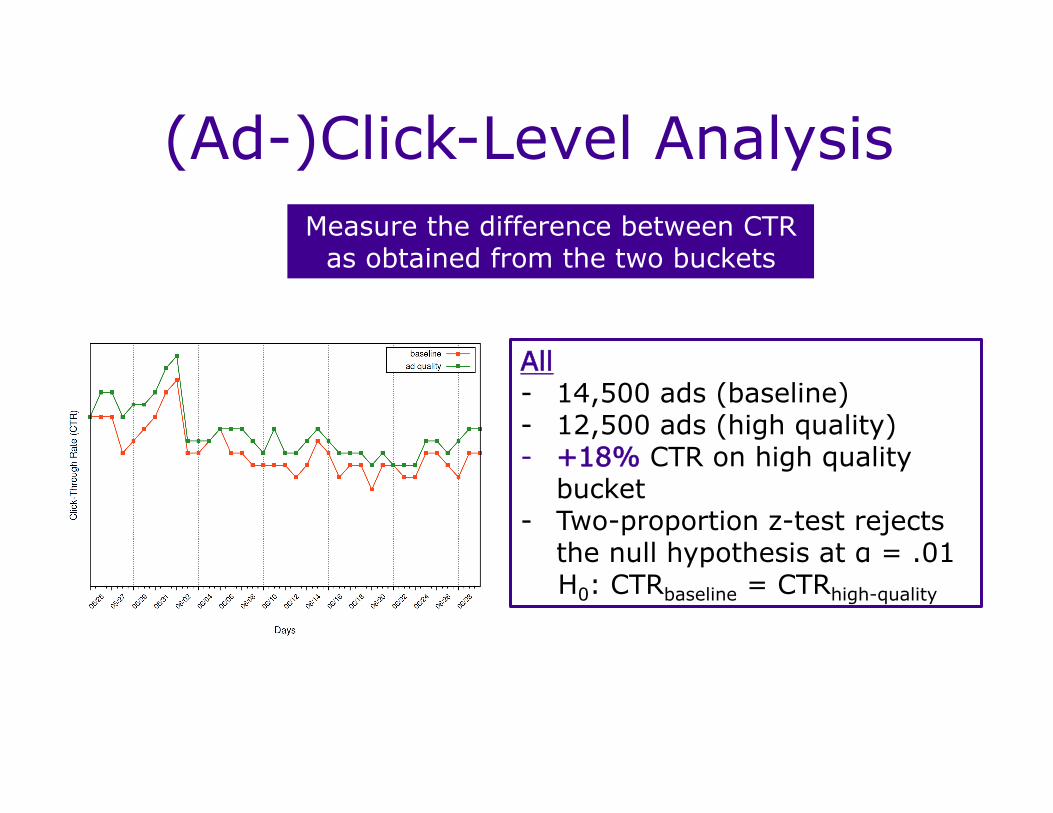
(Ad-)Click-Level Analysis Measure the difference between CTR
as obtained from the two buckets
All - 14,500 ads (baseline) - 12,500 ads (high quality) - +18% CTR on high quality
bucket - Two-proportion z-test rejects
the null hypothesis at α = .01 H0: CTRbaseline = CTRhigh-quality

Ad-Level Analysis Measure the difference between dwell time and bounce rate as obtained from the two buckets
from ad perspective
- Remove - very long clicks (i.e. > 10 mins.) - ads clicked less than 10 times
- Bounce click = dwell time < 5 secs. - 1,000 ads (baseline) - 700 ads (high quality) - 600 ads (shared) - Two-sample K-S test significant at α = .01 except
for bounce rate on shared ads

User-Level Analysis Measure the difference between dwell time and bounce rate as obtained from the two buckets
from user perspective
- Remove - very long clicks (i.e. > 10 mins.) - users who clicked on less than 2 unique ads
- Bounce click = dwell time < 5 secs. - 16,000 users (baseline) - 11,000 users (high quality) - 2,700 users (shared) - Two-sample K-S test significant at α = .01

Conclusions - Factor the post-click experience into the traditional
ad ranking scheme which optimises only for CTR - Define 2 proxy measures of post-click ad quality:
dwell time and bounce rate - Design a machine-learning-based solution to predict
high post-click quality ads from the features of the landing page (and the creative)
- Deploy an implementation in production on Yahoo Gemini
- Online A/B testing shows that dwell time significantly increases (+30%) and bounce rate significantly decreases (-6.7%) with only small drop of eCPM