project on sales promotion
TRANSCRIPT

8/6/2019 Project on Sales Promotion
http://slidepdf.com/reader/full/project-on-sales-promotion 1/59
A STUDY ON SALES PROMOTION IN MAGNANIM SYSTEMS
PVT LTD IN PUDUCHERRY
SUMMER PROJECT REPORT
It for sample only dont edit this sample project it
work of other
8/6/2019 Project on Sales Promotion
http://slidepdf.com/reader/full/project-on-sales-promotion 2/59
ACKNOWLEDGEMENT
First and foremost, I thank the God for his substantial blessing and mercy at all stages in the
completion of the project.
I take this opportunity to express my deep sense of gratitude to Shri.N.Kesavan, Founder
Chairman, Shri.M.Dhanasekaran, Managing Director and Shri.S.V.Sugumaran, Vice-
Chairman of our college for their good wishes for this project.
I express my immense gratitude to our Principal Dr.V.S.K.Venkatachalapathy for his
support and encouragement for the completion of my project.
I extend the immense gratitude to the Head of the Department Mr.S.Jayakumar for his
motivation, inspiration, and encouragement for the completion for my project.
The valuable and unflinching requital support in this Endeavor Mrs.K.Vidhya my internal
guide whose assistance was immeasurable to the completion of this project.
I express my earnest gratitude to Mr.M. Magesh CEO of Magnanim system Pvt Ltd,
Puducherry for giving me an opportunity to do a project in this reputed organization.
I also thank all the customers of Magnanim system Pvt ltd, puducherry who were
instrumental in the completion of this project.
I would also like to thank all the staff of the organisation for helping me directly and
indirectly to conclude this work. Last, but not the least, my heart felt gratitude to my parents,
relatives and my friends for their constant encouragement, support, help and valuable advice to
make this project a success.

8/6/2019 Project on Sales Promotion
http://slidepdf.com/reader/full/project-on-sales-promotion 3/59
TABLE OF CONTENTS
LIST OF TABLES
LIST OF CHARTS
CHAPTER
NO.TITLE
PAGE
NO.1 INTRODUCTION 1
2 REVIEW OF LITERATURE 63 OBJECTIVES OF THE STUDY 134 RESEARCH METHODOLOGY 145 DATA ANALYSIS AND INTERPRETATION 186 FINDINGS, SUGGESTIONS &
RECOMMENDATIONS OF THE STUDY 457 CONCLUSION 478 LIMITATION AND SCOPE OF THE STUDY 48
ANNEXURES
1. QUESTIONNAIRE - 50
2. BIBLIOGRAPHY - 53
8/6/2019 Project on Sales Promotion
http://slidepdf.com/reader/full/project-on-sales-promotion 4/59
ABSTRACT
This project entitled “A study on Sales Promotion with reference to Magnanim system
Pvt Ltd in puducherry” is intended to determine the sales increase, purchasing behaviour of thecustomer, product competitor and market potential.
Primarily the well defined objectives are framed according to the study. Then
questionnaire is prepaed based on the defined objectives. The prepared questionnaire is used to
get the direct response from the customers.
The response given by the customers are analyzed and interpret using different types of
statistical tools such as percentage analysis, weighted average method.
From the analysis some general findings are araised and that are more related with the
framed objectives for this study. According to the findings the suggestion and recommendations
are given and the conclusions are also based on the findings which will be more helpful for the
organization.

8/6/2019 Project on Sales Promotion
http://slidepdf.com/reader/full/project-on-sales-promotion 5/59
Table No. List Of Tables Page No.
5.1 GENDER WISE RESPONDANTS DETAILS 18
5.2 AGE WISE RESPONDANTS DETAILS 195.3 QUALIFICATION WISE RESPONDENTS DETAILS 20
5.4 OCCUPATION WISE RESPONDENTS DETAILS 21
5.5 PURCHASE FROM MAGNANIM SYSTEM
PRODUCT ALREADY 22
5.6 HOW DO YOU KNOW ABOUT THE MAGNANIM
SYSTEM PRODUCT 23
5.7 WHICH TYPE OF PRODUCT DO YOU LIKE 24
5.8 WHY DID YOU CHOOSE THE MAGNANIM
SYSTEM 25
5.9 EXPECTING FROM MAGNANIM SYSTEM FOR
YOUR NEXT PURCHASE 26
5.10 FACTOR EXPECT MORE FROM MAGNANIM
SYSTEM PRODUCT 27
5.11 DIFFER FROM COMPETITONS FOR SALES
PROMOTION 28
5.12 MESSAGE IS BEING RECEIVED FROM OUR
ADVERTISING 29
5.13 MEDIA IS MOST EFFECTIVE FOR DELEIVERING
OUR MESSAGE 30
5.14 WHICH TOOL IS PREFER TO PURCHASE OUR
PRODUCT 31
5.15 SYSTEMS BUY IN ONE YEAR 32
5.16 SYSTEMS REPLACE IN ONE YEAR 33
5.17 RATE THE PERFORMANCE OF PRODUCT 34
5.18 RATE THE PERFORMANCE OF SERVICE 35
5.19 RATE THE PERFORMANCE OF QUALITY 36
5.20 RATE THE PERFORMANCE OF PRICE 37
5.21 RATE THE PERFORMANCE OF RELIABILITY 385.22 CHANGE IN THE DEVELOPMENT OF SELLING
THE PRODUCT 39
5.23 DESIRABLE QUALITIES THAT WE LACK 40
5.24 PURCHASING THE PRODUCT IN NEXT YEAR 41
5.25 WEIGHTED AVERAGE METHOD 42
5.26 OCCUPATION OF THE RESPONDENTS *
PURCHASING TYPE OF PRODUCT
43
8/6/2019 Project on Sales Promotion
http://slidepdf.com/reader/full/project-on-sales-promotion 6/59
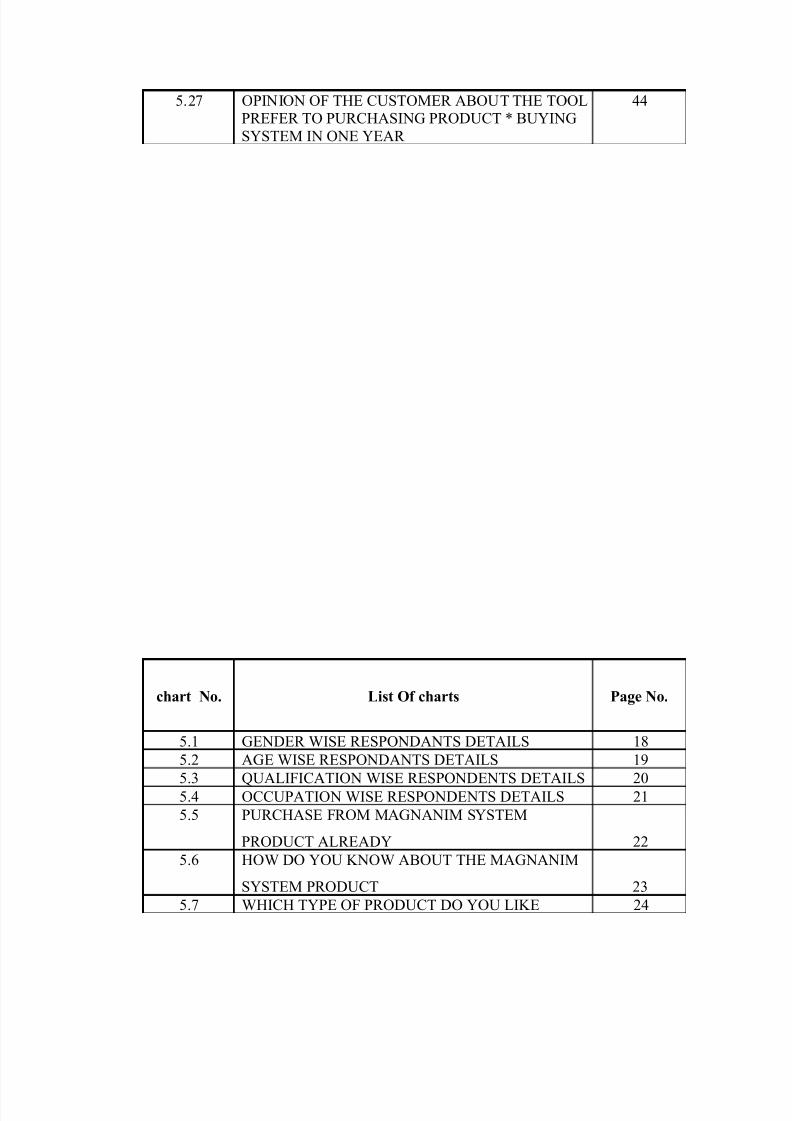
5.27 OPINION OF THE CUSTOMER ABOUT THE TOOLPREFER TO PURCHASING PRODUCT * BUYING
SYSTEM IN ONE YEAR
44
chart No. List Of charts Page No.
5.1 GENDER WISE RESPONDANTS DETAILS 18
5.2 AGE WISE RESPONDANTS DETAILS 19
5.3 QUALIFICATION WISE RESPONDENTS DETAILS 205.4 OCCUPATION WISE RESPONDENTS DETAILS 21
5.5 PURCHASE FROM MAGNANIM SYSTEM
PRODUCT ALREADY 22
5.6 HOW DO YOU KNOW ABOUT THE MAGNANIM
SYSTEM PRODUCT 23
5.7 WHICH TYPE OF PRODUCT DO YOU LIKE 24
8/6/2019 Project on Sales Promotion
http://slidepdf.com/reader/full/project-on-sales-promotion 7/59
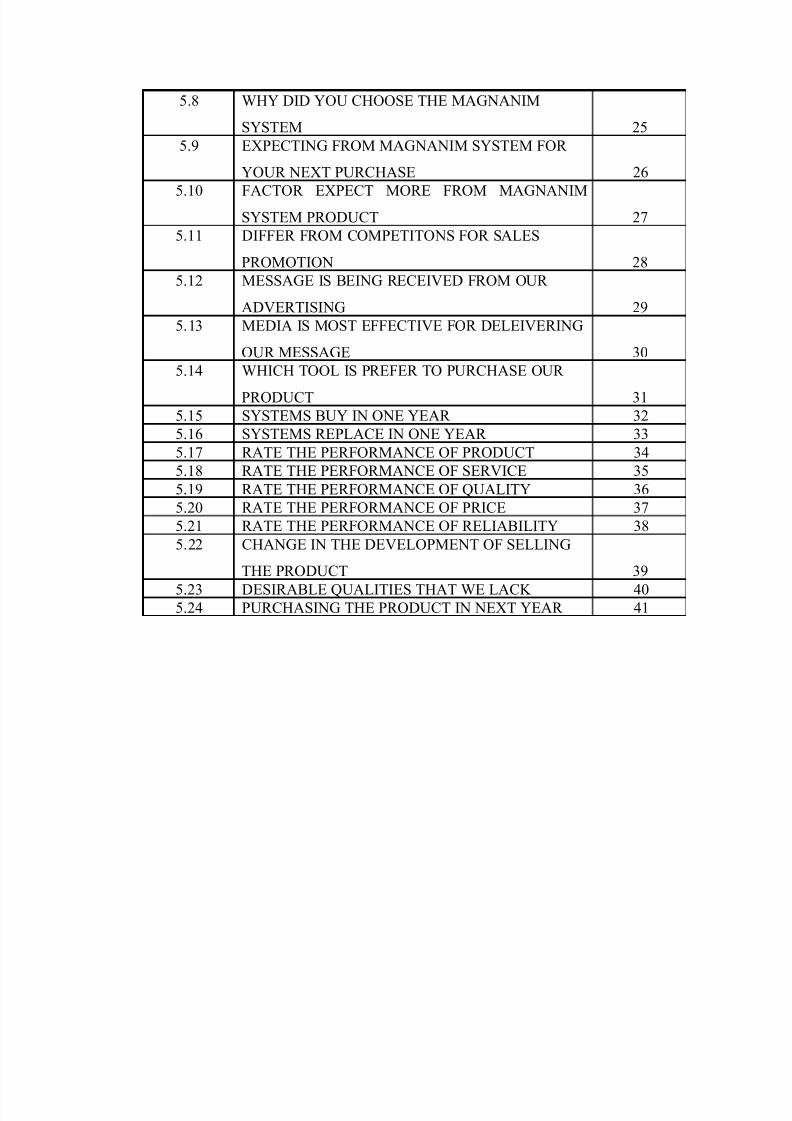
5.8 WHY DID YOU CHOOSE THE MAGNANIM
SYSTEM 25
5.9 EXPECTING FROM MAGNANIM SYSTEM FOR
YOUR NEXT PURCHASE 26
5.10 FACTOR EXPECT MORE FROM MAGNANIMSYSTEM PRODUCT 27
5.11 DIFFER FROM COMPETITONS FOR SALES
PROMOTION 28
5.12 MESSAGE IS BEING RECEIVED FROM OUR
ADVERTISING 29
5.13 MEDIA IS MOST EFFECTIVE FOR DELEIVERING
OUR MESSAGE 30
5.14 WHICH TOOL IS PREFER TO PURCHASE OUR
PRODUCT 315.15 SYSTEMS BUY IN ONE YEAR 32
5.16 SYSTEMS REPLACE IN ONE YEAR 33
5.17 RATE THE PERFORMANCE OF PRODUCT 34
5.18 RATE THE PERFORMANCE OF SERVICE 35
5.19 RATE THE PERFORMANCE OF QUALITY 36
5.20 RATE THE PERFORMANCE OF PRICE 37
5.21 RATE THE PERFORMANCE OF RELIABILITY 38
5.22 CHANGE IN THE DEVELOPMENT OF SELLING
THE PRODUCT 39
5.23 DESIRABLE QUALITIES THAT WE LACK 405.24 PURCHASING THE PRODUCT IN NEXT YEAR 41

8/6/2019 Project on Sales Promotion
http://slidepdf.com/reader/full/project-on-sales-promotion 8/59
CHAPTER 1
INTRODUCTION
1.1 Company profile:
Magnanim systems an ISO 9001:2000 certified company (certifed for repairing/servicing of
computers and pheriperal) is a full support computer sales, network solution and service provider,
headqartered in the union territory of pondicherry having branches at Cuddalore and Karaikal.
Moreover we were providing services to Mahe and Yanam by means of appointing residential
engineers.
Back in 1997, they recongnized the need for a computer service company to provide personal,
yet fully technical advice and first-rate computer service that the average home or small business
could afford. From the original 300 sq/ft office that have grown to become a 2,500 sq/ft Retail
outlet with a product showroom, service department, training center, system fit-up area,
component warehouse, corporate sales department and administrative offices.
In that magnanim ystems understand the challenges of today’s highly competitive business
environment. To gain and retain our business, they are constantly analyzing, redefining the way
we can serve best to our clients. In view of the objective to provide world-class product and
service to our customers they have made a strong association with industry majors like IBM, HP,
Intel, AMD, TVSE, Canon as their proud and trusted business partner.
At Magnanim systems, they understand the meaning of the work ‘service’ and they are
continually improving the product line, ordering and delivery systems. From standalone systems
to multi-server metworks, from Novell to the multi level GUI server solutions, they have the
resources, the talent, the facilities and the desire to be the primary source for all your technology
needs.
1.2Terms and condition
The equipment will be inspected, and preventive maintenance carried monthly ones
without any call from the client place.
Service personnel will have free access to the installation an will receive reasonable help
and assistance from the client.
Maintenance shall be rendered only during working hours of the concern. If required
urgent it will consider as the special case the service will be rendered.
8/6/2019 Project on Sales Promotion
http://slidepdf.com/reader/full/project-on-sales-promotion 9/59
The customer is requested to call magnanim systems for change or relocated of the
equipments.
In case malfunctioning part is not repairable at the client’s site, it shall be taken to
Magnanim systems premises and either will be repaired or replaced. In case the original
part is replaces, the cost of the replacement will be payable by the customer at rated
prevalent at the time of replacement if the part is not covered in the AMC.
In case material is supplied to the customer under this contract, and whether it is
chargeable, applicable excise, sales tax and other government levies that may be charged
are payable by the customer only the service will be rendered at free of cost.
The agreement shall be deemed to have executed at puducherry. Any dispute shall be
subject to the exclusive jurisdiction of the court of pondicherry. Further this contract is
government by the laws of the republic of INDIA.
1.3 Registered/Headoffice :
25, First floor,
Needarjappaiyar Street,
Puducherry-605001
Phone: 0413-4201112
Telefax : 0413-4209050
Mobile: 98947-82229/32828
1.4 Nature of gains :
Servicing of- Computer motherboards
• -Add-on cards
• -Chip level
• Monitors
• Printer
• Scanners
• Optical drives
• Magnetic Drives
• Power supplies
• UPS.

8/6/2019 Project on Sales Promotion
http://slidepdf.com/reader/full/project-on-sales-promotion 10/59
1.5 Applicable for Replacement:
• Mother board-Ram-CPU
• Hard disk
• Color/Mono monitor
• Keyboard-mouse
• Floppy Drive
• Printer
• Display cards
• Ethernet card
• Network cable/ connectors
• Scanner
• Power cards
• Switch mode power supply
• CD ROM Drive
• Sound cards
• Speakers
• Hubs
•UPS
1.6 Installation & configuring:
• Softwre
• Network
• Structured cabling
• Server tuning
• Troubleshooting
1.7 Data recovery:
All media recovery
Crash proof
Virus affected recovery
Logical/ physical recovery
Data wiping
8/6/2019 Project on Sales Promotion
http://slidepdf.com/reader/full/project-on-sales-promotion 11/59
1.8 Sales:
Computer systems
Printers
Software
Acessories
Digital Equipments
1.9 Support:
Free on-line troubleshooting
On-line support
Annual maintenance support
Per call maintenance
Free E-mail solutions
E-management solutions
Couputer consultancy
Network designing
Upgrade soultions
8/6/2019 Project on Sales Promotion
http://slidepdf.com/reader/full/project-on-sales-promotion 12/59
NEED FOR STUDY
This survey is to identify and focus on the sales promotion of Magnanim system.
To accomplish this, a survey was conducted to gather the impartial information about the
sales promotion. The study was conducted for the below needs.
To improve the sales increase in competetive market.
To study the purchasing behaviour of the customer.
To study market potential of magnanim system.
To improve tools and technique of sales promotion .
To study the product competitor.

8/6/2019 Project on Sales Promotion
http://slidepdf.com/reader/full/project-on-sales-promotion 13/59
CHAPTER 2
REVIEW OF LITERATURE
INTRODUCTION
In a time when customers are exposed daily to a nearly infinite amount of promotional
messages, many marketers are discovering that advertising alone is not enough to move members
of a target market to take action, such as getting them to try a new product. Instead, marketers
have learned that to meet their goals they must use additional promotional methods in
conjunction with advertising.
Other marketers have found that certain characteristics of their target market (e.g., small butgeographically dispersed) or characteristics of their product (e.g., highly complex) make
advertising a less attractive option. For these marketers better results may be obtained using
other promotional approaches and may lead to directing all their promotional spending to non-
advertising promotions.
Finally, the high cost of advertising may drive many to seek alternative, lower cost
promotional techniques to meet their promotion goals.
Sales promotions are used widely in many industries and especially by marketers selling to
consumers. We will see that the objectives of sales promotion are quite different than advertising
and are specifically designed to encourage customer response.
DEFINITION
An activity designed to boost the sales of a product or service. It may include an advertising
campaign, increased PR activity, a free-sample campaign, offering free gifts or trading stamps,
arranging demonstrations or exhibitions, setting up competitions with attractive prizes, temporary
price reductions, door-to-door calling, telemarketing, personal letters on other methods".

8/6/2019 Project on Sales Promotion
http://slidepdf.com/reader/full/project-on-sales-promotion 14/59
What is Sales Promotion?
Sales promotion describes promotional methods using special short-term techniques to
persuade members of a target market to respond or undertake certain activity. As a reward,
marketers offer something of value to those responding generally in the form of lower cost of
ownership for a purchased product (e.g., lower purchase price, money back) or the inclusion of
additional value-added material (e.g., something more for the same price).
Sales promotions are often confused with advertising. For instance, a television
advertisement mentioning a contest awarding winners with a free trip to a Caribbean island may
give the contest the appearance of advertising. While the delivery of the marketer’s message
through television media is certainly labeled as advertising, what is contained in the message,
namely the contest, is considered a sales promotion. The factors that distinguish between the two
promotional approaches are:
1. whether the promotion involves a short-term value proposition (e.g., the contest
is only offered for a limited period of time), and
2. the customer must perform some activity in order to be eligible to receive the
value proposition (e.g., customer must enter contest). The inclusion of a timingconstraint and an activity requirement are hallmarks of sales promotion.
Sales promotions are used by a wide range of organizations in both the consumer and
business markets, though the frequency and spending levels are much greater for consumer
products marketers. One estimate by the Promotion Marketing Association suggests that in the
US alone spending on sales promotion exceeds that of advertising.
Consumer Sales Promotion
Consumer sales promotions encompass a variety of short-term promotional techniques
designed to induce customers to respond in some way. The most popular consumer sales
promotions are directly associated with product purchasing. These promotions are intended to
enhance the value of a product purchase by either reducing the overall cost of the product

8/6/2019 Project on Sales Promotion
http://slidepdf.com/reader/full/project-on-sales-promotion 15/59
(i.e., get same product but for less money) or by adding more benefit to the regular purchase price
(i.e., get more for the money).
While tying a promotion to an immediate purchase is a major use of consumer sales
promotion, it is not the only one. As we noted above, promotion techniques can be used to
achieve other objectives such as building brand loyalty or creating product awareness.
Consequently, a marketer’s promotional toolbox contains a large variety of consumer
promotions.
A producer must also guard against the possible negative effect of discounting on a
brand's reputation.
Disanta Ojah:
Sales promotions can be directed at either the customer, sales staff, or distribution channel
members (such as retailers). Sales promotions targeted at the consumer are called consumer sales
promotions. Sales promotions
targeted at retailers and wholesalers are called trade sales promotions. Some sale promotions,
particularly ones with unusual methods, are considered gimmicks by many.Consumer sales
promotion techniques
♦ Price deal: A temporary reduction in the price; this includes a happy hour
♦ Cents-off deal: Offers a brand at a lower price. Price reduction may be a percentage marked on
the package.
♦ Price-pack deal: The packaging offers a consumer a certain percentage more of the product
for the same price (eg: 25% more free).
♦ Coupons: coupons have become a standard mechanism for sales promotions.
♦ Free-standing insert (FSI): A coupon booklet is inserted into the local newspaper for
delivery.
♦ On-shelf couponing: Coupons are present at the shelf where the product is available.
♦ Checkout dispensers: On checkout the customer is given a coupon based on products
purchased.
8/6/2019 Project on Sales Promotion
http://slidepdf.com/reader/full/project-on-sales-promotion 16/59
♦ On-line couponing: Coupons are available on line. Consumers print them out and take them to
the store.
♦ Rebates: Consumers are offered money back if the receipt and barcode are mailed to the
producer.
♦ Contests/sweepstakes/games: The consumer is automatically entered into the event by
purchasing the product.
Methods of sales promotion
There are many consumer sales promotional techniques available, summarized in the table
below:
Price promotions
Price promotions are also commonly known as" price discounting"These offer either
(1) A discount to the normal selling price of a product, or
(2) More of the product at the normal price.
Increased sales gained from price promotions are at the expense of a loss in profit - so these
promotions must be used with care.
A producer must also guard against the possible negative effect of discounting on a brand's
reputation
Pauline Douglas
Sales promotion is very much a social science, that takes into consideration that humans are
fundamentally creatures of habit, and will take a new product or service into their lives based
upon the following principals:
a. Introduction b. Perception c. Familiarity d. Trust
The challenge of Sales Promotion is to influence and modify a consumers purchasing habits
by developing the perception, familiarity and trust around a new product or service. The
objective is the gaining of new and repeat customers.

8/6/2019 Project on Sales Promotion
http://slidepdf.com/reader/full/project-on-sales-promotion 17/59
It is considered that if a consumer is introduced to a product or service three times, they will
have gained enough familiarity to trial a product or service. It is further considered that if a
consumer purchases a product or service three times, they will have gained the trust to integrate
the product or service into their regular buying habits.
Consumers are introduced to new products and services in one, or all of the following ways
(in order of importance and impact)
a. Word of Mouth b. Point Of Sale c. Media Promotion
a.Word of mouth promotion (reputation) is by far the most powerful form of sales
promotion - particularly if introduced by a person that the consumer knows and trusts, such as a
friend or family member. Sales Representatives and Sales Assistants also play a key role to the
verbal promotion of products and services.
b.Point of Sale (POS) Promotion is the next most powerful way in which consumers
will be brought face to face with a new product or service. The challenge is to gain the interest
and trust of the consumer through carefully thought out packaging, display and pricing.
Many food, beverage and cosmetic industries will combine the power of word of mouth and
POS promotion, to incorporate a "Sampling Promotion" to enhance the effectiveness of Sales.
Sales promotion also looks to a variety of Media Strategies to gain consumer awareness
and familiarity, such as advertising (newspaper, magazine, radio and t.v., direct marketing (snailmail advertising and telemarketing) and the new medium of the internet (internet marketing and
web design).
When launching or re-launching a product or service, these factors should be taken into
consideration for future success.
Article by Pauline Douglas
Peattie. k International journal of service industries management
Sales promotion as part of the communication mix is virtually ignored within the services
marketing literature, in comparison with personal selling and "above-the-line" advertising.
However, "below-the-line" techniques have been growing in their extent, credibility and
sophistication during the last two decades. They have now reached the point where they deserve
consideration in relation to other areas of marketing practice beyond their fast-moving consumer

8/6/2019 Project on Sales Promotion
http://slidepdf.com/reader/full/project-on-sales-promotion 18/59
goods (FMCG) origins. The different tools which make up the promotional toolkit have also
reached a point where they deserve individual consideration instead of being bundled together.
Seeks to demonstrate how one such tool, the promotional competition, represents a significant
opportunity for services marketers. Reviews the literature relating to sales promotion to build a
case for the suitability of competitions for services marketing, and presents the findings of a
survey of 188 services-sponsored competitions to explore the nature and extent of competitions'
use in practice.
From Andrew Johnson, Director-General of The VA
Ensuring a positive experience for the recipient of a gift voucher can make all the
difference in the success a sales promotion since brand identity will be reflected by the quality of
service and gift that are delivered. The goal of a gift voucher or gift card should be to make a
lasting and positive impact through sales promotion and one way of ensuring that the recipient
will be left with something special to remember is to use and experience gift vouchers.
Several members of The VA provide ‘chance in a lifetime’ experiences as gift-vouchers
and I thought that this would be a great opportunity to highlight the benefits of utilising
experiential sales promotions as a means of building enduring relationships with the consumer.
Red Letter Days was a pioneer of the concept of offering gift experience vouchers that
promise exciting days out and the opportunity to try unusual activities – the gift with a difference
for both corporate and consumer markets.
Zachary Soreff , director of sales & marketing at Red Letter Days explains the value of an
experiential reward: “Experiences offer a more interactive and tuned-in way of promoting a
product which, in turn, allows audiences to become more integrated with the brand. They are a
popular tool for sales promotion because we are engaging customers emotionally with the brands
by giving them a memory to cherish.”
There is certainly an emotional ‘touch point’ for any company, whether it is speed and
excitement to attract the younger market or comfort and luxury to attract a more refined audience.
It is the job of the experiential provider to discover the activity or experience that will best
represent the brand to its intended audience.

8/6/2019 Project on Sales Promotion
http://slidepdf.com/reader/full/project-on-sales-promotion 19/59
Tim Bishop of eXhilaration explains that by “aligning your brand with a relevant
experience you can help to create a more exciting perception of your business in the customer’s
mind.”
Exhilaration are experts in providing vouchers for adrenaline experiences such as Ferrari
driving, bungee jumping and adventure weekends but also offer less extreme pursuits including
spa days and gourmet cruises. “The impact of sending someone over a mountain with nothing but
a bit of elastic to hold onto will certainly be a lasting one” he continued, “but not necessarily one
that everybody would enjoy.”
The Full Experience Company offers a wide choice with its trademarked Smart Box™
gift packages. “The secret to its success”, explains Benoit Linossier, managing director, “is that
the Smart Box appears to be worth a lot more than it really costs”, which just goes to show that a
gift does not necessarily have to rely on its monetary worth to be appreciated and valued.
A great example of how experiential vouchers can add value to a sales promotion
without pushing up the costs is the campaign that The Full Experience ran with Nokia in France.
Benoit explained: “By offering an Adventure Smart Box instead of a discount, customers were
encouraged to purchase a top of the range mobile phone instead of the cheaper alternative as they
felt that they were getting a lot more for their money with an experience.” This demonstrates just
how valuable experiential gifts can be; that essentially, it’s the memories that really count.
8/6/2019 Project on Sales Promotion
http://slidepdf.com/reader/full/project-on-sales-promotion 20/59
CHAPTER 3
OBJECTIVES
PRIMARY OBJECTIVES:
To find out the sales promotion in magnanim systems.
SECONDARY OBJECTIVES:
1. To find out sales increase in competetive market.
2. To find tools and techniques of sales promotion that is used in the organisation.
3. To analyze the purchasing behaviour of the customer.
4. To analyze the product competitor in the market.
8/6/2019 Project on Sales Promotion
http://slidepdf.com/reader/full/project-on-sales-promotion 21/59
CHAPTER 4
RESEARCH METHODOLOGY
Research methodology is way to systematically solve the research problem. It is a plan of
action for a research project and expains in detail how data are collected and analyzed. Research
Methodology may be understood as a science of studying how research is done scientifically. It
can cover a wide range of studies from simple description and investigation to the construction of
sophisticated experiment.
A clear objective provides the basis of design of the project. Since the main objective of this
study is to identify the customers preference, expectation and perception. It was decided to use
descriptive research design include, surveys and fact-finding enquires of different kinds, which
found out to be the most suitable design in order to carry out the project.
4.1 MEANING OF RESEARCH
Research is an art of scientific investigation. The advanced learner’s dictionaries of current
English lay down the meaning of research as, “a careful investigation (or) inquiry especially
through search for new facts in any branch of knowledge”. Redmen and Mary research as a
“systematic effort to gain knowledge”.
4.2 RESEARCH DESIGN
A Research design is plan that specifies the objectives of the study, method to be adopted in
the collection of the data, tools in analysis of data and helpful to frame hypothesis. “A research
design is the arrangement of condition for collection and analysis of data in a manner that aims to
combine relevance to research purpose with ecnomy in procdure”.
Research design is needed because it facilitates the smooth sailing of the various project
operations, thereby making the project as efficient as possible yielding mazimal information with
minimal expenditure of effort time and money. Also it minimizes bias and maximizes the
reliability of the data collected.
8/6/2019 Project on Sales Promotion
http://slidepdf.com/reader/full/project-on-sales-promotion 22/59
4.3 NATURE AND SOURCE OF DATA
Primary data
The data which are collected as fresh for the first time and thus happen to be original in
character is called primary data.
The primary data was collected from the customers of Magnanim systems through a direct
structured questionnaire. Respondent has filled the questionnaire.
4.4 SAMPLING SIZE AND TECHNIQUE
Type of universe
The first step in developing any sample is clearly defining the set of objectives, technically
called the universe, to be studied. Here the universe is the customer of Magnanim systems.
Sampling plan
Due to enormity of the cost and time involved in collecting information from all the
respondents, it becomes a complusion to choose represent sample of population. Sample plan
explains the sampling unit, sample size and sampling method.
Sampling method
Sampling method followed by the investigator is simple random sampling method.
Size of sample
It refers to the number of items to be selected from the universe to constitute a sample. Here
100 customers of Magnanim systems in puducherry were selected as size of sample.
Sample design
When population elements are selected for inclusion in the sample based on the case of
access, it is called convenience sampling method for the convenience of the researcher.
8/6/2019 Project on Sales Promotion
http://slidepdf.com/reader/full/project-on-sales-promotion 23/59
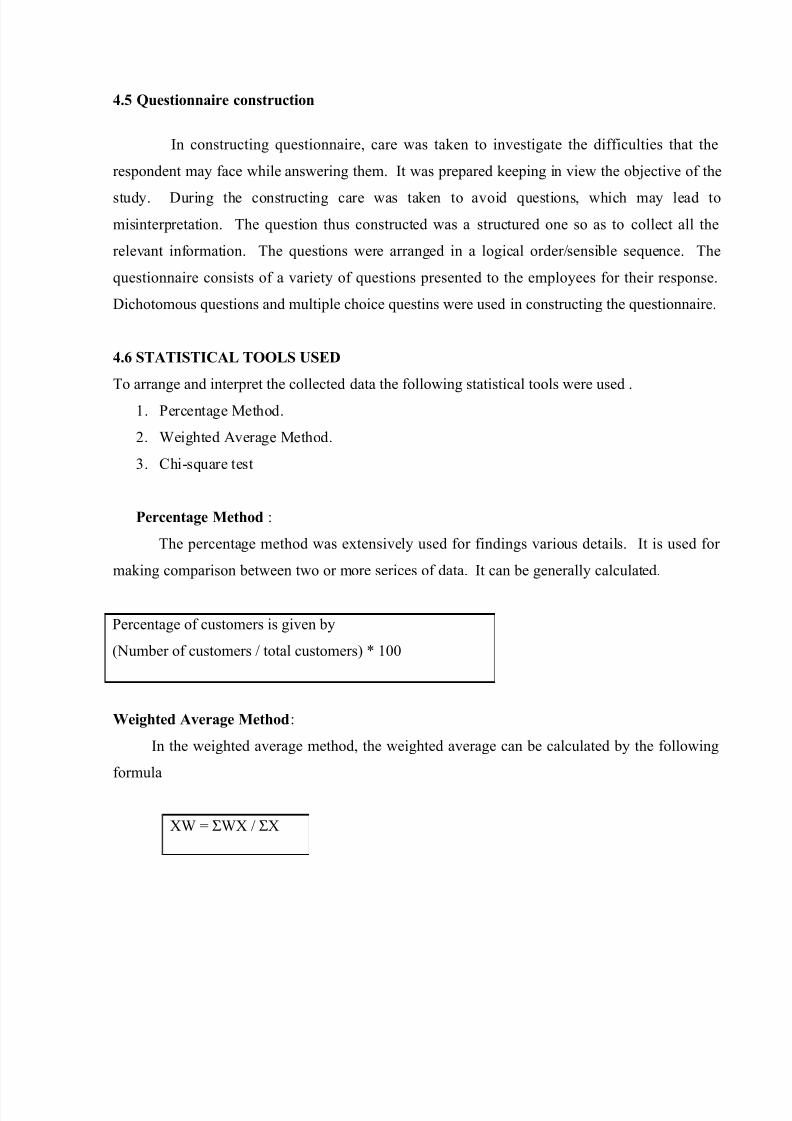
4.5 Questionnaire construction
In constructing questionnaire, care was taken to investigate the difficulties that the
respondent may face while answering them. It was prepared keeping in view the objective of the
study. During the constructing care was taken to avoid questions, which may lead to
misinterpretation. The question thus constructed was a structured one so as to collect all the
relevant information. The questions were arranged in a logical order/sensible sequence. The
questionnaire consists of a variety of questions presented to the employees for their response.
Dichotomous questions and multiple choice questins were used in constructing the questionnaire.
4.6 STATISTICAL TOOLS USED
To arrange and interpret the collected data the following statistical tools were used .
1. Percentage Method.
2. Weighted Average Method.
3. Chi-square test
Percentage Method :
The percentage method was extensively used for findings various details. It is used for
making comparison between two or more serices of data. It can be generally calculated.
Percentage of customers is given by
(Number of customers / total customers) * 100
Weighted Average Method:
In the weighted average method, the weighted average can be calculated by the following
formula
XW = ΣWX / ΣX
8/6/2019 Project on Sales Promotion
http://slidepdf.com/reader/full/project-on-sales-promotion 24/59
Here
XW represents the weighted average
“X1,X2,X3……Xn” represents the value for variable values
“ W!,W2, W3…….Wn” represents the weightage given to the variable.
Steps:
- Multiply the weights (W) by the variables (X) to obtain WX
- Add all WX to obtain ΣWX
- Divide Σ WX by sum of the weights (ΣX) to get weighted average.
Chi-square test
The chi-square test has been used to find the relationship between variables, as it is
applicable for cross-tabulated data
This test has been used to determine whether or not there is any association statistically,
between the variables in data collected.
The chi-square contingency table has been used, as it is appropriate for the hypothesis of
independence between two nominally scaled variables.
Chi square(χ 2)= Σ(Oij-Eij)2 / Eij
Where Oij= Observed frequency of the cell in ith roe and jth column
Eij= Expected frequency of the cell in ith row and jth column
8/6/2019 Project on Sales Promotion
http://slidepdf.com/reader/full/project-on-sales-promotion 25/59

8/6/2019 Project on Sales Promotion
http://slidepdf.com/reader/full/project-on-sales-promotion 26/59
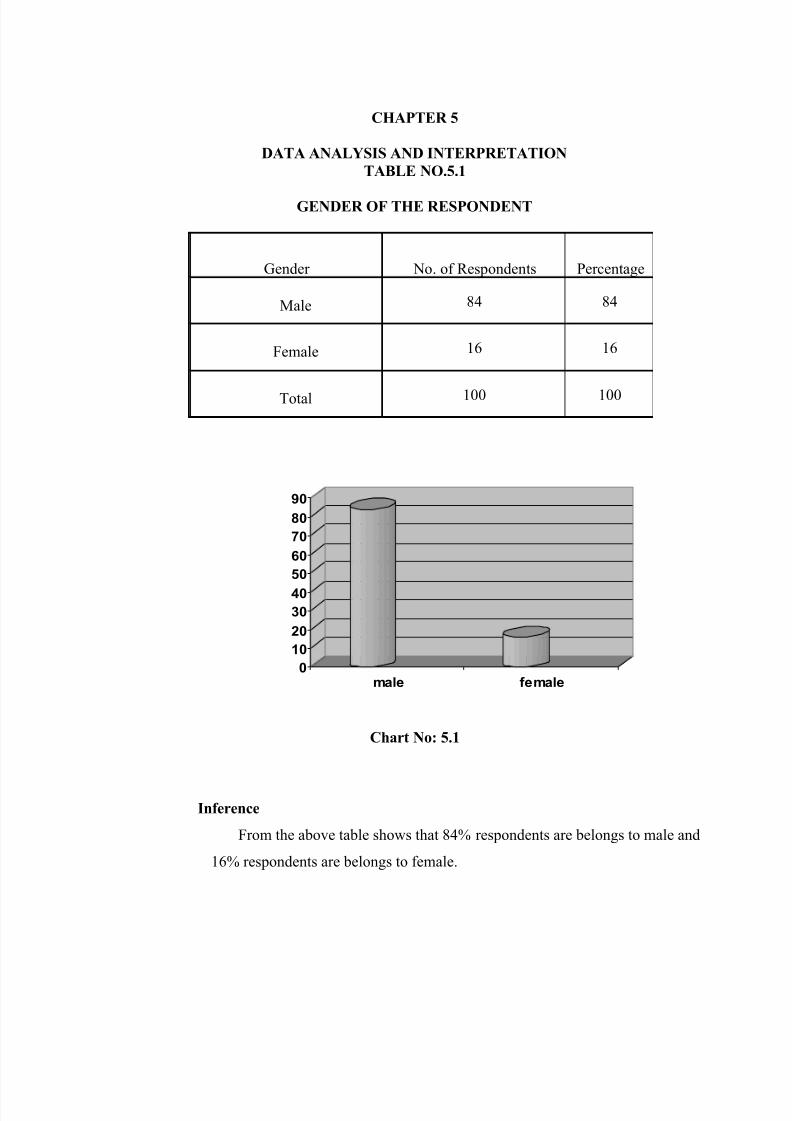
TABLE NO.5.2
AGE OF THE RESPONDENT
Age No. of Respondents Percentage
Below-2528 28
25-35
49 49
35-45
15 15
Above-45
8 8
Total
100 100
0
5
10
15
20
25
30
35
40
45
50
Below-25 25-35 35-45 above-45
Chart No: 5.2
Inference
From the above table shows that 49% respondents are belongs to 25–35, 28% respondents
are belongs to below-25, 15% respondents are belongs to 35-45 and 8% respondents are
belongs to above-45.
8/6/2019 Project on Sales Promotion
http://slidepdf.com/reader/full/project-on-sales-promotion 27/59
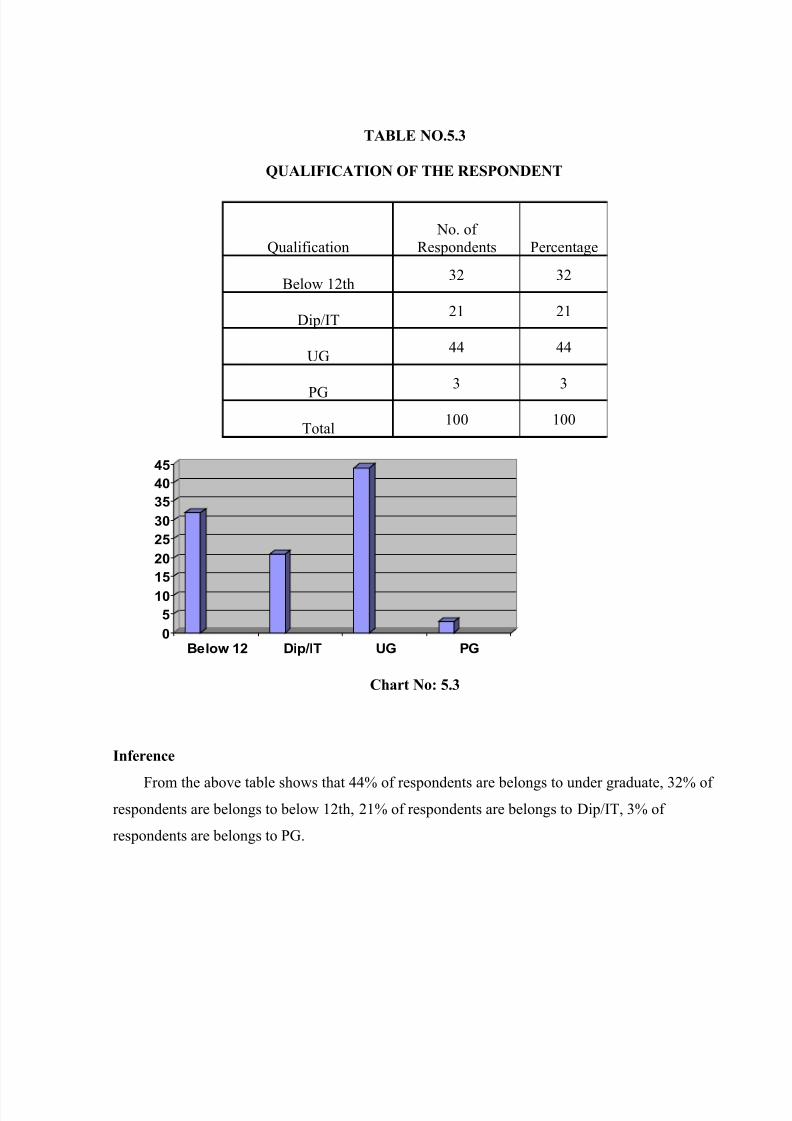
TABLE NO.5.3
QUALIFICATION OF THE RESPONDENT
0
5
10
15
20
25
30
35
40
45
Below 12 Dip/IT UG PG
Chart No: 5.3
Inference
From the above table shows that 44% of respondents are belongs to under graduate, 32% of respondents are belongs to below 12th, 21% of respondents are belongs to Dip/IT, 3% of
respondents are belongs to PG.
Qualification
No. of
Respondents Percentage
Below 12th32 32
Dip/IT21 21
UG44 44
PG3 3
Total100 100

8/6/2019 Project on Sales Promotion
http://slidepdf.com/reader/full/project-on-sales-promotion 28/59
TABLE NO.5.4
OCCUPATION OF THE RESPONDENT
0
5
10
15
20
25
30
35
student professional self
employed
house wife government
Chart No: 5.4
Inference
From the above table shows that 32% of respondents are belongs to self employed,
28% of respondents are belongs to students, 17% of respondents are belongs to professional, 12%of respondents are belongs to house wife, 11% of respondents are belongs to government job.
TABLE NO.5.5
Occupation
No. of
Respondents PercentageStudent 28 28
Professional 17 17
Self employed 32 32
House wife 12 12
Government 11 11
Total 100 100
8/6/2019 Project on Sales Promotion
http://slidepdf.com/reader/full/project-on-sales-promotion 29/59
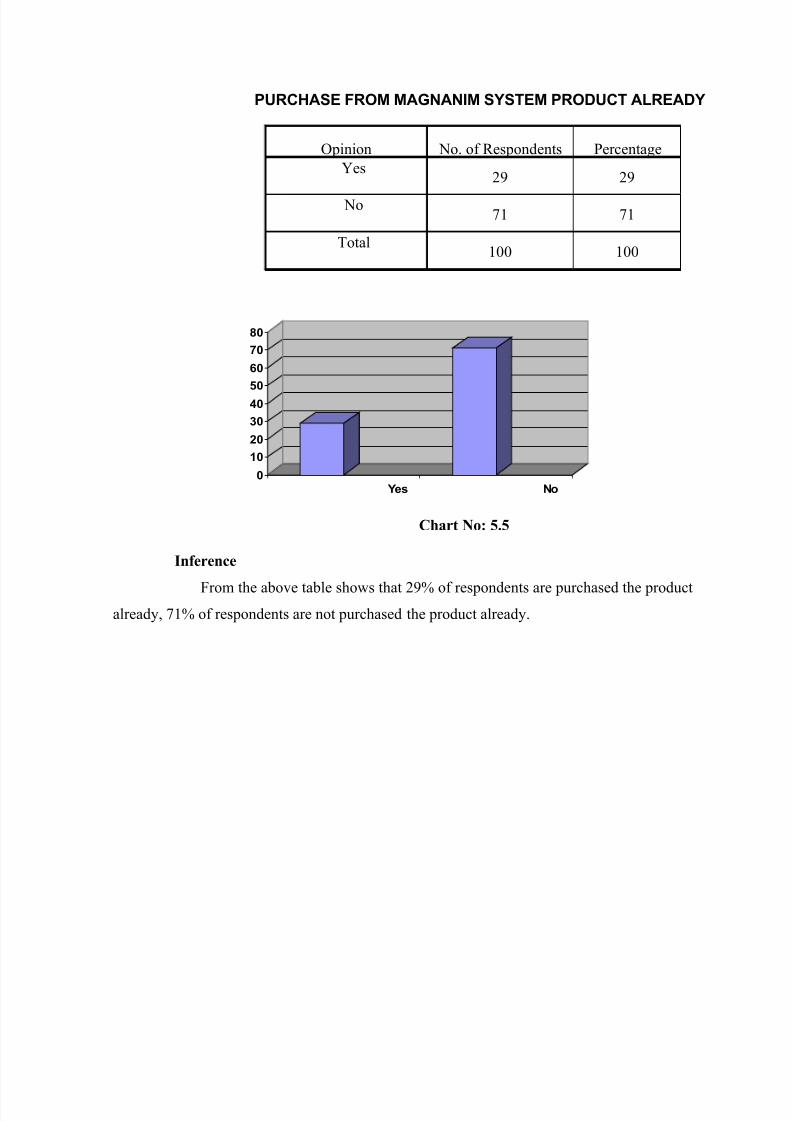
PURCHASE FROM MAGNANIM SYSTEM PRODUCT ALREADY
Opinion No. of Respondents Percentage
Yes29 29
No71 71
Total100 100
0
10
20
30
40
50
60
70
80
Yes No
Chart No: 5.5
Inference
From the above table shows that 29% of respondents are purchased the product
already, 71% of respondents are not purchased the product already.
8/6/2019 Project on Sales Promotion
http://slidepdf.com/reader/full/project-on-sales-promotion 30/59
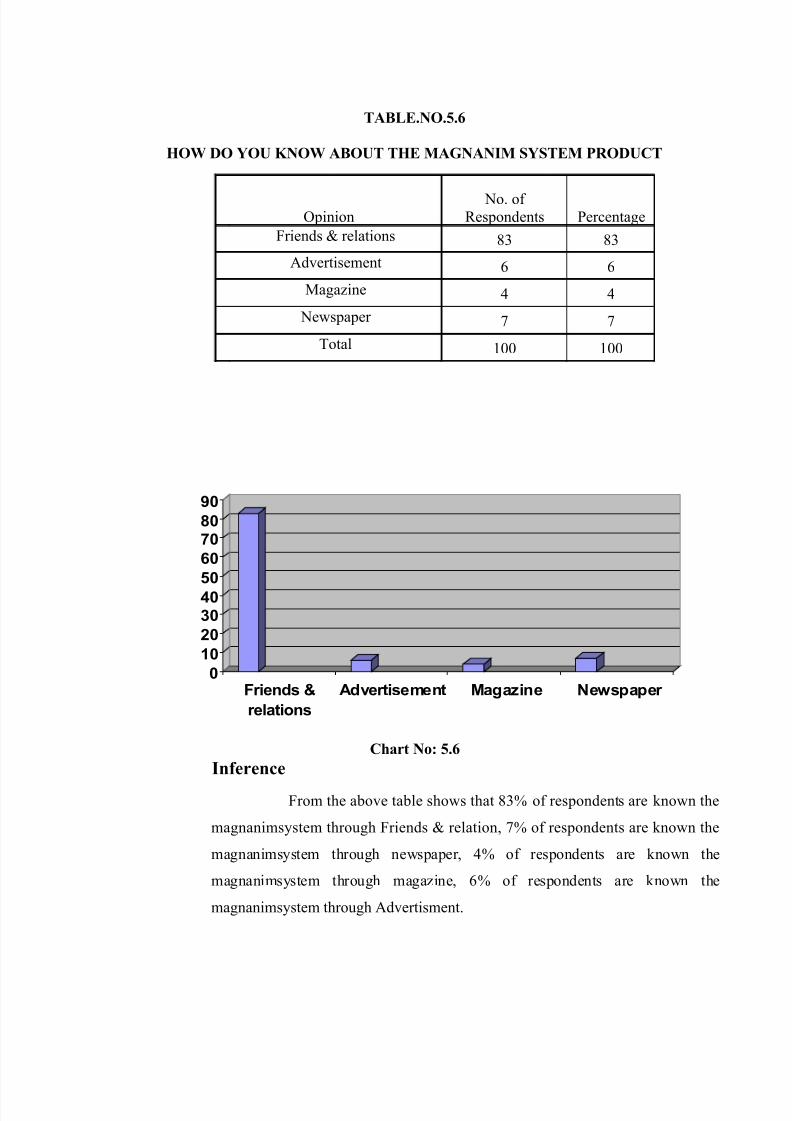
TABLE.NO.5.6
HOW DO YOU KNOW ABOUT THE MAGNANIM SYSTEM PRODUCT
Opinion No. of
Respondents Percentage
Friends & relations 83 83
Advertisement 6 6
Magazine 4 4
Newspaper 7 7
Total 100 100
0
10
20
30
40
50
60
70
80
90
Friends &
relations
Advertisement Magazine Newspaper
Chart No: 5.6
Inference
From the above table shows that 83% of respondents are known the
magnanimsystem through Friends & relation, 7% of respondents are known the
magnanimsystem through newspaper, 4% of respondents are known the
magnanimsystem through magazine, 6% of respondents are known the
magnanimsystem through Advertisment.

8/6/2019 Project on Sales Promotion
http://slidepdf.com/reader/full/project-on-sales-promotion 31/59
TABLE.NO.5.7
WHICH TYPE OF PRODUCT DO YOU LIKE
Opinion No. of
Respondents Percentage
Branded system 21 21
Assembled system 67 67
Printer 12 12
Total 100 100
0
10
20
30
40
50
60
70
Branded system
Assembled
system
Printer
Chart No: 5.7
Inference
From the above table shows that 67% of respondents are buying only assembled
system, 21% of respondents are buying ony branded system, 12% of respondents are buying ony
printer.
8/6/2019 Project on Sales Promotion
http://slidepdf.com/reader/full/project-on-sales-promotion 32/59
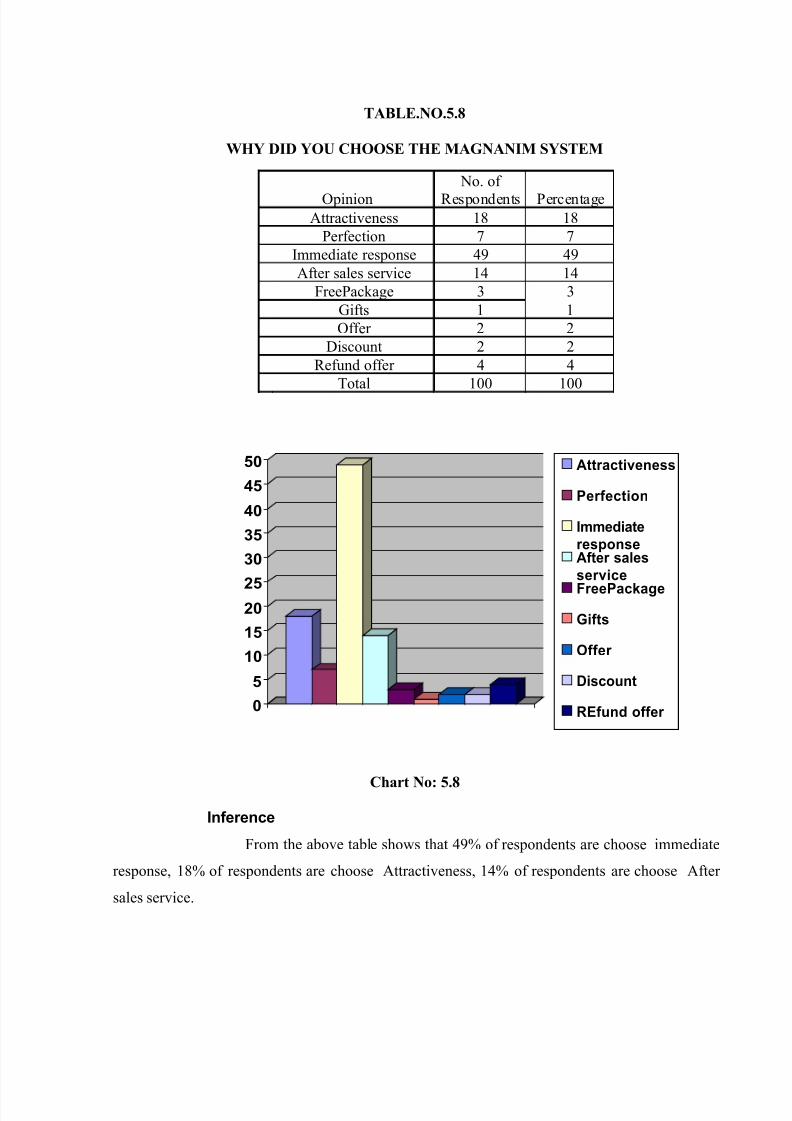
TABLE.NO.5.8
WHY DID YOU CHOOSE THE MAGNANIM SYSTEM
Opinion
No. of
Respondents PercentageAttractiveness 18 18
Perfection 7 7 Immediate response 49 49 After sales service 14 14 FreePackage 3 3 Gifts 1 1 Offer 2 2 Discount 2 2 Refund offer 4 4 Total 100 100
0
5
10
15
2025
30
35
40
45
50 Attractiveness
Perfection
Immediate
responseAfter sales
service
FreePackage
Gifts
Offer
Discount
REfund offer
Chart No: 5.8
Inference
From the above table shows that 49% of respondents are choose immediate
response, 18% of respondents are choose Attractiveness, 14% of respondents are choose After
sales service.
8/6/2019 Project on Sales Promotion
http://slidepdf.com/reader/full/project-on-sales-promotion 33/59
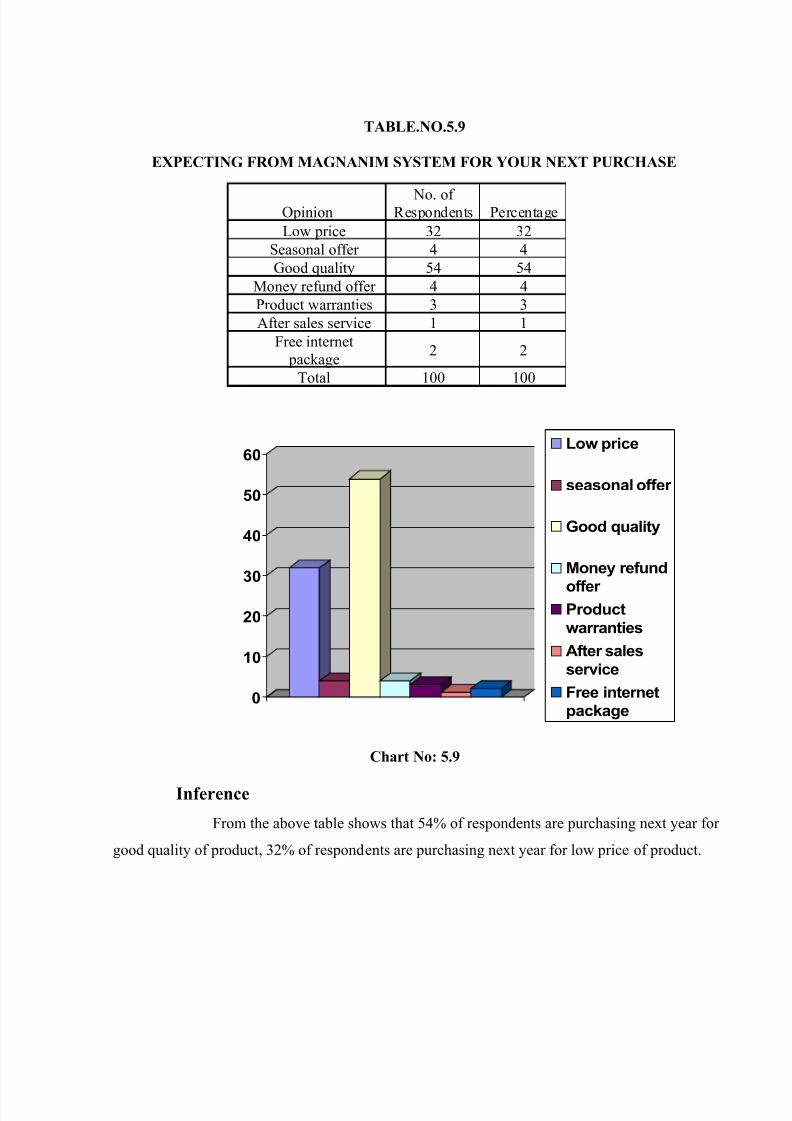
TABLE.NO.5.9
EXPECTING FROM MAGNANIM SYSTEM FOR YOUR NEXT PURCHASE
Opinion No. of
Respondents Percentage
Low price 32 32 Seasonal offer 4 4 Good quality 54 54 Money refund offer 4 4 Product warranties 3 3 After sales service 1 1 Free internet
package2 2
Total 100 100
0
10
20
30
40
50
60Low price
seasonal offer
Good quality
Money refund
offer Product
warranties
After sales
service
Free internet
package
Chart No: 5.9
Inference
From the above table shows that 54% of respondents are purchasing next year for
good quality of product, 32% of respondents are purchasing next year for low price of product.

8/6/2019 Project on Sales Promotion
http://slidepdf.com/reader/full/project-on-sales-promotion 34/59
TABLE.NO.5.10
FACTOR EXPECT MORE FROM MAGNANIM SYSTEM PRODUCT
Opinion No. of
Respondents Percentage
More quality with exiting
price5 5
More quality with low price 68 68 Exiting quality with low
price7 7
Good service with exiting
price16 16
Good service with low price4 4
Total 100 100
0
10
20
30
40
50
60
70Mre quality with
exiting price
More quality
with low price
Exiting qualitywith low price
Good service
with exiting
price
Good service
with low price
Chart No: 5.10
Inference
From the above table shows that 68% of respondents are like more quality with
low price, 16% of respondents are like good service with exiting price, 7% of respondents are
like Exiting quality with low price, 5% of respondents are like moe quality exiting price, 4% of
respondents are like good service with low price.

8/6/2019 Project on Sales Promotion
http://slidepdf.com/reader/full/project-on-sales-promotion 35/59
TABLE.NO.5.11
DIFFER FROM COMPETITONS FOR SALES PROMOTION
Opinion
No. of
Respondents Percentage
Coupans 2 2
Free internet package 1 1
Seasonal offer 3 3
Free software 2 2
Money refund offer 84 84
Product Warranties 8 8
Total 100 100
0
10
20
30
40
50
60
70
80
90Coupans
Free internet
package
Seasonal offer
Free software
Money refundoffer
Product
Warranties
Chart No: 5.11
InferenceFrom the above table shows that 84% of respondents are said only money
refund offer for differing from competitons, 8% of respondents are said only
product warrantiesr for differing from competitons

8/6/2019 Project on Sales Promotion
http://slidepdf.com/reader/full/project-on-sales-promotion 36/59
TABLE.NO.5.12
MESSAGE IS BEING RECEIVED FROM OUR ADVERTISING
Opinion No. of
Respondents Percentage
Good service 59 59
Good product 26 26
Discount 5 5
Product warranties 1 1
Seasonal offer 2 2
Free package 2 2
Coupans 1 1
Money refund offer 4 4
Total 100 100
0
10
20
30
40
50
60Good service
Good product
Discount
Product
warrantiesseasonal offer
Free package
Coupans
Money refundoffer
Chart No: 5.12
InferenceFrom the above table shows that 59% of respondents are said good service,
26% of respondents are said good product .
8/6/2019 Project on Sales Promotion
http://slidepdf.com/reader/full/project-on-sales-promotion 37/59
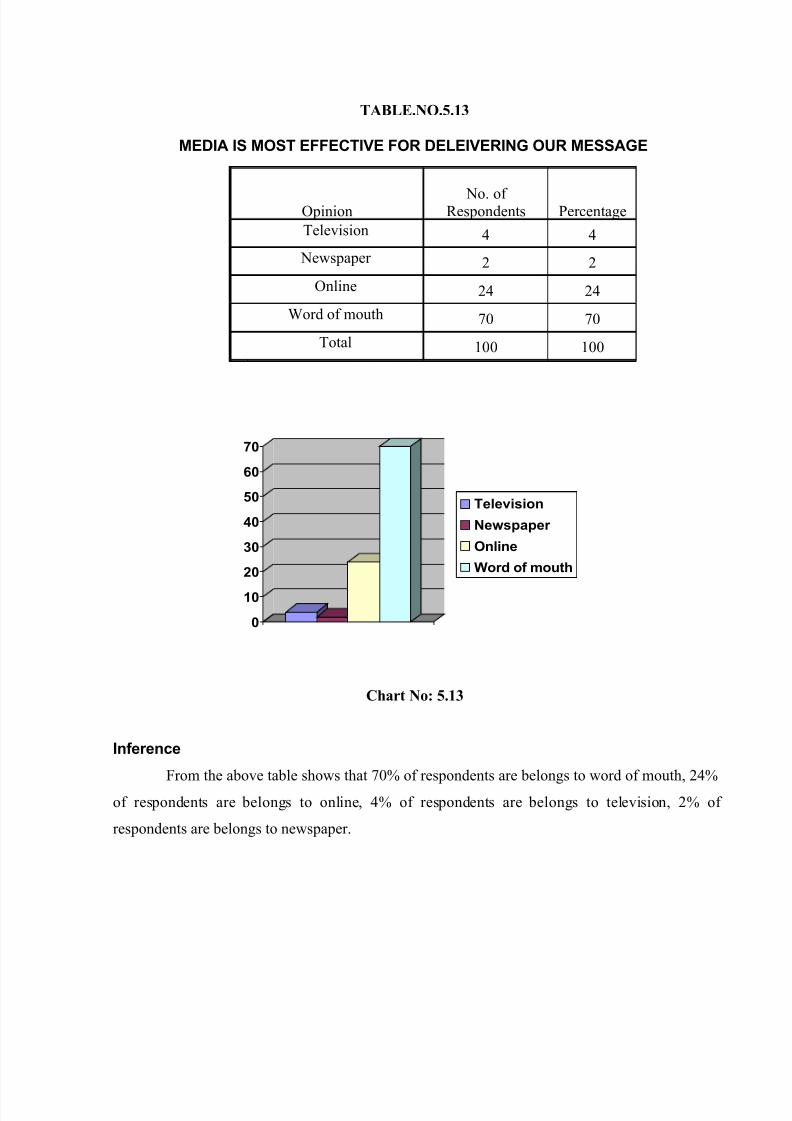
TABLE.NO.5.13
MEDIA IS MOST EFFECTIVE FOR DELEIVERING OUR MESSAGE
Opinion No. of
Respondents Percentage
Television 4 4
Newspaper 2 2
Online 24 24
Word of mouth 70 70
Total 100 100
0
10
20
30
40
50
60
70
Television
Newspaper
Online
Word of mouth
Chart No: 5.13
Inference
From the above table shows that 70% of respondents are belongs to word of mouth, 24%
of respondents are belongs to online, 4% of respondents are belongs to television, 2% of
respondents are belongs to newspaper.
8/6/2019 Project on Sales Promotion
http://slidepdf.com/reader/full/project-on-sales-promotion 38/59
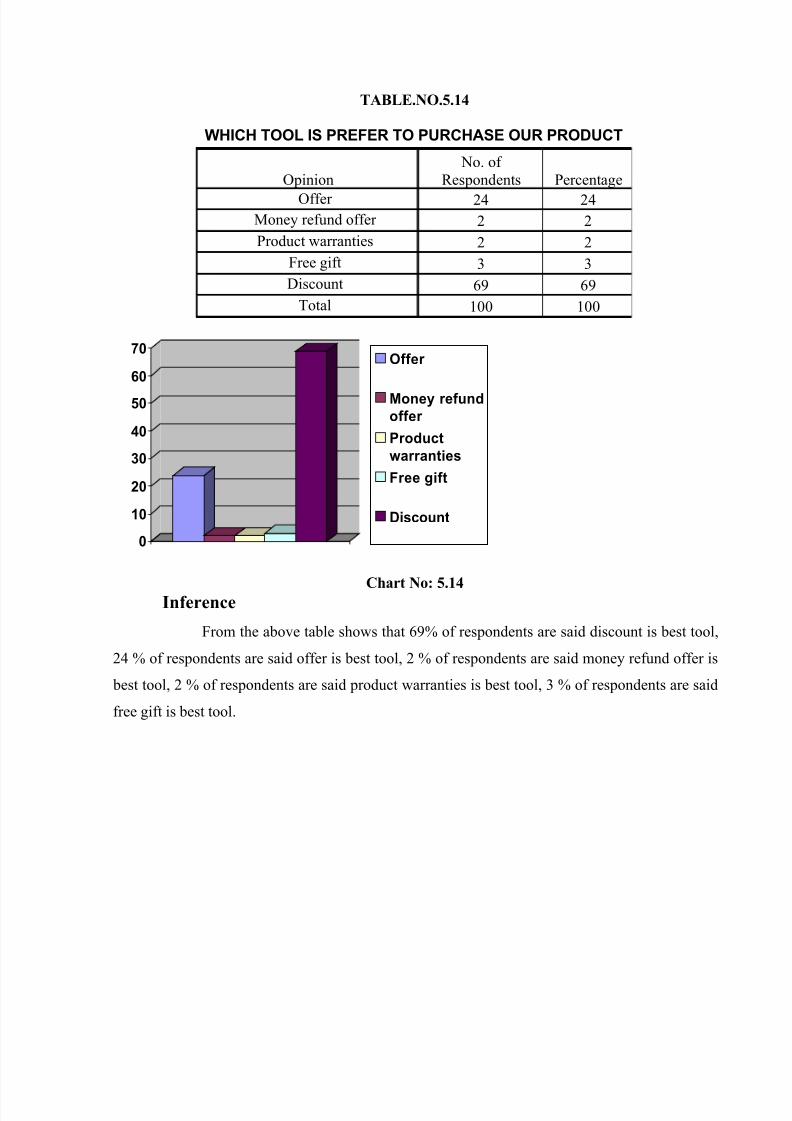
TABLE.NO.5.14
WHICH TOOL IS PREFER TO PURCHASE OUR PRODUCT
0
10
20
30
40
50
60
70Offer
Money refund
offer
Product
warranties
Free gift
Discount
Chart No: 5.14Inference
From the above table shows that 69% of respondents are said discount is best tool,
24 % of respondents are said offer is best tool, 2 % of respondents are said money refund offer is
best tool, 2 % of respondents are said product warranties is best tool, 3 % of respondents are said
free gift is best tool.
Opinion
No. of
Respondents Percentage
Offer 24 24 Money refund offer 2 2 Product warranties 2 2 Free gift 3 3 Discount 69 69 Total 100 100

8/6/2019 Project on Sales Promotion
http://slidepdf.com/reader/full/project-on-sales-promotion 39/59
TABLE.NO.5.15
Systems buy in one year
Opinion
No. of
Respondents Percentage
Below-10 93 93
10-40 3 3
40-80 1 1
80-100 3 3
Total 100 100
0
20
40
60
80
100
Below-10
Oct-40
40-80
80-100
Chart No: 5.15
Inference
From the above table shows that 93% of respondents are buy below – 10, 3% of
respondents are buy 10-40, 1% of respondents are buy 40-80, 3% of respondents are buy
80-100.

8/6/2019 Project on Sales Promotion
http://slidepdf.com/reader/full/project-on-sales-promotion 40/59
TABLE.NO.5.16
SYSTEMS REPLACE IN ONE YEAR
Opinion
No. of
Respondents Percentage
Below-10 92 92
10-40 3 3
40-80 2 2
80-100 3 3
Total 100 100
0
20
40
60
80
100
Below-10
Oct-40
40-80
80-100
Chart No: 5.16
Inference
From the above table shows that 92% of respondents are replace the product below – 10,
3% of respondents are replace the product 10-40, 2% of respondents are replace the product
40-80, 3% of respondents are replace the product 80-100.
8/6/2019 Project on Sales Promotion
http://slidepdf.com/reader/full/project-on-sales-promotion 41/59
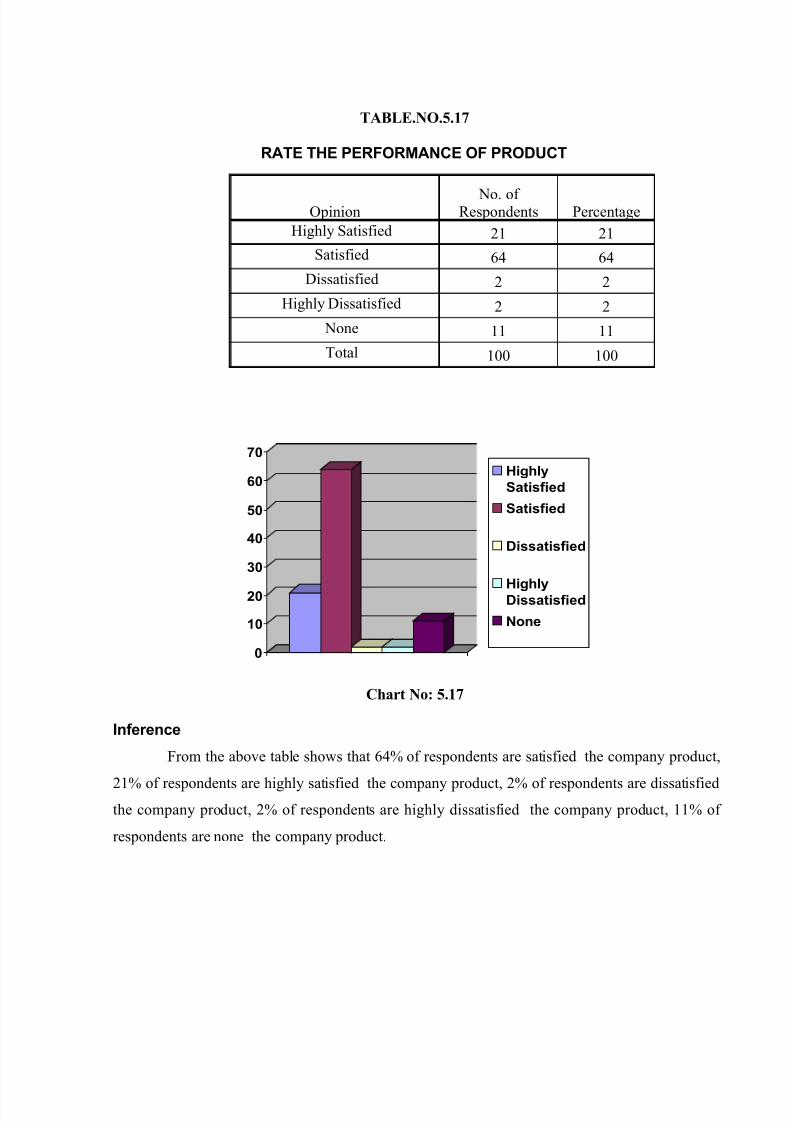
TABLE.NO.5.17
RATE THE PERFORMANCE OF PRODUCT
Opinion No. of
Respondents Percentage
Highly Satisfied 21 21 Satisfied 64 64
Dissatisfied 2 2
Highly Dissatisfied 2 2
None 11 11
Total 100 100
0
10
20
30
40
50
60
70
Highly
Satisfied
Satisfied
Dissatisfied
HighlyDissatisfied
None
Chart No: 5.17
Inference
From the above table shows that 64% of respondents are satisfied the company product,
21% of respondents are highly satisfied the company product, 2% of respondents are dissatisfied
the company product, 2% of respondents are highly dissatisfied the company product, 11% of
respondents are none the company product.
8/6/2019 Project on Sales Promotion
http://slidepdf.com/reader/full/project-on-sales-promotion 42/59
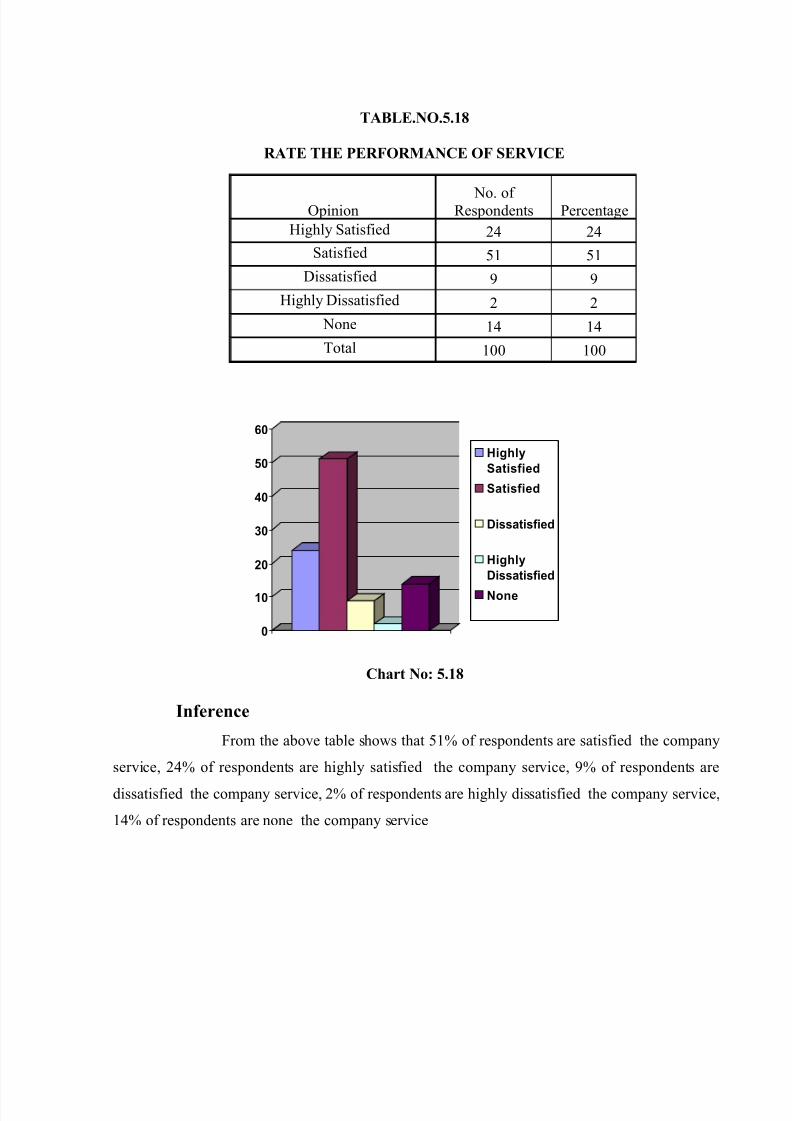
TABLE.NO.5.18
RATE THE PERFORMANCE OF SERVICE
Opinion No. of
Respondents Percentage
Highly Satisfied 24 24 Satisfied 51 51 Dissatisfied 9 9 Highly Dissatisfied 2 2 None 14 14 Total 100 100
0
10
20
30
40
50
60
Highly
Satisfied
Satisfied
Dissatisfied
Highly
Dissatisfied
None
Chart No: 5.18
Inference
From the above table shows that 51% of respondents are satisfied the company
service, 24% of respondents are highly satisfied the company service, 9% of respondents are
dissatisfied the company service, 2% of respondents are highly dissatisfied the company service,
14% of respondents are none the company service

8/6/2019 Project on Sales Promotion
http://slidepdf.com/reader/full/project-on-sales-promotion 43/59
TABLE.NO.5.19
RATE THE PERFORMANCE OF QUALITY
Opinion
No. of
Respondents Percentage
Highly Satisfied 23 23 Satisfied 62 62 Dissatisfied 2 2 Highly Dissatisfied 2 2 None 11 11 Total 100 100
0
10
20
30
40
50
60
70
Highly Satisfied
Satisfied
Dissatisfied
Highly
Dissatisfied
None
Chart No: 5.19
Inference From the above table shows that 62% of respondents are satisfied the company
quality, 23% of respondents are highlysatisfied the company quality, 2% of respondents are
dissatisfied the company quality, 2% of respondents are highlydissatisfied the company quality,
11% of respondents are none the company quality.

8/6/2019 Project on Sales Promotion
http://slidepdf.com/reader/full/project-on-sales-promotion 44/59
TABLE.NO.5.20
RATE THE PERFORMANCE OF PRICE
Opinion
No. of
Respondents PercentageHighly Satisfied 18 18
Satisfied 66 66
Dissatisfied 1 1
Highly Dissatisfied 4 4
None 11 11
Total 100 100
0
10
20
30
40
50
60
70
Highly Satisfied
Satisfied
Dissatisfied
Highly
DissatisfiedNone
Chart No: 5.20
Inference
From the above table shows that 66% of respondents are satisfied the company price,
18% of respondents are highlysatisfied the company price, 1% of respondents are dissatisfied
the company price, 4% of respondents are highlydissatisfied the company price, 11% of
respondents are none the company price.

8/6/2019 Project on Sales Promotion
http://slidepdf.com/reader/full/project-on-sales-promotion 45/59
TABLE.NO.5.21
RATE THE PERFORMANCE OF RELIABILITY
Opinion
No. of
Respondents PercentageHighly satisfied 15 15
Satisfied 71 71
Dissatisfied 2 2
Highly Dissatisfied 2 2
None 10 10
Total 100 100
0
10
20
30
40
50
60
70
80Highly satisfied
Satisfied
Dissatisfied
Highly
Dissatisfied
None
Chart No: 5.21
Inference
From the above table shows that 71% of respondents are satisfied the company
reliability, 15% of respondents are highlysatisfied the company reliability, 2% of respondents are
dissatisfied the company reliability, 2% of respondents are highlydissatisfied the company
reliability, 10% of respondents are none the company reliability.
8/6/2019 Project on Sales Promotion
http://slidepdf.com/reader/full/project-on-sales-promotion 46/59
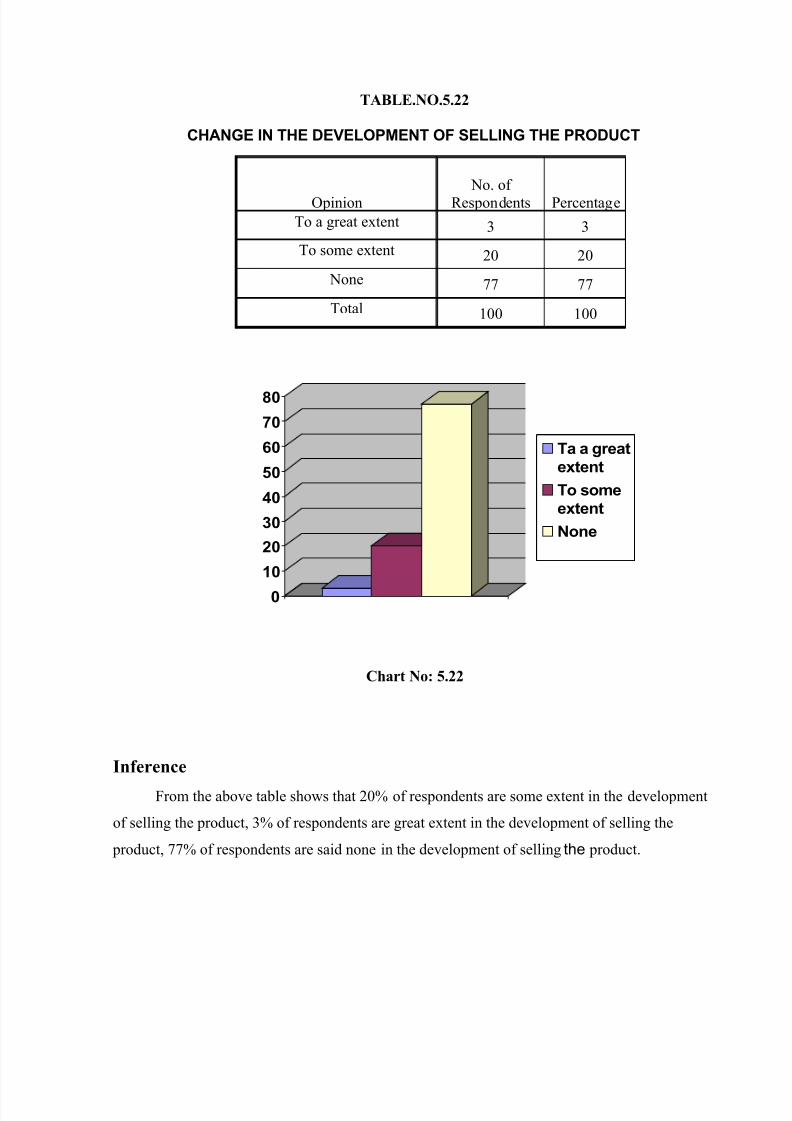
TABLE.NO.5.22
CHANGE IN THE DEVELOPMENT OF SELLING THE PRODUCT
Opinion
No. of
Respondents Percentage
To a great extent 3 3
To some extent 20 20
None 77 77
Total 100 100
0
10
20
30
40
50
60
70
80
Ta a great
extent
To some
extent
None
Chart No: 5.22
Inference
From the above table shows that 20% of respondents are some extent in the development
of selling the product, 3% of respondents are great extent in the development of selling the
product, 77% of respondents are said none in the development of selling the product.

8/6/2019 Project on Sales Promotion
http://slidepdf.com/reader/full/project-on-sales-promotion 47/59
TABLE.NO.5.23
DESIRABLE QUALITIES THAT WE LACK
Opinion No. of Respondents Percentage
Yes 2 2
No 98 98
Total 100 100
0
20
40
60
80
100
Yes
No
Chart No: 5.23
Inference
From the above table shows that 98% of respondents are said no for desirable
qualities that we lack, 2% of respondents are said yes desirable qualities that we
lack.
8/6/2019 Project on Sales Promotion
http://slidepdf.com/reader/full/project-on-sales-promotion 48/59
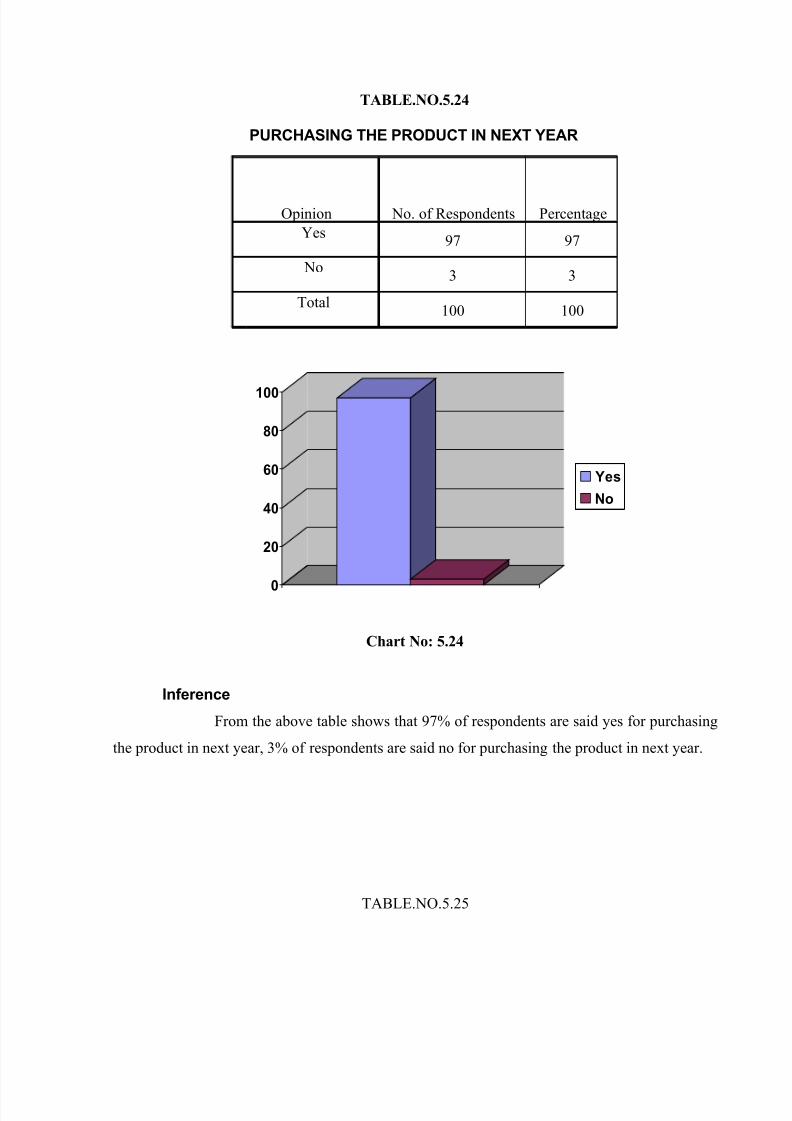
TABLE.NO.5.24
PURCHASING THE PRODUCT IN NEXT YEAR
Opinion No. of Respondents Percentage
Yes97 97
No3 3
Total100 100
0
20
40
60
80
100
Yes
No
Chart No: 5.24
Inference
From the above table shows that 97% of respondents are said yes for purchasing
the product in next year, 3% of respondents are said no for purchasing the product in next year.
TABLE.NO.5.25
8/6/2019 Project on Sales Promotion
http://slidepdf.com/reader/full/project-on-sales-promotion 49/59
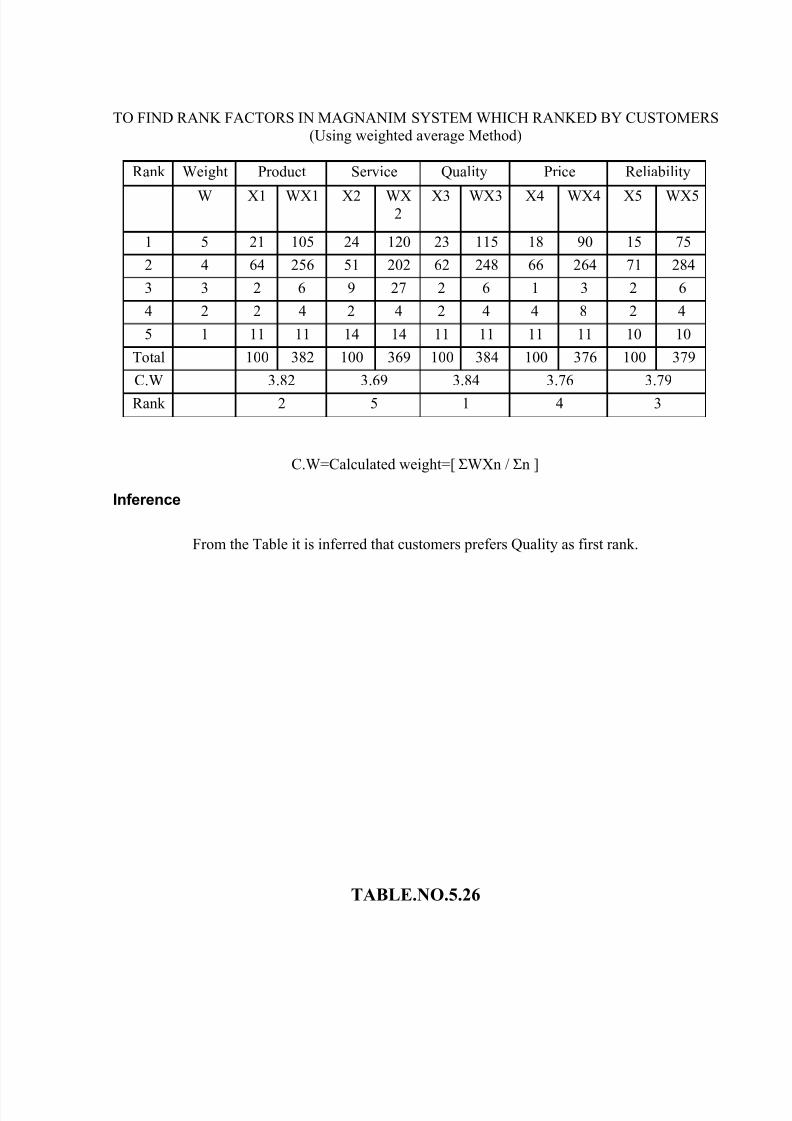
TO FIND RANK FACTORS IN MAGNANIM SYSTEM WHICH RANKED BY CUSTOMERS(Using weighted average Method)
Rank Weight Product Service Quality Price Reliability
W X1 WX1 X2 WX2
X3 WX3 X4 WX4 X5 WX5
1 5 21 105 24 120 23 115 18 90 15 75
2 4 64 256 51 202 62 248 66 264 71 284
3 3 2 6 9 27 2 6 1 3 2 6
4 2 2 4 2 4 2 4 4 8 2 4
5 1 11 11 14 14 11 11 11 11 10 10
Total 100 382 100 369 100 384 100 376 100 379
C.W 3.82 3.69 3.84 3.76 3.79
Rank 2 5 1 4 3
C.W=Calculated weight=[ ΣWXn / Σn ]
Inference
From the Table it is inferred that customers prefers Quality as first rank.
TABLE.NO.5.26

8/6/2019 Project on Sales Promotion
http://slidepdf.com/reader/full/project-on-sales-promotion 50/59
OCCUPATION OF THE RESPONDENTS * PURCHASING TYPE OF PRODUCT
PURCHASING TYPE OF PRODUCT Total
Branded
system
Assembled
system Printer
OCCUPATION
OF THE
RESPONDENTS
Student 3 20 5 28
professional 6 9 2 17
self
employeed7 23 2 32
house wife 5 6 1 12
governmentstaff
0 9 2 11
Total 27 67 12 100
H0 : Occupation of the respondent is independent Purchasing type of products.
Chi- Square Tests
INTERPRETATION:
From the above analysis, the chi-square values 11.57 and asymptotic significant value is
above 0.05. Hence, there is no evidence to reject the null hypothesis. Thus we conclude that
Occupation of the respondent is independent Purchasing type of products.
Value df Asymp. Sig. (2-sided)
Pearson Chi-Square 11.57 8 .171
8/6/2019 Project on Sales Promotion
http://slidepdf.com/reader/full/project-on-sales-promotion 51/59
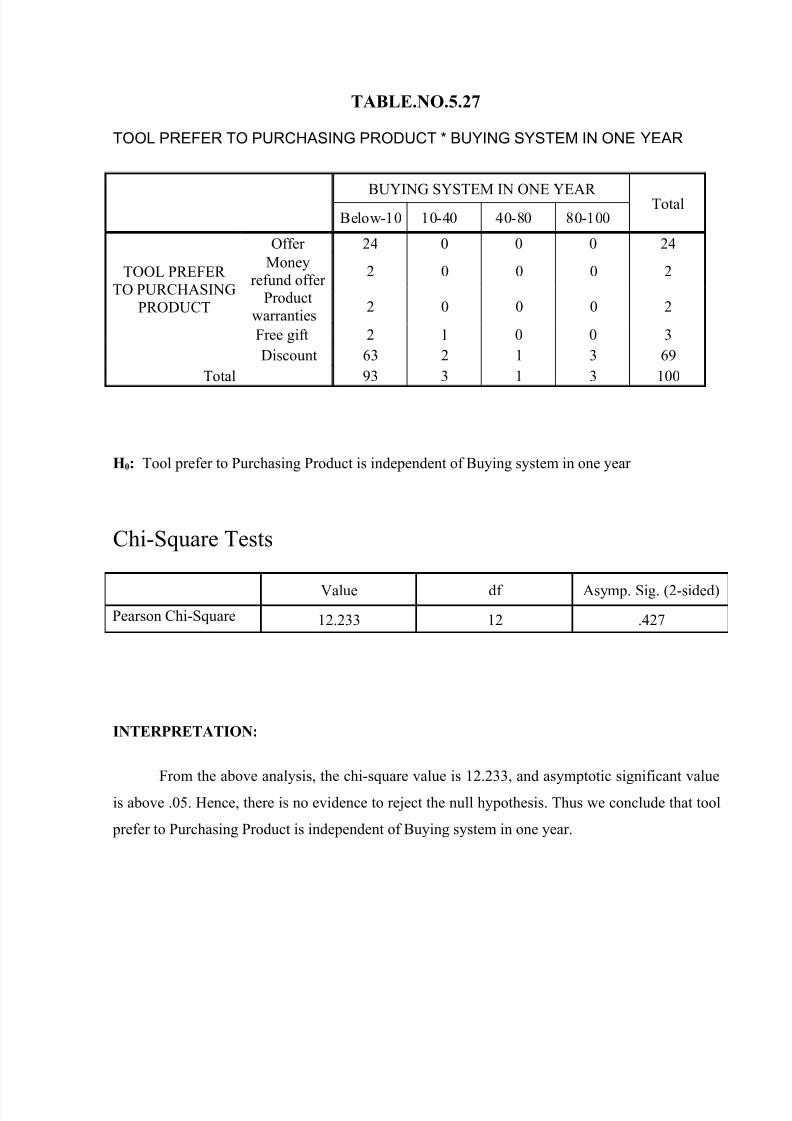
TABLE.NO.5.27
TOOL PREFER TO PURCHASING PRODUCT * BUYING SYSTEM IN ONE YEAR
BUYING SYSTEM IN ONE YEAR Below-10 10-40 40-80 80-100
Total
TOOL PREFER
TO PURCHASING
PRODUCT
Offer 24 0 0 0 24
Money
refund offer 2 0 0 0 2
Product
warranties2 0 0 0 2
Free gift 2 1 0 0 3
Discount 63 2 1 3 69
Total 93 3 1 3 100
H0: Tool prefer to Purchasing Product is independent of Buying system in one year
Chi-Square Tests
INTERPRETATION:
From the above analysis, the chi-square value is 12.233, and asymptotic significant value
is above .05. Hence, there is no evidence to reject the null hypothesis. Thus we conclude that tool
prefer to Purchasing Product is independent of Buying system in one year.
Value df Asymp. Sig. (2-sided)
Pearson Chi-Square 12.233 12 .427

8/6/2019 Project on Sales Promotion
http://slidepdf.com/reader/full/project-on-sales-promotion 52/59
CHAPTER 6
FINDINGS OF THE STUDY
Most of the customers are students and self employed persons were purchased the product.
Most of the respondents taken are female 16%, and male 84%.
Most of the customers (67%)were prefer assembled system is best for using.
Most of the public doesn’t know about the products marketed by the Magnanim
systems.
It is found that 83% of the respondents came to know about Magnanim systems
product through friends & relatives and advertisements. None of them
had found Magnanim systems through Magazine and Newspaper.
Most of the customers(49) were chose magnanim systems product for immediate
response.
54% of the customers are satisfied with the overall satisfaction of Magnanim systems
products and also to purchase next year.
Most of respondents are expected more quality with low price of the product.
84% of customers are money refund offer is best one to differ from the competator
and also to increase the sales.
Most of the customers(93%) are purchasing the product below – 10 only.
It is found that customers are satisfied with quality,good product, price and not
satisfied with the service of the Magnanim systems products.

8/6/2019 Project on Sales Promotion
http://slidepdf.com/reader/full/project-on-sales-promotion 53/59
SUGGESTIONS AND RECOMMENDATIONS
Based upon the finds the following suggestions is made
The customers are given more weightage to the assembled system . so the company can
improve the sales in assembled system.
Most of the customers are like more quality with low price. So the company can increase
the quality and reduce the price of the product.
Maximum number of customers are discount is the best tool to differ with competitor. So
the company can utilize this tool and meet the competitor.
Most of the customers are feeling that to increase the after sale service. So the company
may take necessary actions for the sale service and to satisfied the customers.
Most of the customers were chose the magnanim systems product for immediate
response. So the company can give importance for customer call.
8/6/2019 Project on Sales Promotion
http://slidepdf.com/reader/full/project-on-sales-promotion 54/59
CHAPTER 7
CONCLUSIONS
The study on sales promotion in magnanim systems pvt., Ltd., is study with care and
special effects have been taken to make the study as specific as possible. The methodologytypical proof to show that the study is sceintific.
From the study, it is clear that most of the customers are satisfied with there product, price
and quality. This study is also cearly states that the customers are expecting to improve their
service. So the company can take an action to improve the service. The customers are giving
more important for more quality with price of the product. A good quality of service create
weightage of the concern.

8/6/2019 Project on Sales Promotion
http://slidepdf.com/reader/full/project-on-sales-promotion 55/59
CHAPTER-8
LIMITATIONS OF THE STUDY
Due to shortage of time we did not meet more number of customers.
Since time duration is short it was not possible for conduct elaborate study.
Some false information may be given by the customers regarding their expectations.
8/6/2019 Project on Sales Promotion
http://slidepdf.com/reader/full/project-on-sales-promotion 56/59
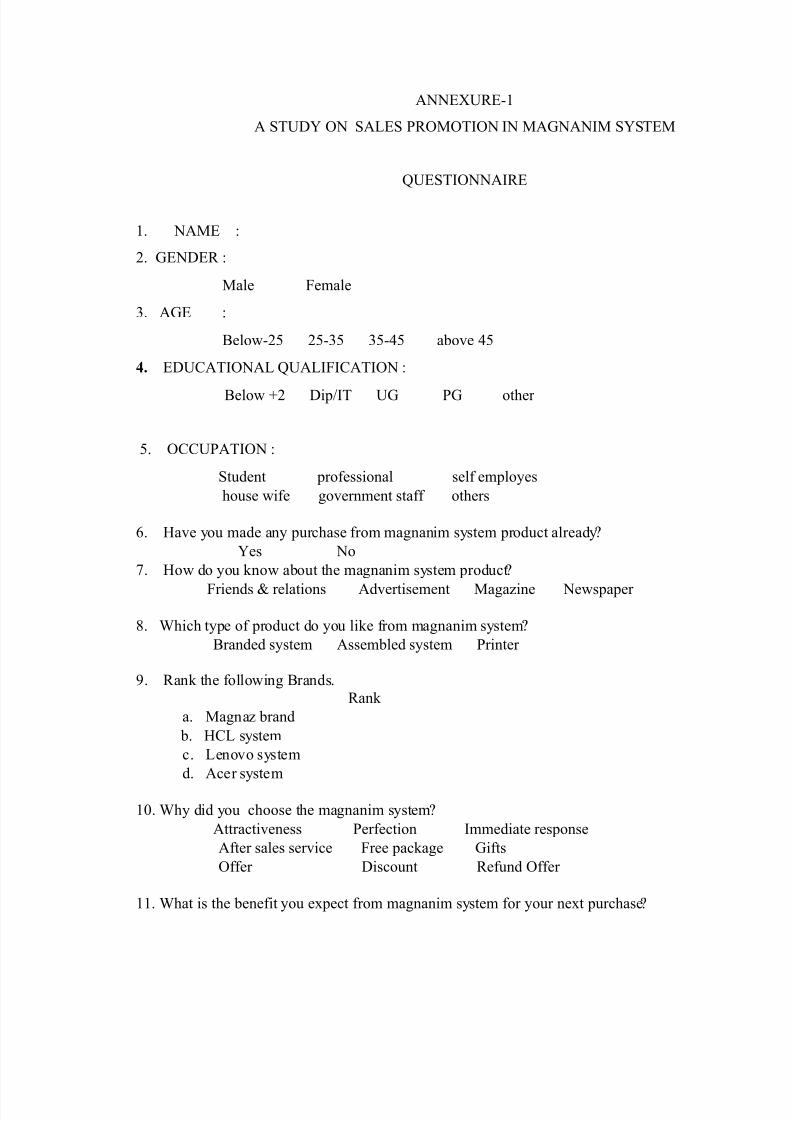
ANNEXURE-1
A STUDY ON SALES PROMOTION IN MAGNANIM SYSTEM
QUESTIONNAIRE
1. NAME :
2. GENDER :
Male Female
3. AGE :
Below-25 25-35 35-45 above 45
4. EDUCATIONAL QUALIFICATION :
Below +2 Dip/IT UG PG other
5. OCCUPATION :
Student professional self employes
house wife government staff others
6. Have you made any purchase from magnanim system product already?
Yes No
7. How do you know about the magnanim system product?
Friends & relations Advertisement Magazine Newspaper
8. Which type of product do you like from magnanim system?
Branded system Assembled system Printer
9. Rank the following Brands.
Rank
a. Magnaz brand
b. HCL system
c. Lenovo system
d. Acer system
10. Why did you choose the magnanim system?
Attractiveness Perfection Immediate response
After sales service Free package Gifts
Offer Discount Refund Offer
11. What is the benefit you expect from magnanim system for your next purchase?
8/6/2019 Project on Sales Promotion
http://slidepdf.com/reader/full/project-on-sales-promotion 57/59
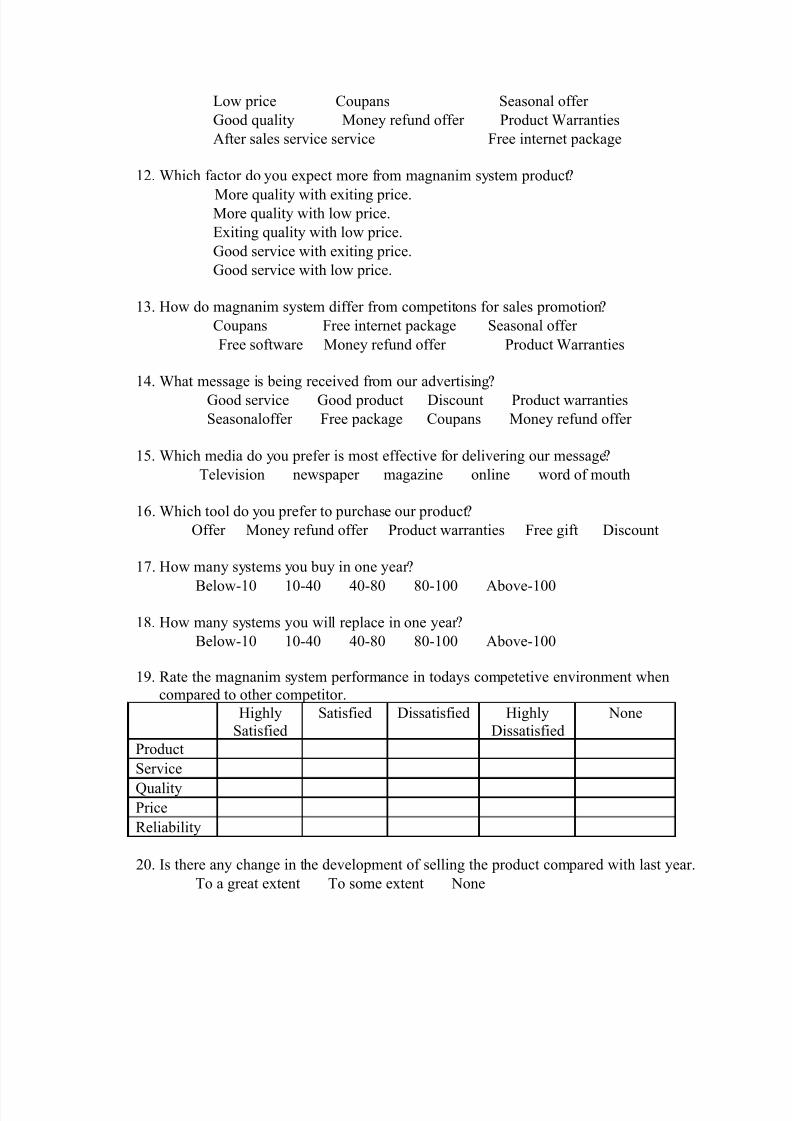
Low price Coupans Seasonal offer
Good quality Money refund offer Product Warranties
After sales service service Free internet package
12. Which factor do you expect more from magnanim system product?
More quality with exiting price. More quality with low price.
Exiting quality with low price.
Good service with exiting price.
Good service with low price.
13. How do magnanim system differ from competitons for sales promotion?
Coupans Free internet package Seasonal offer
Free software Money refund offer Product Warranties
14. What message is being received from our advertising?
Good service Good product Discount Product warranties
Seasonaloffer Free package Coupans Money refund offer
15. Which media do you prefer is most effective for delivering our message?
Television newspaper magazine online word of mouth
16. Which tool do you prefer to purchase our product?
Offer Money refund offer Product warranties Free gift Discount
17. How many systems you buy in one year ?
Below-10 10-40 40-80 80-100 Above-100
18. How many systems you will replace in one year ?
Below-10 10-40 40-80 80-100 Above-100
19. Rate the magnanim system performance in todays competetive environment when
compared to other competitor.
Highly
Satisfied
Satisfied Dissatisfied Highly
Dissatisfied
None
Product
Service
Quality
Price
Reliability
20. Is there any change in the development of selling the product compared with last year.
To a great extent To some extent None

8/6/2019 Project on Sales Promotion
http://slidepdf.com/reader/full/project-on-sales-promotion 58/59
21. Are there any desirable qualities that a competitor have, that we lack.
Yes
NoIf yes, give suggestion--------------------------------------------------------
--------------------------------------------------------
22. Would you like to purchase magnanim system product in next year.
Yes No
If No, mention the reason---------------------------------------------------
---------------------------------------------------
23. Any suggestion---------------------------------------------------------------------
---------------------------------------------------------------------
8/6/2019 Project on Sales Promotion
http://slidepdf.com/reader/full/project-on-sales-promotion 59/59
ANNEXURE -2
BIBLIOGRAPHY
Marketing Management – Philip Kotler.
Principle of management - Philip Kotler.
Kothari C.R., Research methodology, Tata Mc Graw-Hill Publishing
Company Ltd., 1982.
WEBSITES:-
www.google.com
www.magnanimsystems.com