professional development needs assessment...
TRANSCRIPT

Professional Development Needs Assessment Descriptive Summary
Flagstaff Unified School District #1
Linda S. Neff and Mary L. Nebel Coconino County Schools Education Services
Arizona Regional Math and Science Support Center
Cecilia Owen Coconino County Superintendent of Schools
110 E. Cherry Ave. Flagstaff, AZ 86001
982-226-5632
February 12, 2004

Table of Contents General Background .............................................................................................3 NCLB: Highly Qualified Teachers (Credit/Course Needs)....................................4 Staff Development Information .............................................................................5 Teaching and Assessment of Academic Standards..............................................7 Instructional Strategies .........................................................................................7 Classroom Management.......................................................................................7 K-3 Reading Instruction ........................................................................................8 Communication and Collaboration ........................................................................8 School Climate for Learning..................................................................................8 Technology Information/Integration.......................................................................8 Teacher Survey Results........................................................................................9 AIMS Summary by Content Area and Concept...................................................19 References .........................................................................................................21
2

A Survey of Teachers’ Needs and Perceptions Items in this survey reflect current research on teaching practices that have a positive effect on student achievement. In addition to needs indicated by student achievement data, this survey will be used to determine staff development needs of K-12 educators in your school, district and throughout Coconino County. The survey will assist in the development of a comprehensive Professional Development Plan and guide these organizations in providing meaningful professional growth experiences for all county educators (See References).
General Background A total of 308 individuals from Flagstaff Unified School District participated in the online Teacher Needs and Perceptions Survey (see Table 1). Participation was open to all certified staff and voluntary. The rate of participation varies greatly from one school site to another.
School Site Frequency
Rate Consolidated School 1 8 % Maine Consolidated School 12 92 % 3- 5 39 % 6- 1 8 % OTHER 2 15 % K-6 Music/Spanish 1 8 %
Table 1. Schools Represented in the Survey Of the sample total, 13% are high school teachers, 13% middle school teachers, 71% elementary school teachers, and 3% other school staff and administrators. The other school participants included an Adult Education Instructor, K-3 Emotional Disabilities Instructor, K-6 Counselor, Library Media Specialist, and a principal. Principals completed a separate survey.
Frequency Percent Valid Percent Cumulative
Percent 5 39 39 39 > 21 YEARS 1 8 8 46 11- 15 YEARS 3 23 23 70 3 OR FEWER YEARS 2 15 15 84
4 - 10 YEARS 2 15 15 100.0
Valid
Total 13 100.0 100.0
Table 2. Years of Service
3

Over 27% of the respondents had taught 21 years or more, 15% had 16 – 20 years of service, 15% had 11 – 15 years, 23% had 4 – 10 years, 7% had 3 or fewer years of service, and 13% left this question blank (see Table 2).
NCLB: Highly Qualified Teachers (Credit/Course Needs) Participants used the Arizona Highly Qualified Teacher affidavit and rubric to determine their status. Ninety six percent of the teachers who participated in the survey were deemed Highly Qualified with only 4% Unqualified. For the teachers not rated as Highly Qualified, eight (2.6%) were lacking in Years of Experience, five (1.6%) were lacking in college coursework in their content area, five (1.6%) did not have enough professional development and activities related to the Content area, and eight (2.6%) were lacking awards, presentations, and publications related to their content area. Three individuals (1%) were lacking in service related to their content area. Responses are highlighted below. 6. I meet the “Highly Qualified” definition according to my answers to questions 1 – 3D 84.6% Yes (11) 15.4% No (2) 7a. If you do not meet the criteria, please answer the two questions below. I have earned the following points toward being rated as a Highly Qualified Teacher. 97.1% 0 – 25 points (299) 1.3% 26 – 50 points (4) .6% 51 – 75 points (2) .6% 76 – 99 points (2) .3% >= 100 points (1) 7b. If your score is < 100 points, please check off the categories in the areas you are lacking. 13 - Yes Years of Experience Teaching in Content Area 13 - Yes College Coursework in Content Area 13 - Yes Professional Development and Activities Related to Content Area 13 - Yes Service related to Content Area 13 - Yes Awards, Presentations, and Publications related to content area.
4

Staff Development Information Time Format 8. How would you like the staff development sessions to be offered? Please check all that apply. 15.4% 1-2 hour(s) 69.2% Half-day 30.8% Full-day * % Yes
9. How would you like the staff development sessions to be offered? Please check all that apply. 7.7% Weekly sessions 23.1% Monthly sessions 61.5% Quarterly sessions 15.4% Study groups * % Yes
When Where 10. When would you like staff development sessions to be offered? Please check all that apply. 69.2% During school 30.8% After school (4-6 P.M.) 7.7% Early evenings (6-8 P.M.) 100% Weekends 23.1% During the summer * % Yes
11. Where would you like staff development sessions to be held? Please check all that apply. 84.6% Local School Site 23.1% Regional Training Site 30.8% On line, with local support 15.4% Independent On-line * % Yes
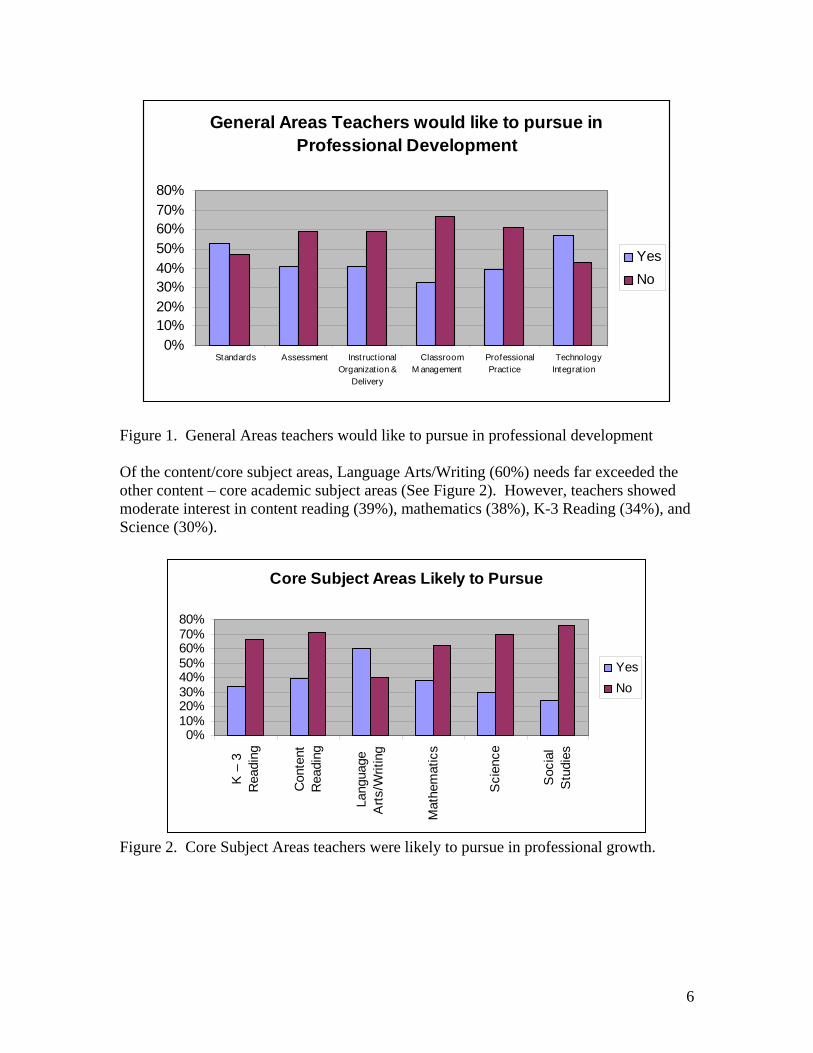
Content – Instructional Strategies Content – Core Academic Subject 12. Please select all the general areas you will likely pursue in your professional growth during the upcoming year. 38.5% Standards 30.8% Assessment 53.8% Instructional Organization & Delivery 23.1% Classroom Management 46.2% Professional Practice 38.5% Technology Integration
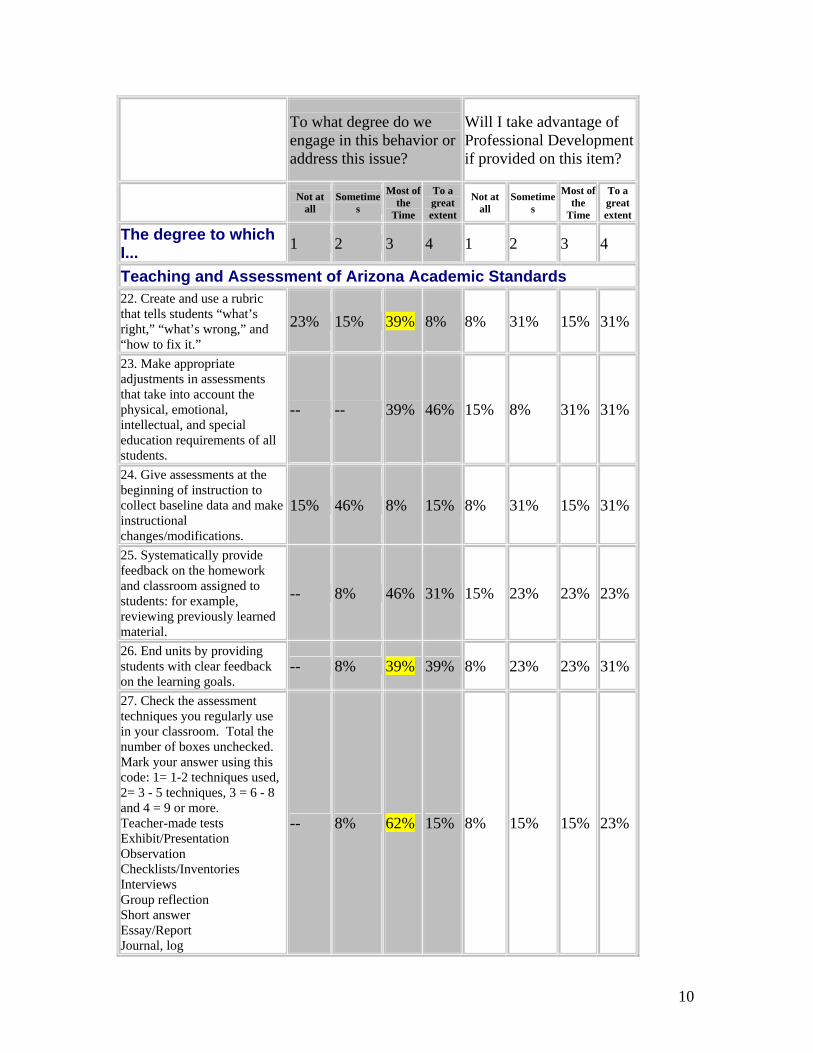
13. Please select all the core subject content areas you will likely pursue in your professional growth during the upcoming year. 38.5% K – 3 Reading 30.8% Content Reading 61.5% Language Arts/Writing 38.5% Mathematics 23.1% Science 15.4% Social Studies
The professional development categories reflecting the greatest interest are standards and technology integration. Teachers expressed less interest in professional growth in assessment, instructional organization and delivery. Professional practice and classroom management were the least requested categories. (see Figure 1).
5
General Areas Teachers would like to pursue in Professional Development
0%10%20%30%40%50%60%70%80%
Standards Assessment Instruct ionalOrganizat ion &
Delivery
ClassroomM anagement
ProfessionalPract ice
TechnologyIntegrat ion
YesNo
Figure 1. General Areas teachers would like to pursue in professional development Of the content/core subject areas, Language Arts/Writing (60%) needs far exceeded the other content – core academic subject areas (See Figure 2). However, teachers showed moderate interest in content reading (39%), mathematics (38%), K-3 Reading (34%), and Science (30%).
Core Subject Areas Likely to Pursue
0%10%20%30%40%50%60%70%80%
K –
3R
eadi
ng
Con
tent
Rea
ding
Lang
uage
Arts
/Writ
ing
Mat
hem
atic
s
Sci
ence
Soc
ial
Stu
dies
YesNo
Figure 2. Core Subject Areas teachers were likely to pursue in professional growth.
6

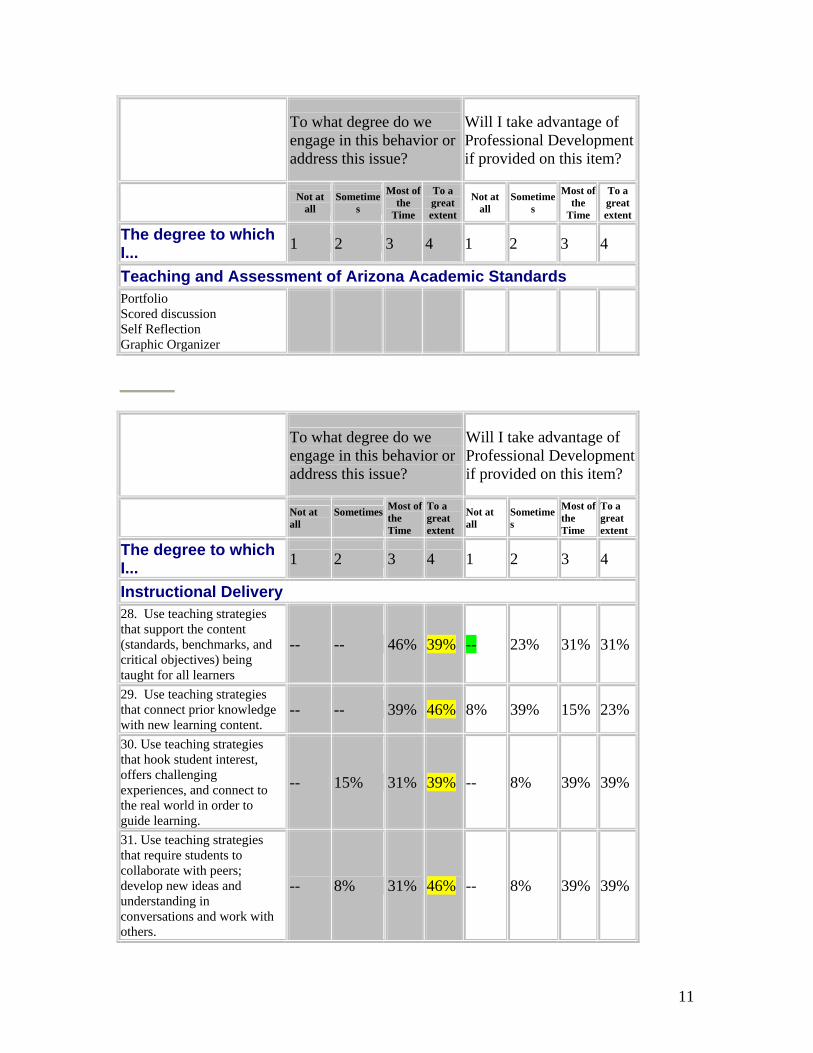
Teaching and Assessment of Academic Standards Teachers report using the majority of practices detailed in this section “most of the time” and “to a great extent.” However, teachers did not typically begin instructional units by asking students to identify personal learning goals and by involving students in choosing tasks and developing assessments. Twenty nine percent of the time, teachers did not create and use a rubric that tells students “what’s right,” “what’s wrong,” and “how to fix it.” And often, 37% of the time, teachers did not report making appropriate adjustments in assessments that take into account the physical, emotional, intellectual, and special education requirements of all students. Expressed interest in pursuing professional development in these practices was most common for the following items:
17. Teach the standards in an organized and sequenced way so that students have the opportunity to learn the standards-based content. 19. Use an assessment system to evaluate student mastery of content standards and performance objectives. 20. Use a curriculum map or framework to connect content, assessments, teaching strategies and student learning goals. 22. Create and use a rubric that tells students “what’s right,” “what’s wrong,” and “how to fix it.”
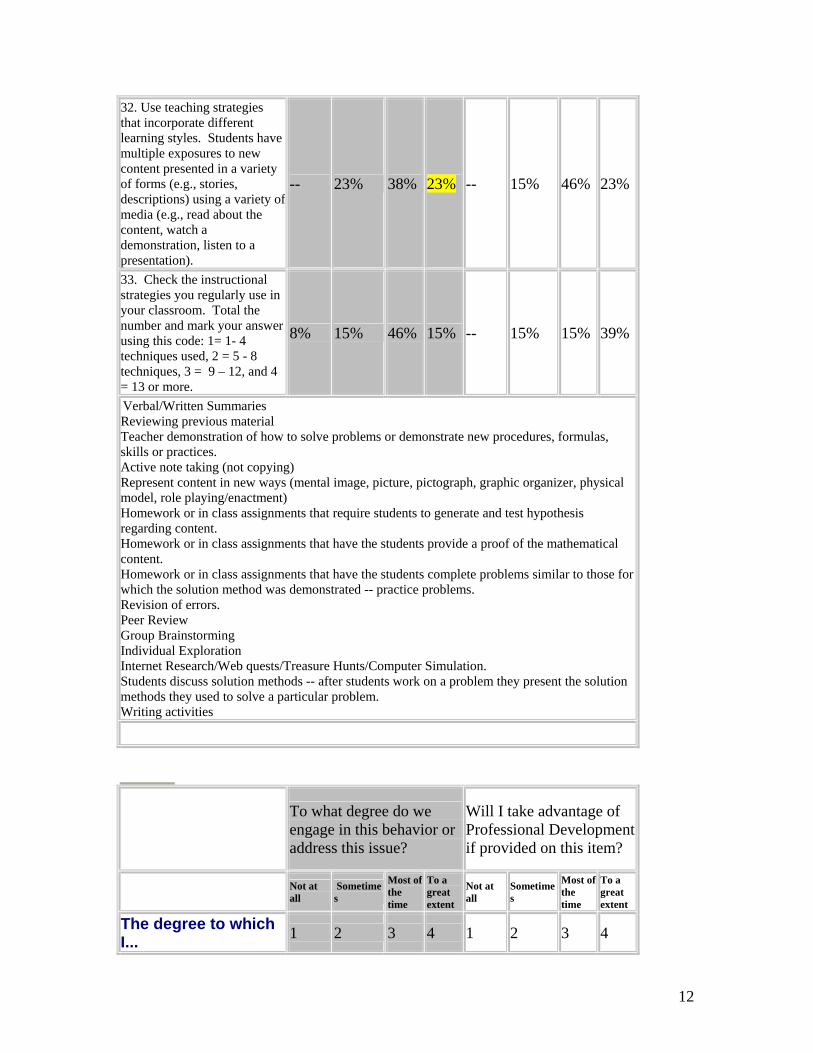
Instructional Strategies Survey participants reflect a high degree of expertise and confidence in their implementation of instructional strategies and did not request training in most of the items in this section. However, participants were interested in taking professional development in the area using teaching strategies that hook student interest, offering challenging experiences, and connecting to the real world in order to guide learning.
Classroom Management Participants report using a variety of different classroom management strategies to a great extent and did not request professional development in this area. Participants are interested in learning more team building skills to effectively teach students how to work cooperatively versus independently. There is a disparity in the report of teachers utilizing a key strategy in cooperative learning, assigning roles to students to help them manage the learning process (e.g., leader, recorder, reporter, data collector, monitor, presenter, proof reader). Thirty-three percent of the time teachers did not do this, but few requested training in using this strategy identified as critical to effectively manage technology integration.
7

K-3 Reading Instruction For the most part, the survey participants report utilizing the elements of effective K-3 reading instruction and did not request Professional Development in these areas. These data represent 137 survey participants – seventy four K-3 teachers, thirty two 3 – 6 teachers, and thirty-one other teachers (Special Education teachers, librarian, principal, K-3 emotional disabilities teacher, mixed grades teachers, and reading specialists).
Communication and Collaboration Survey participants felt they communicated and collaborated with families, students, staff, and the professional community most of the time and to a great extent. In addition, they felt they managed their time well. Most of the participants rated the items as a low priority for training.
School Climate for Learning Based on the number of survey questions, the survey participants felt their schools engaged in the followings effective school practices most of the time and to a great extent. The majority of teachers did not see that their school consistently provided training and assistance to parents to enhance their skills in supporting their child. However, survey participants did not express interest in taking professional development in this area. This disparity may be the result of focused teaching responsibilities. Comparing data from the administrative survey to the teacher survey results might reveal a significant difference in perceptions.
Technology Information/Integration A majority of the survey participants have access to a computer in their classrooms and/or in other computer learning environments. Fifty-nine percent of the survey participants enjoy using technology in their classroom most of the time or to a great extent. However, a majority of the survey participants do not report practicing effective technology integration strategies in their teaching practice. Participant response was divided in expressed interest in pursuing professional development in the different strategies of technology integration.
8

Teacher Survey Results
To what degree do we engage in this behavior or address this issue?
Will I take advantage of Professional Development if provided on this item?
Not at all
Sometimes
Most of the
Time
To a great extent
Not at all
Sometimes
Most of the
Time
To a great extent
The degree to which I... 1 2 3 4 1 2 3 4
Teaching and Assessment of Arizona Academic Standards 14. Begin instructional units by asking students to identify personal learning goals and by involving students in choosing tasks and developing assessments.
-- 39% 31% 15% 8% 23% 31% 23%
15. Begin instructional units presenting students with clear learning goals.
-- 8% 39% 39% 8% 15% 46% 15%
16. Know the content standards and performance objectives in my content area which I am responsible to teach.
-- 8% 23% 54% -- 23% 31% 31%
17. Teach the standards in an organized and sequenced way so that students have the opportunity to learn the standards-based content.
-- -- 54% 31% 8% 23% 15% 39%
18. Write instructional goals that are specific, measurable, and that can be completed in a set time frame.
-- 15% 39% 31% 15% 23% 23% 23%
19. Use an assessment system to evaluate student mastery of content standards and performance objectives.
-- 15% 54% 15% -- 23% 23% 39%
20. Use a curriculum map or framework to connect content, assessments, teaching strategies and student learning goals.
8% 39% 15% 8% -- 31% 39% 15%
21. Am familiar with the articulated grade-level reading and mathematics standards adopted in 2003.
8% 15% 46% 15% 15% 31% 8% 31%
9
To what degree do we engage in this behavior or address this issue?
Will I take advantage of Professional Development if provided on this item?
Not at all
Sometimes
Most of the
Time
To a great extent
Not at all
Sometimes
Most of the
Time
To a great extent
The degree to which I... 1 2 3 4 1 2 3 4
Teaching and Assessment of Arizona Academic Standards 22. Create and use a rubric that tells students “what’s right,” “what’s wrong,” and “how to fix it.”
23% 15% 39% 8% 8% 31% 15% 31%
23. Make appropriate adjustments in assessments that take into account the physical, emotional, intellectual, and special education requirements of all students.
-- -- 39% 46% 15% 8% 31% 31%
24. Give assessments at the beginning of instruction to collect baseline data and make instructional changes/modifications.
15% 46% 8% 15% 8% 31% 15% 31%
25. Systematically provide feedback on the homework and classroom assigned to students: for example, reviewing previously learned material.
-- 8% 46% 31% 15% 23% 23% 23%
26. End units by providing students with clear feedback on the learning goals.
-- 8% 39% 39% 8% 23% 23% 31%
27. Check the assessment techniques you regularly use in your classroom. Total the number of boxes unchecked. Mark your answer using this code: 1= 1-2 techniques used, 2= 3 - 5 techniques, 3 = 6 - 8 and 4 = 9 or more. Teacher-made tests Exhibit/Presentation Observation Checklists/Inventories Interviews Group reflection Short answer Essay/Report Journal, log
-- 8% 62% 15% 8% 15% 15% 23%
10
To what degree do we engage in this behavior or address this issue?
Will I take advantage of Professional Development if provided on this item?
Not at all
Sometimes
Most of the
Time
To a great extent
Not at all
Sometimes
Most of the
Time
To a great extent
The degree to which I... 1 2 3 4 1 2 3 4
Teaching and Assessment of Arizona Academic Standards Portfolio Scored discussion Self Reflection Graphic Organizer
To what degree do we engage in this behavior or address this issue?
Will I take advantage of Professional Development if provided on this item?
Not at all
Sometimes
Most of the Time
To a great extent
Not at all
Sometimes
Most of the Time
To a great extent
The degree to which I... 1 2 3 4 1 2 3 4
Instructional Delivery 28. Use teaching strategies that support the content (standards, benchmarks, and critical objectives) being taught for all learners
-- -- 46% 39% -- 23% 31% 31%
29. Use teaching strategies that connect prior knowledge with new learning content.
-- -- 39% 46% 8% 39% 15% 23%
30. Use teaching strategies that hook student interest, offers challenging experiences, and connect to the real world in order to guide learning.
-- 15% 31% 39% -- 8% 39% 39%
31. Use teaching strategies that require students to collaborate with peers; develop new ideas and understanding in conversations and work with others.
-- 8% 31% 46% -- 8% 39% 39%
11
32. Use teaching strategies that incorporate different learning styles. Students have multiple exposures to new content presented in a variety of forms (e.g., stories, descriptions) using a variety of media (e.g., read about the content, watch a demonstration, listen to a presentation).
-- 23% 38% 23% -- 15% 46% 23%
33. Check the instructional strategies you regularly use in your classroom. Total the number and mark your answer using this code: 1= 1- 4 techniques used, 2 = 5 - 8 techniques, 3 = 9 – 12, and 4 = 13 or more.
8% 15% 46% 15% -- 15% 15% 39%
Verbal/Written Summaries Reviewing previous material Teacher demonstration of how to solve problems or demonstrate new procedures, formulas, skills or practices. Active note taking (not copying) Represent content in new ways (mental image, picture, pictograph, graphic organizer, physical model, role playing/enactment) Homework or in class assignments that require students to generate and test hypothesis regarding content. Homework or in class assignments that have the students provide a proof of the mathematical content. Homework or in class assignments that have the students complete problems similar to those for which the solution method was demonstrated -- practice problems. Revision of errors. Peer Review Group Brainstorming Individual Exploration Internet Research/Web quests/Treasure Hunts/Computer Simulation. Students discuss solution methods -- after students work on a problem they present the solution methods they used to solve a particular problem. Writing activities
To what degree do we engage in this behavior or address this issue?
Will I take advantage of Professional Development if provided on this item?
Not at all
Sometimes
Most of the time
To a great extent
Not at all
Sometimes
Most of the time
To a great extent
The degree to which I... 1 2 3 4 1 2 3 4
12

Classroom Management 34. Make appropriate adjustments in teaching strategies that take into account the physical, intellectual, emotional, and special education requirements of all students.
-- -- 31% 54% -- 8% 39% 39%
35. Arrange physical resources safely and make them accessible to all students.
-- -- 23% 62% 31% 15% 23% 15%
36. Locate, evaluate, and use appropriate resources to support instruction.
-- 8% 39% 39% 8% 23% 39% 8%
37. Have comprehensive and well-articulated rules and procedures for general classroom behavior, instructional procedures and use of materials.
-- 8% 23% 54% 15% 15% 31% 23%
38. Organize students into content or cooperative groups when appropriate.
-- 8% 23% 54% 8% 39% 31% 8%
39. Use different strategies to teach students how to work cooperatively versus independently and effective group skills (team building skills).
-- 8% 39% 39% 23% 23% 23% 15%
40. Assign roles to students to help the students manage the learning process (e.g., leader, recorder, reporter, data collector, monitor, presenter, proof reader).
-- 15% 23% 46% 15% 31% 15% 23%
13

To what degree do we engage in this behavior or address this issue?
Will I take advantage of Professional Development if provided on this item?
Not at all
Sometimes
Most of the time
To a great extent
Not at all
Sometimes
Most of the time
To a great extent
The degree to which I... 1 2 3 4 1 2 3 4
K-3 Reading Instruction (items for K-3 teachers, only) Others do not answer.
Not at all
Sometimes
Most of the Time
To a great extent
Not at all Sometimes
Most of the Time
To a great extent
41. Utilize daily the five components of researched based reading instruction: 1) phonemic awareness, 2) phonics, 3)vocabulary, 4) fluency, 5) comprehension
42. Provide systematic and explicit instruction in the five components.
43. Use and analyze benchmark and progress monitoring assessments (such as DIBELS) to drive reading instruction.
To what degree do we engage in this behavior or address this issue?
Will I take advantage of Professional Development if provided on this item?
Not at all
Sometimes
Most of the time
To a great extent
Not at all
Sometimes
Most of the time
To a great extent
The degree to which I... 1 2 3 4 1 2 3 4
Communication and Collaboration 44. Communicate to families about the instructional program and individual student progress.
-- 39% 23% 23% 23% 23% 8% 31%
45. Share with teachers, staff and professional community about lessons learned and progress made during classroom experiences.
-- 15% 54% 15% 39% 15% 8% 23%
46. Manage time in order to -- 23% 39% 23% 23% 15% 15% 31%
14

complete professional responsibilities.
15

To what degree do we engage in this behavior or address this issue?
Will I take advantage of Professional Development if provided on this item?
Not at all
Sometimes
Most of the Time
To a great extent
Not at all
Sometimes
Most of the Time
To a great extent
The degree to which our school.. 1 2 3 4 1 2 3 4
School Climate for Learning Your response to these questions should indicate your ideas and perceptions about your school. 47. Exhibits a school-wide belief that students can learn. -- -- 54% 31% 8% 31% 15% 15% 48. Creates a safe and orderly environment. -- 15% 15% 54% 23% 31% 8% 8% 49. Has a clearly developed and shared mission. -- 23% 39% 23% 23% 23% 23% -- 50. Have students, parents and staff who understand the expectations for student learning and share responsibility for students’ achievement and their behavior within the school.
-- 31% 46% 8% 23% 15% 15% 15%
51. Provides training and assistance to parents to enhance their skills in supporting their child.
23% 54% 8% -- 8% 23% 15% 23%
52. Recognizes and utilizes cultural and ethnic diversity to enhance the learning programs within the school.
8% 54% 15% 8% 15% -- 39% 15%
53. Acknowledges and recognizes the accomplishments of students and adults.
8% 15% 31% 31% 23% 15% 31% --
54. Exhibits positive morale among student, staff and the school community.
-- 39% 31% 15% 15% 31% 15% 8%
55. Models appropriate school personnel behavior. -- 23% 31% 31% 23% 31% 15% -- 56. Provides time and opportunity for teachers to collaborate and communicate.
15% 23% 31% 15% 15% 23% 15% 23%
57. Plans a schedule that ensures adequate time for instruction in core subjects.
8% 15% 31% 31% 15% 15% 23% 23%
58. Implements procedures to maximize the instructional 8% 39% 31% 8% 8% 23% 31% 15%
16

To what degree do we engage in this behavior or address this issue?
Will I take advantage of Professional Development if provided on this item?
Not at all
Sometimes
Most of the Time
To a great extent
Not at all
Sometimes
Most of the Time
To a great extent
The degree to which our school.. 1 2 3 4 1 2 3 4
School Climate for Learning Your response to these questions should indicate your ideas and perceptions about your school. resources and materials available to teachers and students. 59. Enforces appropriate consequences for violations of school-wide rules and procedures.
15% 23% 39% 8% 31% 15% 15% 15%
60. Has implemented a program that teaches and reinforces student self-discipline and responsibility.
8% 8% 23% 46% 31% 15% 23% 8%
61. Has implemented a system for early detection of students who are prone to violence and extreme behavior.
15% 15% 39% 15% 23% 15% 8% 15%
62. Has established decision-making processes that allow for teacher involvement in school-wide decisions and policies.
23% 54% -- 8% 15% 15% 23% 23%
Technology Information 63. I have access to a computer: 85% Yes 15% No 64. I have access to a computer with a CD-Rom Drive: 85% Yes 15% No 65. If you have internet access, check all that apply:
AccessYes
AccessNo
Internet Access Yes
Internet Access No
In my classroom 77% 23% 85% 15%
17

In another classroom 62% 38% 77% 23% Media Center 77% 23% 85% 15% In a computer lab 69% 31% 69% 31% At home 69% 31% 77% 23% Other, explain 8% 92% 8% 92%
To what degree do we engage in this behavior or address this issue?
Will I take advantage of Professional Development if provided on this item?
Not at all
Sometimes
Most of the Time
To a great extent
Not at all
Sometimes
Most of the Time
To a great extent
The degree to which I... 1 2 3 4 1 2 3 4
Technology Integration 67. Enjoy using technology in my classroom. -- 31% 31% 23% 8% 15% 23% 23% 68. Plan strategies for managing learning in a technology-enhanced environment.
8% 46% 23% 8% -- 23% 31% 23%
69. Implement content that includes methods and strategies to apply technology to maximize learning.
8% 39% 31% 8% -- 23% 31% 15%
70. Identify and locate resources and evaluate them for accuracy and suitability.
-- 39% 31% 8% -- 31% 23% 15%
71. Plan for the management of technology resources within the context of learning activities.
-- 39% 39% -- -- 31% 23% 15%
72. Apply technology in assessing learning of subject matter using a variety of assessment techniques.
15% 31% 39% -- -- 23% 23% 23%
73. Use technology resources to collect and analyze data, interpret results, and communicate results to improve instructional practice and maximize learning.
8% 39% 15% 23% 8% 15% 23% 23%
74. Apply multiple methods of evaluation to determine students’ appropriate use of technology resources for learning, communication, and productivity.
23% 23% 23% 15% 8% 8% 46% 15%
18

19
AIMS Summary by Content Area and Concept In almost all AIMS achievement categories, FUSD students met or exceeded the state average performance. At grade 3, student achievement in mathematics and reading was at or near the state average, and slightly above in writing. At grade 5, at least ten percent more students meet of exceeded the state average, in each subtest. That general profile continued in grade 8, with only the Reading subtest results dipping to 7% above the state average. The combined High School results of students from grades 10 – 12 all exceeded state averages, with Writing at 10% above the state average and math 4%. The graph below illustrates these results. (FUSD /State Average) Mathematics Reading Writing Grade 3
50/50
76/77
80/77
Grade 5
61/49
68/57
65/55
Grade 8
32/21
62/55
56/46
High School
34/30
60/51
71/61
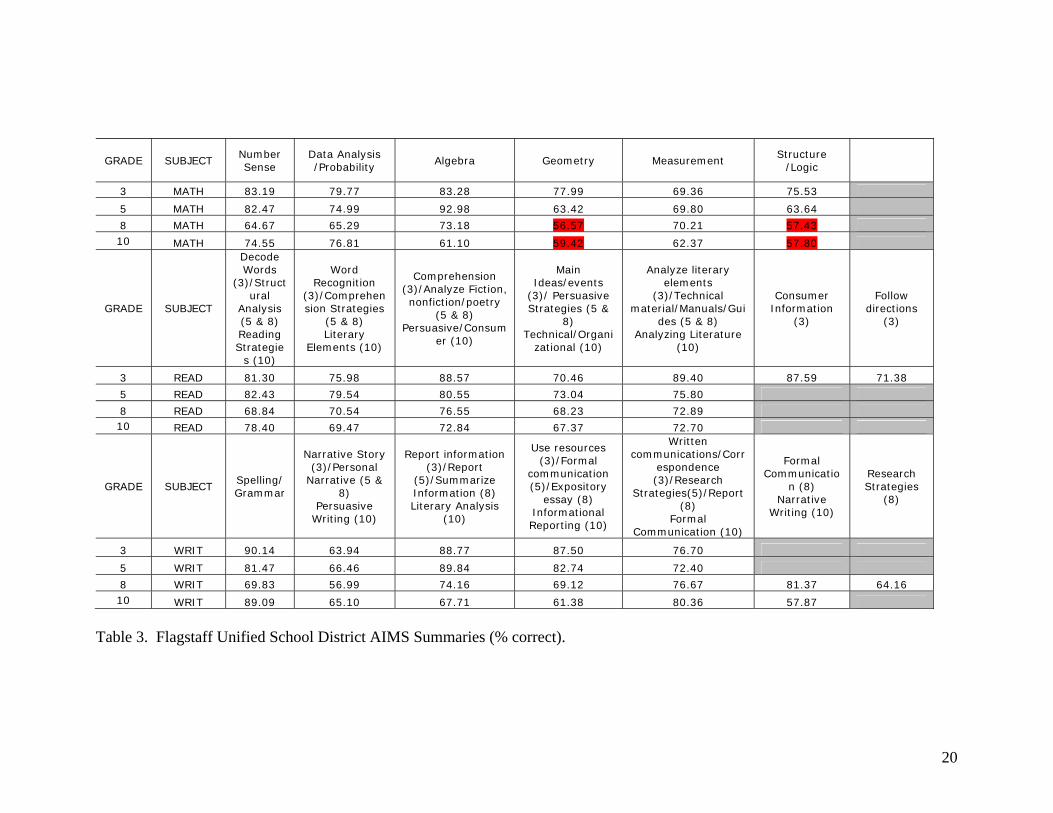
AIMS Achievement by Standard The following table illustrates student achievement by standard within each content area. This presentation allows for comparisons across grade levels by standard and may be useful in identifying curricular and instructional strengths and weaknesses, as measured by the AIMS. The number refers to the percent of correct answers within that standard. Areas of relative lower achievement are highlighted. Arizona Department of Education cautions that this information should be used carefully with small cohort sizes. Reports of student achievement in the 2004 AIMS test will vary considerably because of Grade Level Articulated Standards Documents. These new documents should be used for planning.
20
GRADE SUBJECTNumber Sense
Data Analysis /Probability
Algebra Geometry MeasurementStructure
/Logic
3 MATH 83.19 79.77 83.28 77.99 69.36 75.53
5 MATH 82.47 74.99 92.98 63.42 69.80 63.64
8 MATH 64.67 65.29 73.18 56.57 70.21 57.43 10 MATH 74.55 76.81 61.10 59.42 62.37 57.80
GRADE SUBJECT
Decode Words
(3)/Structural
Analysis (5 & 8) Reading Strategie
s (10)
Word Recognition
(3)/Comprehension Strategies
(5 & 8) Literary
Elements (10)
Comprehension (3)/Analyze Fiction, nonfiction/poetry
(5 & 8) Persuasive/Consum
er (10)
Main Ideas/events
(3)/ Persuasive Strategies (5 &
8) Technical/Organi
zational (10)
Analyze literary elements
(3)/Technical material/Manuals/Gui
des (5 & 8) Analyzing Literature
(10)
Consumer Information
(3)
Follow directions
(3)
3 READ 81.30 75.98 88.57 70.46 89.40 87.59 71.38
5 READ 82.43 79.54 80.55 73.04 75.80
8 READ 68.84 70.54 76.55 68.23 72.89 10 READ 78.40 69.47 72.84 67.37 72.70
GRADE SUBJECTSpelling/Grammar
Narrative Story (3)/Personal
Narrative (5 & 8)
Persuasive Writing (10)
Report information (3)/Report
(5)/Summarize Information (8) Literary Analysis
(10)
Use resources (3)/Formal
communication (5)/Expository
essay (8) Informational Reporting (10)
Written communications/Corr
espondence (3)/Research
Strategies(5)/Report (8)
Formal Communication (10)
Formal Communicatio
n (8) Narrative
Writing (10)
Research Strategies
(8)
3 WRIT 90.14 63.94 88.77 87.50 76.70
5 WRIT 81.47 66.46 89.84 82.74 72.40
8 WRIT 69.83 56.99 74.16 69.12 76.67 81.37 64.1610 WRIT 89.09 65.10 67.71 61.38 80.36 57.87
Table 3. Flagstaff Unified School District AIMS Summaries (% correct).
References AcheyCutts, Patty. “Connecting Technology with Brain Research.” Cedar Falls, IA: Area
Education Agency 7, Educational Services, 2000.
American Association of School Personnel Administrators (AASPA). Most Critical Knowledge and Skills of Future Educator. AASPA, 1995.
Bender, Cary L., and Gary D. Phye. “Star Schools Engaged Learning/Technology Assessment Tools.” Ames, Iowa: Iowa State University, 1999.
Burke, Kay. How to Assess Authentic Learning, Third Edition, Skylight Professional Development, Arlington Heights, Illinois, 1999.
Educational Testing Services (ETS). “Components of Professional Practice.” ETS, 1999.
Iowa Educational Technology Training Institute (IETTI). “Educational Technology Skills Inventory.” Cedar Falls, Iowa; University of Northern Iowa, IETTI, 1996.
Jones, Beau Fly, et al. Plugging In: Choosing and Using Educational Technology. North Central Regional Educational Laboratory, 1995 http://www.ncrtec.org/capacity/plug/plug.htm
Marzano, What Works in Schools: Translating Research into Action. ASCD. 2003.
Neff, Linda. Strategies for Teaching in a One – Five Computer Classroom, Professional Development Workshop Materials, Northern Arizona University, Flagstaff, 2003.
Redalen, Edward. “Elements of Instruction that are Correlated to Teaching Effectiveness and Student Learning.” Cedar Falls, IA: Area Education Agency 7, Educational Services, 1998.
Stigler, James W. and James Hiebert. The Teaching Gap: Best Ideas from the World’s Teachers for Improving Education in the Classroom, The Free Press, New York, 1999.
21