probabilistic safety in a multiscale and time dependent model
DESCRIPTION
Université des Sciences et U .S.T. O de la Technologie d’Oran. Probabilistic safety in a multiscale and time dependent model. for suspension cables. - PowerPoint PPT PresentationTRANSCRIPT

Probabilistic safety in Probabilistic safety in a multiscale and time a multiscale and time
dependent modeldependent model
for suspension cablesfor suspension cables S. M. ElachachiS. M. Elachachi1,21,2, , D. BreysseD. Breysse11 and S. Yotte and S. Yotte11
11CDGA, University of Bordeaux I (France)CDGA, University of Bordeaux I (France)22LM2SC, University of Sciences and Technology of Oran LM2SC, University of Sciences and Technology of Oran
(Algeria)(Algeria)
Université des Sciences et
U.S.T.O de la Technologie d’Oran

2Workshop Probability and Materials: from Nano- to Macro-Scale, JHU 5-7/01/2005
Outline of the presentationOutline of the presentation
IntroductionIntroduction Experimental Experimental
aspectsaspects Multiscale Multiscale
approachapproach wire scalewire scale Strand scaleStrand scale Cable scaleCable scale
ConclusionsConclusions

3Workshop Probability and Materials: from Nano- to Macro-Scale, JHU 5-7/01/2005
IntroductionIntroduction
Probabilistic safety in a multiscale and time dependent modelProbabilistic safety in a multiscale and time dependent model

4Workshop Probability and Materials: from Nano- to Macro-Scale, JHU 5-7/01/2005
Mechanical loadsMechanical loads Dead loads,Dead loads, Live loads,Live loads, Accidental loads,Accidental loads,
……
Environmental Environmental loadsloads
Temperature Temperature gradient,gradient,
Humidity.Humidity.
IntroductioIntroductionn
Cables
Aquitaine Bridge (Bordeaux, France)
CorrosionCorrosion

5Workshop Probability and Materials: from Nano- to Macro-Scale, JHU 5-7/01/2005
IntroductioIntroductionn
Types of Corrosion
general localized (pitting)
Old and New strands
Visual Inspection
cracks

6Workshop Probability and Materials: from Nano- to Macro-Scale, JHU 5-7/01/2005
ObjectivesObjectives
determinate the bearing capacity by determinate the bearing capacity by integrating the complexity of the integrating the complexity of the mechanical description (non linear mechanical description (non linear behavior, load redistributions ...).behavior, load redistributions ...).
evaluate the effect of the factors evaluate the effect of the factors affecting the long-term performance of affecting the long-term performance of the cablethe cable, ,
develop a model of the residual lifespan develop a model of the residual lifespan (for a requirement of given service), (for a requirement of given service),
Evaluate the risk of failure. Evaluate the risk of failure.
IntroductioIntroductionn

7Workshop Probability and Materials: from Nano- to Macro-Scale, JHU 5-7/01/2005
Experimental Experimental aspectsaspects
Probabilistic safety in a multiscale and time dependent modelProbabilistic safety in a multiscale and time dependent model

8Workshop Probability and Materials: from Nano- to Macro-Scale, JHU 5-7/01/2005
Strand tension testStrand tension test
before before testtest
after testafter test
experimental aspectsexperimental aspects
F
Displacement
(LCPC Nantes)(LCPC Nantes)

9Workshop Probability and Materials: from Nano- to Macro-Scale, JHU 5-7/01/2005
0
200
400
600
800
1000
1200
1400
1600
0 0,0002 0,0004 0,0006 0,0008 0,001 0,0012 0,0014
c_3-1
c_3-2
c_3-3
c_4-1
c_4-2
Stress (MPa)
Strain
experimental aspectsexperimental aspects
W
ire c
on
stit
uti
ve l
aw
variability of Mechanicalcharacteristics
Wire tension test

10Workshop Probability and Materials: from Nano- to Macro-Scale, JHU 5-7/01/2005
The model must take into account :The model must take into account :
Random (probabilistic/stochastic) Random (probabilistic/stochastic) aspect of mechanical characteristics,aspect of mechanical characteristics,
Multiscale aspect (Multiscale aspect (geometrical and geometrical and mechanics rules of assemblagemechanics rules of assemblage))
experimental aspectsexperimental aspects

11Workshop Probability and Materials: from Nano- to Macro-Scale, JHU 5-7/01/2005
Multiscale Multiscale ApproachApproach
Probabilistic safety in a multiscale and time dependent modelProbabilistic safety in a multiscale and time dependent model

12Workshop Probability and Materials: from Nano- to Macro-Scale, JHU 5-7/01/2005
Multiscale approachMultiscale approach
Cable scale
Strand scale
Wire scale
Three scale system

13Workshop Probability and Materials: from Nano- to Macro-Scale, JHU 5-7/01/2005
Multiscale approachMultiscale approach
Cable
Strand
Strand's section
Wire layers Wire
Uncoupled approachAquitaine Bridge : 37 strands, 1,750 strand's sections and 217 wires per strand's section 14,000,000 wires.
Global description
Local description
para
llel-
seri
e s
ub
-Sys
tem
Para
llel
sub
-sys
tem

14Workshop Probability and Materials: from Nano- to Macro-Scale, JHU 5-7/01/2005
Multiscale approachMultiscale approach
Cable
Strand
Strand's section
Wire layers
Wire
Uncoupled approach
Global description
Local description
para
llel-
seri
e s
ub
-Sys
tem
Para
llel
sub
-sys
tem

15Workshop Probability and Materials: from Nano- to Macro-Scale, JHU 5-7/01/2005
Wire ScaleWire Scale
Probabilistic safety in a multiscale and time dependent modelProbabilistic safety in a multiscale and time dependent model

16Workshop Probability and Materials: from Nano- to Macro-Scale, JHU 5-7/01/2005
Wire scaleWire scale
Constitutive wire law
e
si )eC(1
)eE(
e
e si E
σσεε
εεσσ
σσεσ
0
200
400
600
800
1000
1200
1400
1600
0 0,002 0,004 0,006 0,008 0,01 0,012 0,014 0,016
exp C3N2
sim C3N2
exp C4N1
sim C4N1
contrainte (MPa)
déformation
e
e
Ramdom local variables{X}=e, e , u, u}
Stress (MPa)
u
Strain
u

17Workshop Probability and Materials: from Nano- to Macro-Scale, JHU 5-7/01/2005
Data Base : (675 + 20) tension wire tests
identified Parameters descriptors Parameters
average Standard deviation
coef. var
Type Obs.
e
(MPa)
872 154 0.177 lognormal : 13,663: 0,175
correl to e, u and
u
E (Mpa)
2 105 104 0.05 lognormal : 19,1: 0,05
e4.36.10-3 7.73 10-4 0.177 lognormal defined by e
and E
Correl. to e, u and
u
u1.246.10-2 2.54 10-3 0.204 Weibull m : 4,15
min : 6,95.10-3
0 : 5,4. 10-3
Correl. to e, e and
u
u
(MPa)
1510 63.2 0.04 Weibull m : 3,173min : 1330
0 : 204
Healthy populat.
1240 208 0.168 Weibull m : 3,526min : 576,4
0 : 735
Corroded populat.
Wire scaleWire scale
[]=
1
679,01
309,0276,01
309,0276,011
sym
eeuu

18Workshop Probability and Materials: from Nano- to Macro-Scale, JHU 5-7/01/2005
Wire scaleWire scale
SAIN
0
0,1
0,2
0,3
0,4
0,5
0,6
0,7
0,8
0,9
1
1300 1400 1500 1600 1700
exp
identif 3p
Healthy
u
corrodé
0
0,1
0,2
0,3
0,4
0,5
0,6
0,7
0,8
0,9
1
600 800 1000 1200 1400 1600
exp
identif 3p
corroded
u
c.d.f of u
of the corroded population(3p Weibull model)
c.d.f of u
of the Healthy population(3p Weibull model)

19Workshop Probability and Materials: from Nano- to Macro-Scale, JHU 5-7/01/2005
Corrosion :Corrosion : Corrosion chart (initiation time)Corrosion chart (initiation time)
p(i, t) = p(i, n.p(i, t) = p(i, n.t), = 1 – (1 – pt), = 1 – (1 – ptt(i))(i))nn
Number of corroded wires:Number of corroded wires:
Iterative relation :Iterative relation :
p(i, t + p(i, t + t) = p(i, t) + [1 - p(i, t)] pt) = p(i, t) + [1 - p(i, t)] ptt(i)(i)
Wire scaleWire scale
layer i 1 2 3 4 5 6 7
P(i, T= 36 yrs) 0.999 0.8 0.6 0.4 0.2 0 0
p(i, t = 1 yr) 0.1746 0.0437 0.0251 0.0141 0.0062 0 0
k-NikkNii ) t)p(i,-(1 t)p(i, C (t) Nc Assumption:
« Linear distribution »

20Workshop Probability and Materials: from Nano- to Macro-Scale, JHU 5-7/01/2005
0
0,1
0,2
0,3
0,4
0,5
0,6
0,7
0,8
0,9
1
0 0,2 0,4 0,6 0,8 1 1,2 1,4
identif
modèle loi N
modèle loi LN
IdentifiedTruncated NormalLognormal
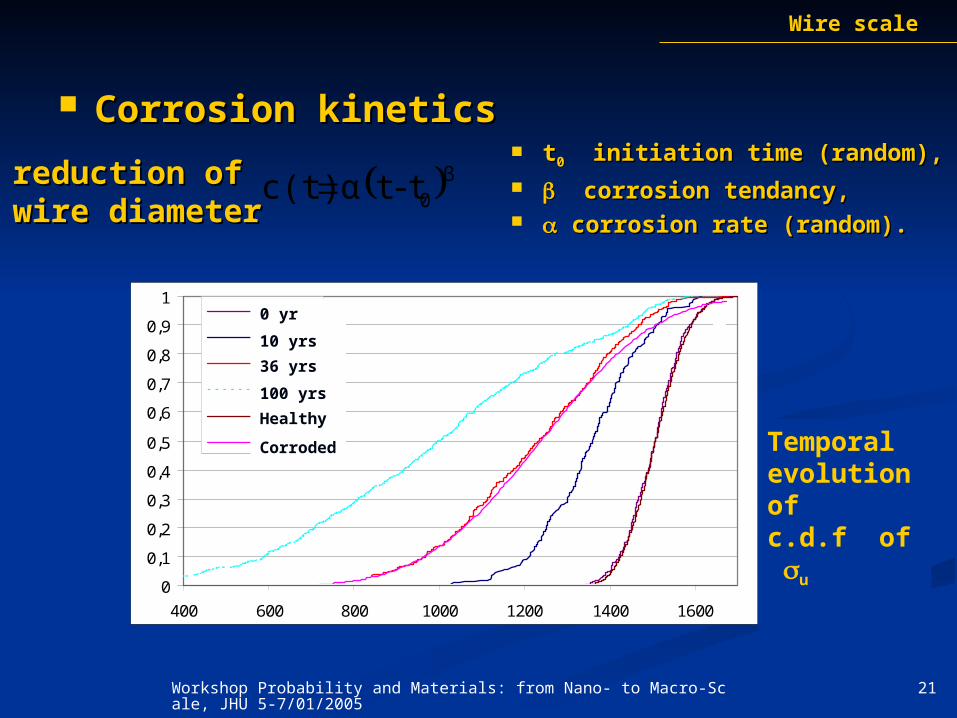
β0t-t αc(t)
Corrosion kineticsCorrosion kinetics
c.d.f of c.d.f of
c(t=36ans)c(t=36ans)
Wire scaleWire scale
u c (mm)
tt00 initiation time (random), initiation time (random), corrosion tendancy, corrosion tendancy, corrosion rate (random).corrosion rate (random).
reduction of reduction of wire diameterwire diameter
21Workshop Probability and Materials: from Nano- to Macro-Scale, JHU 5-7/01/2005
β0t-t αc(t)
Corrosion kineticsCorrosion kinetics
Wire scaleWire scale
u c (mm)
Temporal evolution of c.d.f of u
tt00 initiation time (random), initiation time (random), corrosion tendancy, corrosion tendancy, corrosion rate (random).corrosion rate (random).
0
0,1
0,2
0,3
0,4
0,5
0,6
0,7
0,8
0,9
1
400 600 800 1000 1200 1400 1600
0 an
10 ans
36 ans
100 ans
sain
corrodé
0 yr
10 yrs
36 yrs
100 yrs
Healthy
Corroded
reduction of reduction of wire diameterwire diameter

22Workshop Probability and Materials: from Nano- to Macro-Scale, JHU 5-7/01/2005
Strand ScaleStrand Scale
Probabilistic safety in a multiscale and time dependent modelProbabilistic safety in a multiscale and time dependent model

23Workshop Probability and Materials: from Nano- to Macro-Scale, JHU 5-7/01/2005
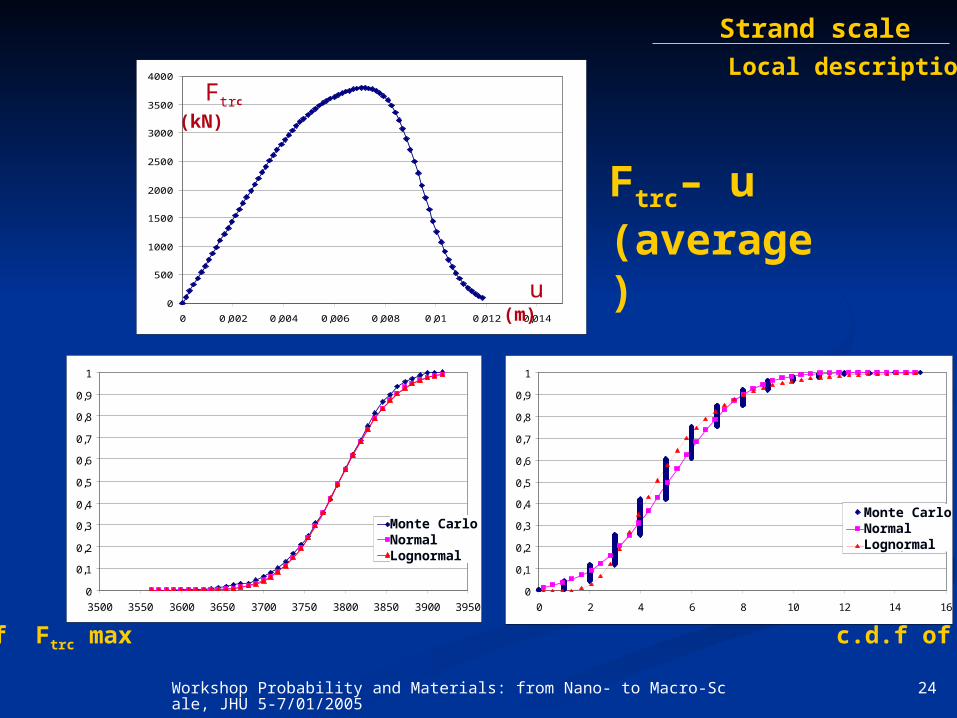
Strand scaleStrand scale
t)(u,Ft)(u,FN
1iiw,trc
constitutive law of a strand's section (Ftrc vs displacement):
Where :
),,t,t(A).,,,,l
u()t(u,F 0uuee
rifil,
Monte Carlo Simulation
anchoring length
Local description
w,i
24Workshop Probability and Materials: from Nano- to Macro-Scale, JHU 5-7/01/2005
0
500
1000
1500
2000
2500
3000
3500
4000
0 0,002 0,004 0,006 0,008 0,01 0,012 0,014
0
0,1
0,2
0,3
0,4
0,5
0,6
0,7
0,8
0,9
1
3500 3550 3600 3650 3700 3750 3800 3850 3900 3950
C_Tr_Tor
loi Normale
loi LogNormale
0
0,1
0,2
0,3
0,4
0,5
0,6
0,7
0,8
0,9
1
0 2 4 6 8 10 12 14 16
C_Tr_Tor
loi Normale
loi LogNormale
Strand scaleStrand scale
Ftrc– u (average)
c.d.f of Ftrc max c.d.f of broken wires
Ftrc (kN)
u (m)
Monte CarloNormal Lognormal
Monte CarloNormal Lognormal
Local description

25Workshop Probability and Materials: from Nano- to Macro-Scale, JHU 5-7/01/2005
Cable
Strand
Strand's section
Wire layers
Wire
Uncoupled approach
Global description
Local description
para
llel-
seri
e s
ub
-Sys
tem
Para
llel
syst
em
Strand scaleStrand scaleGlobal description

26Workshop Probability and Materials: from Nano- to Macro-Scale, JHU 5-7/01/2005
Strand scaleStrand scale
Ftrc(u,t) = (1-D(u)).(1- (t)).u
tr0K
1D(u)0 1)t(0 Damage Indicator Corrosion Indicator
)H(u)1(u.K
)u(F-1D(u)
tr0
N
iifil,
B0t-t Aδ(t)
))l.(u(PH(u) ru F (u) =
m
0
minuexp1
Analytical model : Global description

27Workshop Probability and Materials: from Nano- to Macro-Scale, JHU 5-7/01/2005
0
0,05
0,1
0,15
0,2
0,25
0,3
0,35
0,4
0,45
0 20 40 60 80 100 120 140
C_Tr_Tor modèle
t (ans)
Monte Carlo
Model
t (yrs)0
500
1000
1500
2000
2500
3000
3500
4000
0 0,002 0,004 0,006 0,008 0,01 0,012 0,014
0 an
20 ans
40 ans
60 ans
80 ans
100 ans
120 ans
140 ans
160 ans
0 yr20 yrs40 yrs60 yrs80 yrs100 yrs120 yrs140 yrs160 yrs
Ftrc (kN)
0,00E+00
5,00E+02
1,00E+03
1,50E+03
2,00E+03
2,50E+03
3,00E+03
3,50E+03
4,00E+03
0 0,002 0,004 0,006 0,008 0,01 0,012 0,014
modèle
C_Tr_Tor (1000)
0,00E+00
2,00E+01
4,00E+01
6,00E+01
8,00E+01
1,00E+02
1,20E+02
1,40E+02
1,60E+02
1,80E+02
2,00E+02
0 0,002 0,004 0,006 0,008 0,01 0,012 0,014
modèle
C_Tr_Tor (1000) Ftrc (kN)
u (m)
u (m)
Strand scaleStrand scale
ModelMonte Carlo
ModelMonte Carlo
Average Standard deviationGlobal description

28Workshop Probability and Materials: from Nano- to Macro-Scale, JHU 5-7/01/2005
Cable ScaleCable Scale
Probabilistic safety in a multiscale and time dependent modelProbabilistic safety in a multiscale and time dependent model

29Workshop Probability and Materials: from Nano- to Macro-Scale, JHU 5-7/01/2005
Cable scaleCable scale
A A APopulatioPopulationn
Type of Type of corrosioncorrosion B
P1P1 GeneralGeneral 1,9.101,9.10-3-3 9,5.109,5.10-5-5 0,050,05 0,950,95
P2P2 PittingPitting 9,86.109,86.10-3-3 2,46.102,46.10-3-3 0,050,05 0,7470,747
P1 P1+P2
Fcab (kN) Fcab (kN)
u (m)
u (m)
Length cable: 8 m60 strands, 10 sections per strand
yrsyrs
Two types of corroded populations P1 and P2
0
50000
100000
150000
200000
250000
0 0,01 0,02 0,03 0,04 0,05 0,06
t=0
50 ans
150 ans
yrsyrs
0
50000
100000
150000
200000
250000
0 0,01 0,02 0,03 0,04 0,05 0,06
t=0
50 ans
150 ansyrsyrs

30Workshop Probability and Materials: from Nano- to Macro-Scale, JHU 5-7/01/2005
0
50000
100000
150000
200000
250000
0 20 40 60 80 100 120 140
cas 2
cas 1
Rc (kN)
t (yrs)
Cable scaleCable scale
Rc= max(Fcab(u) I tfixed)
Case 2
Case 1

31Workshop Probability and Materials: from Nano- to Macro-Scale, JHU 5-7/01/2005
Case P1(%) P2(%) P3(%)
Out of collars Collars (20%)
1 80 20 0
2 80 16 4
3 80 12 8
4 80 8 12
5 80 4 16
10000
30000
50000
70000
90000
110000
130000
150000
170000
190000
210000
0 20 40 60 80 100 120 140
cas 1
cas 2
cas 3
cas 4
cas 5
²
Rc (kN)
t (yrs)
Rc vs time for different ratios of P3
Introduction of a third population P3 Cable scaleCable scale

32Workshop Probability and Materials: from Nano- to Macro-Scale, JHU 5-7/01/2005
Cable scaleCable scale
0
0,005
0,01
0,015
0,02
0,025
0 20 40 60 80 100 120 140
a) strain =u/l
0
0,1
0,2
0,3
0,4
0,5
0,6
0,7
0,8
0,9
0 20 40 60 80 100 120 140
b) corrosion indicator
0
0,1
0,2
0,3
0,4
0,5
0,6
0,7
0,8
0,9
1
0 20 40 60 80 100 120 140
c) mechanical damage indicator D
0
0,1
0,2
0,3
0,4
0,5
0,6
0,7
0,8
0,9
1
0 20 40 60 80 100 120 140
d) global degradation
elt_1 elt_2
elt_1
elt_3 elt_4
elt_3 elt_4 elt_2
(yrs) (yrs)
elt_1
elt_3 elt_4 elt_2 elt_3
elt_1
(yrs) (yrs)
elt_1 elt_2
elt_3 elt_4
Mechanics and corrosion coupling

33Workshop Probability and Materials: from Nano- to Macro-Scale, JHU 5-7/01/2005
50000
70000
90000
110000
130000
150000
170000
190000
210000
0 20 40 60 80 100 120 140
cas 1
cas 2
cas 3
cas 4
Rc (kN)
t (yrs)
Rc vs time for different rates of corrosion
Cable scaleCable scale
Cas P1 P2 P3
Out of collars Collars
1 1,9.10-3 9,86.10-3 -
2 1,9.10-3 9,86.10-3 1,972.10-2
3 1,9.10-3 9,86.10-3 2,958.10-2
4 1,9.10-3 9,86.10-3 3,944.10-2
Values ofA
Corrosion kinetics effects

34Workshop Probability and Materials: from Nano- to Macro-Scale, JHU 5-7/01/2005
0
0,1
0,2
0,3
0,4
0,5
0,6
0,7
0,8
0,9
1
70000 90000 110000 130000 150000 170000 190000
t= 100 ans
t= 0 an
t=50 ans
0
0,1
0,2
0,3
0,4
0,5
0,6
0,7
0,8
0,9
1
70000 90000 110000 130000 150000 170000 190000
t= 100 ans
t= 50 ans
t= 0 an
Cable scaleCable scale
c.d.f of Rc
(case 1)c.d.f of Rc
(case 2)Rc
Rc
CasCas P1P1 P2P2 P3P3
Out of collarsOut of collars CollarsCollars
11 1,9.101,9.10-3-3 9,86.109,86.10-3-3 1,972.101,972.10-2-2
22 1,9.101,9.10-3-3 9,86.109,86.10-3-3 3,944.103,944.10-2-2
p.d.f of Rp.d.f of Rcc: Gaussian !: Gaussian !
yrs
yrs
yr
yrs
yrs
yr
Values ofA

35Workshop Probability and Materials: from Nano- to Macro-Scale, JHU 5-7/01/2005
1,00E-14
1,00E-12
1,00E-10
1,00E-08
1,00E-06
1,00E-04
1,00E-02
1,00E+00
0 20 40 60 80 100 120 140
case 1
case 2
case 3
case 4
case 5
Cable scaleCable scale
Case P1(%) P2(%) P3(%)
Out of collars
Collars (20%)
1 80 20 0
2 80 16 4
3 80 12 8
4 80 8 12
5 80 4 16
P
f
t (yrs)
Risk of failure

36Workshop Probability and Materials: from Nano- to Macro-Scale, JHU 5-7/01/2005
ConclusionsConclusions
The phenomena of corrosion induce strong The phenomena of corrosion induce strong modifications of the geometrical and modifications of the geometrical and mechanical characteristics of the mechanical characteristics of the components of suspension cables and thus components of suspension cables and thus causes a notable reduction of the bearing causes a notable reduction of the bearing capacity of the cable according to time, capacity of the cable according to time, whose consequences can sometimes lead to whose consequences can sometimes lead to its partial (or total) failure. its partial (or total) failure.
The main aspects of a mechanical modeling The main aspects of a mechanical modeling integrating the statistical distribution laws integrating the statistical distribution laws of the local variables relating at the wire of the local variables relating at the wire scale, in a parallel wire system to describe scale, in a parallel wire system to describe the behavior of the strand's section, were the behavior of the strand's section, were examined and numerically implemented. examined and numerically implemented.

37Workshop Probability and Materials: from Nano- to Macro-Scale, JHU 5-7/01/2005
The need for building a data base of the The need for building a data base of the state of corrosion (feeded with cable state of corrosion (feeded with cable inspections at more or less regular intervals) inspections at more or less regular intervals) of the cables seems to be priority if one wishes of the cables seems to be priority if one wishes to have really predictive forecasting.to have really predictive forecasting.
The anchoring length of wire is also an The anchoring length of wire is also an influential parameter.influential parameter.
The results obtained must be considered:The results obtained must be considered:• like qualitative indicators of the like qualitative indicators of the behavior, due to the incomplete behavior, due to the incomplete character of the data now available, character of the data now available, •like significant in terms of a like significant in terms of a hierarchical basishierarchical basis of the factors of of the factors of influence.influence.
Conclusions Conclusions (cnt’d)(cnt’d)

38Workshop Probability and Materials: from Nano- to Macro-Scale, JHU 5-7/01/2005
Thank youThank you