prion database final report - virginia tech
TRANSCRIPT

Prion Database
Final ReportCS 4624: Multimedia, Hypertext, and Information Access
Virginia Tech, Blacksburg, VA 240615/12/2021
Client: Dr. Louis EscobarInstructor: Dr. Edward A. Fox
Prepared by:Seth Helm
Steven WarrenMike KenyonAaron Isele

Table of ContentsTable of Figures 3
Table of Tables 3
1. Abstract 5
2. Introduction 62.1 Background 62.2 Client 62.3 Objective 62.4 Future Plans 72.5 Team Roles 7
3. Requirements 9
4. Design 10
5. Implementation 115.1 R Shiny Data Upload and Formatting 115.2 R Shiny Data Verification and Uploading to database 115.3 Creating Graphs in R Shiny 115.4 Creating Maps in R Shiny 125.5 Data Collection 12
6. Testing/Evaluation/Assessment 13
7. Users’ Manual 147.1 Tutorial of Use 147.2 User Goals and Use Cases 18
8. Developer’s Manual 248.1 Google Sheets Database 248.2 R Libraries 258.3 R Shiny UI 278.4 R Shiny Server 278.5 Additional Scripts 28
9. Lessons Learned 319.1 Schedule 319.2 Problems 31
10. Acknowledgements 33
11. References 34
12. Appendix 35
2
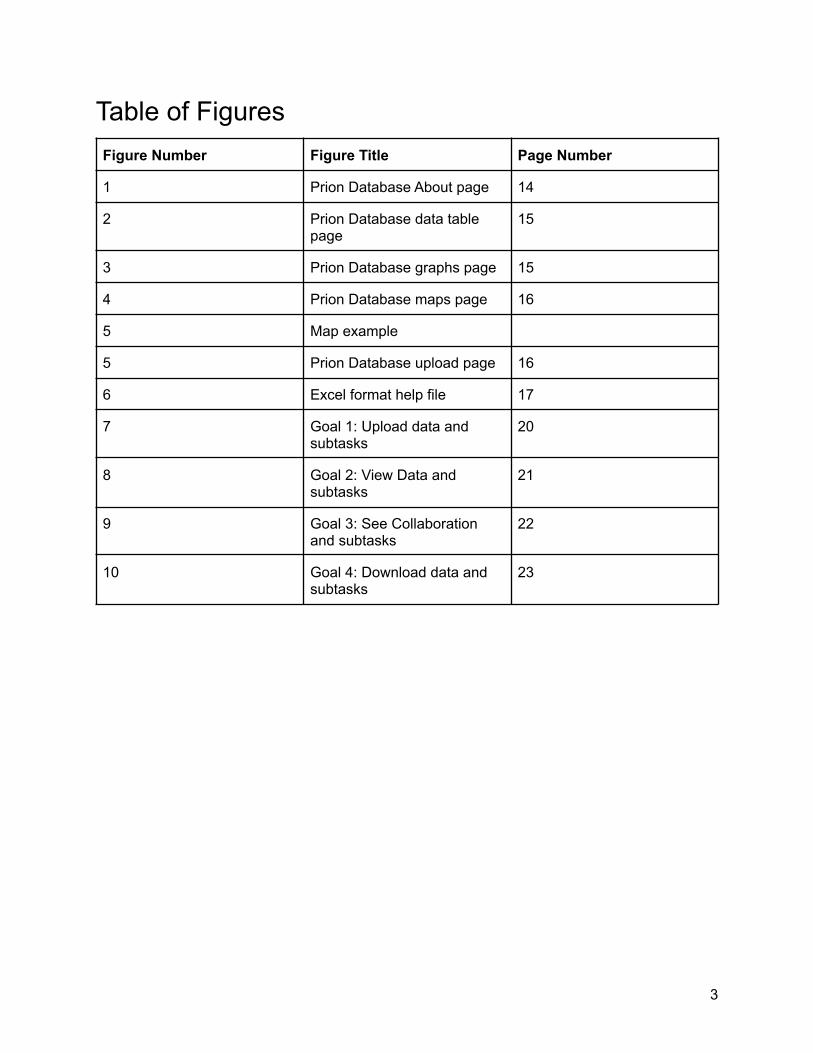
Table of FiguresFigure Number Figure Title Page Number
1 Prion Database About page 14
2 Prion Database data tablepage
15
3 Prion Database graphs page 15
4 Prion Database maps page 16
5 Map example
5 Prion Database upload page 16
6 Excel format help file 17
7 Goal 1: Upload data andsubtasks
20
8 Goal 2: View Data andsubtasks
21
9 Goal 3: See Collaborationand subtasks
22
10 Goal 4: Download data andsubtasks
23
3

Table of TablesTable Number Table Title Page Number
1 Team member roles 7-8
2 User goals and use cases 19
3 Google Sheets formulas 24-25
4 R libraries used by ourproject
25-26
5 Additional scripts used byour application
28-30
4

1. AbstractThis paper describes the process and implementation of the work undertaken to createa collaborative Chronic Wasting Disease (CWD) database to document the spread andtesting history in the United States. Primarily, the data was from around 1999 to thepresent, as documentation of tests beyond that becomes much more difficult to obtain.The data used for this project was obtained by attempting to contact all 50 states'Department of Natural Resources (DNR) and requesting their current CWD testing data.This was met with varied success as only about four states provided well-defined datathat could be placed into a national database. After communicating with the client andanalyzing the data collected, six points of data were selected to be the focus of theproject: state, county, year, total tests, positive tests, and negative tests. Utilizing RShiny as the platform for deploying the database website, and Google Sheets as thepersistent database, our team was able to create a private database website that willallow researchers to share and better understand their data using the tools provided.The data must be kept in a private database as many of the states expressed that theydo not want their data to be publically shared as they must ensure it is being usedresponsibly. The database website features the data in a raw, searchable format as wellas graphs and maps that allow whitelisted users to view the spread of CWD throughoutthe country and over time. The goal for this project moving forward is to have CWDresearchers join the private database by agreeing to share their data now, and in thefuture, which will enable better tracking and predicting of CWD in the United States.
5

2. Introduction
2.1 BackgroundChronic wasting disease (CWD) is a terminal nervous system disease that affects allspecies of cervids (elk, deer, moose reindeer). CWD can be transmitted through feces,saliva, carcass of infected animal, animal to animal contact, or even soil contaminatedwith any of the tissues or fluids from an affected animal. Currently, CWD can be found incaptive or wild cervids in 25 states, three provinces in Canada, South Korea, andNorway [1].
There is no known cure for CWD, as is true with all transmissible forms of spongiformencephalopathies. CWD occurs due to a protein called a prion.These proteins misfold,which causes the body to be unable to break them down. As the prions spread throughthe body other proteins misfold and begin to damage the nervous system of the affectedcervid. CWD in late stages causes the cervids to act erratically and exhibit neurologicalirregularities before their eventual demise. CWD does not appear to be able to affecthumans as there are significant species barriers between humans and cervids thatprevents transmission [1].
2.2 ClientOur client, Dr. Luis Escobar, is an assistant professor at Virginia Tech in the Departmentof Fish and Wildlife Conservation. He seeks to apply ecology and biology to the study ofinfectious diseases, including Chronic Wasting Disease. His laboratory explores thelinks between environmental instability and disease dynamics, often collaborating withmultidisciplinary teams to develop computational tools and models.
2.3 ObjectiveThe goal of this project is to create a database that stores testing history for captive andwild cervids across the entire United States. The data collection phase went throughseveral iterations including looking into methods for data scraping from social media orpulling from repository websites that contained CWD data. Unfortunately, most of theseapproaches did not provide sufficient data (or desired accuracy) so we manuallycontacted all 50 states to request their CWD testing data.
After gathering data, our goal was to find the best way to organize data within adatabase software system. Our client was interested in utilizing free services so wedecided to use Google Sheets through the Virginia Tech Google account which provides
6

large amounts of formatted storage for free. In order to get the data from Google Sheetsand display on a webpage, we decided to use R Shiny. R Shiny allows us to directlytake data from a Google Sheet and display on data tables, graphs, or even mapsshowing which countries in the United States are testing.
The data will be locked behind a web access system which protects states that shareddata from having their data used for purposes other than CWD research. The publicfeature of the website allows users to see what information is available to them byobtaining an account and sharing their data.
2.4 Future PlansAfter the semester ends, there is still plenty of work to be done on this project. First andforemost, more data needs to be collected. The next team that picks up this project willneed to contact state representatives and obtain as much information as possible toallow the project to continue to grow. A feature that will eventually need to be added is alogin system allowing verified users to upload data, to restrict access and aid in theprevention of false data being added to the database. Additionally, some modificationswill need to be done to ensure that the project can be deployed to ShinyApps.io andconnect to the Google Sheet. Alternatively, the Google Sheet could be replaced withanother database, potentially a local Excel spreadsheet or SQL. Some additional plansthat are in place are to make a larger variety of graphs and maps that are embedded inthe webpage. With extra data, or different parameters, much more information can beconveyed, and help aid the users in understanding how CWD may be spreadingthroughout the United States.
Originally, Dr. Escobar requested that we implement some form of authentication forusers to be able to access our web app. We tried several R Shiny libraries to attempt toimplement a feature that would allow users to login/register through our application butnone of them ultimately worked out. The biggest issues we ran into were problemssecurely registering new users since that would require a separate backend encrypteddatabase in order to securely store users personal passwords. Because of these issueswe decided to omit authentication from our current web application. It may be possibleto add it in the future with some more research and knowledge of authentication and RShiny but for now we are leaving it out of our implementation.
2.5 Team RolesTable 1 lists our team members along with the roles they fulfilled for the project.
7

Team Member Role(s)
Seth Helm Project Leader, UI Design, AssistingDevelopment, Contact state agencies.
Steven Warren Graph creation and selection, Contactstate agencies, Testing.
Mike Kenyon Map Creation and Storage, Uploadingand formatting of input data,Formatting of Google Sheets data andGoogle Sheets formulas, Contactstate agencies, Testing.
Aaron Isele Front End Development, Attemptinglogin/registration implementation,Contacting state agencies, Testing.
Table 1. Team member roles
8

3. RequirementsThe requirements for our prion database were defined by our client, Dr. Escobar. Themain deliverable for this project is an R Shiny web application that displays ChronicWasting Disease testing data. The data is expected to include information relating to thestate and county the tests were performed in, the year that the tests were recorded andthe number of positive CWD tests. Additionally, Dr. Escobar asked that we attempt tofind data pertaining to the total number of tests and/or the number of negative CWDtests for each state/county in order to track which counties/states are doing the mosttesting and which are doing little to none.
The website allows any user that is verified personally by Dr. Escobar to access thewebsite, view submitted CWD testing data from all 50 states in the United States, andsubmit their own data. The website shows a sortable table of all the CWD testing data inthe database. Additional goals created by Dr. Escobar include using R Shiny libraries todisplay customizable graphs that users can view and interact with and an interactivemap of the United States displaying a heatmap of the number of tests per county ineach state and number of positive tests per county in each state on a separate map.These features have all been implemented as explained in later sections.
To collect data, Dr. Escobar provided us with some resources for contacting eachState's Department of Natural Resources (DNR). We sent out emails to them to requestraw data; the email template used to contact DNR can be found in Appendix A. Thewebsite also allows users that are verified by Dr. Escobar to upload their own raw datawhich will be processed by our backend and sent to a folder for Dr. Escobar to verifyand upload to the database. This prevents the possibility of incorrect or badly formatteddata being uploaded either accidentally or maliciously to our database.
9

4. Design
Our project’s design is to pull data from the external Google Sheets database, into the RShiny server, where it is then used to create anything from maps to graphs from the rawdata. The data collection occurs through the in-app portal where the user can uploadfiles from their computer to the server. Once in the server, the files will be formattedusing some backend shell and Python scripts, and the raw data will be saved to abackup location, while the formatted files are stored in a directory to be manuallyverified before approving them for upload.
The use of manual verification was decided upon to ensure the validity of the data, andensure that anything that did make it through the cracks gets caught. As there is likelyno more than 50 submissions in a year, and the time sensitivity of the verificationprocess is not a concern, it was deemed acceptable. Additionally, the verification needonly be surface level, to ensure that fields make sense, and that the data is not alreadypresent in the database. This check can be performed easily by just checking the yearand state, as the data will be bulk uploaded.
Once the data is validated and added to the database, it is immediately accessible tothe users of the website. The built in searchable database, the graph of tests over theyears, any other maps and graphs, as well as the link to the Google Sheets, will letusers keep up to date on this information.
The goal of the design was to make it easy and simple to employ, both for the users ofthe website as well as the managers of the application/server. The use of the familiartool Google Sheets will make it very simple for users to analyze the data themselves,and the simple tab-based website is intuitive to navigate. On the server side, all of thescripts can be activated by an automated shell script, or by simply calling theshell/Python scripts and passing in the individual Excel upload that must be modified.
10

5. Implementation
5.1 R Shiny Data Upload and FormattingThe raw uploads from the users are made from within the R Shiny application throughthe upload tab. After the uploaded Excel sheet passes the basic testing of ensuring therequired fields are present, the user receives feedback and the data continues throughto the R Shiny server. When the file is received by the R Shiny server in the backend,the raw Excel file is prepended with extra information (a timestamp) to ensure a uniquefile name, saved to the backend in the unvalidatedSubmissions/ folder, and able to beprocessed whenever a database manager is ready. They need to simply double clickthe format_all.sh script or run `sh ./format_all.sh` in the terminal. At this point, theformatted files get sent to the formatted/ directory, and the unmodified original file iscopied to the unformatted_raw/ directory. Once this step is completed, manualverification of the formatted files continues, and then they are moved to thevalidatedFiles/ folder once verified.
5.2 R Shiny Data Verification and Uploading to databaseOnce the data has been properly verified and is ready to be uploaded, it will have madeits way to the validatedFiles/ directory. It is crucial that data never be added straighthere and instead takes the intended validation path to make sure it is suitable forupload. Once here, the database manager should run the R script that uploads the datato the Google Sheet, and then moves the file into the Submitted_Data/ folder. Thisfolder serves as a reference of past data, as well as a backup in the case of anythinggoing wrong with Google Sheets. Once this step is complete, all users are able to seethe new data in both Google Sheets and within the website. The new data will bepopulated in any of the applicable locations such as graphs, charts, or the rawsearchable database.
5.3 Creating Graphs in R ShinyThe graphs are created on the server side of R Shiny, heavily relying on the ggplot2 andtidyverse libraries and filling in the data needed to complete the table. The data it pullsis gathered from the Google Sheet, which is accessed using the googlesheets4. Oncethe data is accessed, the server processes the graph, sends it to the client, and theclient is able to view it.
11

5.4 Creating Maps in R ShinyThe final feature to be added to the R Shiny web app is a section that allows the user toview heatmaps of CWD throughout the United States. The initial goal was to haveembedded maps that users can interact with, and change the options on the map (totaltest, positive tests, negative tests, etc.). However we decided that this would require toomuch computing power as it took over 20 seconds to generate one map depending onthe complexity of said map. Our solution was to implement a script that would generateall possible maps and save the rendered maps. When users request a map, R Shiny willserve them the map they wanted to view in a downloadable HTML file (viewable onmost modern web browsers) that is preloaded in the backend from the aforementionedscript.
5.5 Data CollectionOver the few weeks of the data collection phase of the project, the states that provideddata were Indiana, North Carolina, Wisconsin, and New Jersey. Due to some of thisdata being shared with the understanding that this data will not be public, there is noreal data present in this report. However, we can make a few notes on the totals of thedata collected for this project to give some of a scope for the amount of data in thedatabase at the conclusion of the project. There were over 3,500 total data pointsextuples (state, county, year, total tests, positive, and negative) collected andinformation on nearly 300,000 individual tests were collected. Out of the tests collected,only about 8,700 tests were positive with the rest being negative. It is important tocollect negative tests, however, because it can give researchers an idea if their testingis comparable to other states as well as showing that they do not appear to have CWDpresent in their state.
12

6. Testing/Evaluation/AssessmentThe data collected in the application is collected from users, so testing can be verytricky. Due to this, while some automated testing is performed, manual testing is stillrequired at the end of the process. In the automated testing phase, it is simple enoughto test the uploading of data that either does or does not have the required fields.Providing feedback about this to the users quickly and rejecting problematic files beforeeven accepting ensures that the bulk of invalid data is taken care of. Testing using theTest files found in the TestData/ directory was successful. Success was indicated bysubmissions failing if required fields were missing and if the feedback about the missingfields was accurate. It was also successful if the data was valid and successfully sent tothe server.
With the evaluation of the website, product demos have been performed for Dr. LuisEscobar and Mariana Castaneda Guzman and their feedback has been incorporated ateach stage of the development process. This has led to the addition and modification ofseveral features like the graphs page and the addition of an about page. When the finaldemo was shown, the clients were satisfied with the product which thus concluded theevaluation of the project.
13

7. Users’ Manual
7.1 Tutorial of UseNavigate to the website (the website is currently privately accessed to protect thesensitive CWD testing data gathered). Figure 1 shows the About page of the webapplication. Although the login functionality is not yet implemented, the steps to registerand view the information are included on this page, including contacting Dr. Escobar foran account. Besides the required information, there are several different boxesexplaining the purpose of the Database as well as some information about ChronicWasting Disease.
Figure 1. Prion Database About page
The data table can be viewed by clicking on “Data Table” in the sidebar. Figure 2 showsthe data table page. Users can sort the table by number of tests, state, and year. Thereis also a search bar to search for specific counties. Users can download or view the rawdata from the database on this page by selecting the clickable download link.
14

Figure 2. Prion Database data table page
The next two pages on the sidebar, “graphs” and “maps”, will display the data in thedata table in an interactive way. Figure 3 and Figure 4 show what the graphs and mapspages look like. The graphs page allows users to select graphs on a state or nationallevel that show CWD yearly testing data including total tests, positives and negatives.The maps page provides users with downloadable heatmaps of CWD testing databased on year and positives, negatives or total tests.
Figure 3. Prion Database graphs page
15

Figure 4. Prion Database maps page
The image in Figure 5 shows what the heatmaps look like when a user may downloadthem in the HTMLl format. When you hover over a given county, two numbers willdisplay. The 5 digit number is a FIPS code for that county, which is a unique federalidentifier for that country, much like a ZIP code. The other number is the metric that theuser selected for that map such as total tests, positives, and negatives.
Figure 5. Prion Database maps page
The last page is the upload page. Figure 6 shows the current implementation of thispage. Users are given some information about uploading data such as how to formattheir spreadsheet and what data points are required to be included for a valid
16

submission. If the submission is valid, the webpage will display a message confirmingthe upload. If the submission is invalid, the page will display a message describing whythe upload was rejected and the user will be able to re-upload their data with the correctformatting.
Figure 6. Prion Database upload pageIf users are unsure of how to submit data, there is a downloadable help file locatedbelow the upload section. The help file, shown in Figure 7, gives an explanation of theformat for their Excel data that will allow the auto submission script to input the data.Even if the uploads are in the correct format they are not automatically merged into thedatabase. This step is done to prevent bad actors or mistakes from polluting thedatabase.
17

Figure 7. Excel help file
7.2 User Goals and Use CasesThis project has three different users in mind, each with various end goals. See Table 2. Foreach type of user, we developed a list of some general goals that they will want to perform. Foreach goal we attached a use case that relates to how our application would be used by the userto accomplish that particular goal. The first user type we wanted to support were department ofnatural resources employees. Their primary goal is to use our application to upload their owninformation to the database with a secondary goal of being able to see the contributions thatother states have made. This should motivate them to upload their own data. Our second usergroup we decided to focus on were researchers. Their primary goal is to view and analyze datafrom our prion database, through analysis of the raw data and viewing of graphs and maps. Ourthird and final user group we thought about was casual browsers. These are people that may beinterested in CWD but are not researchers or government employees. These users have a goalof seeing graphs and data on CWD to become more educated.
18

User Type Short Description General Goals
1. Department of NaturalResourcesEmployees
The department of naturalresources heads that are inpossession of the data thatwill be used in the database.
They can use our platform toupload their data and viewdifferent charts and trends.
They can see thecollaboration between otherstates and aid in moretransparency.
2. Researchers Independent and academicresearchers looking for moreinformation on the topic in asingle location
They can view the data thathas been uploaded to thedatabase.
They can view and analyzedifferent charts and graphsincluded in the website.
They can download the rawdata for their own use.
3. Casual Browsers These are users that are justinterested in seeinginformation about ChronicWasting Disease. They mayor may not be using it foracademic purposes.
See graphs and data onchronic wasting disease.
Table 2. User goals and use cases
19

Goal 1: Upload Data
In order to upload data, a user must first access the website. Then they can navigate tothe upload page and select the Excel spreadsheet they want to upload. The backendwill analyze their submission and give verification if it was submitted correctly or showan error message if there are issues. The task and subtask structure for this goal can beseen in Figure 8.
Figure 8. Goal 1: Upload data and subtasks
20

Goal 2: View Data
In order to view CWD data from the database, users must first be granted access to thewebsite. Then they can navigate to the data table tab to view the raw data or navigate tothe graphs or maps tab to view data summaries. The task and subtasks structure forthis goal can be seen in Figure 9.
Figure 9. Goal 2: View Data and subtasks
21

Goal 3: View the Participating States
Users will be able to see data submitted by other states by accessing the website,navigating to the database section of the webapp, and filtering by state. This will showusers how much data other states are contributing to the database and incentivize themto upload their own data. The tasks and subtasks structure for this goal can be seen inFigure 10.
Figure 10. Goal 3: See Collaboration and subtasks
22

Goal 4: Download Data
In order to download the data, users must first access the website. Then they cannavigate to the section of the webapp and select the link listed there which will takethem to our Google Sheets table with all of the data located on it. From there the datacan be downloaded easily. See Figure 11.
Figure 11. Goal 4: Download data and subtasks
23

8. Developer’s Manual
8.1 Google Sheets DatabaseThe data for the R Shiny app is stored in a Google Sheet database with restrictedaccess as some states are sensitive about their testing data. Google Sheets performscalculations needed for the graphs and maps pages. This is done to prevent the RShiny app from recalculating the data and reloading every time the user selects newdata, or new data is added to the Google Sheet. The formulas used in the GoogleSheets are discussed in Table 3, and if done correctly will autofill information with noadditional input required from the developer. This includes when new data is added tothe database, or data is removed.
Formula Sheet Use Notes
=SUMIFS(Sheet1!$D$2:$D,Sheet1!$A$2:$A,$C2,Sheet1!$B$2:$B,$B2,Sheet1!$C$2:$C,Int(Left(D$1,4)))
=SUMIFS(Sheet1!$E$2:$E,Sheet1!$A$2:$A,$C2,Sheet1!$B$2:$B,$B2,Sheet1!$C$2:$C,Int(Left(E$1,4)))
=SUMIFS(Sheet1!$F$2:$F,Sheet1!$A$2:$A,$C2,Sheet1!$B$2:$B,$B2,Sheet1!$C$2:$C,Int(Left(F$1,4)))
Sheet2 Calculates thenumber of Tests inthe county in theyear of the column
Calculates thenumber ofPositives in thecounty in the yearof the column
Calculates thenumber ofNegatives in thecounty in the yearof the column
To add more years, the datesneed to be filled out in thesame format AND in the sameorder in the header columns.Each new year will need to beadded in the form Column X:YEAR_TestsColumn X+1: YEAR_PositivesColumn X+2:YEAR_Negatives
When copying the formulas,copy the three before and pasttogether. Once the first rowhas been completed, copy thatentire row from column D tothe last row on the right, andpaste into all of the rowsbelow. Doing this helpsprevent accidentally pastingthe formulas into the wronglocation. Every “Tests” columnshould read fromSheet1!$D$2:$D, every“Positives” should readSheet1!$E$2:$E, and every“Negatives” should read
24

Sheet1!$F$2:$F. It is vital thatno mistakes are made in thisas it can be hard to detectthem. Always ensure thingsare correct before filling outthe entire table.
=SUMIFS(Sheet1!$D$2:$D,Sheet1!$C$2:$C, $A2,Sheet1!$A$2:$A,B$1)
Sheet3 Calculates thenumber ofcumulative tests inthat state in a givenyear.
When adding new rows, copythe entire row above, andpaste below. Then doublecheck that the final entry, inthe example provided, theB$1, is the current column. Ex:Alabama should always end inB$1, Alaska C$1, etc.
=SUMIFS(Sheet1!$E$2:$E,Sheet1!$C$2:$C, $A2,Sheet1!$A$2:$A,B$1)
Sheet4 Calculates thenumber ofcumulativepositives in thatstate in a givenyear.
When adding new rows, copythe entire row above, andpaste below. Then doublecheck that the final entry, inthe example provided, theB$1, is the current column. Ex:Alabama should always end inB$1, Alaska C$1, etc.
=SUMIFS(Sheet1!$F$2:$F,Sheet1!$C$2:$C, $A2,Sheet1!$A$2:$A,B$1)
Sheet5 Calculates thenumber ofcumulativepositives in thatstate in a givenyear.
When adding new rows, copythe entire row above, andpaste below. Then doublecheck that the final entry, inthe example provided, theB$1, is the current column. Ex:Alabama should always end inB$1, Alaska C$1, etc.
Table 3. Google Sheets formulas
8.2 R LibrariesThe list of used R libraries can be found in Table 4.
Library Use
googlesheets4 Interactivity with Google Sheets
25

tidyverse Allows processing of data frames andtibbles [3] (an alternative form of R dataframe) from the Excel documents
readxl Allows reading of Excel
shiny Default R Shiny package
shinyFiles Allows users to upload and download files
openxlsx Another Excel reading package
ggplot2 Graph plotter
shinyWidgets Quality of life widgets
shinydashboard Layout and other functionality
shinydashboardPlus Layout and other functionality
rjson Allows the parsing of JSON data
plotly Used for creation of interactive maps.
Table 4. R libraries used by our project
26

8.3 R Shiny UIThe UI can be thought of as one giant page, with many different tabs/pages. The mainUI element contains every subelement that can be accessed on the page. Navigationtakes place using the dashboardSidebar and menuItems, with links to thecorresponding tabItem pages. This means that adding a new page, or changing thename of an existing page, is very easy to do. Removing a page is also simply a matterof removing all tabItems and menuItems that have the name of that page. Thus, toremove the About page, just remove any menuItem that has the ‘about’ link, and anytabItem that has the tabName ‘about’.
The UI makes it simple to interact with the server portion as well. Using R Shiny’s builtin reactivity, most of the hard work is already done. Simply using input and outputvariables as per the R Shiny standard will achieve virtually any additional functionalitydown the line.
8.4 R Shiny ServerThe server can be thought of as an amalgamation of all of the reactive input andoutputs, and the API calls to the Google Sheets. Conveniently enough, Google Sheetsis simple to integrate with using the googlesheets4 library, by simply copying over thevalue in the Google Sheet URL between the /d/ and the /edit/. Once this is done, it caneasily be read from using the read_sheet after setting the range to be the sheet name.
As far as interactivity with the UI, using the R Shiny input and output variables is thedesired method. It integrates seamlessly and requires minimal coding to achieve. Whenadding new features, in order to make it interactive the server needs to have some sortof render function around it such as renderUI, renderTable, renderText, etc. Additionally,in the UI it needs to have an output function like plotOutput, tableOutput, imageOutput,textOutput, etc. For example, if one wanted to add some text to the UI, they could do soby adding the following in UI.R: “textOutput("example")” And in server.R:“output$example <- renderText("rendering this text")”. The string inside thetextOutput(“example”) function is how the server communicates what function isattached to it. It must match the value seen in the output$example. It does not have tobe “example”, but it must be the same in both the UI and the Server. This tells the RShiny platform how to interact with the data that it parses, and how to display it. Addingnew features to the server is not particularly difficult, and more features can be addedmodularly [2].
27

8.5 Additional ScriptsInside the project there are several additional scripts, shown in Table 5, that are used inthe process of creating maps, validating data, formatting data, and uploading data. Eachof these scripts has a README in the same directory as them, detailing how to useeach script, and what they do.
Script Location Function
format_one.py priondatabase/unvalidatedSubmissions This is called by the shellscript to format a single.xlsx or .xls sheet to beusable. It leaves theformatted file in theunvalidatedSubmissions/formatted directory, and acopy of the raw data in theunvalidatedSubmissions/unformatted_raw directory.
format_all.sh priondatabase/unvalidatedSubmissions This shell script callsformat_one.py on all of the.xlsx and .xls files in thecurrent directory (the filesthat have been submittedthrough the website but notprocessed yet).
This is the intended way toprocess all of the files.Even if there is only onefile in the directory, it isintended to either doubleclick on this script in the fileexplorer or run>sh formate_all.shin the terminal.
validate.py priondatabase/unvalidatedSubmissions/formatted
This Python script willvalidate a specific .xls or.xlsx file and move it to thevalidatedFiles/ directory.This script only acceptsone input at a time andexpects manual review
28

before using this script onthe Excel sheet. This helpsprevent potential errorsthat may have slippedthrough, and allows thereviewer to be able tocontact the submitter forany changes that mayneed to be done.
upload.R priondatabase/validatedFiles This R script is used toupload all of the .xls and.xlsx sheets in the directoryto the Google Sheetsdatabase. It is CRUCIALthat no data be addedstraight here, as the lack ofvalidation is likely to causeissues down the line.
Once this is called, thedata is also copied to thepriondatabase/unvalidatedSubmissions/Submitted_Data directory as a backup.
This means that ifsomething goes wrong withthe database, there is stilla record of everything thathas been uploaded, and arecovery can likely bedone.
makeMaps.R priondatabase/savedMaps This R script is used tomake the maps for thetesting history. It willoverwrite the current mapsto be up to date with thelatest Google Sheets data.It only needs to be run anytime something isuploaded to the database.
To change the scale, editthe mapTestsZ,
29

mapPositivesZ, andmapNegativesZ values.Making this smaller willmake more changes visibleon the map, but obscureareas with high amounts ofthat criteria.
This script can be runindependently of the RShiny application and whilethe server is running.
One thing to note is thatsince making these mapsis computationallyexpensive, it will take quitea bit of time to computethese maps. Additionally,since they are permanentlystored, they do occupy discspace as well.
Table 5. Additional scripts used by our application
30

9. Lessons Learned
Throughout the process of creating this project, many lessons were learned. The projecthas been successful in gathering a substantial amount of data. As of the time of writingthis, information on ~300k tests have been added to the database for analysis. Themechanisms for adding them to the database and analyzing them have worked well andare capable of handling all of the incoming data.
9.1 Schedule● 1/21: Initial client contact via email● 2/10: First client meeting and finalized project proposal● 2/16: Presentation 1 - Initial project designs and client expectations● 2/19: Established weekly meeting with client● 2/22: Began sending emails for data requests● 2/28: Forwarded emails requesting more information to client● 3/2: Connected R Shiny database with Google Sheets backend data storage● 3/12: Added the data obtained from emails into Google Sheets● 3/19: Completed work on new UI frontend and graphs● 3/24: Met with client to show MVP● 3/30: Presentation 2 - Work completed and worked left to complete● 4/2: Set up backend functions in Google Sheets for data analysis● 4/6: Completed upload functionality on the backend● 4/8: Interim report and methodology completed● 4/12: Initial map implementation finished● 4/14: Began final bar graphs implementation● 4/21: Map design finalized
9.2 ProblemsAlong the way, some problems have been encountered. In the case of this project, themajor problems that were encountered were lack of knowledge about R Shiny, and poorresponse rate from states in the preliminary data collection phase.
With R Shiny, many powerful applications can be constructed, but it took us severalweeks to meaningfully understand the application as none of us had any experience ineither R or R Shiny. Once this hurdle was overcome however, much of the projectbegan rapidly progressing.
31

With the data collection, simply getting a response was the difficult part. 66% percent ofstates did not respond or were not able to be contacted due to outdated contactinformation. 10% requested data share agreements that could not be completed withinthe allocated project time. The remaining 24% shared data, and as much of it wasprocessed as time permitted. Specifically, South Carolina and Indiana have not beenprocessed and added to the database. South Carolina will require slight reworking ofthe excel sheet, but will otherwise be a simple matter of moving some values around.Indiana will require converting from pdf to excel and adding the necessary information.
Despite these setbacks, meaningful progress was made in the creation of the database,and the team has worked hard to achieve the MVP in time for the final submission.
32

10. Acknowledgements
We would like to acknowledge our client Dr. Luis Escobar and his assistant MarianaCastaneda-Guzman.
Both are members of the Fishing and Wildlife Conservation Department at VirginiaTech. Dr. Escobar specializes in research about the distribution of biodiversity in spaceand time, including parasites and other pathogens at global scales. His work seeks tobetter map and understand the future spread and predictability of different diseases andpathogens.
Dr. Luis EscobarAssistant Professor in the Department of Fish and Wildlife Conservation at Virginia TechPhone Number: (540) 232-8454Email: [email protected] Website: https://fishwild.vt.edu/faculty/escobar.htmlLab Website: https://ecoguate2003.wixsite.com/escobar
Mariana Castaneda-GuzmanM.Sc. Student Department of Fish and Wildlife Conservation at Virginia TechEmail: [email protected]
33

11. References[1] CWD Alliance. (2021). CWD-Info.org - Chronic Wasting Disease Alliance. RetrievedApril 7, 2021 from http://cwd-info.org/
[2] RStudio. (2021). Shiny. Retrieved May 05, 2021, from https://shiny.rstudio.com/
[3] Wickham, H., & Grolemund, G. (2017). R for data science: Import, tidy, transform,visualize and model data. Sebastopol, California: O'Reilly.
34

12. AppendixAppendix A: CWD Template Email
35