price outlook, 2015 and beyond 2015 great lakes professional cattle feeding and marketing...
TRANSCRIPT

Price Outlook, 2015 and Beyond
2015 GREAT LAKES PROFESSIONALCATTLE FEEDING AND MARKETING SHORTCOURSE
East Lansing, MI Bowling Green, OH Wyoming, ON
Jim Hilker Agricultural, Food, and Resource Economics Department Michigan State UniversityFebruary 10, 11, 12, 2015

Topics: Cattle Price Drivers and …
• Beef Demand– Domestic– Foreign Markets and Competition
• Some Feedstuffs Comments• Poultry and Pork Production• More on Cattle Markets
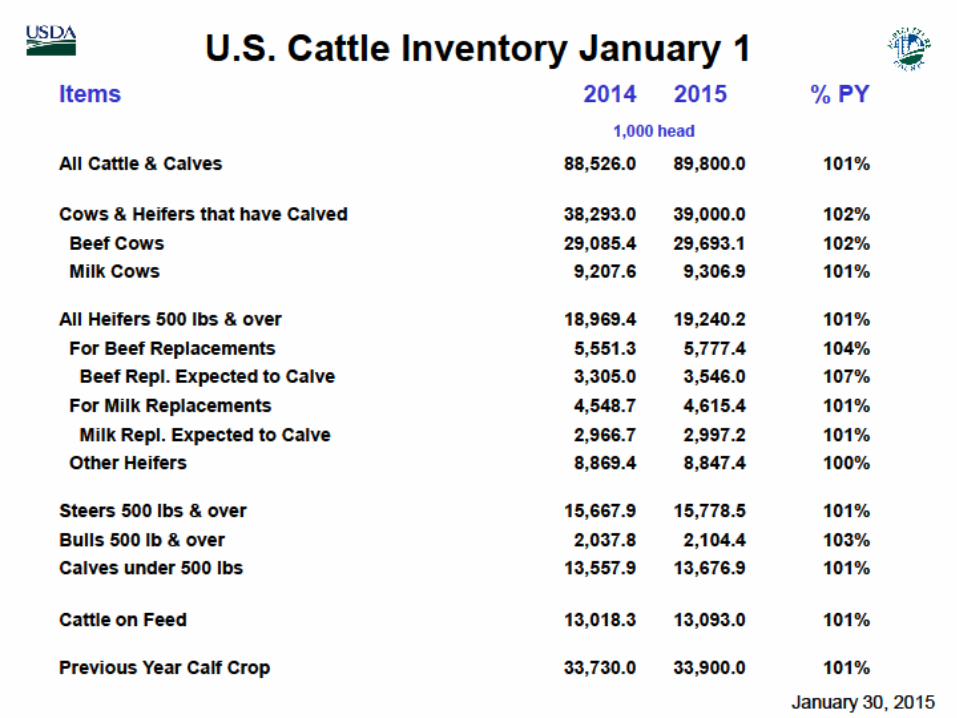
– Review Price Levels– U.S. Cattle Inventory– Cost and Return Prospects– Price Outlook
• Summary: The Economic Environment
USDA Data Sources – NASS, AMS, FAS, and ERS
Most Forecasts – LMIC
US Consumer Demand and Consumption (Disappearance)
-2.50
-2.00
-1.50
-1.00
-0.50
0.00
0.50
1.00
1.50
2.00
2.50
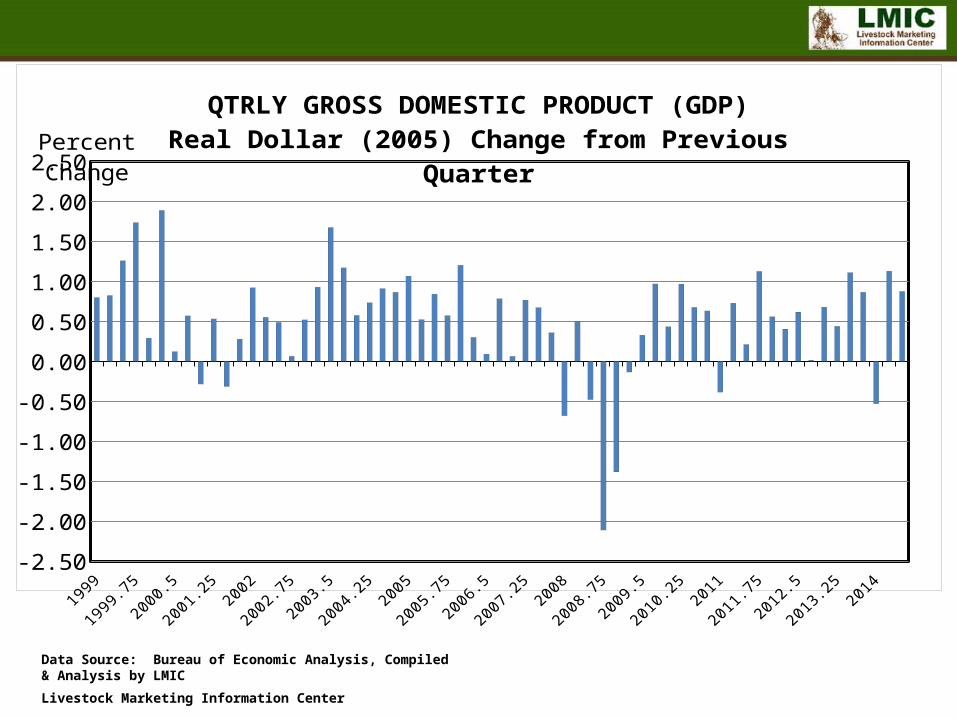
QTRLY GROSS DOMESTIC PRODUCT (GDP)Real Dollar (2005) Change from Previous QuarterPercent Change
Data Source: Bureau of Economic Analysis, Compiled & Analysis by LMIC
Livestock Marketing Information Center
2005
2005.52006
2006.52007
2007.52008
2008.52009
2009.52010
2010.52011
2011.52012
2012.52013
2013.52014
2014.530000
32000
34000
36000
38000
40000
42000
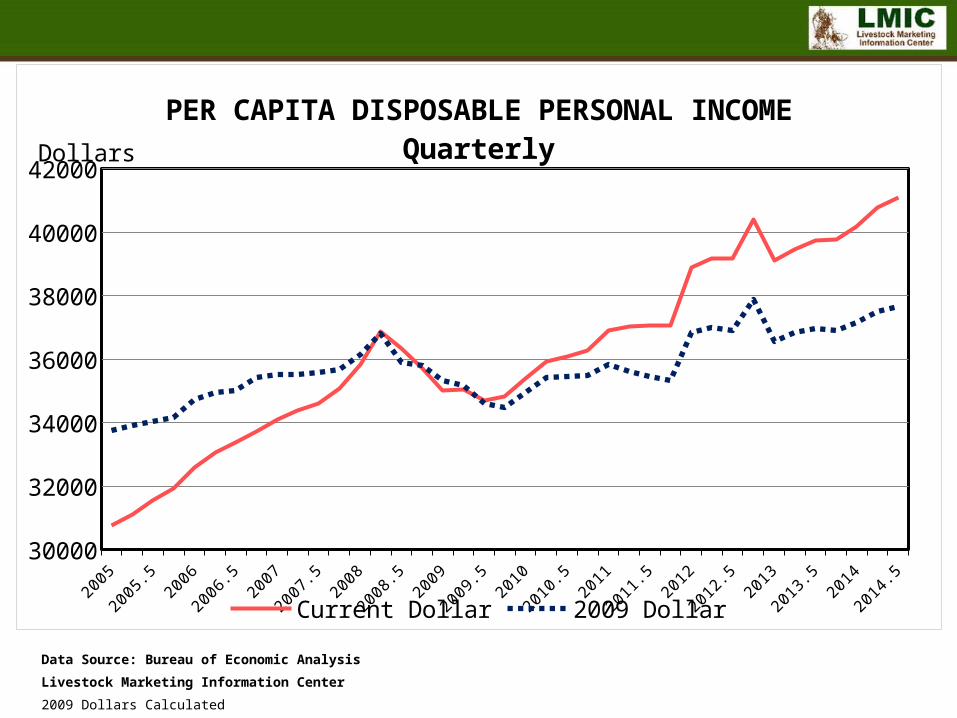
PER CAPITA DISPOSABLE PERSONAL INCOMEQuarterly
Current Dollar 2009 Dollar
Dollars
Data Source: Bureau of Economic Analysis
Livestock Marketing Information Center
2009 Dollars Calculated

2 2 2 2 2 2 2 2 2 2 2 2 2 2 2 2 2 2 2 2 2 2 2 2 2 2 2 2 23.0
4.0
5.0
6.0
7.0
8.0
9.0
10.0
11.0
U.S. UNEMPLOYMENT RATESeasonally Adjusted, QuarterlyPercent
Data Source: Bureau of Labor Statistics, Compiled & Analysis by LMIC
Livestock Marketing Information Center
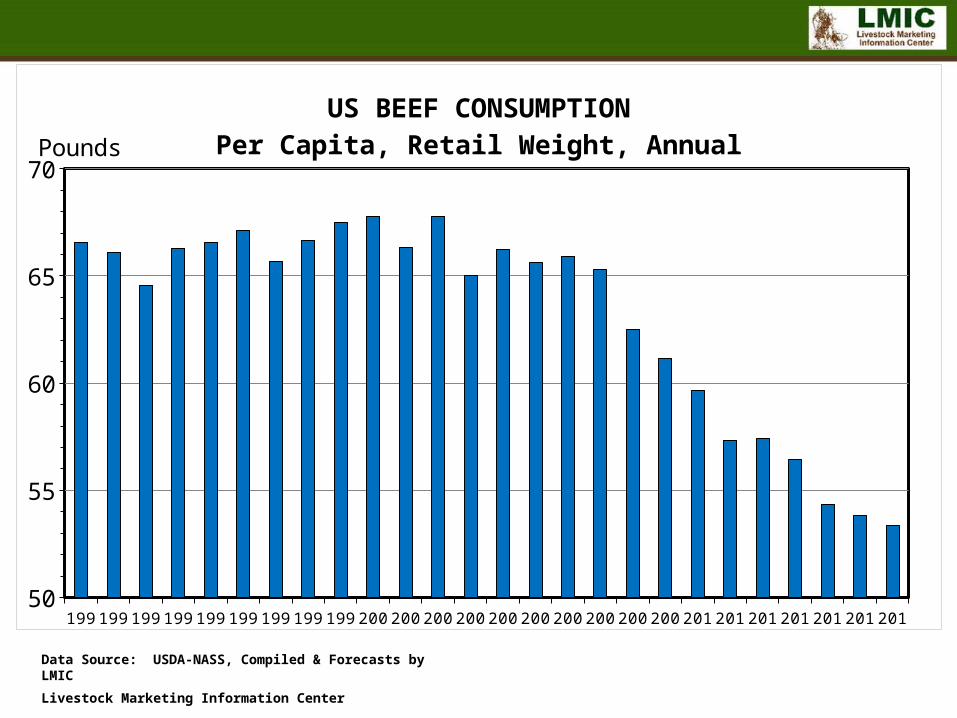
1991199219931994199519961997199819992000200120022003200420052006200720082009201020112012201320142015201650
55
60
65
70
US BEEF CONSUMPTIONPer Capita, Retail Weight, AnnualPounds
Data Source: USDA-NASS, Compiled & Forecasts by LMIC
Livestock Marketing Information Center
19901991199219931994199519961997199819992000200120022003200420052006200720082009201020112012201320140
20
40
60
80
100
120
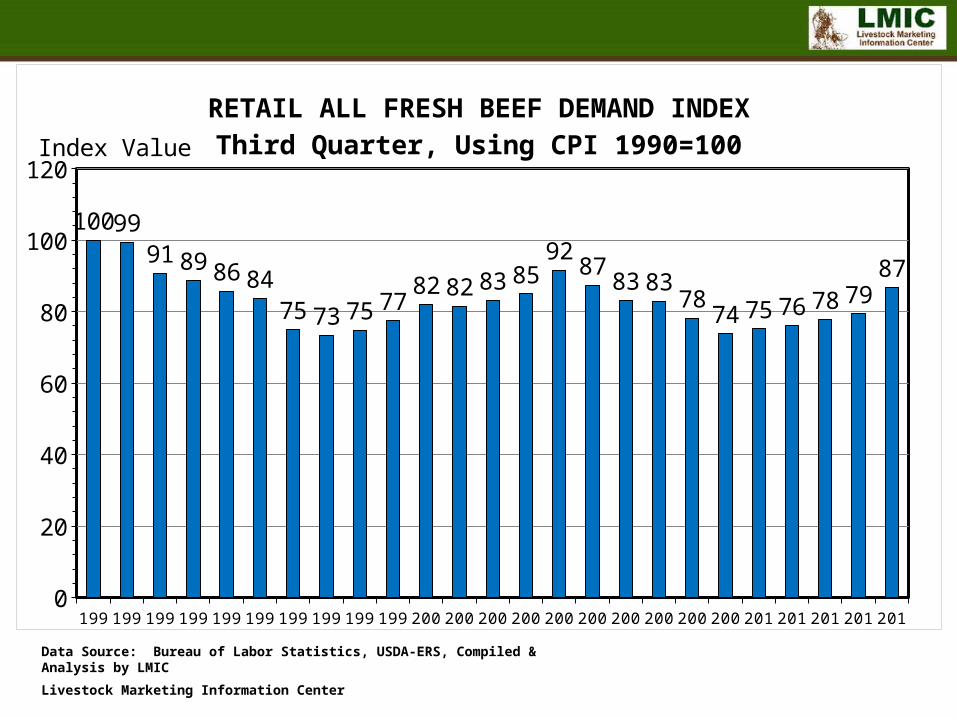
100 9991 89 86 84
75 73 75 7782 82 83 85
9287
83 8378
74 75 76 78 7987
RETAIL ALL FRESH BEEF DEMAND INDEXThird Quarter, Using CPI 1990=100Index Value
Data Source: Bureau of Labor Statistics, USDA-ERS, Compiled & Analysis by LMIC
Livestock Marketing Information Center
19901991199219931994199519961997199819992000200120022003200420052006200720082009201020112012201320140
20
40
60
80
100
120
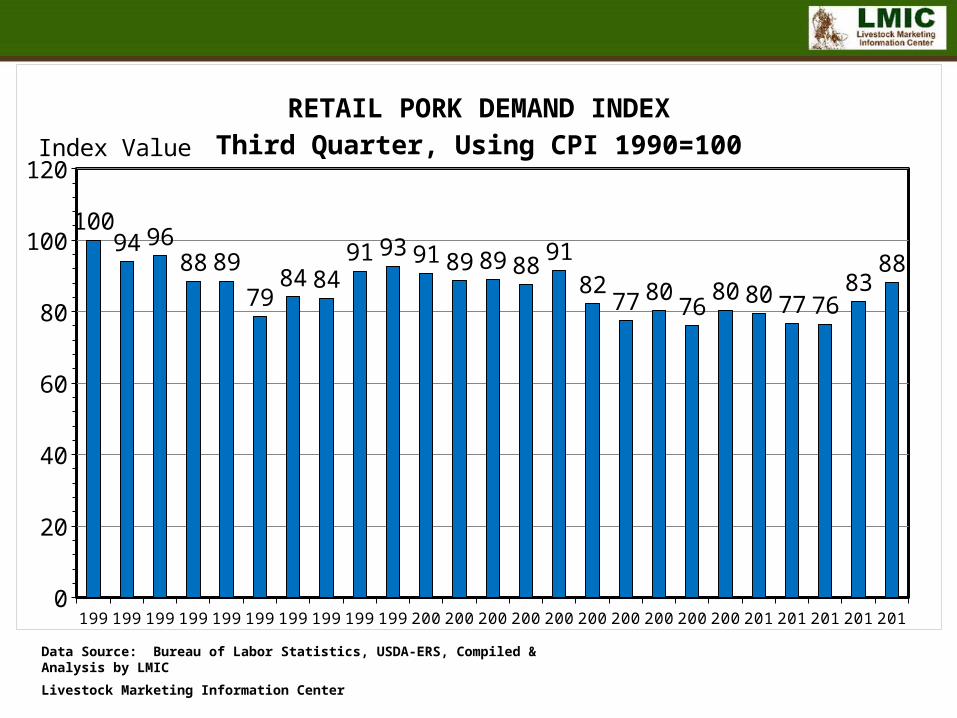
10094 96
88 8979
84 8491 93 91 89 89 88 91
8277 80
7680 80 77 76
8388
RETAIL PORK DEMAND INDEXThird Quarter, Using CPI 1990=100Index Value
Data Source: Bureau of Labor Statistics, USDA-ERS, Compiled & Analysis by LMIC
Livestock Marketing Information Center

International Perspective

199119921993199419951996199719981999200020012002200320042005200620072008200920102011201220132014201520160.0
500.0
1,000.0
1,500.0
2,000.0
2,500.0
3,000.0
US BEEF AND VEAL EXPORTSCarcass Weight, AnnualBil. Pounds
Data Source: USDA-ERS & USDA-FAS, Compiled & Analysis by LMIC
Livestock Marketing Information Center
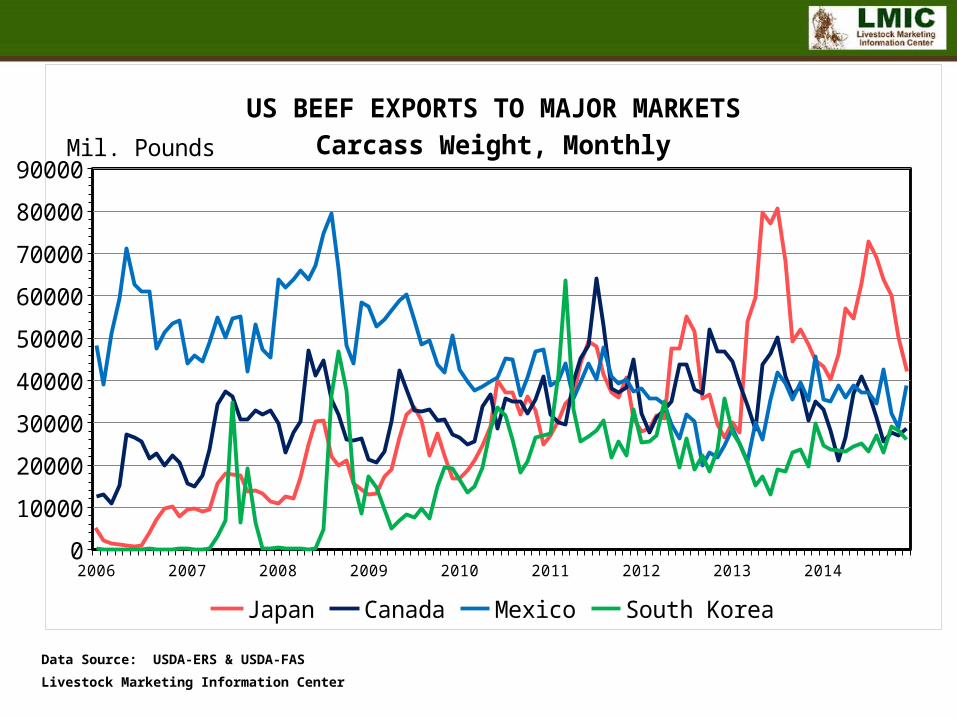
2006 2007 2008 2009 2010 2011 2012 2013 20140
10000
20000
30000
40000
50000
60000
70000
80000
90000
US BEEF EXPORTS TO MAJOR MARKETSCarcass Weight, Monthly
Japan Canada Mexico South Korea
Mil. Pounds
Data Source: USDA-ERS & USDA-FAS
Livestock Marketing Information Center

199119921993199419951996199719981999200020012002200320042005200620072008200920102011201220132014201520161,500.0
2,000.0
2,500.0
3,000.0
3,500.0
4,000.0
US BEEF AND VEAL IMPORTSCarcass Weight, AnnualBil. Pounds
Data Source: USDA-ERS & USDA-FAS, Compiled & Analysis by LMIC
Livestock Marketing Information Center
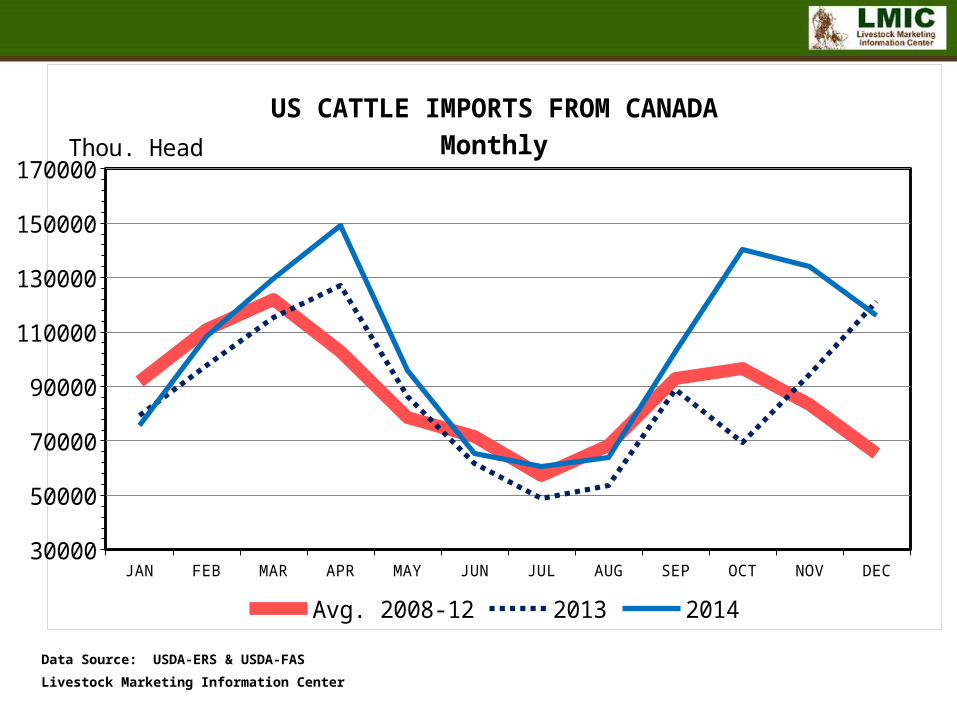
JAN FEB MAR APR MAY JUN JUL AUG SEP OCT NOV DEC30000
50000
70000
90000
110000
130000
150000
170000
US CATTLE IMPORTS FROM CANADAMonthly
Avg. 2008-12 2013 2014
Thou. Head
Data Source: USDA-ERS & USDA-FAS
Livestock Marketing Information Center

JAN FEB MAR APR MAY JUN JUL AUG SEP OCT NOV DEC30000
50000
70000
90000
110000
130000
150000
170000
US CATTLE IMPORTS FROM MEXICOMonthly
Avg. 2008-12 2013 2014
Thou. Head
Data Source: USDA-ERS & USDA-FAS
Livestock Marketing Information Center
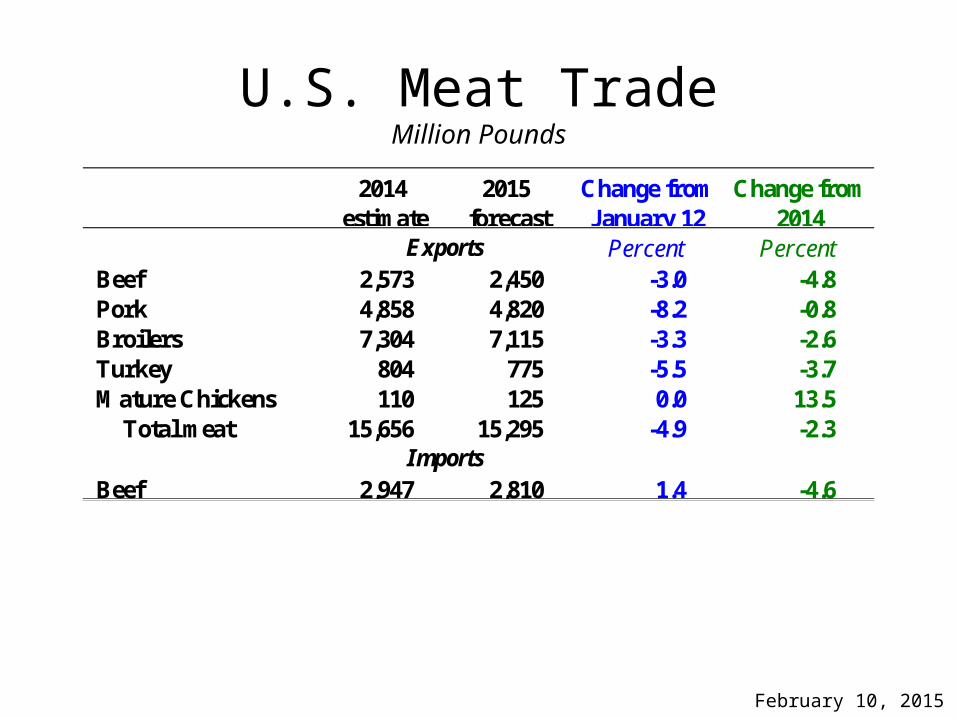
U.S. Meat TradeMillion Pounds
February 10, 2015
2014 estimate
2015 forecast
Change from January 12
Change from 2014
Exports Percent PercentBeef 2,573 2,450 -3.0 -4.8Pork 4,858 4,820 -8.2 -0.8Broilers 7,304 7,115 -3.3 -2.6Turkey 804 775 -5.5 -3.7Mature Chickens 110 125 0.0 13.5
Total meat 15,656 15,295 -4.9 -2.3Imports
Beef 2,947 2,810 1.4 -4.6
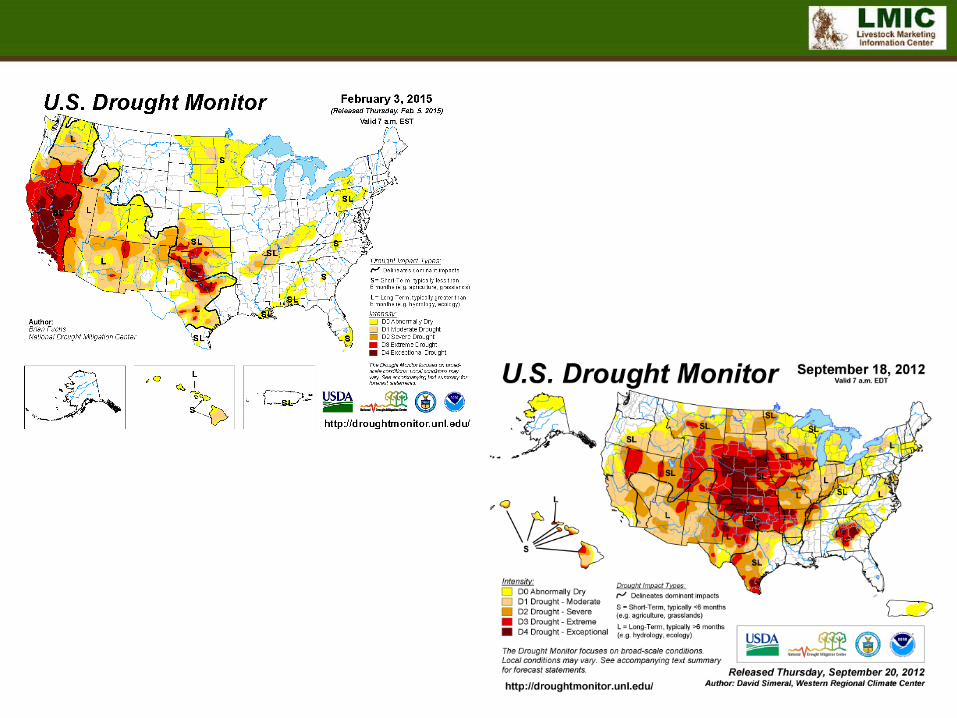
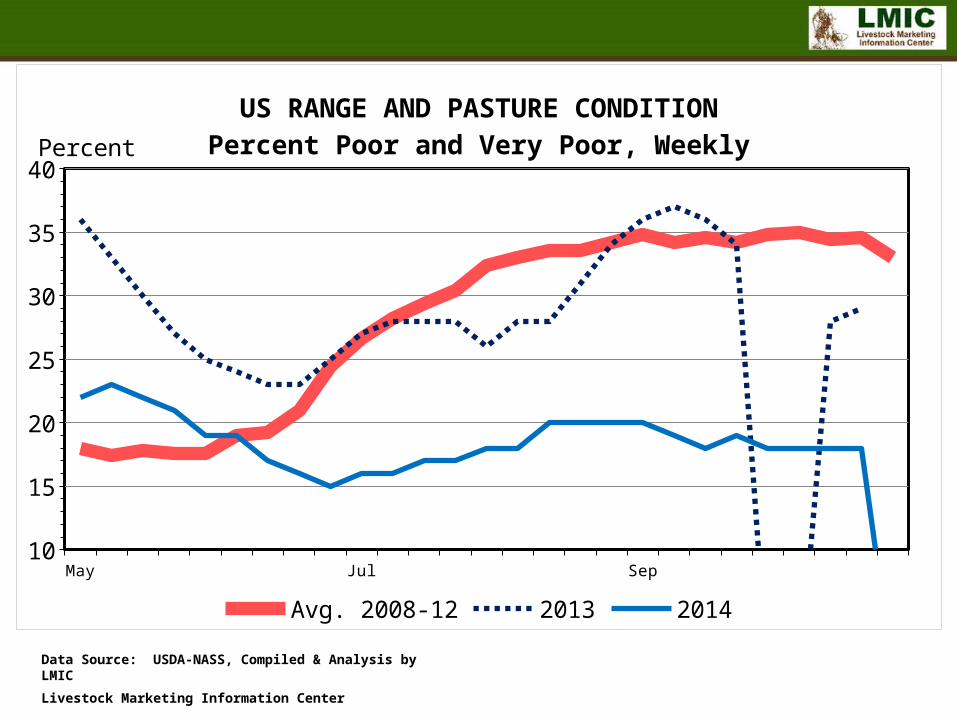
Feedstuffs -- Corn
May Jul Sep10
15
20
25
30
35
40
US RANGE AND PASTURE CONDITIONPercent Poor and Very Poor, Weekly
Avg. 2008-12 2013 2014
Percent
Data Source: USDA-NASS, Compiled & Analysis by LMIC
Livestock Marketing Information Center
JAN APR JUL OCT1.50
2.50
3.50
4.50
5.50
6.50
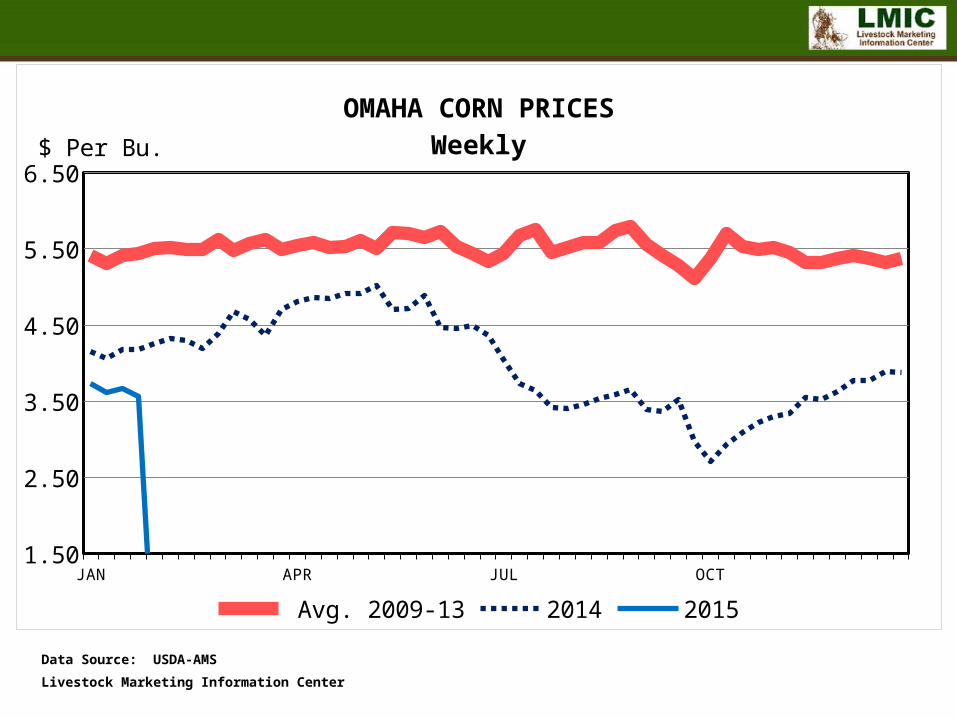
OMAHA CORN PRICESWeekly
Avg. 2009-13 2014 2015
$ Per Bu.
Data Source: USDA-AMS
Livestock Marketing Information Center
JAN APR JUL OCT300
350
400
450
500
550
600
650
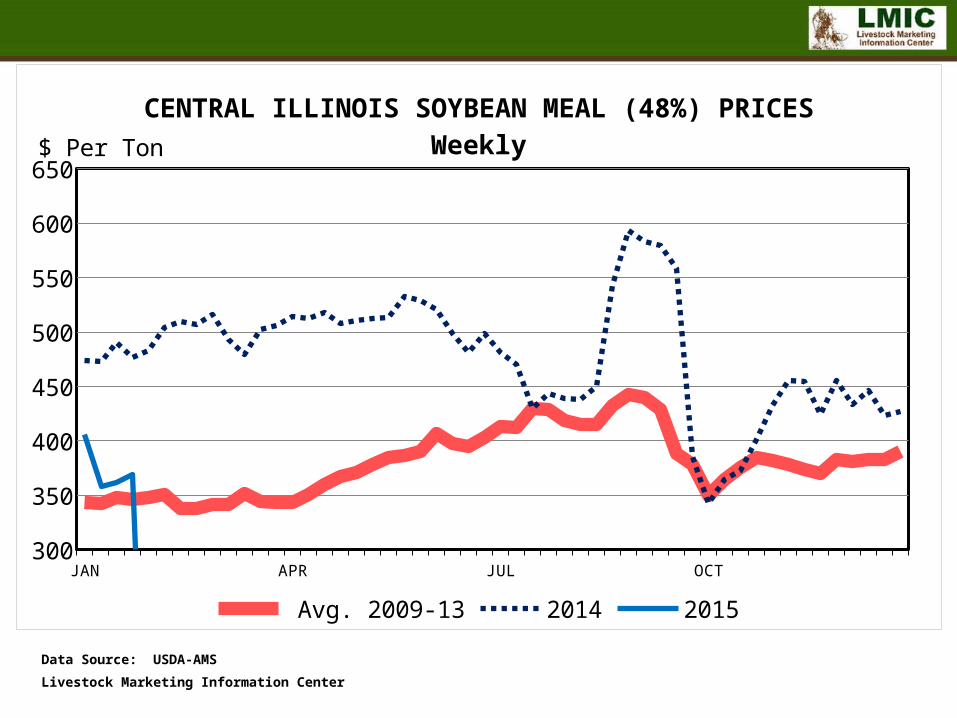
CENTRAL ILLINOIS SOYBEAN MEAL (48%) PRICESWeekly
Avg. 2009-13 2014 2015
$ Per Ton
Data Source: USDA-AMS
Livestock Marketing Information Center

8000
9000
10000
11000
12000
13000
14000
15000
16000
0.00
1.00
2.00
3.00
4.00
5.00
6.00
7.00
8.00
US TOTAL CORN SUPPLY AND PRICECrop Year
Supply Price
Bil. Bushels $ Per Bushel
Data Source: USDA-NASS, Compiled & Forecasts by LMIC
Livestock Marketing Information Center
0.0
2,000.0
4,000.0
6,000.0
8,000.0
10,000.0
12,000.0
14,000.0
16,000.0
18,000.0
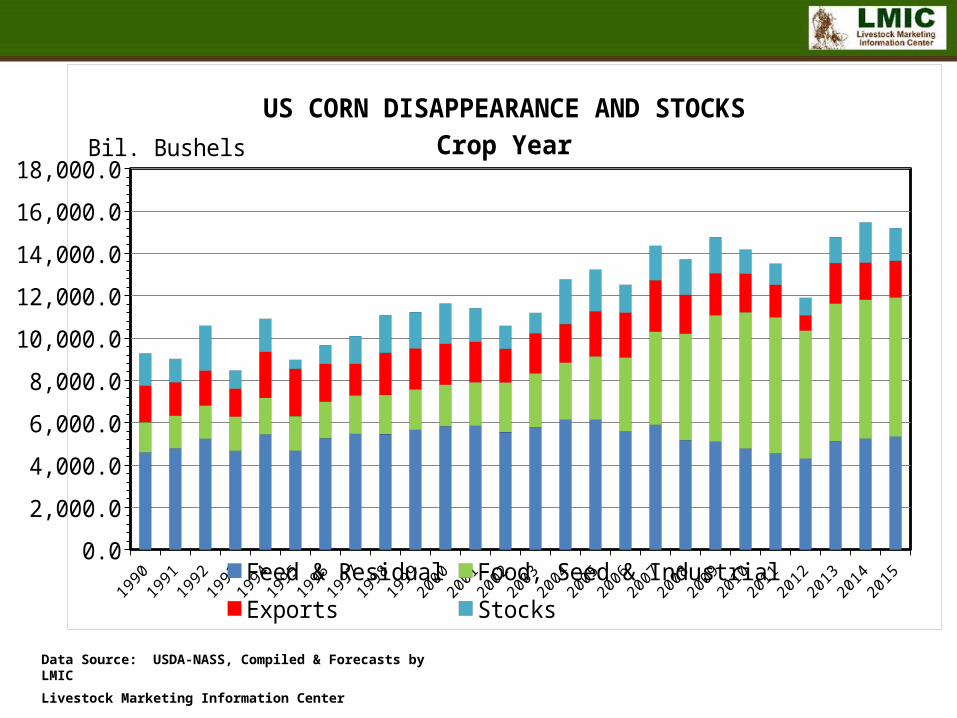
US CORN DISAPPEARANCE AND STOCKSCrop Year
Feed & Residual Food, Seed & IndustrialExports Stocks
Bil. Bushels
Data Source: USDA-NASS, Compiled & Forecasts by LMIC
Livestock Marketing Information Center
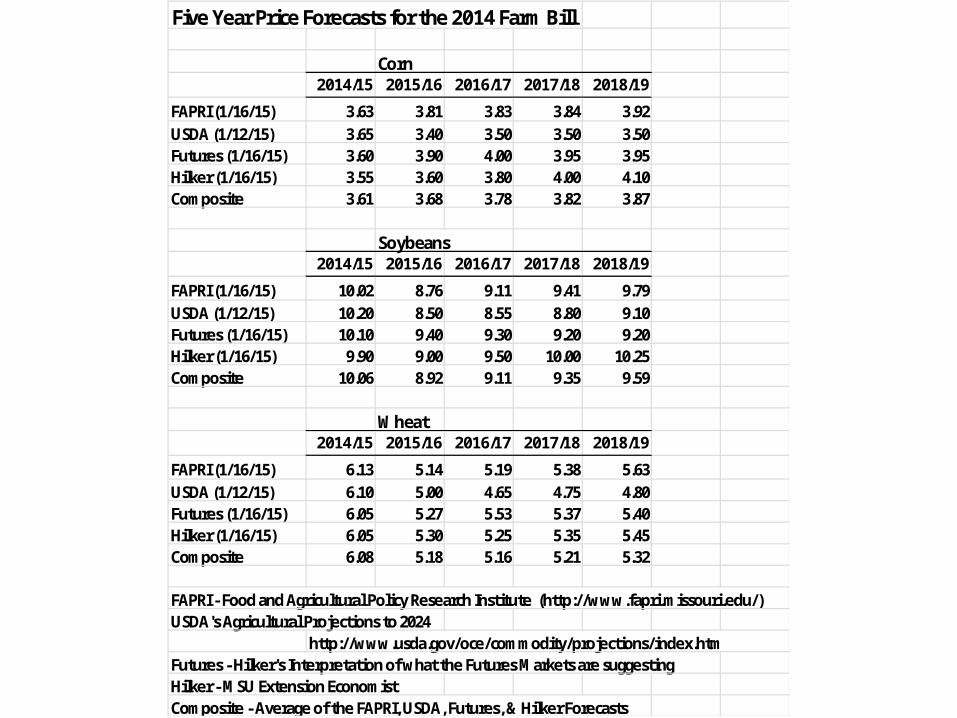
Five Year Price Forecasts for the 2014 Farm Bill
Corn2014/15 2015/16 2016/17 2017/18 2018/19
FAPRI (1/16/15) 3.63 3.81 3.83 3.84 3.92USDA (1/12/15) 3.65 3.40 3.50 3.50 3.50Futures (1/16/15) 3.60 3.90 4.00 3.95 3.95Hilker (1/16/15) 3.55 3.60 3.80 4.00 4.10Composite 3.61 3.68 3.78 3.82 3.87
Soybeans2014/15 2015/16 2016/17 2017/18 2018/19
FAPRI (1/16/15) 10.02 8.76 9.11 9.41 9.79USDA (1/12/15) 10.20 8.50 8.55 8.80 9.10Futures (1/16/15) 10.10 9.40 9.30 9.20 9.20Hilker (1/16/15) 9.90 9.00 9.50 10.00 10.25Composite 10.06 8.92 9.11 9.35 9.59
Wheat2014/15 2015/16 2016/17 2017/18 2018/19
FAPRI (1/16/15) 6.13 5.14 5.19 5.38 5.63USDA (1/12/15) 6.10 5.00 4.65 4.75 4.80Futures (1/16/15) 6.05 5.27 5.53 5.37 5.40Hilker (1/16/15) 6.05 5.30 5.25 5.35 5.45Composite 6.08 5.18 5.16 5.21 5.32
FAPRI - Food and Agricultural Policy Research Institute (http://www.fapri.missouri.edu/)USDA's Agricultural Projections to 2024
http://www.usda.gov/oce/commodity/projections/index.htmFutures - Hilker's Interpretation of what the Futures Markets are suggestingHilker - MSU Extension EconomistComposite - Average of the FAPRI, USDA, Futures, & Hilker Forecasts

Poultry and Pork
JAN APR JUL OCT140
160
180
200
220
240
260
280
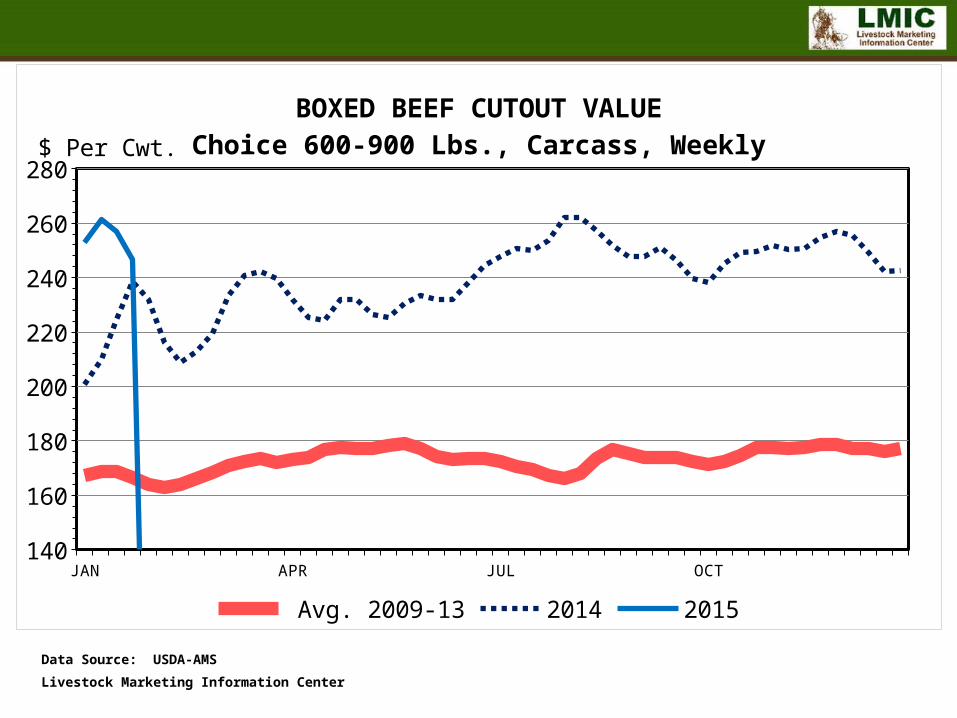
BOXED BEEF CUTOUT VALUEChoice 600-900 Lbs., Carcass, Weekly
Avg. 2009-13 2014 2015
$ Per Cwt.
Data Source: USDA-AMS
Livestock Marketing Information Center
JAN 0 0 0 0 0 0 0 0 0 0 0 0
JUL 0 0 0 0 0 0 0 0 0 0 0 0
110
120
130
140
150
160
170
180
190
200
210
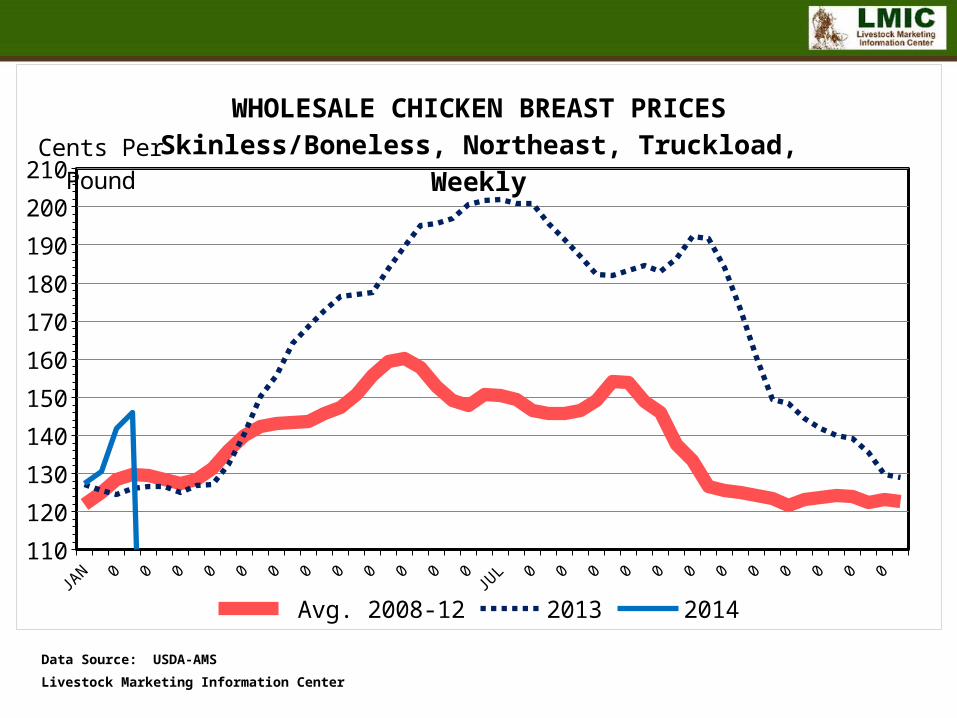
WHOLESALE CHICKEN BREAST PRICESSkinless/Boneless, Northeast, Truckload, Weekly
Avg. 2008-12 2013 2014
Cents Per Pound
Data Source: USDA-AMS
Livestock Marketing Information Center
JAN-MAR APR-JUN JUL-SEP OCT-DEC8,600.0
8,800.0
9,000.0
9,200.0
9,400.0
9,600.0
9,800.0
10,000.0
10,200.0
10,400.0
RTC BROILER PRODUCTIONQuarterly
Avg. 2009/13 2014 2015 2016
Bil. Pounds
Data Source: USDA-NASS, Compiled & Analysis by LMIC
Livestock Marketing Information Center

JAN FEB MAR APR MAY JUN JUL AUG SEP OCT NOV DEC450000
500000
550000
600000
650000
700000
US BROILER EXPORTSRTC Weight, Monthly
Avg. 2008-12 2013 2014
Mil. Pounds
Data Source: USDA-ERS & USDA-FAS
Livestock Marketing Information Center
JAN APR JUL OCT65
75
85
95
105
115
125
135
145
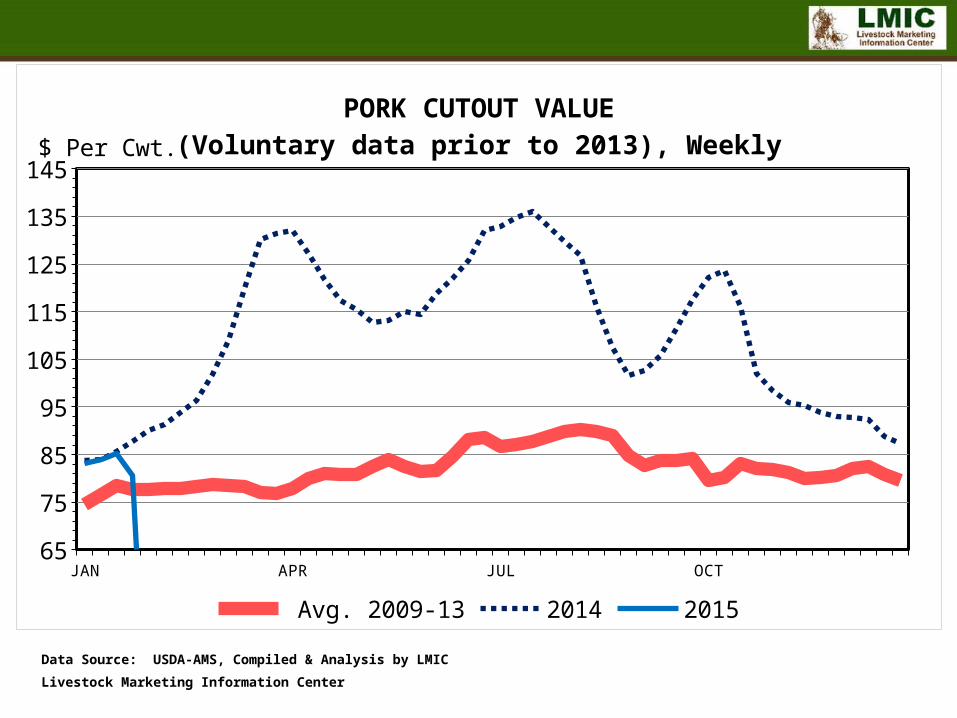
PORK CUTOUT VALUE(Voluntary data prior to 2013), Weekly
Avg. 2009-13 2014 2015
$ Per Cwt.
Data Source: USDA-AMS, Compiled & Analysis by LMIC
Livestock Marketing Information Center
JAN-MAR APR-JUN JUL-SEP OCT-DEC5000
5200
5400
5600
5800
6000
6200
6400
6600
6800
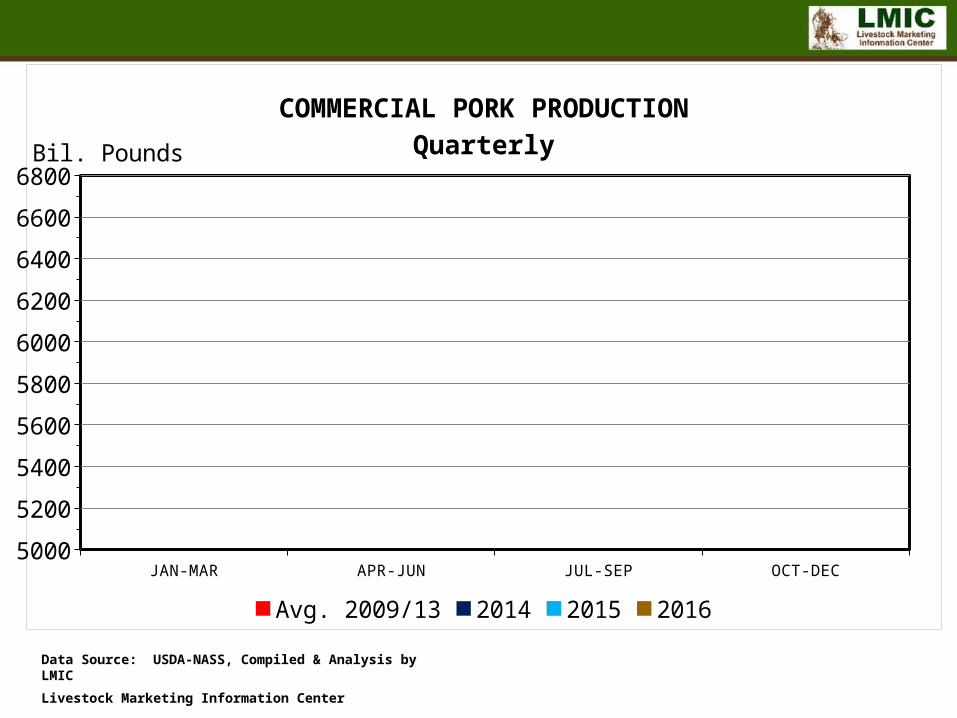
COMMERCIAL PORK PRODUCTIONQuarterly
Avg. 2009/13 2014 2015 2016
Bil. Pounds
Data Source: USDA-NASS, Compiled & Analysis by LMIC
Livestock Marketing Information Center
JAN FEB MAR APR MAY JUN JUL AUG SEP OCT NOV DEC325000
350000
375000
400000
425000
450000
475000
500000
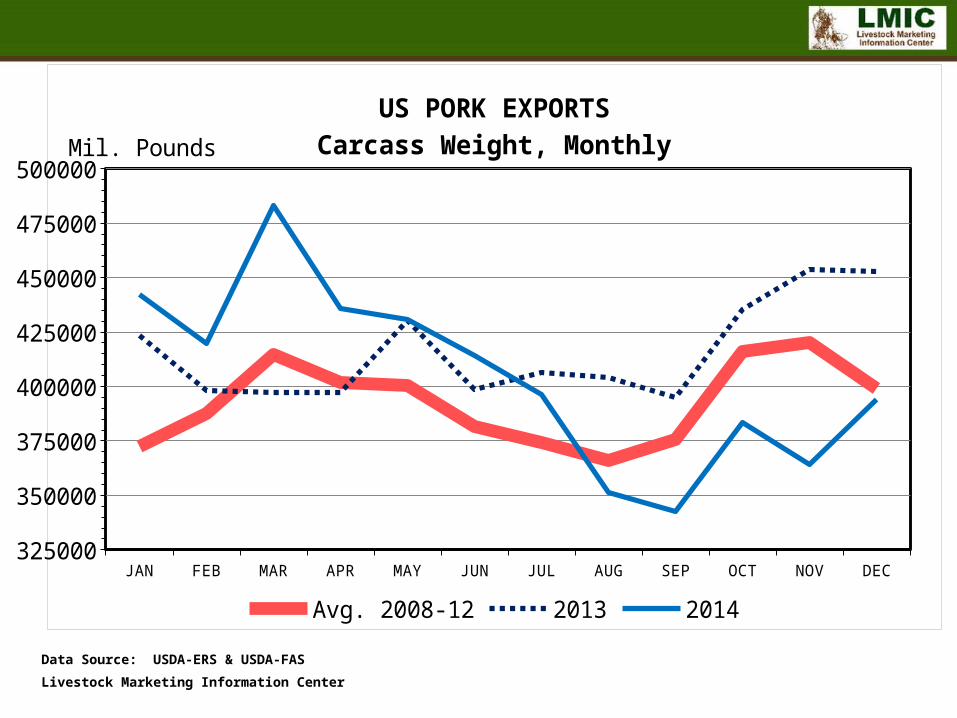
US PORK EXPORTSCarcass Weight, Monthly
Avg. 2008-12 2013 2014
Mil. Pounds
Data Source: USDA-ERS & USDA-FAS
Livestock Marketing Information Center

JAN-MAR APR-JUN JUL-SEP OCT-DEC21,500.0
22,000.0
22,500.0
23,000.0
23,500.0
24,000.0
24,500.0
25,000.0
TOTAL RED MEAT & POULTRY PRODUCTIONQuarterly
Avg. 2009/13 2014 2015 2016
Bil. Pounds
Data Source: USDA-NASS, Compiled & Analysis by LMIC
Livestock Marketing Information Center

Cattle

C-M-1101/23/15
JAN FEB MAR APR MAY JUN JUL AUG SEP OCT NOV DEC1,450.0
1,550.0
1,650.0
1,750.0
1,850.0
1,950.0
2,050.0
FED CATTLE MARKETINGSUS Total, Monthly
Avg. 2008/12 2013 2014
Mil. Head
Data Source: USDA-NASS
Livestock Marketing Information Center
C-M-2301/23/15
JAN FEB MAR APR MAY JUN JUL AUG SEP OCT NOV DEC13
14
15
16
17
18
19
20
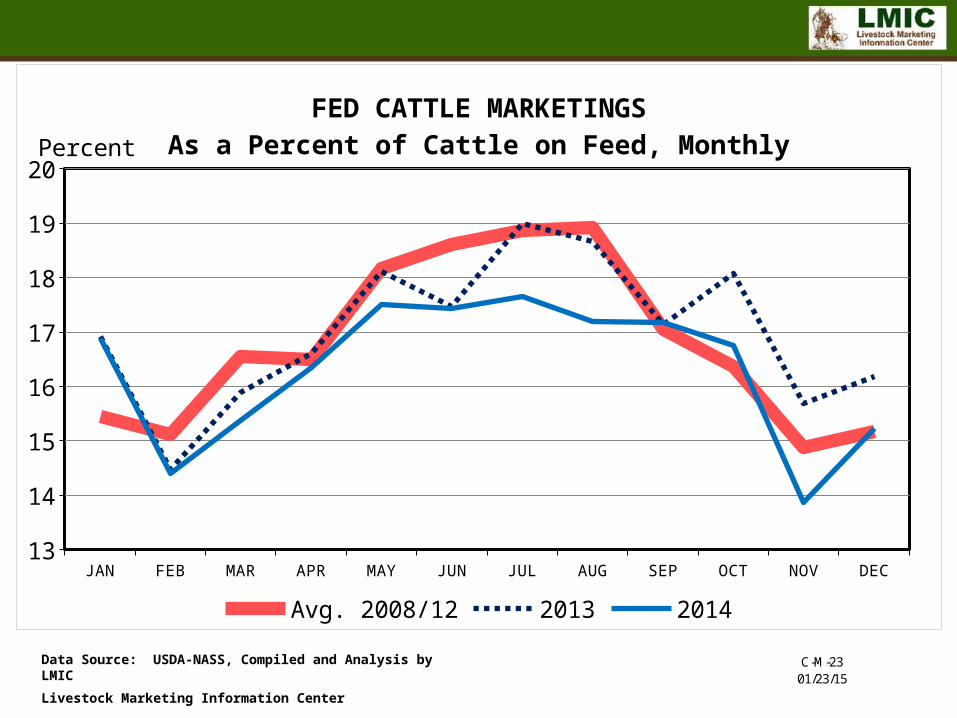
FED CATTLE MARKETINGSAs a Percent of Cattle on Feed, Monthly
Avg. 2008/12 2013 2014
Percent
Data Source: USDA-NASS, Compiled and Analysis by LMIC
Livestock Marketing Information Center
C-N-0801/23/15
JAN FEB MAR APR MAY JUN JUL AUG SEP OCT NOV DEC1300
1500
1700
1900
2100
2300
2500
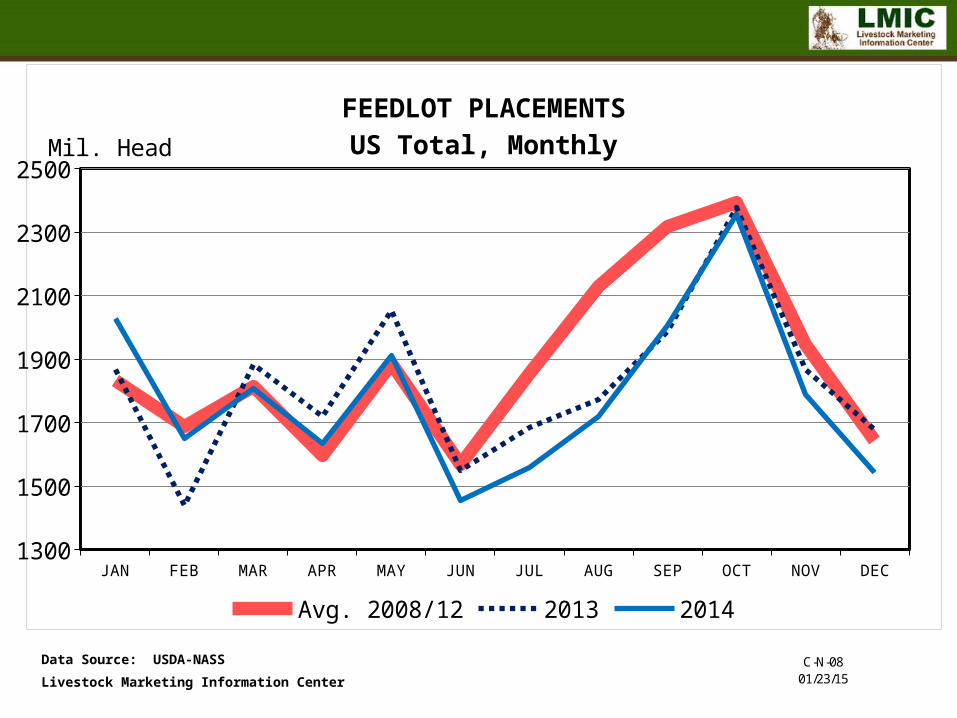
FEEDLOT PLACEMENTSUS Total, Monthly
Avg. 2008/12 2013 2014
Mil. Head
Data Source: USDA-NASS
Livestock Marketing Information Center
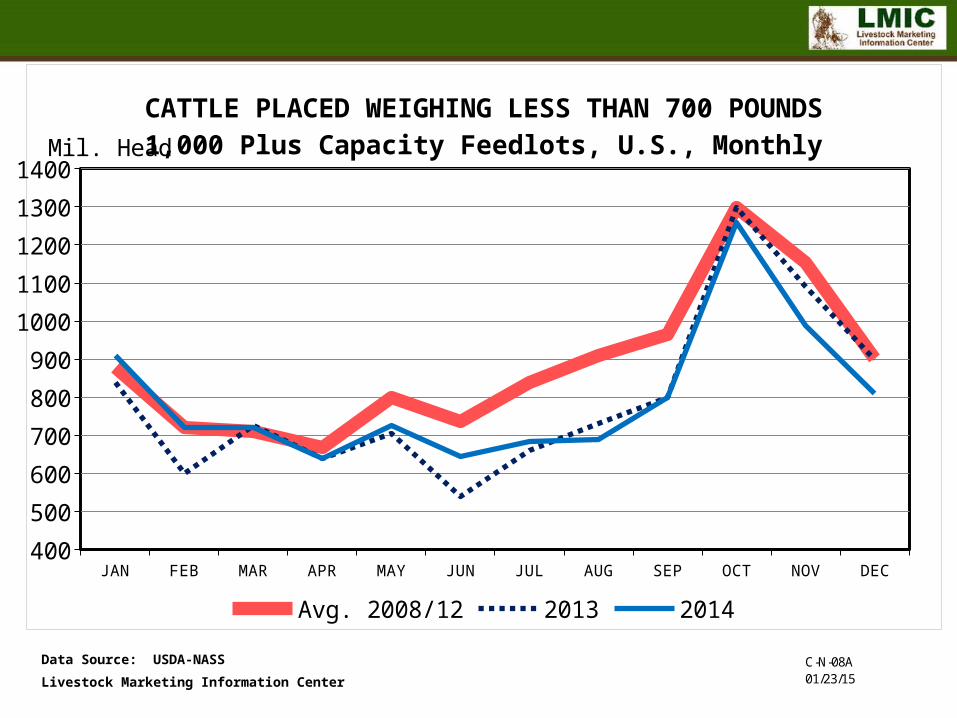
C-N-08A01/23/15
JAN FEB MAR APR MAY JUN JUL AUG SEP OCT NOV DEC400
500
600
700
800
900
1000
1100
1200
1300
1400
CATTLE PLACED WEIGHING LESS THAN 700 POUNDS1,000 Plus Capacity Feedlots, U.S., Monthly
Avg. 2008/12 2013 2014
Mil. Head
Data Source: USDA-NASS
Livestock Marketing Information Center
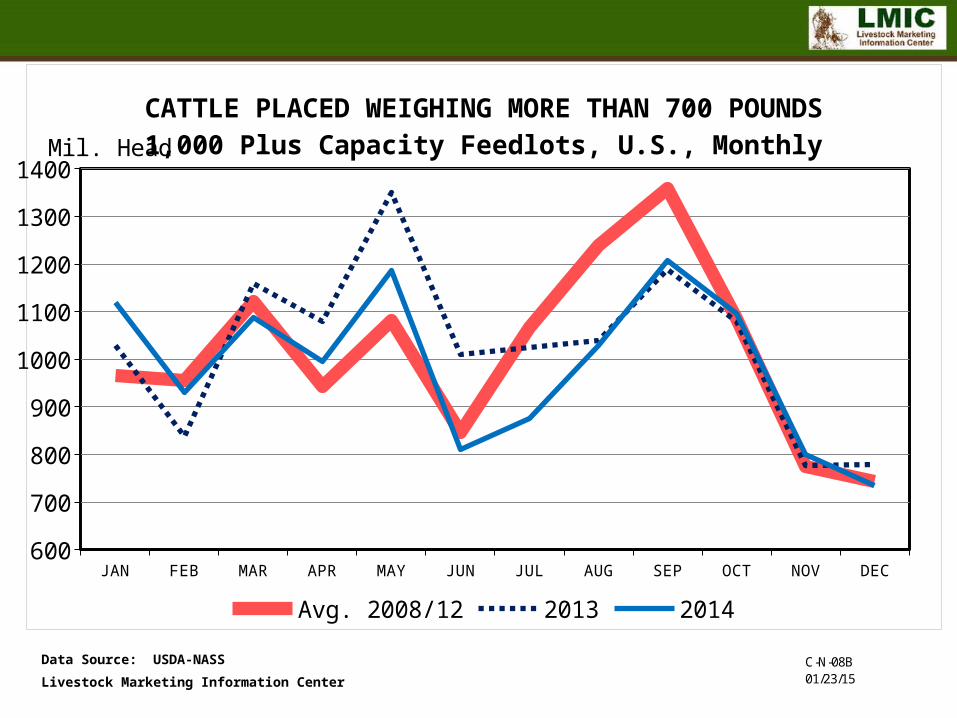
C-N-08B01/23/15
JAN FEB MAR APR MAY JUN JUL AUG SEP OCT NOV DEC600
700
800
900
1000
1100
1200
1300
1400
CATTLE PLACED WEIGHING MORE THAN 700 POUNDS1,000 Plus Capacity Feedlots, U.S., Monthly
Avg. 2008/12 2013 2014
Mil. Head
Data Source: USDA-NASS
Livestock Marketing Information Center
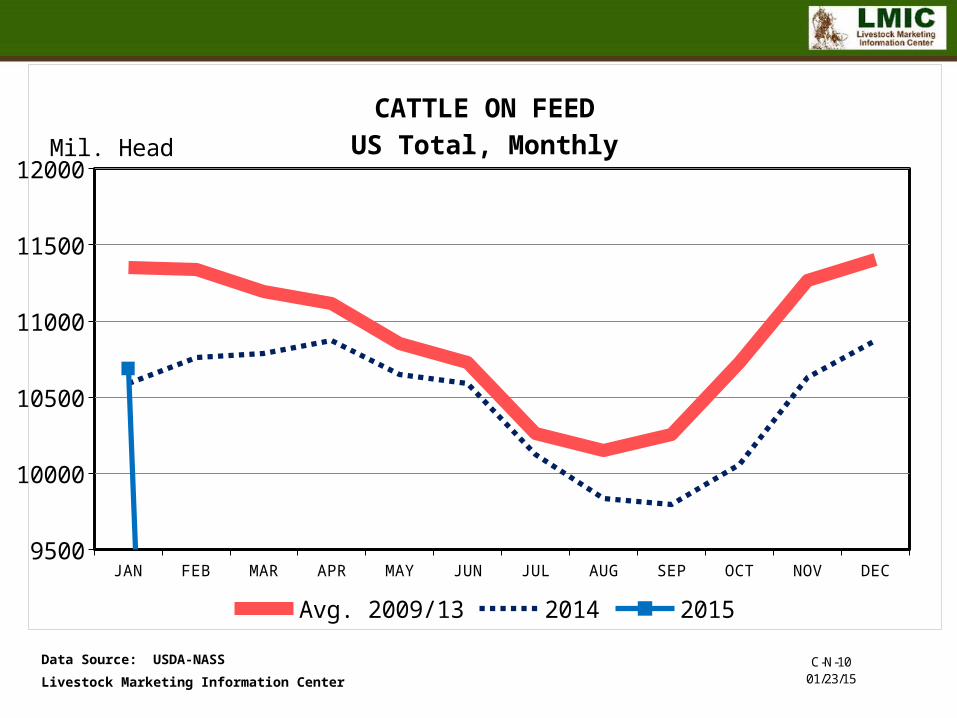
C-N-1001/23/15
JAN FEB MAR APR MAY JUN JUL AUG SEP OCT NOV DEC9500
10000
10500
11000
11500
12000
CATTLE ON FEEDUS Total, Monthly
Avg. 2009/13 2014 2015
Mil. Head
Data Source: USDA-NASS
Livestock Marketing Information Center
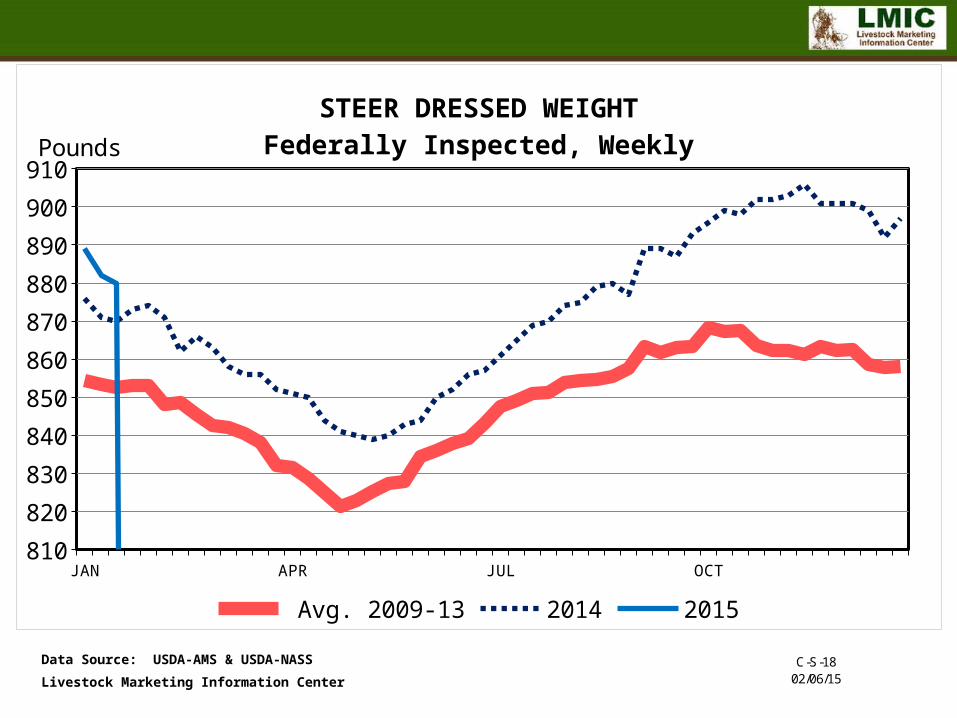
C-S-1802/06/15
JAN APR JUL OCT810
820
830
840
850
860
870
880
890
900
910
STEER DRESSED WEIGHTFederally Inspected, Weekly
Avg. 2009-13 2014 2015
Pounds
Data Source: USDA-AMS & USDA-NASS
Livestock Marketing Information Center

JAN FEB MAR APR MAY JUN JUL AUG SEP OCT NOV DEC500
600
700
800
900
1000
1100
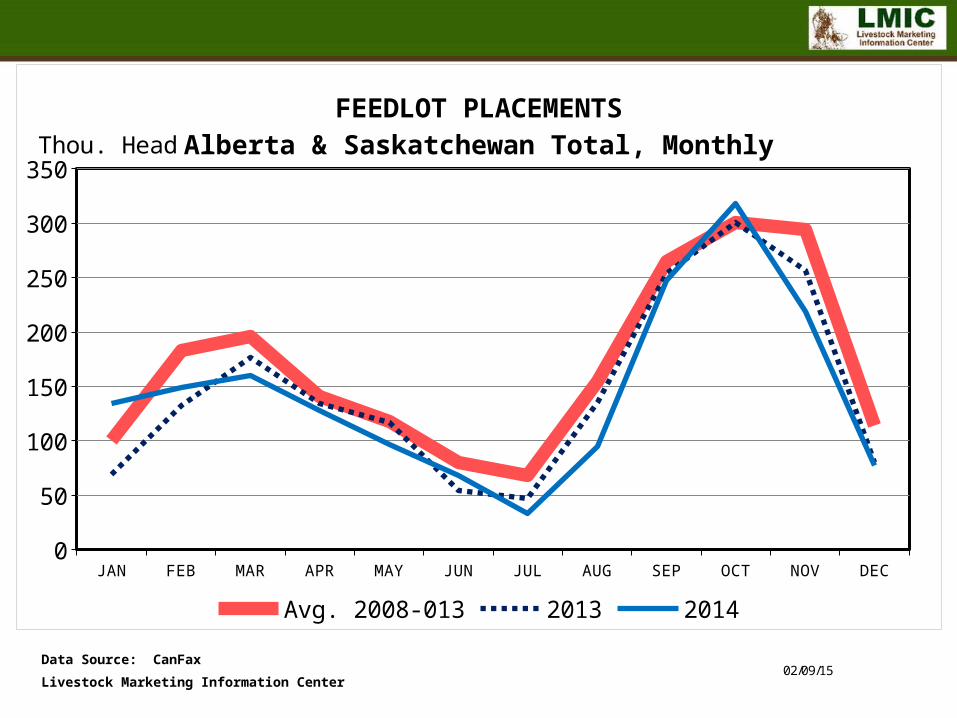
CATTLE ON FEEDAlberta & Saskatchewan Total, Monthly
Avg. 2009-013 2014 2015
Thou. Head
Data Source: CanFax
Livestock Marketing Information Center02/09/15
JAN FEB MAR APR MAY JUN JUL AUG SEP OCT NOV DEC0
50
100
150
200
250
300
350
FEEDLOT PLACEMENTSAlberta & Saskatchewan Total, Monthly
Avg. 2008-013 2013 2014
Thou. Head
Data Source: CanFax
Livestock Marketing Information Center02/09/15
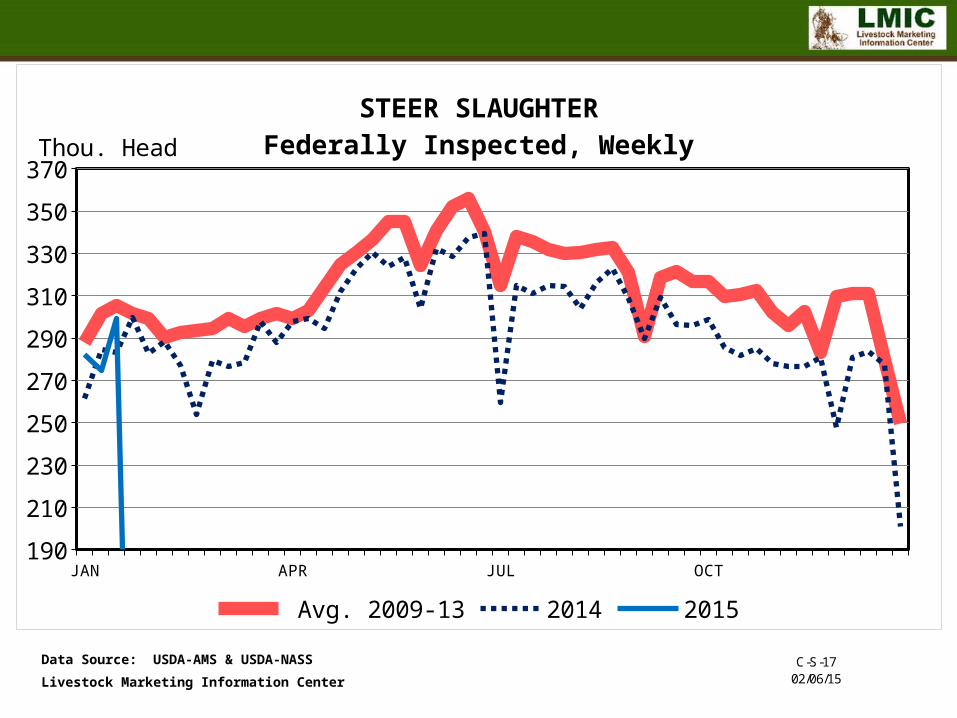
C-S-1702/06/15
JAN APR JUL OCT190
210
230
250
270
290
310
330
350
370
STEER SLAUGHTERFederally Inspected, Weekly
Avg. 2009-13 2014 2015
Thou. Head
Data Source: USDA-AMS & USDA-NASS
Livestock Marketing Information Center

Cutout Value Rib Loin Cutout Value Rib Loin125
175
225
275
325
375
425
475
PRIMAL VALUEMonthly
Prime Branded Choice Select Ungraded
$/Cwt
Jan-14
Data Source: USDA-AMS, Compiled & Analysis by LMIC
Livestock Marketing Information Center
Jan-15

Chuck Round Brisket Chuck Round Brisket110
130
150
170
190
210
230
250
PRIMAL VALUEMonthly
Prime Branded Choice Select Ungraded
$/Cwt
Jan-15Jan-14
Data Source: USDA-AMS, Compiled & Analysis by LMIC
Livestock Marketing Information Center

C-P-6802/02/15
JAN APR JUL OCT0
2
4
6
8
10
12
14
16
CHOICE MINUS SELECT BEEF PRICESCarcass Cutout Value 600-900 Lbs., Weekly
Avg. 2009-13 2014 2015
$ Per Cwt.
Data Source: USDA-AMS, Compiled & Analysis by LMIC
Livestock Marketing Information Center

JAN APR JUL OCT85
95
105
115
125
135
145
155
165
175
185
SLAUGHTER STEER PRICES5 Market Weighted Average, Weekly
Avg. 2009-13 2014 2015
$ Per Cwt.
Data Source: USDA-AMS
Livestock Marketing Information Center
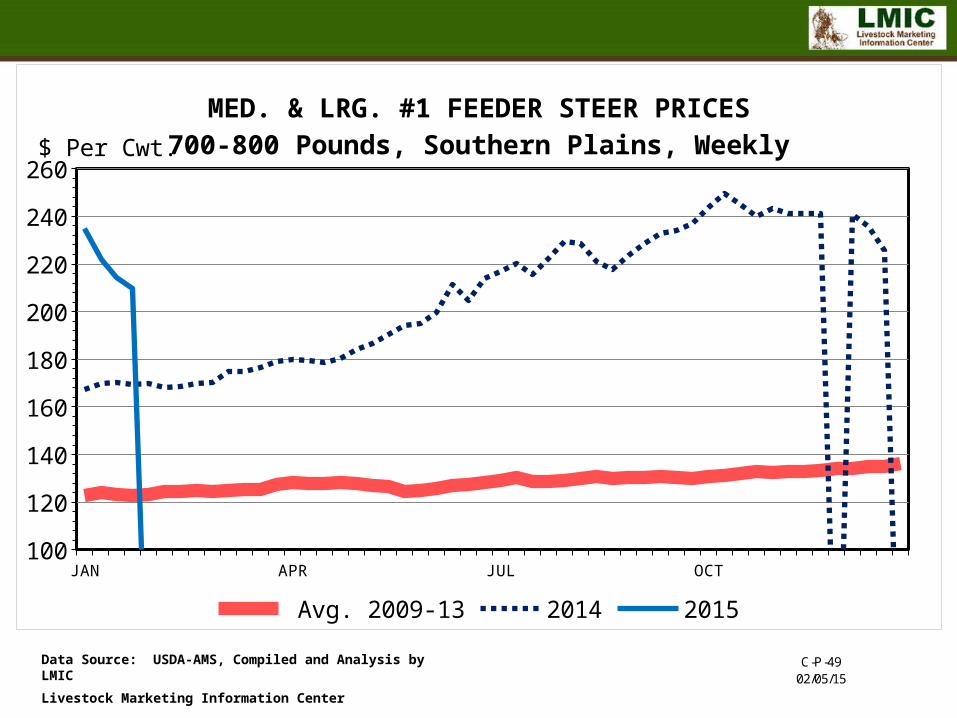
C-P-4902/05/15
JAN APR JUL OCT100
120
140
160
180
200
220
240
260
MED. & LRG. #1 FEEDER STEER PRICES700-800 Pounds, Southern Plains, Weekly
Avg. 2009-13 2014 2015
$ Per Cwt.
Data Source: USDA-AMS, Compiled and Analysis by LMIC
Livestock Marketing Information Center

JAN APR JUL OCT110
130
150
170
190
210
230
250
270
290
310
MED. & LRG. #1 STEER CALF PRICES500-600 Pounds, Southern Plains, Weekly
Avg. 2009-13 2014 2015
$ Per Cwt.
Data Source: USDA-AMS, Compiled & Analysis by LMIC
Livestock Marketing Information Center

JAN APR JUL OCT45
55
65
75
85
95
105
115
125
135
145
SLAUGHTER COW PRICESSouthern Plains, 85-90% Lean, Weekly
Avg. 2009-13 2014 2015
$ Per Cwt.
Data Source: USDA-AMS
Livestock Marketing Information Center

JAN APR JUL OCT100
120
140
160
180
200
220
HEIFER SLAUGHTERFederally Inspected, Weekly
Avg. 2009-13 2014 2015
Thou. Head
Data Source: USDA-AMS & USDA-NASS
Livestock Marketing Information Center
JAN APR JUL OCT30
40
50
60
70
80
90
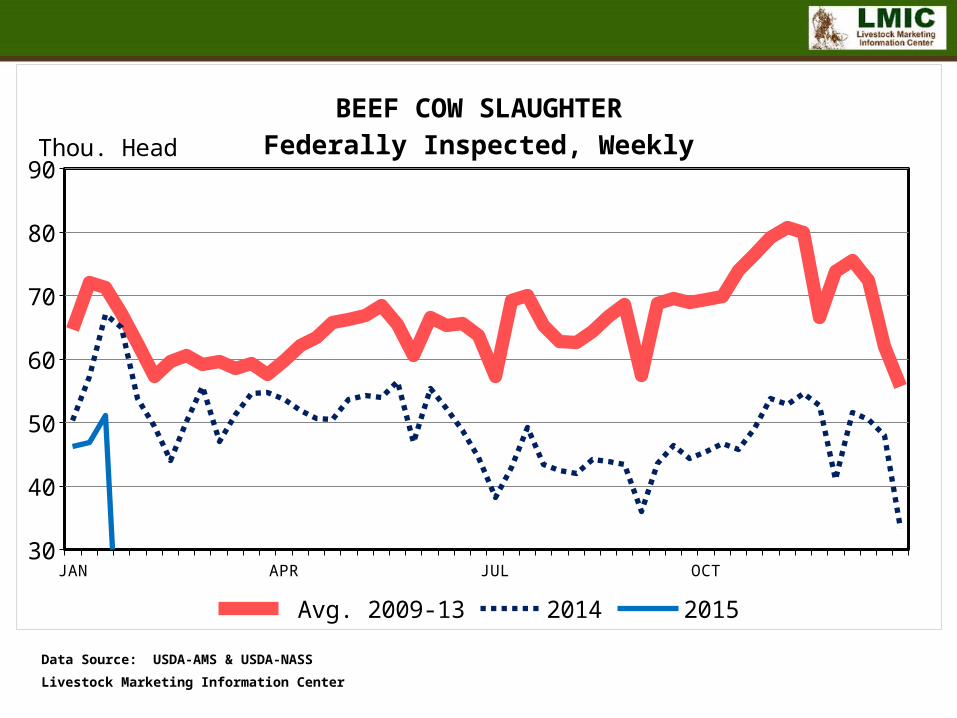
BEEF COW SLAUGHTERFederally Inspected, Weekly
Avg. 2009-13 2014 2015
Thou. Head
Data Source: USDA-AMS & USDA-NASS
Livestock Marketing Information Center
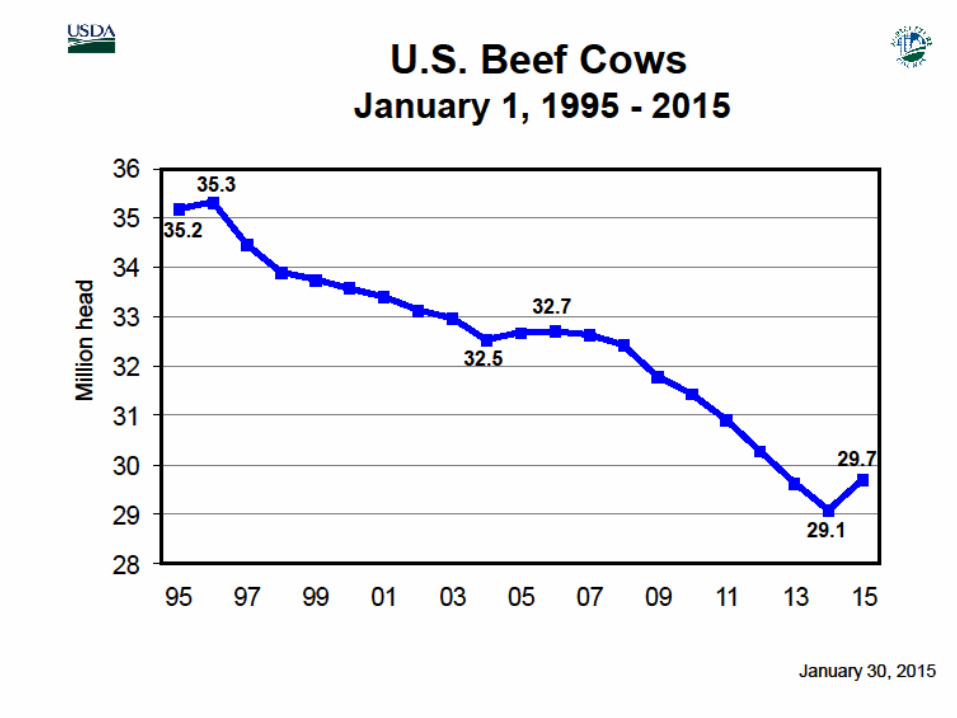

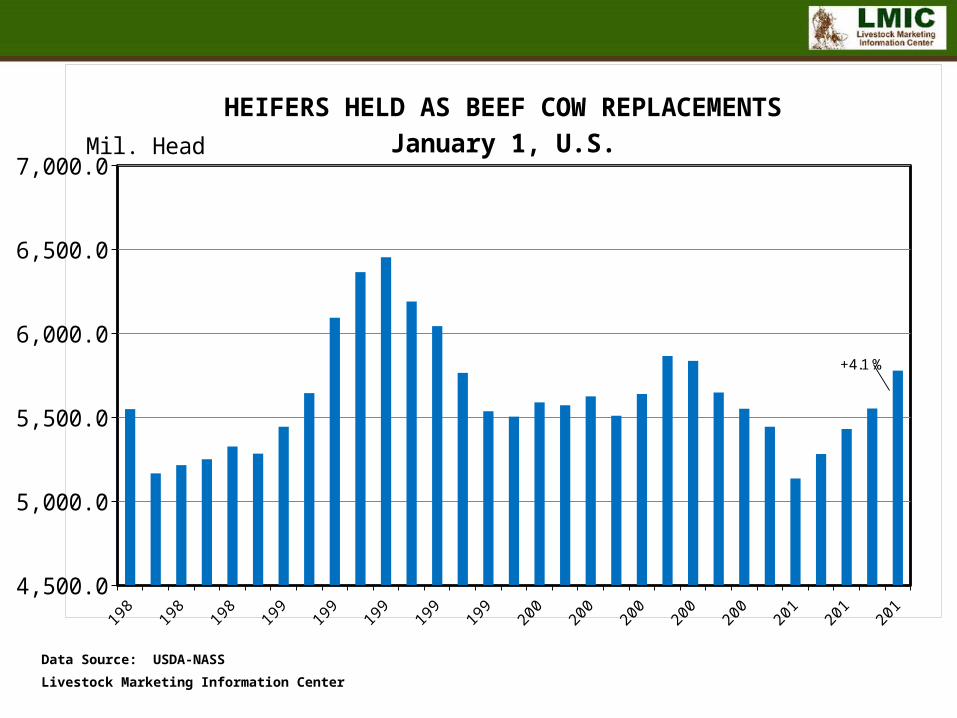
4,500.0
5,000.0
5,500.0
6,000.0
6,500.0
7,000.0
HEIFERS HELD AS BEEF COW REPLACEMENTSJanuary 1, U.S.Mil. Head
+4.1 %
Data Source: USDA-NASS
Livestock Marketing Information Center
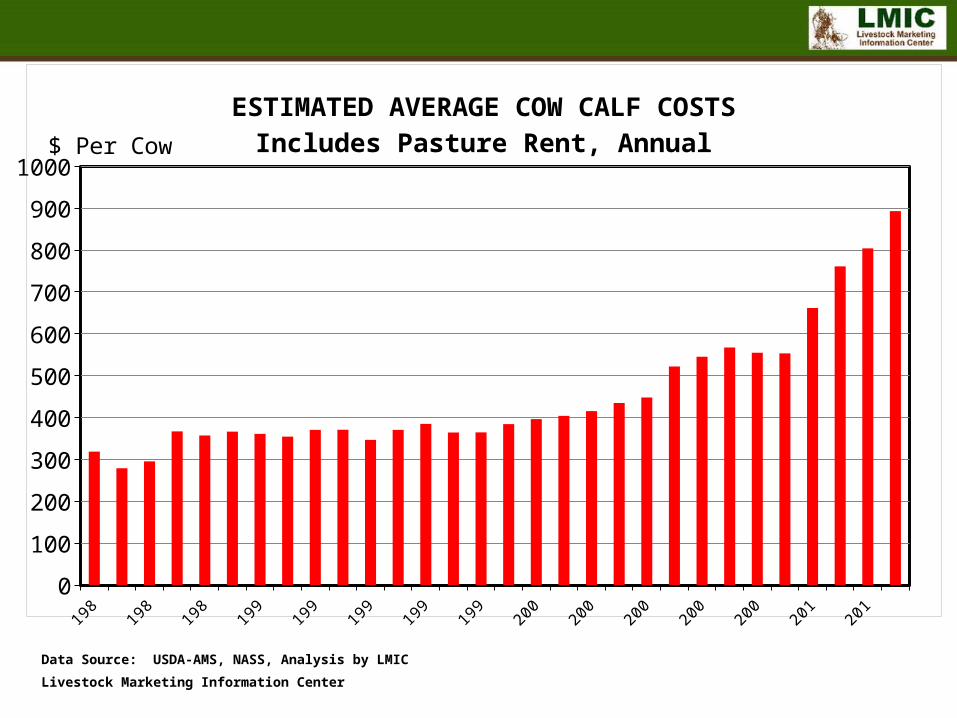
0
100
200
300
400
500
600
700
800
900
1000
ESTIMATED AVERAGE COW CALF COSTSIncludes Pasture Rent, Annual$ Per Cow
Data Source: USDA-AMS, NASS, Analysis by LMIC
Livestock Marketing Information Center
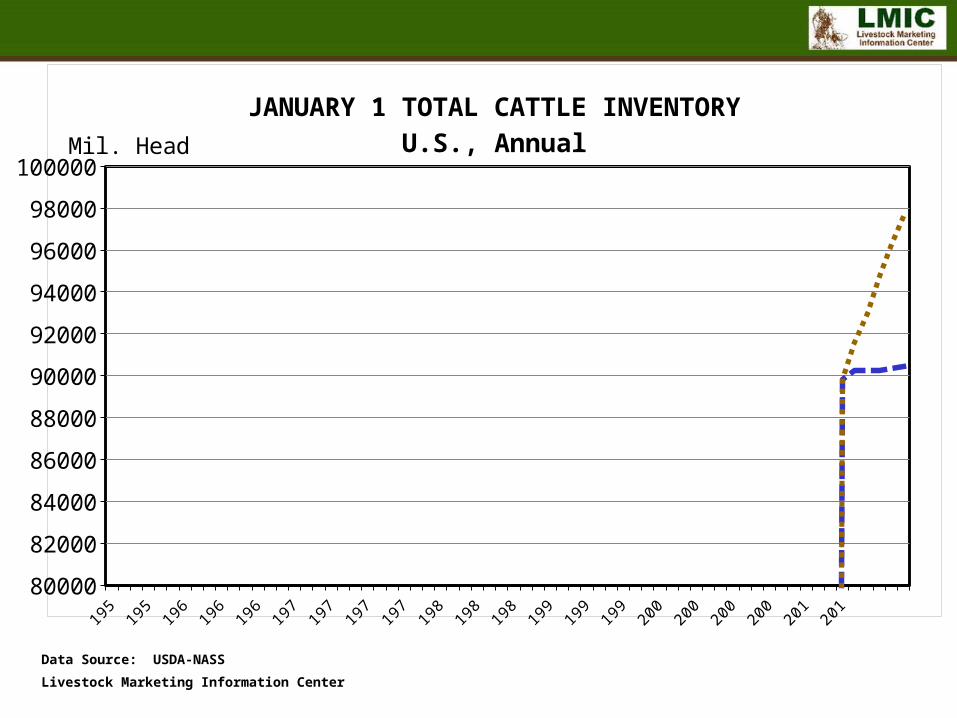
80000
82000
84000
86000
88000
90000
92000
94000
96000
98000
100000
JANUARY 1 TOTAL CATTLE INVENTORYU.S., AnnualMil. Head
Data Source: USDA-NASS
Livestock Marketing Information Center

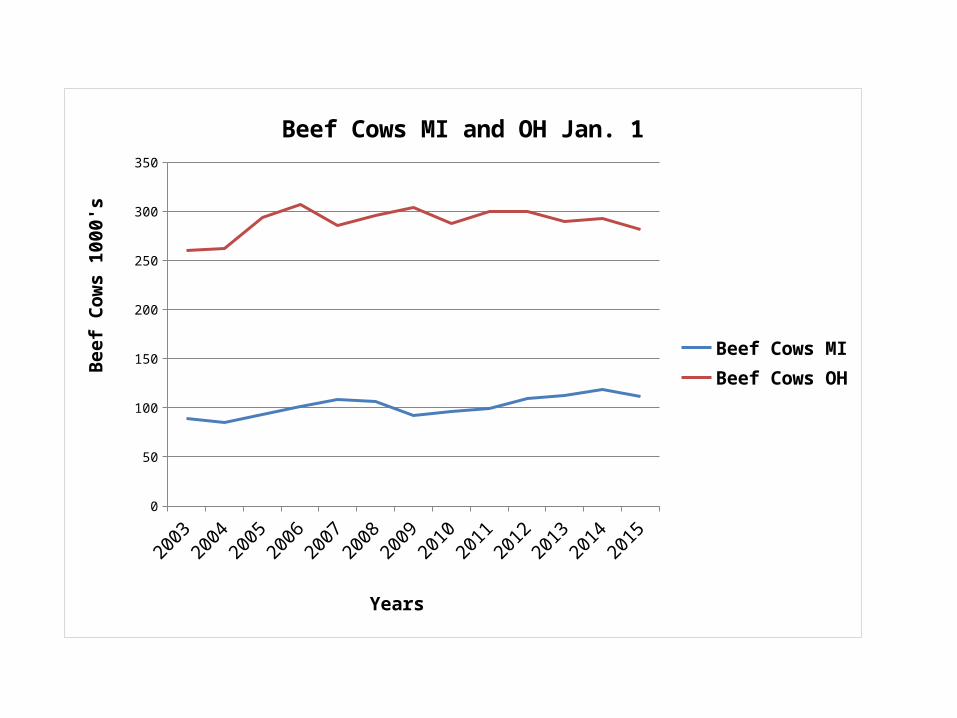
20032004200520062007200820092010201120122013201420150
50
100
150
200
250
300
350
Beef Cows MI and OH Jan. 1
Beef Cows MIBeef Cows OH
Years
Beef
Cow
s 10
00's

2004 2005 2006 2007 2008 2009 2010 2011 2012 2013 2014 20150
50
100
150
200
250
300
350
400
450
Dairy Cows MI and OH
Dairy Cows MichiganDairy Cows Ohio
Years
Dai
ry C
ows
1000
's

2007 2008 2009 2010 2011 2012 2013 2014 20150
50
100
150
200
250
300
350
400
450
How Many Michigan Calves Available?
Calf Crop MichiganBeef Heifers KeptDairy Heifers Kept
Years
1000
's

2007 2008 2009 2010 2011 2012 2013 2014 20150
100
200
300
400
500
600
How Many Ohio Calves Available?
Calf Crop Ohio
Beef Heifers Kept
Dairy Heifers Kept
Years
1000
's
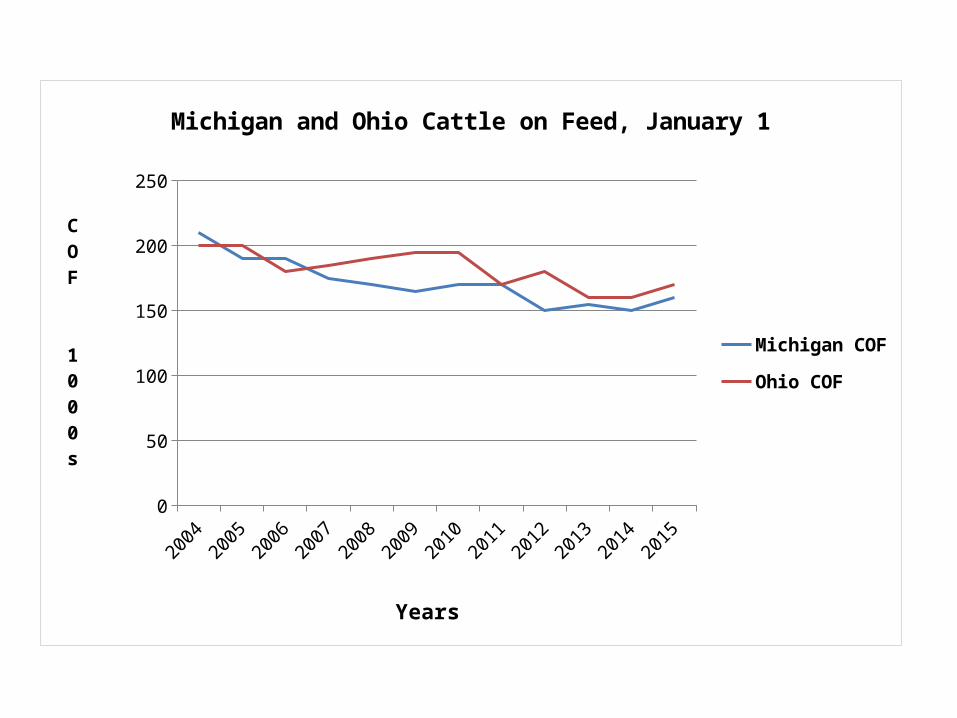
2004 2005 2006 2007 2008 2009 2010 2011 2012 2013 2014 20150
50
100
150
200
250
Michigan and Ohio Cattle on Feed, January 1
Michigan COF
Ohio COF
Years
COF 1000s

JAN-MAR APR-JUN JUL-SEP OCT-DEC5300
5500
5700
5900
6100
6300
6500
6700
6900
COMMERCIAL BEEF PRODUCTIONQuarterly
Avg. 2009/13 2014 2015 2016
Bil. Pounds
Data Source: USDA-NASS, Compiled & Analysis by LMIC
Livestock Marketing Information Center
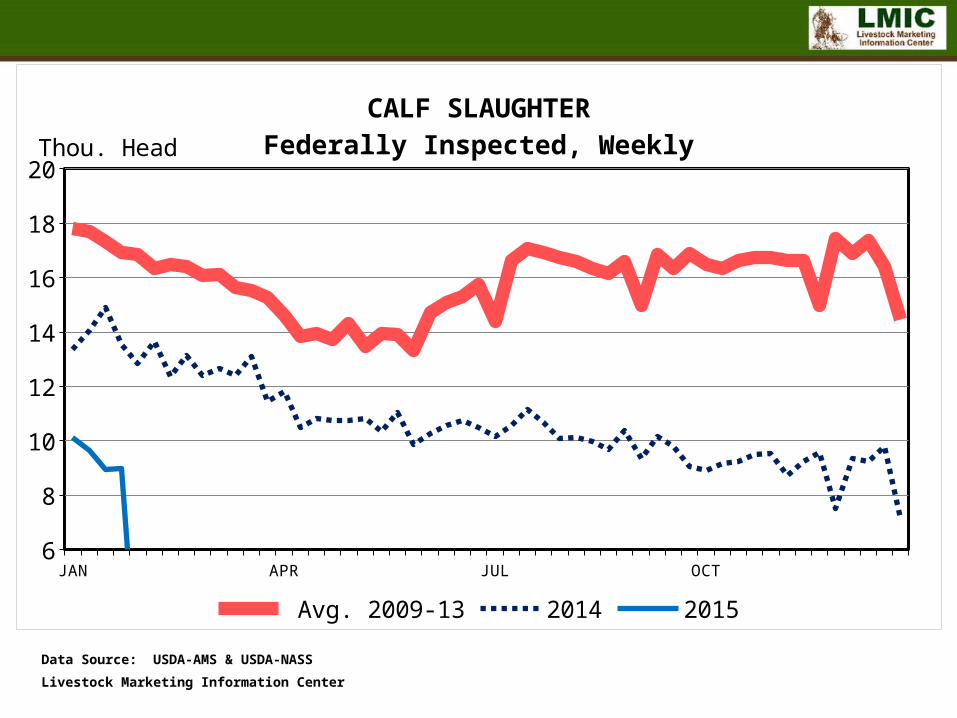
JAN APR JUL OCT6
8
10
12
14
16
18
20
CALF SLAUGHTERFederally Inspected, Weekly
Avg. 2009-13 2014 2015
Thou. Head
Data Source: USDA-AMS & USDA-NASS
Livestock Marketing Information Center

-100
0
100
200
300
400
500
600
80000
85000
90000
95000
100000
105000
110000
115000
COW-CALF RETURNS AND CATTLE INVENTORYU.S., Annual
Cow-Calf Returns Cattle Inventory Jan 1
$ Per Cow Mil. Head
Data Source: USDA-AMS & USDA-NASS, Compiled and Analysis by LMIC
Livestock Marketing Information Center

-200
-150
-100
-50
0
50
100
150
AVERAGE RETURNS TO CATTLE FEEDERSFeeding 725 Lb. Steers, S. Plains, Annual$ Per Head
Data Source: USDA-AMS, Compiled and Analysis by LMIC
Livestock Marketing Information Center

19861987
19881989
19901991
19921993
19941995
19961997
19981999
20002001
20022003
20042005
20062007
20082009
20102011
20122013
20142015
201650
75
100
125
150
175
200
225
250
275
300
AVERAGE ANNUAL CATTLE PRICESSouthern Plains
500-600lb Steer Calves 700-800lb Feeder Steers Fed Steers
$ Per Cwt
Data Source: USDA-AMS, Compiled and Analysis by LMIC
Livestock Marketing Information Center
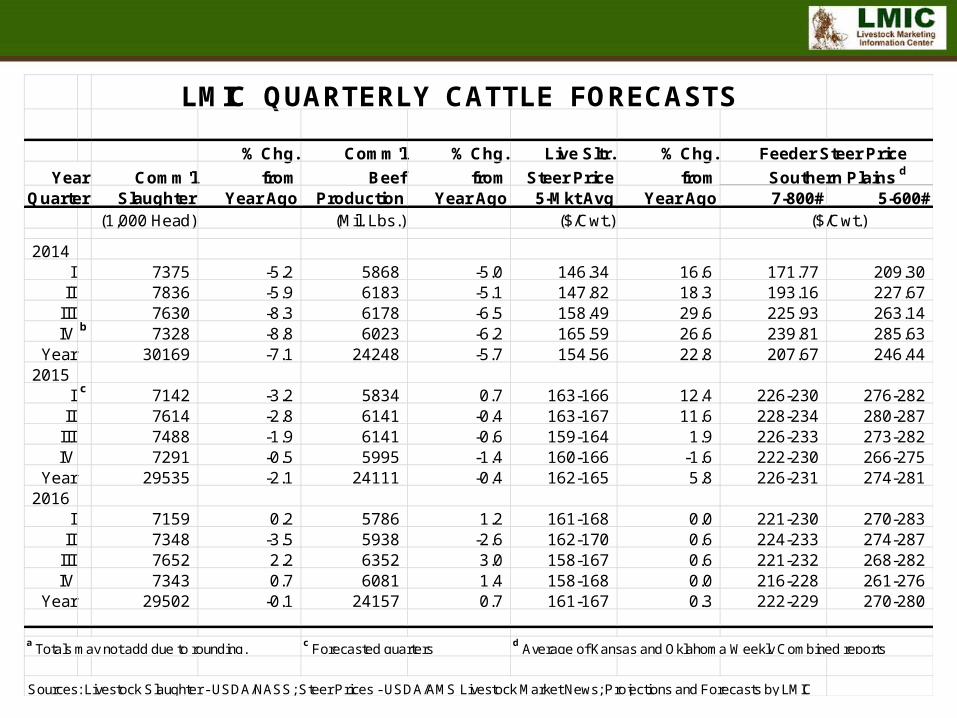
LMIC QUARTERLY CATTLE FORECASTS
% Chg. Comm'l % Chg. Live Sltr. % Chg. Feeder Steer Price
Year Comm'l from Beef from Steer Price from Southern Plains d
Quarter Slaughter Year Ago Production Year Ago 5-Mkt Avg Year Ago 7-800# 5-600#(1,000 Head) (Mil. Lbs.) ($/Cwt.) ($/Cwt.)
2014I 7375 -5.2 5868 -5.0 146.34 16.6 171.77 209.30
II 7836 -5.9 6183 -5.1 147.82 18.3 193.16 227.67 III 7630 -8.3 6178 -6.5 158.49 29.6 225.93 263.14 IV b 7328 -8.8 6023 -6.2 165.59 26.6 239.81 285.63
Year 30169 -7.1 24248 -5.7 154.56 22.8 207.67 246.44 2015
I c 7142 -3.2 5834 0.7 163-166 12.4 226-230 276-282II 7614 -2.8 6141 -0.4 163-167 11.6 228-234 280-287
III 7488 -1.9 6141 -0.6 159-164 1.9 226-233 273-282IV 7291 -0.5 5995 -1.4 160-166 -1.6 222-230 266-275
Year 29535 -2.1 24111 -0.4 162-165 5.8 226-231 274-2812016
I 7159 0.2 5786 1.2 161-168 0.0 221-230 270-283II 7348 -3.5 5938 -2.6 162-170 0.6 224-233 274-287
III 7652 2.2 6352 3.0 158-167 0.6 221-232 268-282IV 7343 0.7 6081 1.4 158-168 0.0 216-228 261-276
Year 29502 -0.1 24157 0.7 161-167 0.3 222-229 270-280
a Totals may not add due to rounding. c Forecasted quarters d Average of Kansas and Oklahoma Weekly Combined reports
Sources: Livestock Slaughter - USDA/NASS; Steer Prices - USDA/AMS Livestock Market News; Projections and Forecasts by LMIC
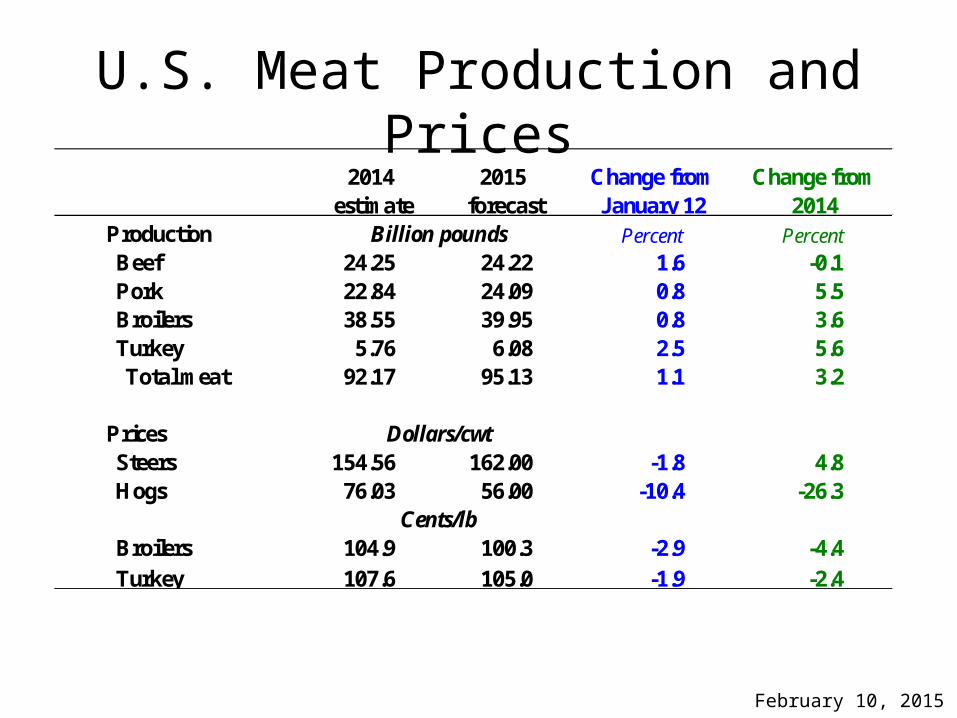
U.S. Meat Production and Prices
February 10, 2015
2014 estimate
2015 forecast
Change from January 12
Change from 2014
Production Billion pounds Percent PercentBeef 24.25 24.22 1.6 -0.1Pork 22.84 24.09 0.8 5.5Broilers 38.55 39.95 0.8 3.6Turkey 5.76 6.08 2.5 5.6Total meat 92.17 95.13 1.1 3.2
Prices Dollars/cwtSteers 154.56 162.00 -1.8 4.8Hogs 76.03 56.00 -10.4 -26.3
Cents/lbBroilers 104.9 100.3 -2.9 -4.4Turkey 107.6 105.0 -1.9 -2.4
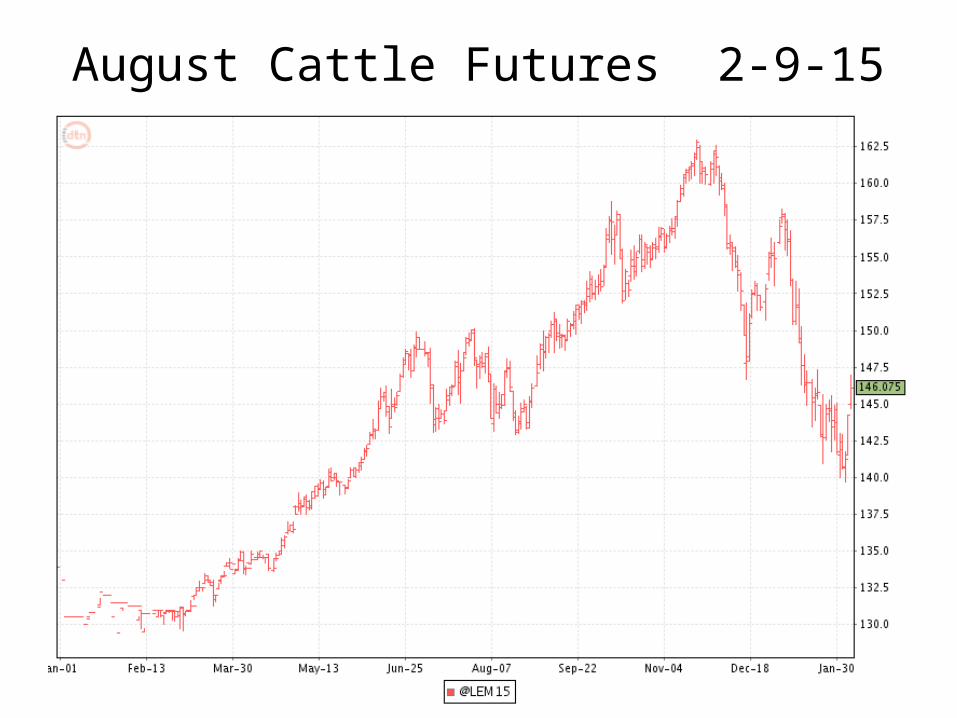
August Cattle Futures 2-9-15

Economic Environment …
• Domestic Consumer Meat Demand Strong, Foreign Demand ????• Chicken and Pork Output Ramping-Up• Summer of 2014: Cyclical Turn-up in U.S. Cattle Numbers Began• Feedstuffs ????• Annual Cattle Price Peak: 2014, 2015, or 2016?• Cattle -- Slow Herd Expansion, Prices Erode Not Collapse• Expect More Normal Price Seasonality• Producer Profitability in 2015 Compared to 2014:
• Very Profitable (Slight Slip): Cow-calf; Breeding Stock Providers• Profitable, Small Year-Over-Year Increase: Lamb• Profitable, But Well Less: Hogs, Chicken, and Dairy.• Likely Not Profitable Up To Breakeven: Cattle Feeding (after best year
since 2003 in 2014), and Stockers (????).

Jim Hilker’s Web Page
http://firm.msue.msu.edu/Market Outlook & Probabilistic Price Forecasts for
Grain & Livestockor
http://www.msu.edu/user/hilker/
ThanksQuestions/Discussion