predictors of sexual coercion against women and men: a multinational study of university students...
TRANSCRIPT
Predictors of Sexual Coercion Against Women and Men:A Multinational Study of University Students
Denise A. HinesClark University
Department of Psychology

Supported by:
Grant T32MH15161 from the National Institute of Mental Health

Background:Rates of Sexual Coercion
Female Victims 25-33% report at least forced touching
of sexual parts <10% report forced intercourse
Male Victims 10-20% report verbal coercion 1-3% report forced intercourse

Background: Feminist Perspective
Roots of sexual coercion are grounded in the power imbalances inherent in patriarchy.
Power imbalances are reflected in dynamics of heterosexual romantic relationships.

Background: Feminist Perspective
Problem: Traditional feminist theory cannot
account for sexual coercion by women against men.
When women gain increasing power in roles traditionally reserved for men, gender roles shift in other areas as well.
Background: Adversarial Sexual Beliefs
People with adversarial sexual beliefs would be more likely to commit sexual coercion.
Background:Sexual Revictimization
• A history of child sexual abuse is a strong predictor of sexual coercion victimization among women.
• Little research has documented whether sexual revictimization also applies to men.
• Don’t know whether the strength of this association differs by gender or culture.

Goals• Investigate whether differing rates of sexual
coercion victimization across 38 sites worldwide were due to differing degrees of the status of women.
• Investigate whether differing rates of sexual coercion victimization were due to differing degrees of adversarial sexual beliefs.
• Investigate the association between a history of CSA and current sexual coercion victimization for both men and women.
• Investigate whether sexual revictimization varied across sites.

Sample
• International Dating Violence Study 38 university sites from around the
world 2,084 men in heterosexual romantic
relationshipsMean age: 23.11 yearsMean Length of Relationship: 13.39 months% having sex in relationship: 74.2%

Sample
• International Dating Violence Study 38 university sites from around the
world 5,583 women in heterosexual romantic
relationshipsMean age: 23.31 yearsMean Length of Relationship: 15.37 months% having sex in relationship: 79%

Sites (n): Men
ASIA EUROPE UNITED STATES
China, Hong Kong (60) Belgium, Flemish (90) Indiana (47)
India, Pune (20) England, Leicester (26) Louisiana (26)
Singapore (55) Germany, Freiburg (65) Mississippi (15)
South Korea, Pusan (68) Lithuania, Vilnius (105) New Hampshire 1 (114)
AUSTRALIA/NZ Netherlands, Amsterdam (30) New Hampshire 2 (60)
Australia (32) Portugal, Braga (110) Ohio (128)
New Zealand (25) Scotland, Glasgow (29) Pennsylvania (42)
CANADA Sweden, Gavle (152) Texas, Houston (34)
Hamilton (32) Swiss, French-speaking (42) Texas, Mexican-Amer (71)
London (45) Swiss, German-speaking (26) Texas, Non-Mex-Amer (85)
Quebec 1 (48) LATIN AMERICA Texas, Nacogdoches (29)
Quebec 2 (85) Brazil, Sao Paulo (76) Utah (54)
Toronto (57) Mexico, Northern (24) Washington, DC (10)
Winnipeg (15) MIDDLE EAST
Israel, Emek Yezreel (52)

Sites (n): Women
ASIA EUROPE UNITED STATES
China, Hong Kong (87) Belgium, Flemish (311) Indiana (139)
India, Pune (40) England, Leicester (157) Louisiana (70)
Singapore (132) Germany, Freiburg (96) Mississippi (175)
S. Korea, Pusan (113) Lithuania, Vilnius (220) New Hampshire 1 (208)
AUSTRALIA/NZ Netherlands, Amsterdam (94) New Hampshire 2 (205)
Australia (176) Portugal, Braga (239) Ohio (144)
New Zealand (94) Scotland, Glasgow (169) Pennsylvania (154)
CANADA Sweden, Gavle (493) Texas, Houston (37)
Hamilton (197) Swiss, French-speaking (141) Texas, Mexican-Amer (131)
London (60) Swiss, German-speaking (92) Texas, Non-Mex-Amer (104)
Quebec 1 (220) LATIN AMERICA Texas, Nacogdoches (75)
Quebec 2 (49) Brazil, Sao Paulo (155) Utah (100)
Toronto (126) Mexico, Northern (158) Washington, DC (60)
Winnipeg (112) MIDDLE EAST
Israel, Emek Yezreel (250)

Measures
• Sexual Coercion Victimization Conflict Tactics Scales
Verbally coerced sex Insisted or threatened vaginal, oral, and/or
anal sex
Physically forced sex Physically forced vaginal, oral, and/or anal
sex

Measures
• Child Sexual Abuse• Personal and Relationships Profile
• Contact and/or noncontact sexual abuse with:
• Family members• Peers• Nonfamily adults
Measures
• Site-level Gender Hostility• Towards Men
• Average score for each site on the Gender Hostility to Men subscale of the Personal and Relationships Profile
• “Men treat women badly”• “I often feel resentful of men”

Measures
• Site-level Gender Hostility• Towards Women
• Average score for each site on the Gender Hostility to Women subscale of the Personal and Relationships Profile
• “Women treat men badly”• “I often feel resentful of women”
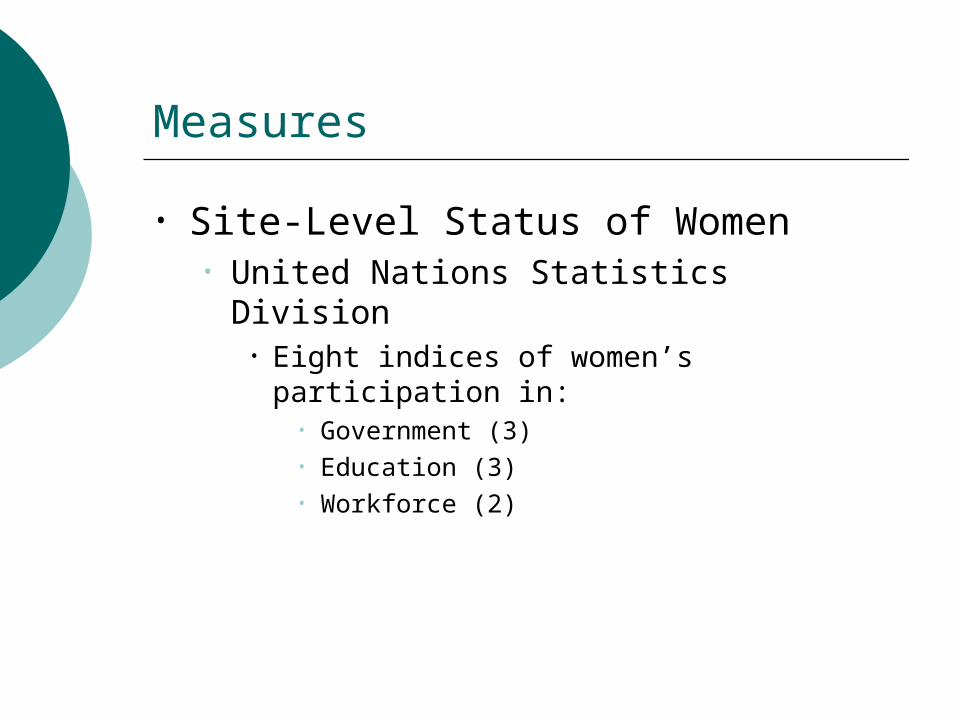
Measures
• Site-Level Status of Women• United Nations Statistics Division
• Eight indices of women’s participation in:• Government (3)• Education (3)• Workforce (2)
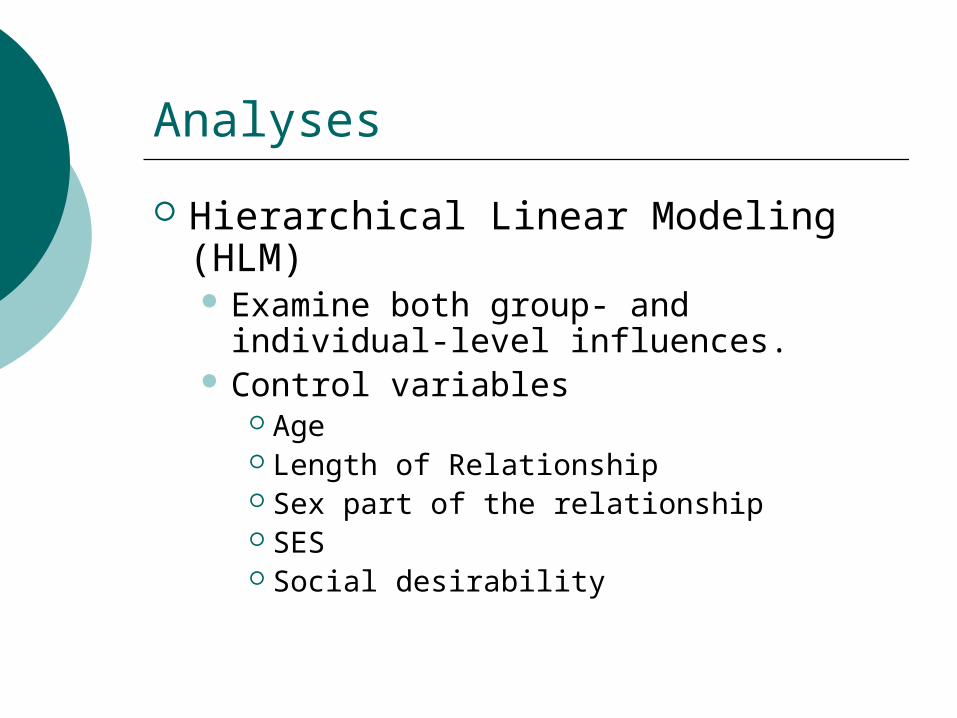
Analyses
Hierarchical Linear Modeling (HLM) Examine both group- and individual-
level influences. Control variables
Age Length of Relationship Sex part of the relationship SES Social desirability

Analyses
Hierarchical Linear Modeling (HLM) Individual-level predictor
Number of CSA items endorsed Site-level predictors
Site level Gender Hostility to (Wo)men Status of Women Index
Outcomes Forced sexual coercion Verbal sexual coercion

Descriptive Statistics:Male Victimization
% Forced Sex
% Verbal Coercion
% CSA History
Mean # of Items Endorsed
Overall 2.8% 22.0% 29.9% 0.55
Low 0%
(12 sites)0%
(India)5.9%
(Sweden)0.09
(Sweden)
High12%
(Louisiana)50%
(Louisiana)62.5%
(Quebec 1)
1.50(Washington,
DC)
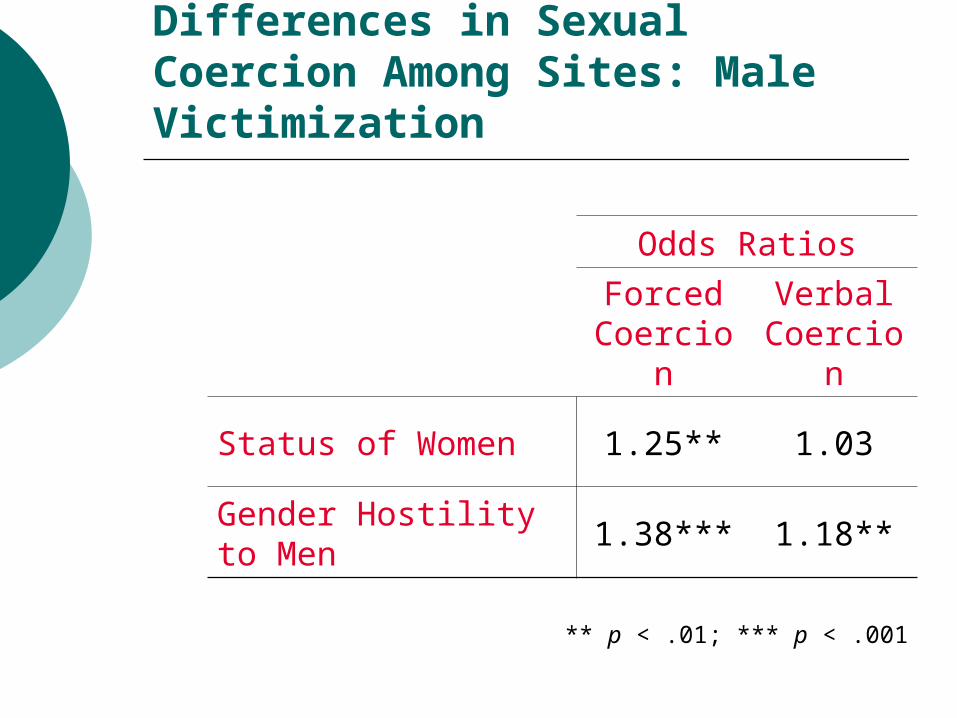
Differences in Sexual Coercion Among Sites: Male Victimization
Odds Ratios
Forced Coercion
Verbal Coercion
Status of Women 1.25** 1.03
Gender Hostility to Men
1.38*** 1.18**
** p < .01; *** p < .001

Sexual Revictimization: Men
Odds Ratios
Forced Coercion
Verbal Coercion
Sexual Abuse History 1.48*** 1.28***
χ2
SAH-Sexual Coercion slope 47.97 44.77
*** p < .001

Descriptive Statistics:Female Victimization
% Forced Sex
% Verbal Coercion
% CSA History
Mean # of Items Endorsed
Overall 2.3% 24.5% 32.0% 0.66
Low 0%
(3 sites)9.6%
(Netherlands)18.3%
(Sweden)0.31
(Lithuania)
High13.3%
(London, Canada)
46.7%(Washington,
DC)
53.1%(Quebec 2)
1.33(India)
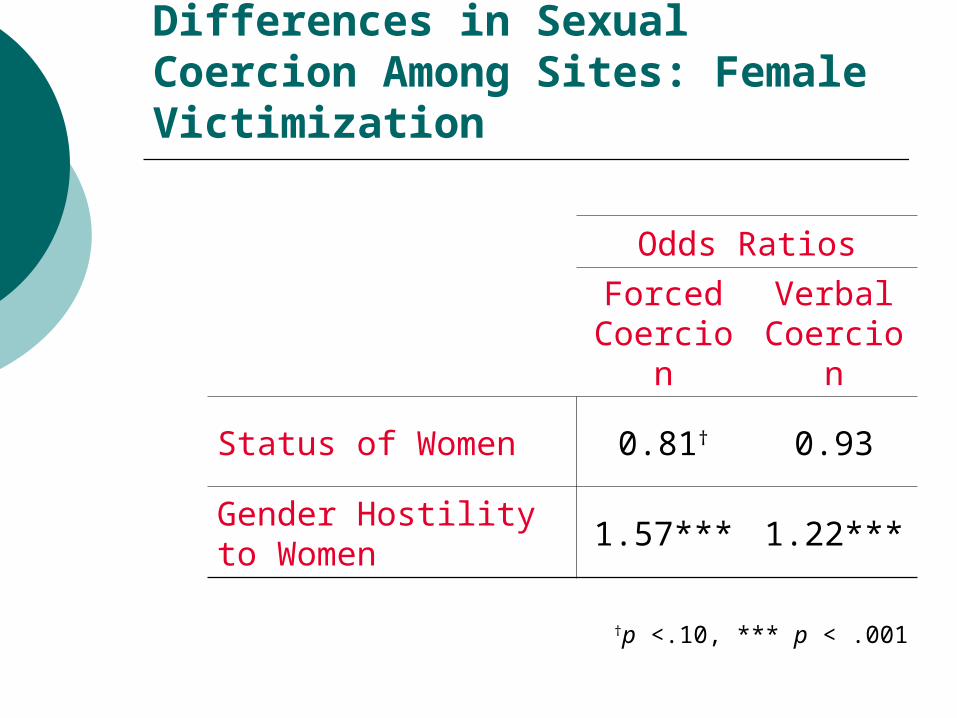
Differences in Sexual Coercion Among Sites: Female Victimization
Odds Ratios
Forced Coercion
Verbal Coercion
Status of Women 0.81† 0.93
Gender Hostility to Women
1.57*** 1.22***
†p <.10, *** p < .001

Sexual Revictimization: Women
Odds Ratios
Forced Coercion
Verbal Coercion
Sexual Abuse History 1.18** 1.16***
χ2
SAH-Sexual Coercion slope 21.43 68.16**
** p < .01,*** p < .001
Conclusions: Feminist Theory
Limited support for the theory that forced sex rates against women varied according to the status women had in society.
When women’s status increases, so does the level of forced sex against men.

Conclusions: Adversarial Sexual Beliefs
When men and women are socialized to believe that the other gender is deceptive, manipulative, and exploitative, they are more likely to verbally or forcefully coerce sex from the other gender.

Conclusions: Sexual Revictimization
A history of childhood sexual abuse is a significant risk factor for sexual coercion victimization for men and women.
With one exception, these associations did not significantly differ across cultures.