prediction of protein localization and membrane protein topology gunnar von heijne department of...
Post on 19-Dec-2015
223 views
TRANSCRIPT
Prediction of protein localization and membrane protein topology
Gunnar von Heijne
Department of Biochemistry and Biophysics
Stockholm Bioinformatics Center
Stockholm University

Stockholm Bioinformatics Center
www.sbc.su.se
sorting
Protein localization

Protein sorting in a eukaryotic cell
SP

The ’canonical’ signal peptide
n h c
-3 -1
n-region: positively charged
h-region: hydrophobic
c-region: more polar, small residues in -1, -3
mTP

mTPs are rich in R & K and can form amphiphilic helices
(Abe et al., Cell 100:551)
cTP
mTP bound to Tom20
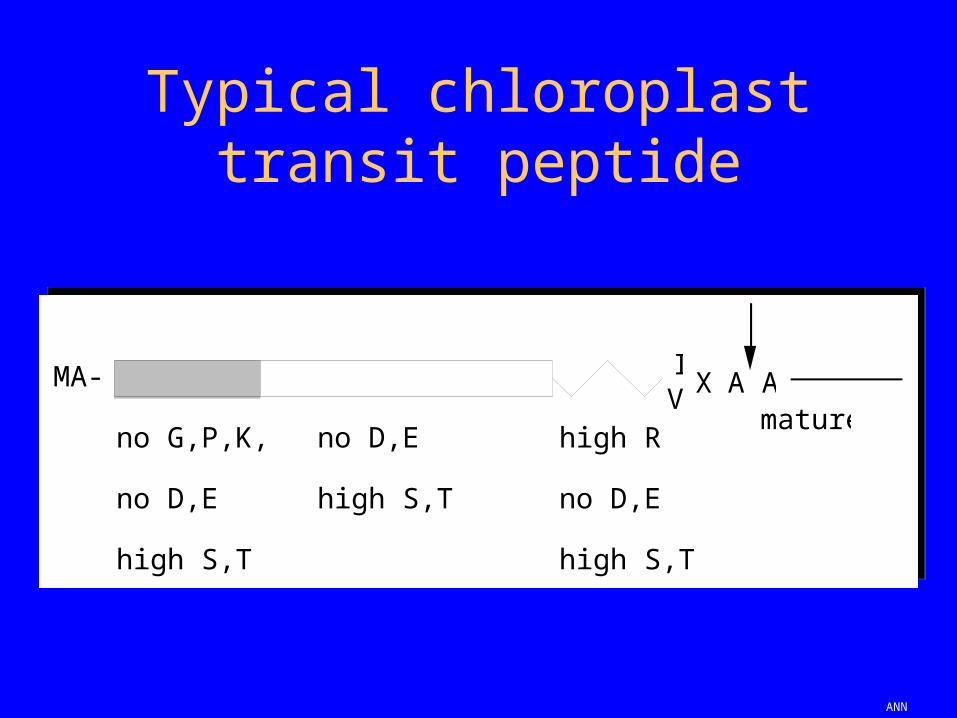
Typical chloroplast transit peptide
IV X A A
mature
MA-
no G,P,K,R
no D,E
high S,T
no D,E
high S,T
high R
no D,E
high S,T
ANN

A simple artificial neural network (ANN)
A C G T A C G T A C G T
A A G AC
1 0 0 0 1 0 0 0 0 0 1 0
ACGnot
ACG output layer
input layer
Inside ANN
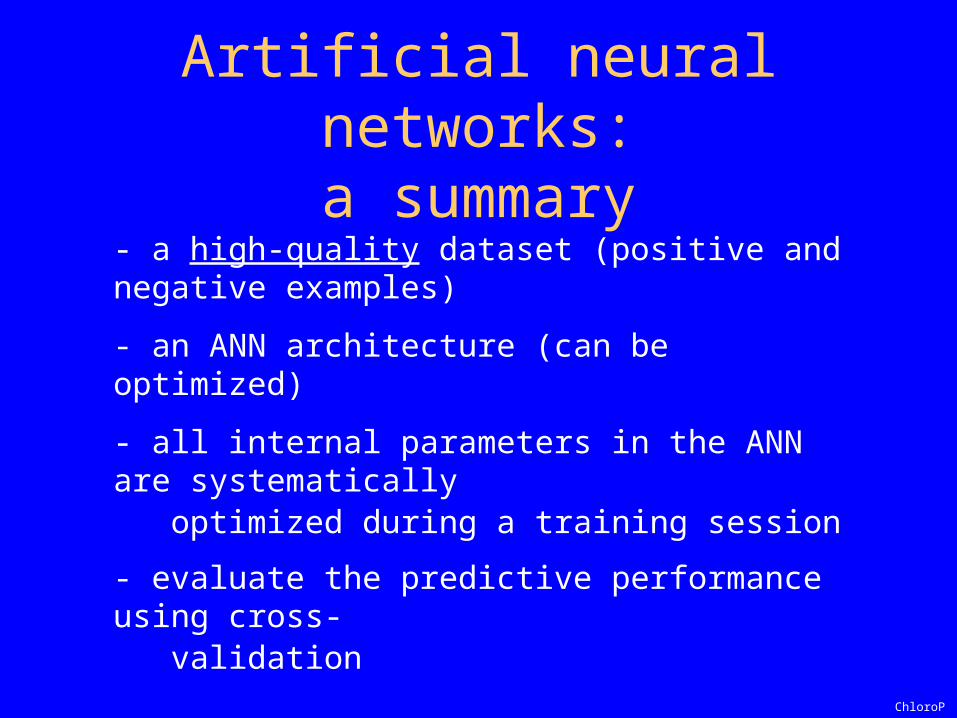
Artificial neural networks:a summary
- a high-quality dataset (positive and negative examples)
- an ANN architecture (can be optimized)
- all internal parameters in the ANN are systematically optimized during a training session
- evaluate the predictive performance using cross- validation
ChloroP
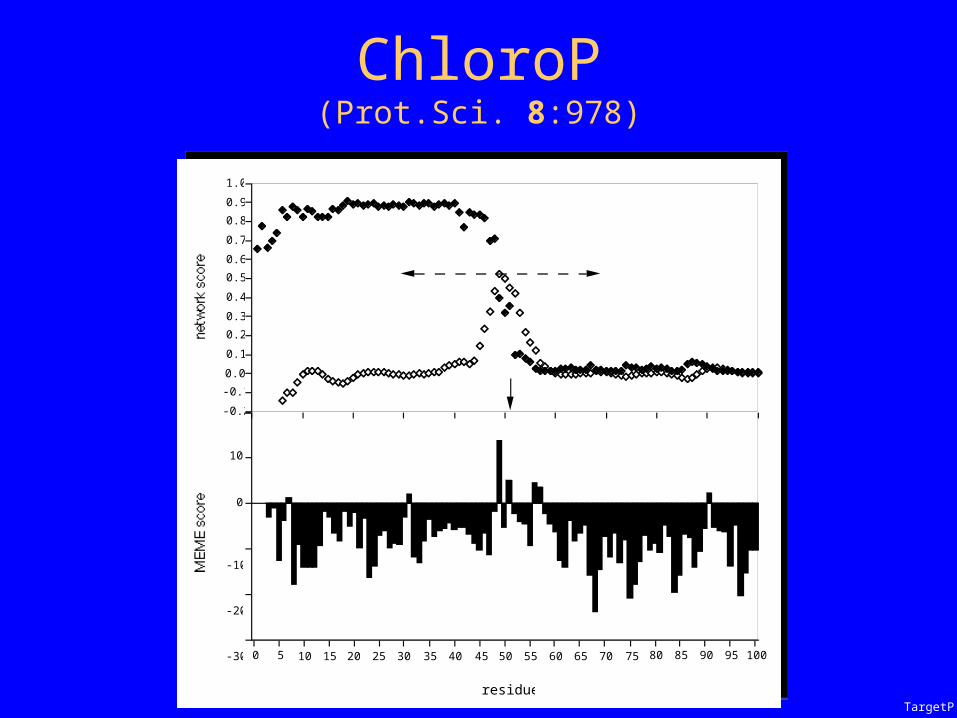
ChloroP(Prot.Sci. 8:978)
0
10
0 5 10 15 20 25 30 35 40 45 50 55 60 65 70 75 80 85 90 95 100
MEME score
residue
-0.2
-0.1
0.0
0.1
0.2
0.3
0.4
0.5
0.6
0.7
0.8
0.9
1.0
network score
-30
-20
-10
TargetP

TargetP - a four-state SP/mTP/cTP/other predictor
(JMB 300:1105)
performance
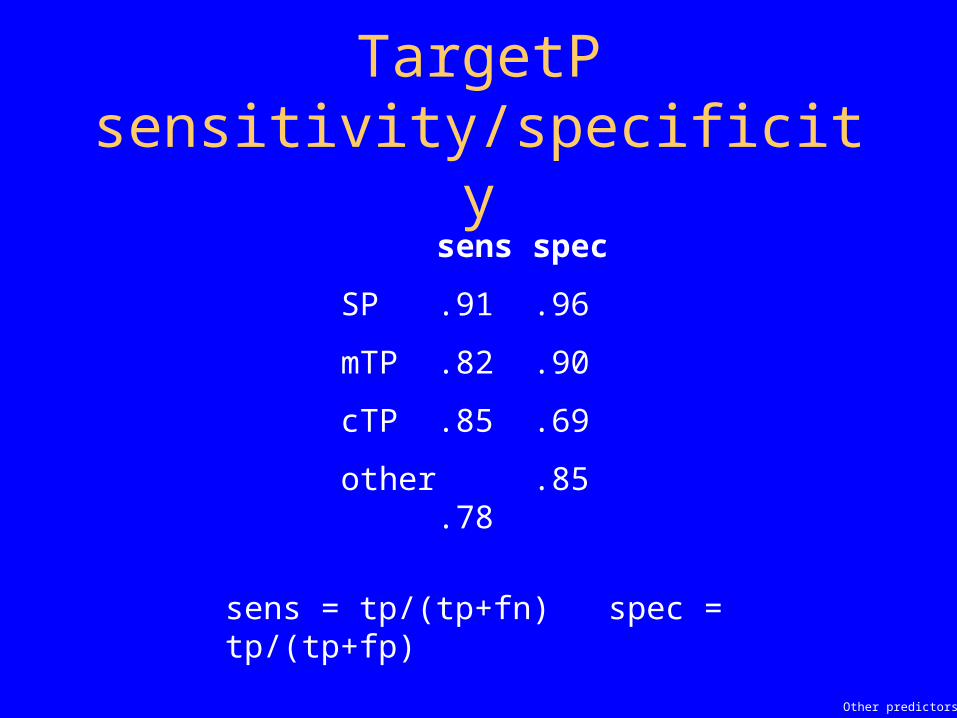
TargetP sensitivity/specificity
sens spec
SP .91 .96
mTP .82 .90
cTP .85 .69
other .85 .78
sens = tp/(tp+fn) spec = tp/(tp+fp)
Other predictors
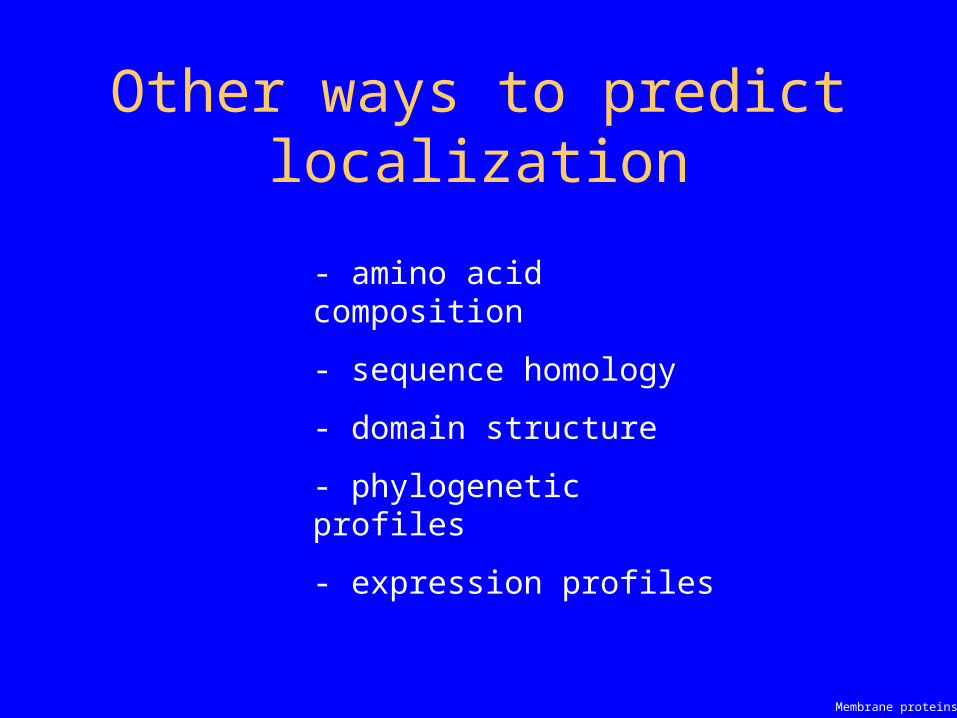
Other ways to predict localization
- amino acid composition
- sequence homology
- domain structure
- phylogenetic profiles
- expression profiles
Membrane proteins
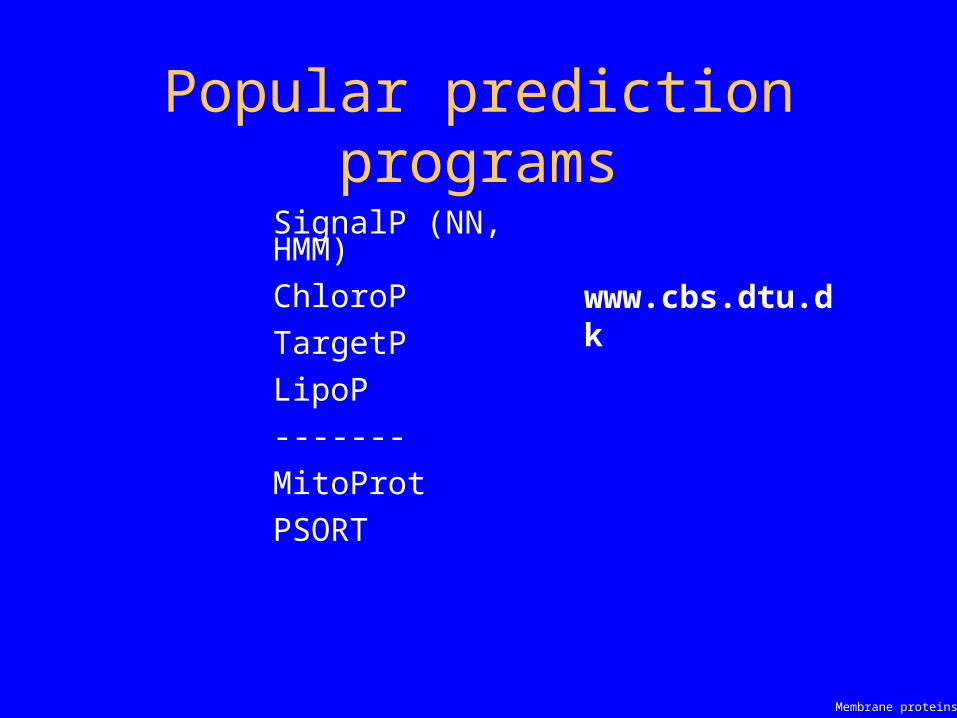
Popular prediction programs
SignalP (NN, HMM)
ChloroP
TargetP
LipoP
-------
MitoProt
PSORT
Membrane proteins
www.cbs.dtu.dk

Membrane protein topology
A simulated lipid bilayer(Grubmüller et al.)
QuickTime™ and aYUV420 codec decompressorare needed to see this picture.

Only two basic structures(Quart.Rev.Biophys. 32:285)
Helix bundle ß-barrel
Lipid/prot interactions
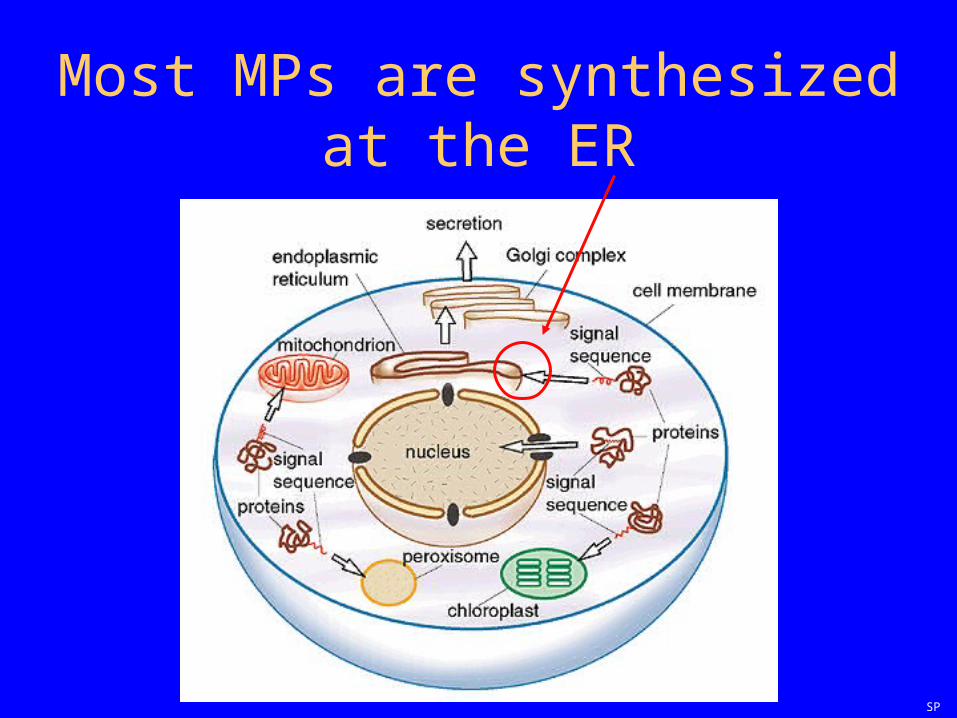
Most MPs are synthesized at the ER
SP

The basic model(courtesy Bill Skach)
prediction

Topology prediction

TM helix lengths are typically 20-30 residues
(Bowie, JMB 272:780)
Trp, Tyr

Trp & Tyr are enriched in the region near the lipid headgroups
(Prot.Sci. 6:808; 7:2026)
Loop lengths

Loops tend to be short(Tusnady & Simon, JMB 283:489)
PI rule

The ’positive inside’ rule(EMBO J. 5:3021; EJB 174:671, 205:1207; FEBS Lett. 282:41)
N
C
+ + +
Bacterial IMin: 16% KR out: 4% KR
Eukaryotic PMin: 17% KR out: 7% KR
Thylakoid membranein: 13% KR out: 5% KR
Mitochondrial IMIn: 10% KR out: 3% KR
in
out
prediction
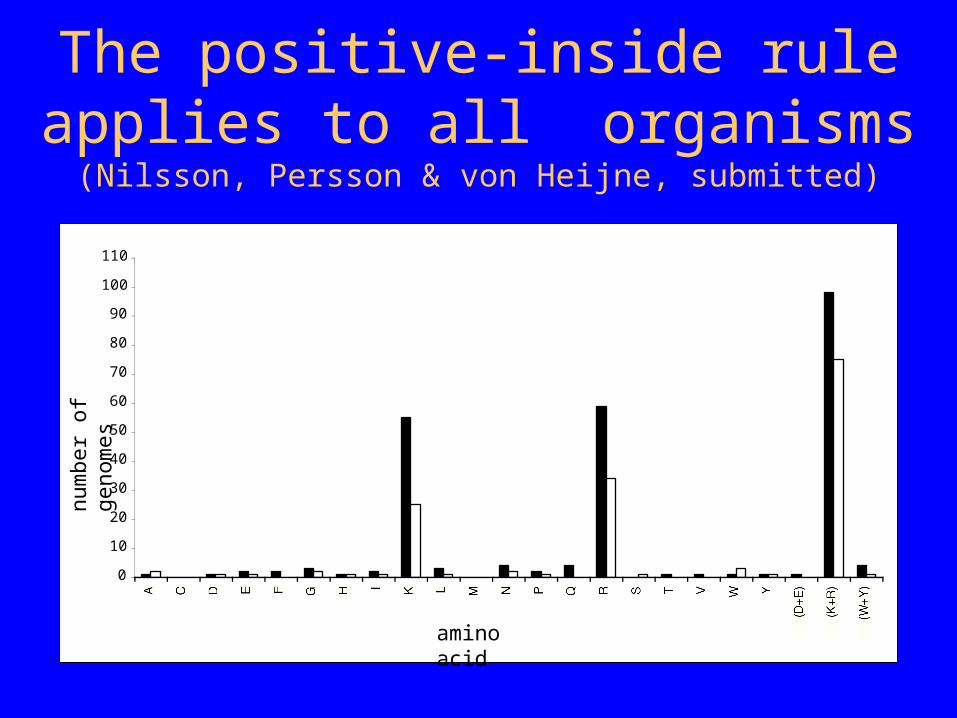
The positive-inside rule applies to all organisms
(Nilsson, Persson & von Heijne, submitted)
0
10
20
30
40
50
60
70
80
90
100
110
A C D E F G H I K L M N P Q R S T V W Y
(D+E) (K+R) (W+Y)
num
ber
of g
enom
es
amino acid
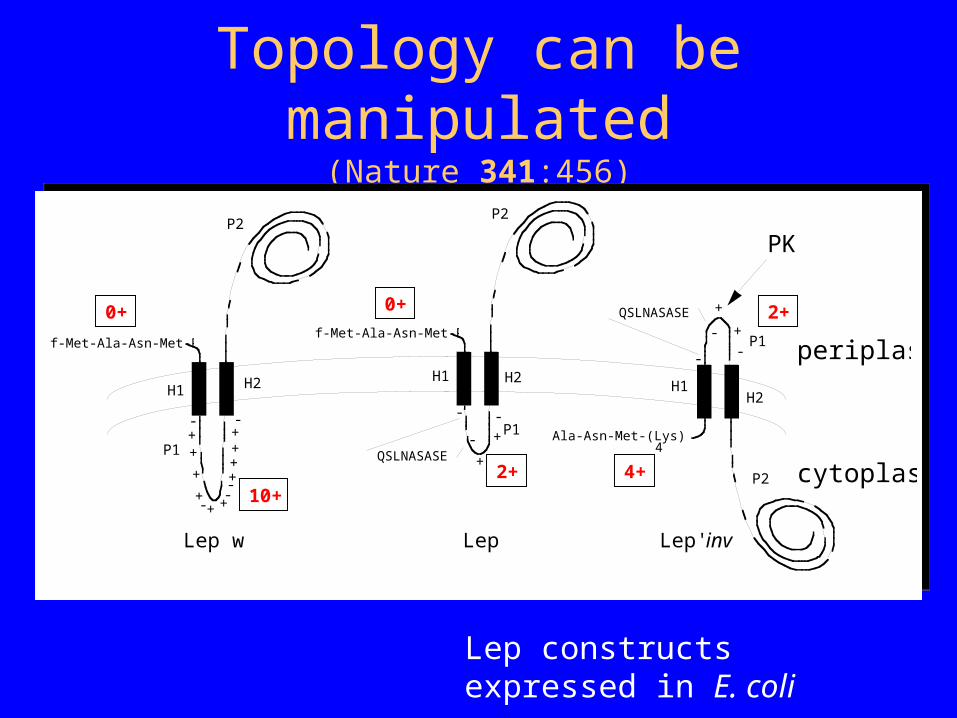
Topology can be manipulated(Nature 341:456)
Lep constructs expressed in E. coli
f-Met-Ala-Asn-Met-Phe-
H1 H2
P1
P2
+
+
- -
QSLNASASE
H1 H2
P1
P2
++
+
+ +
+
++
+
+
- -
---
f-Met-Ala-Asn-Met-Phe-
Ala-Asn-Met-(Lys) -Phe-
H1H2
P1
P2
+
+
- -
QSLNASASE
4-
-
Lep wt Lep' Lep'-inv
periplasm
cytoplasm10+
2+
2+
4+
0+0+
PK
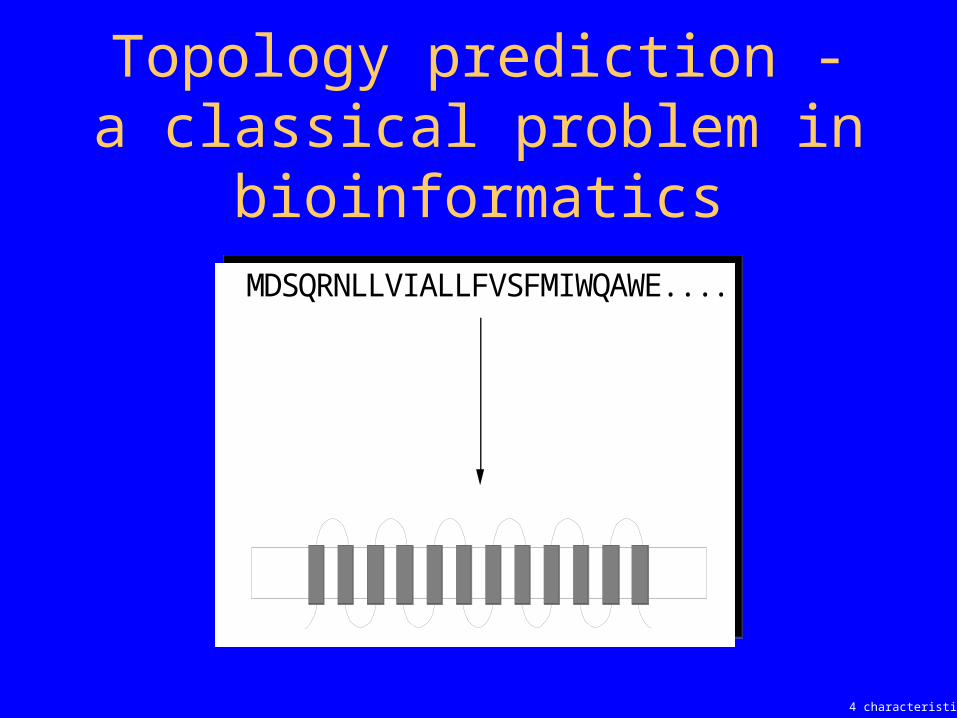
Topology prediction - a classical problem in bioinformatics
MDSQRNLLVIALLFVSFMIWQAWE....
4 characteristics
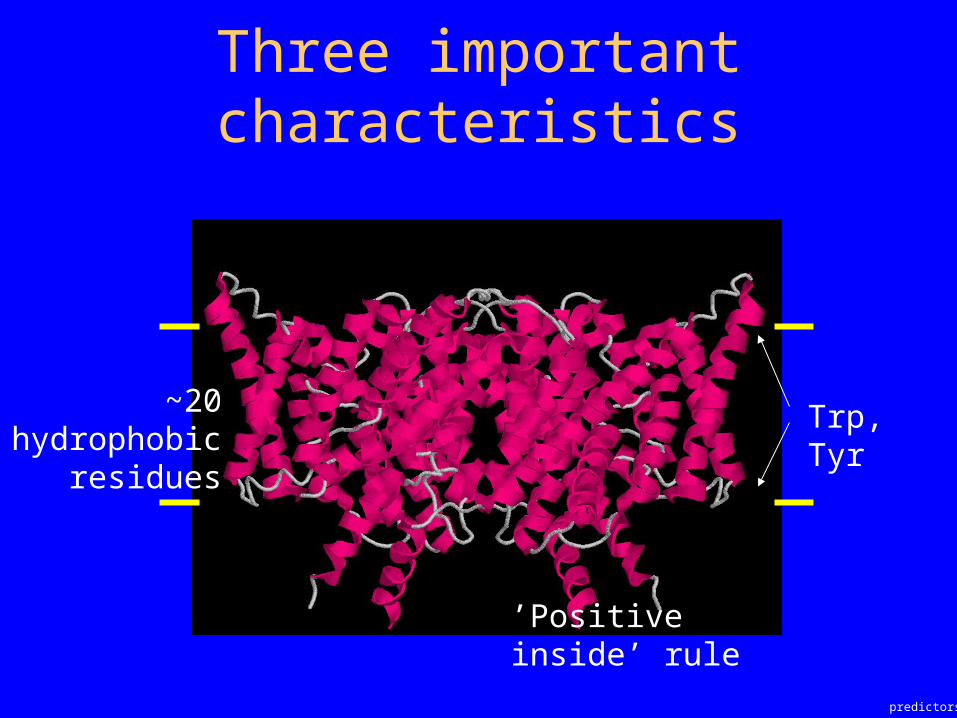
Three important characteristics
~20 hydrophobic residues
predictors
’Positive inside’ rule
Trp, Tyr
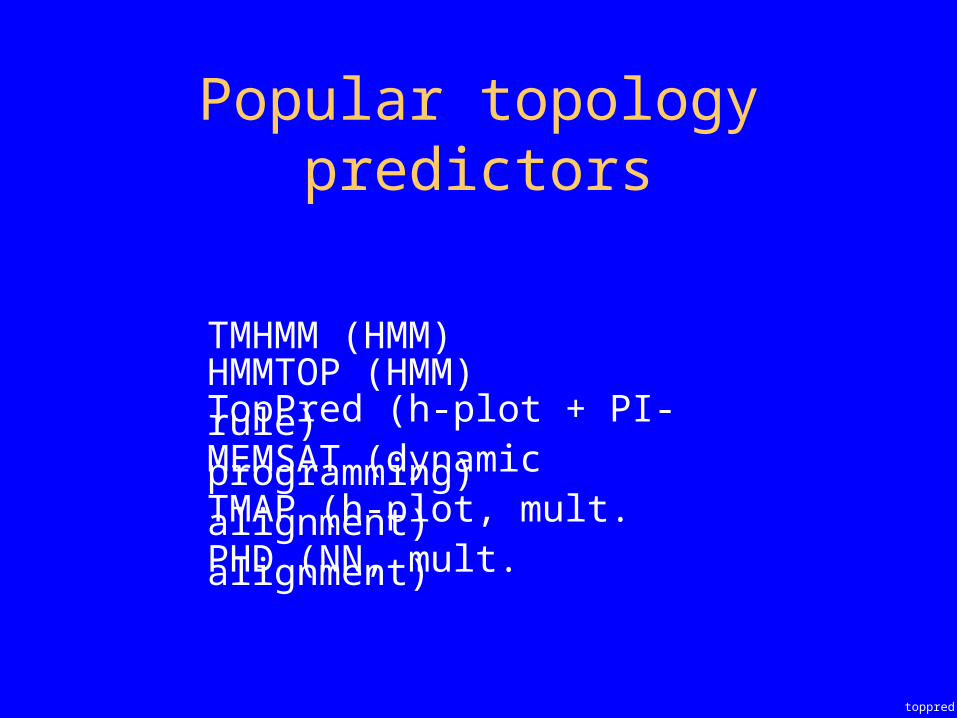
Popular topology predictors
TMHMM (HMM)HMMTOP (HMM)TopPred (h-plot + PI-rule)MEMSAT (dynamic programming)TMAP (h-plot, mult. alignment)PHD (NN, mult. alignment)
toppred

TopPred(JMB 225:487)
0 100 200 300 400-3
-2
-1
0
1
2
3
position
<H>
http://bioweb.pasteur.fr/seqanal/interfaces/toppred.html 2 3 5 4 2 2
1 0 0 1 1 0
2
∆+ = 17
2
1
3
0
5
0
4
1
2
3
0
2
∆+ = 9
- construct all possible topologies
- rank based on +
E. coli LacY
TMHMM
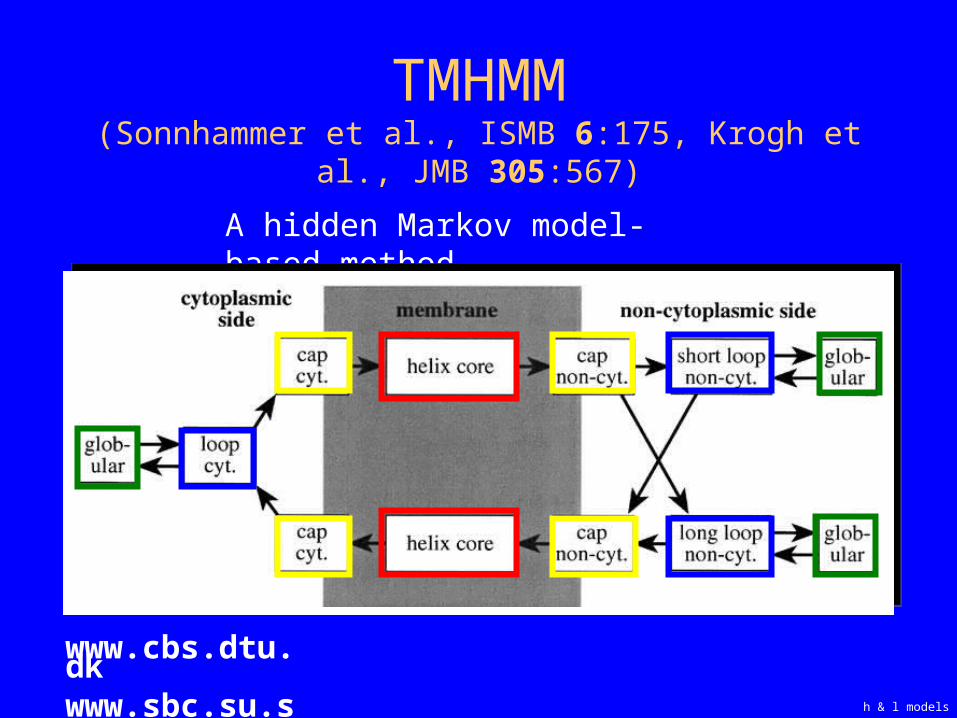
TMHMM(Sonnhammer et al., ISMB 6:175, Krogh et al., JMB
305:567)
h & l models
www.cbs.dtu.dkwww.sbc.su.se
A hidden Markov model-based method

HMMTOP(Tusnady & Simon, JMB 283:489)
performance

Helix & loop models in TMHMM
HMMTOP
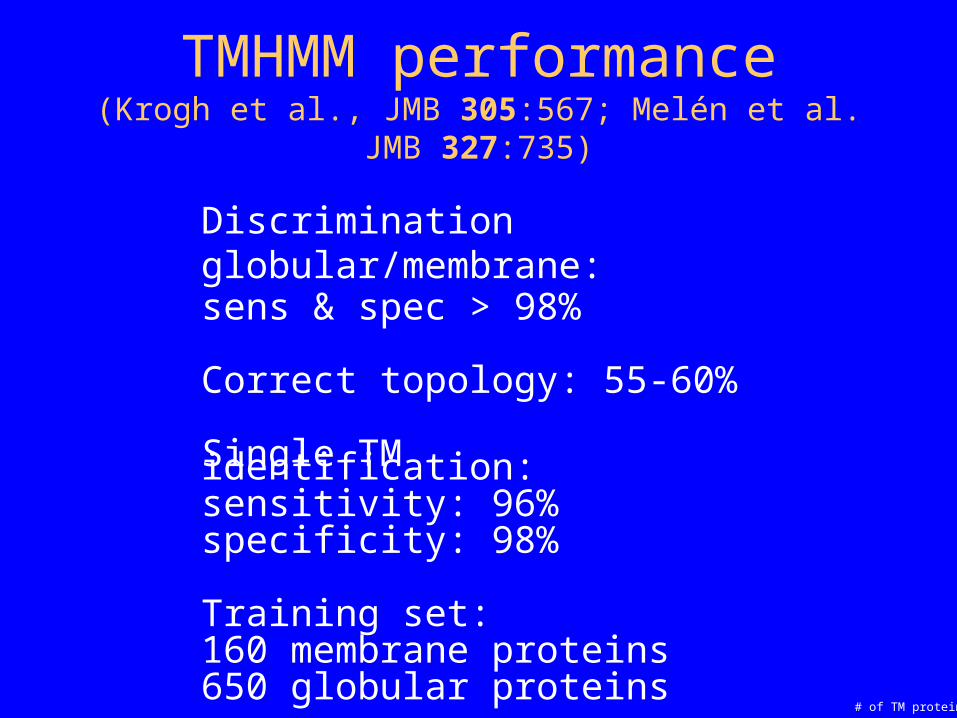
TMHMM performance(Krogh et al., JMB 305:567; Melén et al. JMB 327:735)
Discrimination globular/membrane:sens & spec > 98%
Correct topology: 55-60%
Single TM identification:sensitivity: 96%specificity: 98%
Training set:160 membrane proteins650 globular proteins
# of TM proteins

Can performance be improved?
Consensus predictions
Multiple alignments
Experimental constraints
# of TM proteins

’Consensus’ predictions indicate reliability
(FEBS Lett. 486:267)
0
0,2
0,4
0,6
0,8
1
5/0 4/1 3/2 & 3/1/1 2/1/1/1
60 E. coli proteins
majority level
frac
tion
corr
ect/
cove
rage
5 prediction methods used
46% of 764 predicted E. coli IM proteins are in the 5/0 or 4/1 classes
Partial consensus

TMHMM reliability scores(Melén et al. JMB 327:735)
TMHMM output:
1. Mean probability pmean
2. Minimum probability pmin(label)
3. PbestPath/PallPaths
Sequence: M C Y G K C I p(i): 0.78 0.78 0.78 0.76 0.76 0.08 0.03 p(h): 0.00 0.00 0.02 0.02 0.15 0.85 0.93 p(o): 0.22 0.22 0.20 0.20 0.08 0.07 0.04 Label: i i i i i h h
S3 results

TMHMM (score 3)Prediction accuracy vs. coverage
Test set bias
60
70
80
90
100
0 20 40 60 80 100
perc
ent
corr
ect
coverage
~70%~45%
92 bacterial proteins

”Experimentally known topologies” is a biased sample
0
10
20
30
40
test set
C. elegans
S.cerevisiae
E.coli
perc
ent
0-0.
25
0.25
-0.5
0.5-
0.75
0.75
-1
score interval
Estimate true performance

Correlation between accuracy and TMHMM S3 score
02040608010000.20.40.60.81
mean score
perc
ent
corr
ect
genomes

Expected TMHMM performance on proteomes
E. coli
S. cerevisiae
test set
C. elegans
40
50
60
70
80
90
100
0 25 50 75 100
coverage
perc
ent
corr
ect
Add C-term.

Original TMHMM prediction, one TM helix missing
TMHMM prediction with C-terminus fixed to inside
Experimental information helps(JMB 327:735)
improvement

When the location of the C-terminus is
known, the correct topology is predicted for
an estimated ~70% of all membrane proteins
(~ 55% when not known)
Reporter fusions
Experimental information helps(JMB 327:735)