portland housing advisory commission
TRANSCRIPT


PORTLAND HOUSING ADVISORY COMMISSION
Jesse Beason
Andrew Colas
Rey España
Elisa Harrigan
Deborah Imse
Marc Jolin
Christine Lau
Carter MacNichol
Carmen Rubio
Shannon Singleton
Sarah Zahn
Date: February 4, 2013 To: Mayor Charlie Hales Commissioner Nick Fish Commissioner Amanda Fritz Commissioner Steve Novick Commissioner Dan Saltzman Re: PHB FY 2013‐14 Requested Budget The Portland Housing Advisory Commission (PHAC) appreciates the opportunity to comment on the Portland Housing Bureau’s (PHB) FY 2013‐2014 requested budget. We are committed to the mission, vision and values of the Portland Housing Bureau and support the progress PHB has made in implementing its Strategic Plan. We endorse the Bureau’s Proposed Budget and want to highlight the following considerations. At this time in Portland, home has a special meaning. It separates those without a safe and secure place of their own from greater Portland. Despite the commitment to house our community, too many have been left behind. The promise of a home calls us to address the racial and ethnic disparities in Portland. This year’s budget process has been a particular challenge. There is increasing community need for PHB‐funded programs amidst federal and local cuts to meet those needs. These cuts mean moving fewer people out of homelessness, preventing fewer evictions and foreclosures, creating fewer opportunities for new homeowners of color, and building fewer affordable homes. At this time in Portland, we encourage the City Council to seize the opportunity before you. The Portland Housing Bureau has, with our partners, made progress in achieving our Strategic Plan to help those most in need in our community. Our coalition of trusted nonprofit service providers, affordable housing developers, advocates and other jurisdictions employ best practices to combat issues of homelessness, the minority homeownership gap, foreclosure, housing discrimination, the lack of affordable housing and racial and ethnic inequity. Our challenge lies not in identifying vulnerable people or solutions, but in providing enough resources to meet the rising tide of need. We believe PHB has made the sound choice of focusing community resources on the most serious unmet housing needs. We strongly support fully funding the requested budget and ask that you support it as well. We would like to request your consideration of the following principles that have rooted our approach to the budget review.

We advised PHB to prioritize programs and strategies that are core to PHB’s mission and Strategic Plan. PHB invests in proven, cost‐effective strategies implemented by talented partners. We recommended that PHB make targeted and data‐driven budget decisions based on performance and the ability to meet outcomes. Our budget process has examined all of PHB’s resources, not just City General Funds. We advised PHB to simultaneously avoid cuts to programs with significant leverage and programs without any other sources of funding. The Coalition of Communities of Color report highlighted disparities in our community. As an advisory body to PHB, we encourage the Director and staff to accept the challenge underscored in the report by creating a more inclusive community and fulfilling the promise of PHB's Strategic Plan goal, which commits us to ensure equitable access to housing in Portland. This means working hand in hand with community members and leaders from communities of color, culturally specific organizations and mainstream organizations to develop strategies that significantly reduce the disparities highlighted in the report. We are a stronger community when everyone has access to a place to call home. In the past year, under the leadership of Director Traci Manning, the staff at PHB has methodically worked to implement the Bureau’s equity agenda. The work of equity is woven throughout all business lines and in every programmatic area of PHB. With the goal of ensuring greater access to PHB‐funded programs and the removal of barriers to housing for communities of color, staff has applied an equity lens to all of our funding processes and sub‐recipient contract goals.
The ripple effect of this work can be seen in the new approaches our partners are taking to ensure greater access to their programs. At Transition Projects, the city’s largest homeless shelter provider, the board adopted an equity plan that directs the organization to examine the racial/ethnic composition of people served and the impact of their outcomes. The organization is seeking new culturally specific partners and will host an equity summit in the spring. Cascadia Behavioral Healthcare has an inclusion and equity staff council, where they are identifying new ways to recruit, retain and train culturally competent staff and staff from communities of color to improve their service to diverse clients. The Minority Homeownership Assistance Collaborative, consisting of the culturally specific organizations PCRI, NAYA Family Center, African American Alliance for Homeownership and Hacienda CDC, have helped prepare families for homeownership and made their dreams of homeownership become a reality. In the 10 Year Plan Reset process, the new framework for our community’s strategies to end homelessness, we aim to weave equity throughout all aspects of the plan. Thank you for your commitment to addressing the unmet housing needs of members of our community and for your support of the PHAC and the Portland Housing Bureau. We urge you to fully fund both the base budget and the add back decision packages. We feel PHB has taken a balanced and strategic approach amidst significant challenges. At this time in Portland, we are faced with difficult choices. We have too few resources to meet the growing need. However, by investing in homes, we cast our hopes for a future where kids do not sleep on the street, your race/ethnicity doesn't determine your ability to own a home and your community extends beyond the four walls of your house. Sincerely,
Jesse Beason PHAC Chair

City of Portland, Oregon – FY 2013-14 Requested Budget 1
Portland Housing BureauCommunity Development Service Area
Nick Fish, Commissioner-in-ChargeTraci Manning, Director
Percent of City Budget
Bureau Programs
Bureau Overview
Expenditures Revised
FY 2012-13 RequestedFY 2013-14
Change fromPrior Year
PercentChange
Operating 114,082,675 70,061,931 (44,020,744) (38.59)Capital 0 0 0 0.00
Total Requirements 114,082,675 70,061,931 (44,020,744) (38.59)Authorized Positions 54.90 54.90 0.00 0.00

2 City of Portland, Oregon – FY 2013-14 Requested Budget
Portland Housing BureauCommunity Development Service Area
Port
land
Hou
sing
Bur
eau
Hom
eow
ner A
cces
s &
Ret
entio
n
Hou
sing
Pro
duct
ion
&
Pre
serv
atio
n
Hou
sing
Acc
ess
&
Sta
biliz
atio
n
Pro
gram
Del
iver
yB
usin
ess
Ope
ratio
nsE
quity
, Pol
icy
&
Com
mun
icat
ions
Pla
nnin
gP
olic
y D
evel
opm
ent
Legi
slat
ive
&
Inte
rgov
ernm
enta
l Rel
atio
ns
Res
ourc
e D
evel
opm
ent
Ass
et M
anag
emen
t
Fina
nce
& A
ccou
ntin
g
Bus
ines
s A
naly
sis,
R
esea
rch
& In
form
atio
n Te
chno
logy
Com
plia
nce
& H
R L
iais
on
Pay
roll
& A
dmin
istra
tive
Sup
port
Pub
lic In
volv
emen
t
Pub
lic In
form
atio
nLo
an S
ervi
cing

City of Portland, Oregon – FY 2013-14 Requested Budget 3
Portland Housing BureauCommunity Development Service Area
Bureau SummaryBureau Mission
The mission of the Portland Housing Bureau (PHB) is to solve the unmet housingneeds of the people of Portland. We accomplish our mission by building andpreserving affordable housing, supporting programs that help low-incomePortlanders find, rent, buy, retain and repair their homes, bringing together ourpartners and leading them as we assess the city’s housing needs, choose the bestsolutions to efficiently meet them, and identify how to pay for them, and reachingout to racially and culturally diverse groups to ensure their participation in theeconomic opportunities our housing investments create.
Bureau Overview
PHB stewards several sources of public funds for investments in affordablehousing. Program investments cross a continuum, from resources aimed at endinghomelessness to rental housing development for low-income individuals andfamilies, to targeted homeownership and home retention programs. Funds comefrom three major sources: tax increment financing (TIF) under City policy thatdirects 30% of all TIF expenditures to affordable housing; City General Fund; andfederal funds. The latter come from the U.S. Department of Housing and UrbanDevelopment (HUD) in the form of both entitlement grants (mostly CommunityDevelopment Block Grant and HOME) and competitive grant funds. PHBstrategically deploys these resources in alignment with the Strategic Plan for loansand grants for capital construction of new or rehabilitated housing and to non-profits to deliver safety net services to Portlanders in need.
The Portland Housing Advisory Commission (PHAC) advises PHB. PHACprovides advice both to PHB and to City Council on strategic priorities, alignmentopportunities, and trade-offs inherent in the expenditure of public funds. PHACprovides advice on strategic directions and does not have an explicit decision-making role. However, PHAC helped shape the PHB Strategic Plan and also servesas the bureaus budget advisory committee (BAC). This citizen committee reviewedPHB financial, programmatic, and strategic plan details, took public testimony, andprovided recommendations concerning direction and priorities.
Under the BACs advisement, PHB made more than $2.3 million in reductions tomultiple programs such as a winter shelter, multi-cultural homeownership fairs,and low-cost home furnishing programs, rather than apply a percentage cut acrossall service areas. These decisions were guided by an analysis of what is most core toour mission, alignment with the PHB Strategic Plan, financial leverage, andsupport of our equity agenda.
In addition to making programmatic investments, PHB leads local policy andplanning efforts that seek to improve alignment with state and local governmentpartners who also work to alleviate homelessness and poverty and move peopletowards self sufficiency.

4 City of Portland, Oregon – FY 2013-14 Requested Budget
Portland Housing BureauCommunity Development Service Area
PHB has proactively engaged with our partners to critically review data tostreamline our systems and to find efficiencies. We aspire to deliver cost effectivestrategies to meet the housing needs of vulnerable and low-income Portlanders. Inmodeling good government practices, we engage the communities we serve andmake data driven decisions that result in cost effective investments with maximumpublic benefits. Some examples of these processes include the 10 Year Plan to EndHomelessness Reset; the Portfolio Optimization Project; the Limited Tax ExemptionBig Look Policy Review; Streamlining Compliance; the Portland Housing Growthand Opportunity Analysis; and our Equity Agenda. Each of these efforts includedintergovernmental cooperation and collaboration as well as communityengagement.
PHB works closely with our jurisdictional partners Multnomah County, the City ofGresham, and Home Forward. This consortium, as part of our federal planningand reporting requirements, performs joint federal funding oversight, Fair Housinganalysis and policy recommendations, and community needs and prioritieshearings. As part of our work with Multnomah County, we seek to align ourpriorities and maximize funding leverage. The City and County took jointleadership responsibility for our communitys plan to address homelessness andhave spent the last year actively engaged in updating the plan to reflect our sharedpriorities. Each year PHB contracts directly with Multnomah County to provideemergency shelter ($214,000) and transitional housing ($683,880) for homelessyouth and services for people experiencing mental health issues in supportivehousing ($238,000). In FY 2013-14, we anticipate continuing our collaboration tocapitalize on opportunities for alignment in health care reform, endinghomelessness and community engagement.
Equity is woven throughout PHB policy and operations. The PHB equity agendarecognizes and responds to the historic and institutional barriers to housing,homeownership, and economic stability experienced by communities of color. PHBseeks to place a greater reliance on community-validated data to understand unmetneeds, and to intentionally hold our partners accountable for removing barriersand serving members of minority communities equitably. For example, in the 10Year Reset process, we removed language that might have unintendedconsequences for communities of color and in our most recent Fall Notice OfFunding Availability (NOFA) scoring incentivized applicants to meet our equitygoals in all aspects of future rental developments. We also implemented an equitylens to evaluate our budget reduction scenarios.
PHB's resources are budgeted in seven separate funds. These include the GeneralFund, the Community Development Block Grant (CDBG) Fund, the HOME GrantFund, the Grants Fund, the Tax Increment Financing Reimbursement Fund, theHeadwaters Apartment Complex Fund, and the Housing Investment Fund.
Strategic DirectionPHB adopted a three-year Strategic Plan. The strategic plan establishes four coregoals for PHB to focus on over three years:
1. Meet Portlands need for quality, affordable homes for its residents.2. Ensure equitable access to housing.3. Develop, leverage, and allocate housing funds to meet needs, sustain assets, and
strengthen the housing industry.

City of Portland, Oregon – FY 2013-14 Requested Budget 5
Portland Housing BureauCommunity Development Service Area
4. Build a strong, dynamic Housing Bureau that provides the highest level of leadership and service to customers, stakeholders, employees, and the community.
The Strategic Plan can be found on the bureau’s website.
Through its strategic planning work, PHB has adopted four priorities for itsinvestments. The bureau’s budget is aligned with these priorities:
Priority One: Provide more rental housing for the most vulnerable families. Priority Two: Move people quickly from homelessness to permanent housing
while preventing families on the brink from losing their homes. Priority Three: Help Portlanders from communities of color buy a home or
keep the home they already own. Priority Four: Provide a safety net that includes shelters and other short-term
help for low-income Portlanders who are homeless or at risk of homelessness.
PHB Vision PHB's vision is as follows:
All Portlanders can find affordable homes in healthy neighborhoods withstrong schools, good parks and recreation, healthy natural areas, safe streets,and quality food stores.
All Portlanders have equitable access to housing and to the opportunities thatsafe, stable housing can deliver, free from discrimination.
PHB Values PHB upholds the following values:
Equity: PHB is committed to social justice in the delivery of housing to allresidents of Portlands diverse communities. PHB embraces diversity in itsworkforce and culture.
Stewardship: PHB invests, leverages, and prioritizes spending in ways thatprovide the highest public value and have the greatest influence on criticalhousing needs.
Transparency: PHB builds long-term trust by operating with integrity, invitingbroad public involvement, and following processes that are clear, open, andwithout bias.
Innovation: PHB believes new thinking, partners, and ideas will help build aneffective organization and resolve long-standing problems.
Summary of Budget Decisions
Federal FundingReductions
PHB projects that our allocation of federal funds from HUD will be reduced up to10% due to sequestration. The proposed budget includes projected cuts to CDBGby $770,178 and HOME by $292,039. We also projected a $78,216 reduction to theEmergency Solutions Grant and $109,072 reduction to Housing Opportunities forPeople with HIV/AIDS (HOPWA). PHBs Requested Budget reflects cuts in each ofthese funds achieved through programmatic reductions based on PHB StrategicPlan priorities.

6 City of Portland, Oregon – FY 2013-14 Requested Budget
Portland Housing BureauCommunity Development Service Area
More than 30% of the PHB budget is made up of federal funding. Because of federalfunding rules, only a small percentage of our funds can be used for public services.The 10% cut in these funds not only indicates a permanent funding loss, but it alsoconstricts the proportional amount of the flexible amount of federal funding thatcan be used for core services essential to the housing stability of the people weserve. This year, we project that of the $770,178 cut to CDBG, $450,000 will have tobe cut from programs providing public services, and our other sources of fundingcannot be used to backfill these because they are more prescriptive and can only beused for bricks and sticks.
The following is a sample of the impacts of the projected federal cuts:
1 fewer multi-family property stabilized through rehabilitation 65 households will not receive short term rent assistance 4 individuals will not receive housing and outpatient mental health services 14 households with HIV/AIDS will not receive rent assistance and supportive
services 130 households from communities of color will not receive homeownership
education and counseling
90% Base Budget City bureaus were asked to develop budgets using a modified zero-basedapproach. Each bureau will receive a discretionary allocation 90% of its CurrentAppropriation Level (CAL) target. To achieve this amount, PHB is submitting abudget with General Fund reductions in the amount of $1,083,653. The GeneralFund cuts will primarily impact contracts in the shelter and emergency servicesprograms. PHB utilizes federal dollars or TIF in the other program areas, which aretaking reductions as well.
Taking into account reductions in all funding sources (including Federal notedabove), this proposed budget reflects cuts proportional to the priorities establishedin PHB’s strategic plan -- which was a broadly inclusive process -- that establishedwhat was most core to PHB’s mission.
3% cuts to prevention 4% cuts supportive housing 16% cuts to homebuyer education and counseling and homeownership
retention 19% cuts to emergency services 27% cuts to access services
In addition, there are some programs that we do not recommended to be addedback because they are less core to the PHB mission and strategic priorities, orsimply cannot be sustained due to federal funding cuts.
The reductions necessary to create the 90% base represents a permanentelimination of several programs. The following is a sample of the impacts thatresult because of PHB’s recommended permanent cuts that are not reflected in theadd back packages:
65 households will not receive rent assistance 356 households will not get assisted with household furnishings 168 people will not get housed through home shares 300 people will not graduate from Rent Well with landlord guarantees
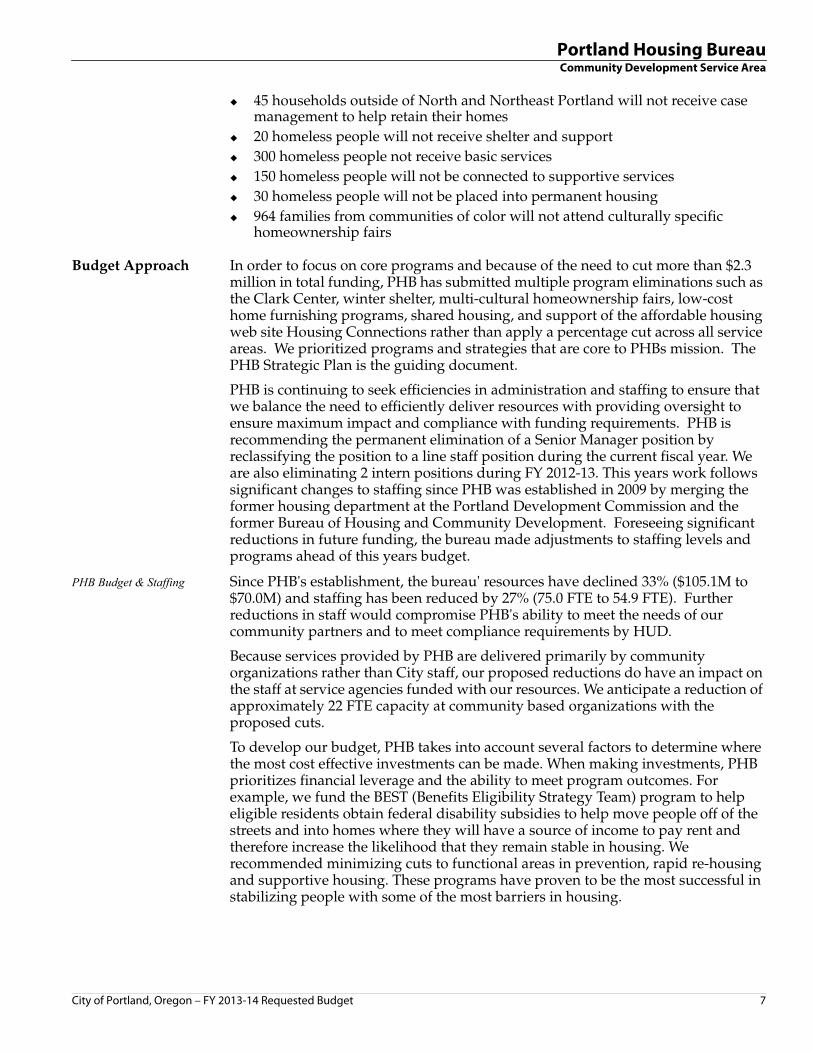
City of Portland, Oregon – FY 2013-14 Requested Budget 7
Portland Housing BureauCommunity Development Service Area
45 households outside of North and Northeast Portland will not receive casemanagement to help retain their homes
20 homeless people will not receive shelter and support 300 homeless people not receive basic services 150 homeless people will not be connected to supportive services 30 homeless people will not be placed into permanent housing 964 families from communities of color will not attend culturally specific
homeownership fairs
Budget Approach In order to focus on core programs and because of the need to cut more than $2.3million in total funding, PHB has submitted multiple program eliminations such asthe Clark Center, winter shelter, multi-cultural homeownership fairs, low-costhome furnishing programs, shared housing, and support of the affordable housingweb site Housing Connections rather than apply a percentage cut across all serviceareas. We prioritized programs and strategies that are core to PHBs mission. ThePHB Strategic Plan is the guiding document.
PHB is continuing to seek efficiencies in administration and staffing to ensure thatwe balance the need to efficiently deliver resources with providing oversight toensure maximum impact and compliance with funding requirements. PHB isrecommending the permanent elimination of a Senior Manager position byreclassifying the position to a line staff position during the current fiscal year. Weare also eliminating 2 intern positions during FY 2012-13. This years work followssignificant changes to staffing since PHB was established in 2009 by merging theformer housing department at the Portland Development Commission and theformer Bureau of Housing and Community Development. Foreseeing significantreductions in future funding, the bureau made adjustments to staffing levels andprograms ahead of this years budget.
PHB Budget & Staffing Since PHB's establishment, the bureau' resources have declined 33% ($105.1M to$70.0M) and staffing has been reduced by 27% (75.0 FTE to 54.9 FTE). Furtherreductions in staff would compromise PHB's ability to meet the needs of ourcommunity partners and to meet compliance requirements by HUD.
Because services provided by PHB are delivered primarily by communityorganizations rather than City staff, our proposed reductions do have an impact onthe staff at service agencies funded with our resources. We anticipate a reduction ofapproximately 22 FTE capacity at community based organizations with theproposed cuts.
To develop our budget, PHB takes into account several factors to determine wherethe most cost effective investments can be made. When making investments, PHBprioritizes financial leverage and the ability to meet program outcomes. Forexample, we fund the BEST (Benefits Eligibility Strategy Team) program to helpeligible residents obtain federal disability subsidies to help move people off of thestreets and into homes where they will have a source of income to pay rent andtherefore increase the likelihood that they remain stable in housing. Werecommended minimizing cuts to functional areas in prevention, rapid re-housingand supportive housing. These programs have proven to be the most successful instabilizing people with some of the most barriers in housing.

8 City of Portland, Oregon – FY 2013-14 Requested Budget
Portland Housing BureauCommunity Development Service Area
Prioritizing Equity We also prioritize equity. We recommended minimizing cuts to programs that havehigh levels of service to families from communities of color and programs in whichwe partner with culturally specific providers such as the Minority HomeownershipAssistance Collaborative, consisting of culturally specific homeownershiporganizations working to close the minority homeownership gap. As part of ourcommitment to ending discrimination in housing, PHB does not recommend anyreductions to programs that support Fair Housing education, outreach andenforcement.
Add-Back Packages In line with City Council direction, PHB is requesting add-back packages totaling$1,083,863 to restore critical services.
The BAC recommended that PHB follow the priorities of the Strategic Plan thatreflect long term goals; however, they also recommended that PHB acknowledgethe current needs of Portlanders given the devastating impacts of the nationalrecession. PHBs General Fund request packages propose adding back funding tosupport programs which provide immediate services to vulnerable peopleexperiencing housing instability and homelessness.
Consistent with the PHB strategic plan, PHB is also requesting support forhomebuyer education and counseling and homeownership retention programs.These services are targeted to minority communities, helping them to access newhomeownership opportunities and maintain current homeownership, particularlyat a time when housing prices and interest rates are low. PHB hopes to continueseveral successful programs carried out in partnership with community-based non-profits such as the Minority Homeownership Assistance Collaborative, toovercome gaps in minority homeownership and foreclosure rates. These funds willbe leveraged with other PHB resources - notably TIF in at least two URAs andcertain federal funds to provide the down payment assistance to a subset ofhouseholds that receive homebuyer education and counseling. Home repair,foreclosure prevention, homeownership education and counseling programs alsosupport community development and neighborhood stabilization and anti-displacement goals.
PHB's four add-back packages are as follows:
Keep the Clark Center Open This $424,650 General Fund request package maintains funding for the ClarkCenter, a 90-bed, facility based shelter serving homeless men. The program,operated by Transitions Projects, provides shelter to more than 699 homeless menannually, assisting them in finding permanent housing and stability. Men primarilyaccess the Clark Center through the Bud Clark Commons Day Center. The waitinglist averages more than 250 names. Impacts include:
90-bed, facility-based shelter capacity 699 homeless men served, 43% moved to stable housing

City of Portland, Oregon – FY 2013-14 Requested Budget 9
Portland Housing BureauCommunity Development Service Area
Preserve the Safety Net This $331,050 General Fund request package provides funding for criticalemergency services to vulnerable homeless populations. Winter recuperation care,Winter Shelter and the Youth Shelter all provide a warm place to sleep and shelterfrom severe weather conditions from November through April, to women,medically vulnerable people and youth. Impacts include:
85 beds for highly vulnerable homeless women experiencing mental illness,fleeing from domestic violence and the elderly available during the coldestmonths from November through April
483 homeless women served 10 people served in recuperative housing for medically vulnerable homeless
transitioning out of the hospital, 75% of which move into stable housing, and100% secure a permanent medical provider
30 beds serving homeless youth 25 homeless youth served, and 80% move into permanent housing, 40% youth
are from communities of color
Permanent Housing and Access for Vulnerable Populations
This $216,300 General Fund request package provides funding for programs thatsupport permanent housing outreach, placement, services and stabilization forvulnerable people. These programs employ our communities most effectivestrategies to end homelessness and stabilize people in housing. They support theStrategic Plan by employing best practices known to transition vulnerable peoplefrom the streets and into stable homes. Programs include mental health outreachand housing placement, street outreach, housing placement and retention, alcoholand drug free communities, rent assistance for families, Rose City Resource Guide,Rent Well administration, Youth Transitional Housing and CommunityEngagement Program. Impacts include:
1.0 FTE mental health street outreach 140 street outreach contacts to unsheltered mentally ill individuals and 15
people placed into permanent housing and retention support. 12 homeless individuals in recovery from addictions will receive transitional
housing and support. 5 chronically homeless individuals with multiple disabilities will secure
permanent housing and support. 9 chronically homeless families, the majority of whom are from communities of
color, will secure permanent housing and support. 6,000 resource guides will be available annually to homeless and low-income
people 15 civic and community agencies will have access to the resource guide 300 graduates from Rent Well will have landlord guarantees 8 youth will receive transitional housing and support, 5 of which will be placed
into permanent housing

10 City of Portland, Oregon – FY 2013-14 Requested Budget
Portland Housing BureauCommunity Development Service Area
Stabilize Families and Prevent Foreclosure
This $74,201 General Fund request package provides funding for programs thatbuild the pipeline of potential homebuyers from communities of color and helphomeowners retain their home. The Portland housing market had adisproportionate impact on low-income households that has resulted indisplacement, gentrification and clusters of people of color living in neighborhoodswith less opportunity. These programs support our Equity Agenda, whichimplements our commitment to equity in opportunity into our Strategic Plan.
671 households from communities of color will receive homeownershipcounseling and education, 20% will become homeowners
45 households outside of North and Northeast Portland will be served by thehomeownership retention program, 87% of households will retain their homes
City of Portland, Oregon – FY 2013-14 Requested Budget 11
Portland Housing BureauCommunity Development Service Area
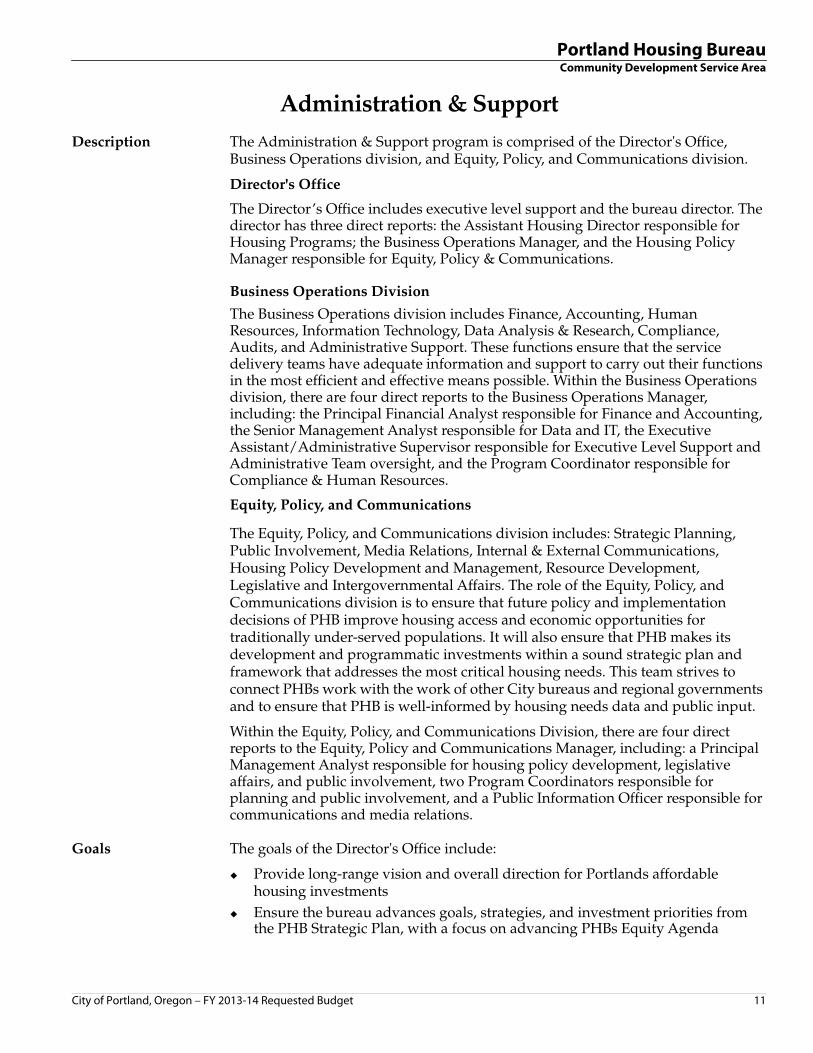
Administration & Support Administration & SupportDescription The Administration & Support program is comprised of the Director's Office,
Business Operations division, and Equity, Policy, and Communications division.
Director's Office
The Director’s Office includes executive level support and the bureau director. Thedirector has three direct reports: the Assistant Housing Director responsible forHousing Programs; the Business Operations Manager, and the Housing PolicyManager responsible for Equity, Policy & Communications.
Business Operations Division
The Business Operations division includes Finance, Accounting, HumanResources, Information Technology, Data Analysis & Research, Compliance,Audits, and Administrative Support. These functions ensure that the servicedelivery teams have adequate information and support to carry out their functionsin the most efficient and effective means possible. Within the Business Operationsdivision, there are four direct reports to the Business Operations Manager,including: the Principal Financial Analyst responsible for Finance and Accounting,the Senior Management Analyst responsible for Data and IT, the ExecutiveAssistant/Administrative Supervisor responsible for Executive Level Support andAdministrative Team oversight, and the Program Coordinator responsible forCompliance & Human Resources.
Equity, Policy, and Communications
The Equity, Policy, and Communications division includes: Strategic Planning,Public Involvement, Media Relations, Internal & External Communications,Housing Policy Development and Management, Resource Development,Legislative and Intergovernmental Affairs. The role of the Equity, Policy, andCommunications division is to ensure that future policy and implementationdecisions of PHB improve housing access and economic opportunities fortraditionally under-served populations. It will also ensure that PHB makes itsdevelopment and programmatic investments within a sound strategic plan andframework that addresses the most critical housing needs. This team strives toconnect PHBs work with the work of other City bureaus and regional governmentsand to ensure that PHB is well-informed by housing needs data and public input.
Within the Equity, Policy, and Communications Division, there are four directreports to the Equity, Policy and Communications Manager, including: a PrincipalManagement Analyst responsible for housing policy development, legislativeaffairs, and public involvement, two Program Coordinators responsible forplanning and public involvement, and a Public Information Officer responsible forcommunications and media relations.
Goals The goals of the Director's Office include:
Provide long-range vision and overall direction for Portlands affordablehousing investments
Ensure the bureau advances goals, strategies, and investment priorities fromthe PHB Strategic Plan, with a focus on advancing PHBs Equity Agenda

12 City of Portland, Oregon – FY 2013-14 Requested Budget
Portland Housing BureauCommunity Development Service Area
Work collaboratively with a wide range of partners to solve the unmet housingneeds of the people of Portland
The goals of the Business Operations Division include:
Ensure that administrative functions are delivered consistently, reliably andeffectively
Provide strong financial and accounting services Deliver excellence in compliance Support the bureaus equity goals through internal business practices, quality
data, contract goals and publications on the website Strengthen data collection, data analysis and data reporting through
maximizing the use of all information technology systems Ensure timely, confidential and supportive human resource services
The goals of the Equity, Policy and Communications Division include:
Provide an equity lens to all PHB business, policies and decision-making Ensure that future policy and implementation decisions of PHB improve
housing access and economic opportunities for traditionally under-servedpopulations
Guide PHB investments within a sound strategic plan to positively impact themost critical housing needs
Connect PHBs work with the work of other City bureaus and regionalgovernments
Inform PHB on current housing needs data and public input to direct policiesand practices
Provide effective internal and external communications
Performance Performance for the Administration & Support program can be found in theperformance measures table, which includes both trend and projectioninformation.
Changes to Servicesand Activities
Based on the recommendations of the cross-functional budget team, PHB isimplementing internal operational efficiencies which equate to the ability of staff touse their time and talents more effectively:
Continue to find efficiencies in operations while not compromising compliancerequirements and customer service.
During FY 2012-13, Asset Management functions are being moved to HousingProduction and Preservation to better align with the bureaus housing rehabilitationand preservation activities.
Even though administrative costs have actually gone down, the amount as apercentage of the total bureau budget has gone up due to the reduction in overallbureau budget dollars.

City of Portland, Oregon – FY 2013-14 Requested Budget 13
Portland Housing BureauCommunity Development Service Area
FTE & Financials Actual
FY 2010-11 Actual
FY 2011-12 Revised
FY 2012-13
Requested No DP
FY 2013-14 RequestedFY 2013-14
FTE 34.00 35.00 35.53 28.53 28.53Expenditures
Administration 74 0 0 0 0Administration & Support 465,245 779,504 779,372 607,645 607,645Asset Management 0 0 492,522 0 0Business Services 4,812,698 4,706,257 5,333,117 4,176,172 4,213,834Director's Office 582,558 396,754 283,508 353,330 353,330Planning & Policy 700,125 507,035 987,260 860,297 860,297
Total Expenditures 6,560,700 6,389,550 7,875,779 5,997,444 6,035,106
Performance Actual
FY 2010-11 Actual
FY 2011-12 Yr End Est.FY 2012-13
BaseFY 2013-14
TargetFY 2013-14
Effectiveness% PHB Data Users Providing Accurate & Timely Data 85% 91% 90% 90% 90%
EfficiencyAdmin Costs As a % Of Bureau Level Budget 7% 8% 8% 10% 10%
Workload Number of Sub-recipient Contracts Processed 93 92 92 85 85# of Users Trained And Supported In PHB Data Systems 859 900 1,000 1,050 1,050

14 City of Portland, Oregon – FY 2013-14 Requested Budget
Portland Housing BureauCommunity Development Service Area
Economic Opportunity Economic OpportunityDescription City Council transferred the Economic Opportunity initiative to the Portland
Development Commission (PDC) effective July 1, 2009. PHB passes CDBG funds toPDC to support these programs and services. General Fund resources are budgeteddirectly in the PDC allocation.
The CDBG allocation for FY 2013-14 reflects the bureaus estimate of a 10%reduction in the CDBG entitlement allocation.
Goals Information on goals is available in the PDC budget.
Performance Information on performance is available in the PDC budget.
Changes to Activitiesand Services
Information on changes is available in the PDC budget.
FTE & Financials Actual
FY 2010-11 Actual
FY 2011-12 Revised
FY 2012-13
Requested No DP
FY 2013-14 RequestedFY 2013-14
FTE 0.00 0.00 0.05 0.05 0.05Expenditures
Economic Opportunity 5,090 38 2,114,907 2,120,431 1,908,940Economic Opportunity Initiatives (14,097) 0 0 0 0Microenterprise Growth 952,600 1,025,457 0 0 0Workforce Development 2,364,408 1,389,567 0 0 0
Total Expenditures 3,308,001 2,415,062 2,114,907 2,120,431 1,908,940

City of Portland, Oregon – FY 2013-14 Requested Budget 15
Portland Housing BureauCommunity Development Service Area
Ending Homelessness Programs Housing Access & StabilizationDescription The bureaus Housing Access & Stabilization program (HAS) creates opportunities
for housing stability for thousands of households per year by investing inprograms and coordinating community initiatives. In FY 2011-12 HAS fundingassisted approximately 5,379 families and individuals by preventing theirhomelessness, supporting their transition to greater housing stability and/orenabling them to secure permanent homes. This is 879 more families andindividuals served, which is an 8% increase from service levels in the prior fiscalyear.
HAS funds are contracted to over 16 nonprofit and public agencies to provide acomprehensive range of services that address the needs of people experiencinghomelessness, from street outreach to permanent housing placement. Servicesprimarily fall into four categories:
Access and stabilization services Prevention and rapid re-housing Supportive housing Shelter and emergency services
Programs funded by the PHB are effective in ending homelessness. Supportivehousing, housing placement and street outreach, short term rent assistance, benefitsacquisitions and retention services are examples of strategies proven to help peopleexperiencing homelessness achieve housing stability and self sufficiency. Ourpartners are experts at serving people with barriers to housing such as mentalhealth issues, criminal convictions, health challenges and multiple episodes ofhomelessness. National studies have shown the long-term cost savings of fundingthese strategies because they alleviate financial strains on emergency health care,law enforcement and other public systems. We have prioritized greatercollaboration with public safety in our ending homelessness programs. PHBconvenes the outreach and engagement working group which has broadmembership including members from the Portland Police Bureau, Portland Patroland Parks Bureau Park Rangers. PHB is increasing collaboration with the healthcare system to leverage changes the Affordable Care Act will bring, as well.
Goals The HAS is fully aligned with the goals of the 10-Year Plan to End Homelessnessfor Portland and Multnomah County, adopted by Portland City Council and theMultnomah County Commission in December 2004.
The Ten Year Plan brought together an unprecedented level of coordination andcooperation among funding jurisdictions and service providers. Building upon pastwork and lessons learned, and recognizing the limitations of our current system, aTen Year Plan Reset Committee has convened to tackle the crisis of homelessness.
The committee has recommended a new governing body that will respond tocurrent challenges, take advantage of new opportunities, and incorporate what wehave learned from past efforts.

16 City of Portland, Oregon – FY 2013-14 Requested Budget
Portland Housing BureauCommunity Development Service Area
That governing body and leadership from local jurisdictions will then continueengaging with community stakeholder groups to develop a comprehensive ActionPlan by June 30, 2013. The Action Plan will identify the most effective strategies toend homelessness.
Preservation of current public investments, with a commitment to align scarcedollars to be used as effectively and efficiently as possible.
Creative strategies to leverage additional resources among public,philanthropic, business, faith and secular nonprofit sectors.
Coordinated public investments in safety net services and permanent solutions-- breaking down the silos among various systems (such as health, communityjustice, mental health) to more effectively and efficiently advance endinghomelessness efforts.
Commitment to set ambitious goals and hold ourselves accountable tomeasuring and achieving them.
Identification of resources to meet our goals and develop proactive strategies toobtain resources.
Initially, a focus will be placed on directing existing resources to support veryvulnerable populations, particularly:
Families with children Unaccompanied youth Adults with disabling health and behavioral health conditions, including
addictions Women Veterans
A racial equity lens will be used to inform and guide the allocation of resources toeffectively address disparities based on race and ethnicity which are prevalent andpervasive within the priority populations and other groups experiencinghomelessness.
The Committee will also improve alignment of existing resources to support a morecomprehensive, integrated approach to service delivery, consisting of six priorityprogram areas:
1. Housing2. Income and benefits3. Health4. Survival and emergency services 5. Access to services6. System coordination
Performance Performance of the HAS can be found in the performance measures table, whichincludes both trend and projection information. (Technical note - PHB hasexpanded the performance measures for households receiving rent assistance andhousing placement to include both new households and households receivingongoing support.)

City of Portland, Oregon – FY 2013-14 Requested Budget 17
Portland Housing BureauCommunity Development Service Area
Changes to Activitiesand Services
Reductions in federal funds (CDBG, ESG, and HOPWA) will result in reductions tocurrently high-performing contracts. Smaller reductions were made in functionalareas and contracts that are aligned with the core PHB mission and values. HASwill measure the performance of its contracts with an equity lens and work toimprove services to populations overrepresented in homeless statistics. There isincreased jurisdictional coordination, including the implementation of the10-YearPlan Reset Process, as well as shelter and rent assistance refinements that willequate to shorter shelter stays. The team will work towards stronger connectionsbetween HAS efforts and the City-supported affordable housing portfolio and alsomake progress towards PHB Strategic Plan goals.
FTE & Financials Actual
FY 2010-11 Actual
FY 2011-12 Revised
FY 2012-13
Requested No DP
FY 2013-14 RequestedFY 2013-14
FTE 5.00 3.65 3.12 3.12 3.12Expenditures
Access and Stabilization 0 1,559,774 1,661,509 560,825 603,825Housing Access & Stabilization 31,022 12,718 0 0 0Prevention & Rapid Rehousing 1,074,295 3,335,152 3,380,807 3,037,390 2,953,284Shelter & Emergency Services 2,025,553 6,740,950 4,418,817 3,472,008 3,813,708Supportive Housing 3,703,809 2,721,502 5,467,619 5,621,561 5,661,929Transitional Housing 6,433,742 (37,167) 0 0 0
Total Expenditures 13,268,421 14,332,929 14,928,752 12,691,784 13,032,746
Performance Actual
FY 2010-11 Actual
FY 2011-12 Yr End Est.FY 2012-13
BaseFY 2013-14
TargetFY 2013-14
EffectivenessPercent of exits from shelter into stable housing 31% 38% 38% 31% 38%Percent of households receiving placement assistance retaining longterm assisted housing with supportive services at 6 mos
86% 96% 95% 95% 95%
Percent of households recieving placement assistance retaining longterm assisted housing with supportive services at 12 mos
76% 93% 93% 93% 93%
EfficiencyAverage length of stay in interim housing (in days) 254 265 265 265 265Average length of rent assistance, eviction prevention in days 121 181 181Average length of stay in emergency shelter (in days) 55 59 60 60 60
Workload Number of households served in emergency shelters 1,635 2,294 2,300 1,075 2,280Number of households served in interim housing 338 369 370 310 310Number of households recieving rent assistance and eviction prevention
1,373 2,130 1,475 1,475 1,475
Number of households receiving placement rent assistance 1,713 1,938 1,940 1,595 1,875Number of households residing in longterm assisted housing with supportive services
266 383 400 360 360
18 City of Portland, Oregon – FY 2013-14 Requested Budget
Portland Housing BureauCommunity Development Service Area
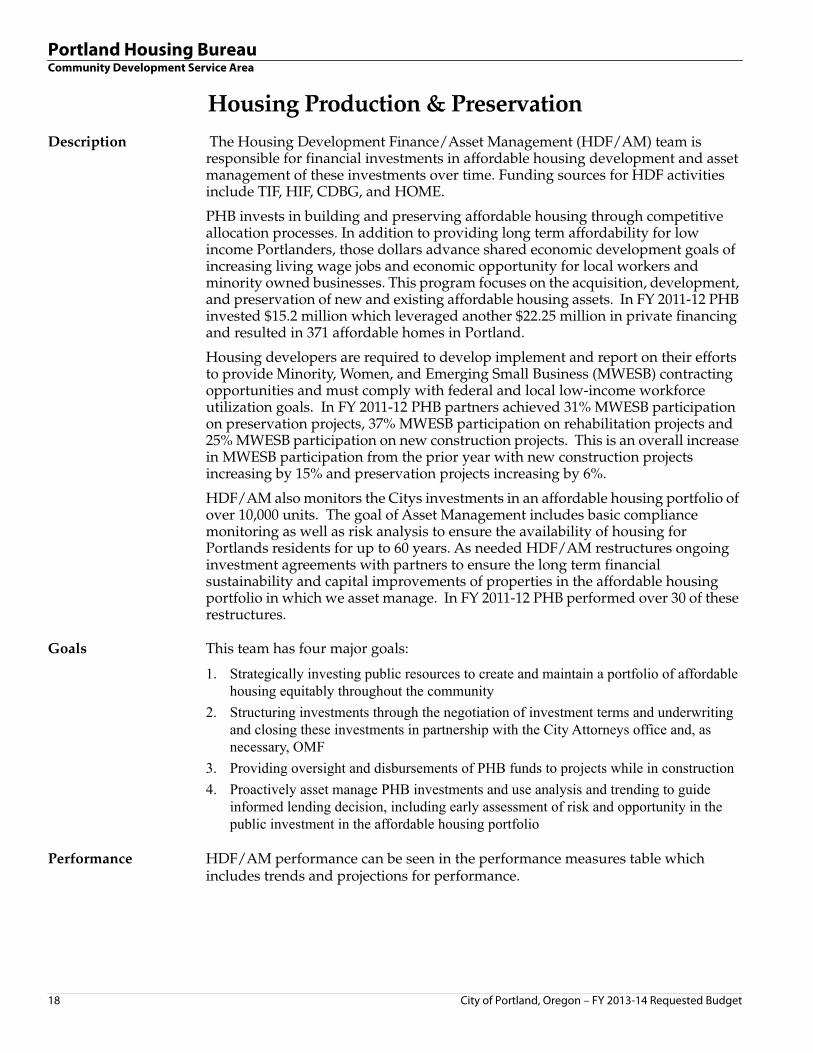
Rental Housing Programs Housing Production & PreservationDescription The Housing Development Finance/Asset Management (HDF/AM) team is
responsible for financial investments in affordable housing development and assetmanagement of these investments over time. Funding sources for HDF activitiesinclude TIF, HIF, CDBG, and HOME.
PHB invests in building and preserving affordable housing through competitiveallocation processes. In addition to providing long term affordability for lowincome Portlanders, those dollars advance shared economic development goals ofincreasing living wage jobs and economic opportunity for local workers andminority owned businesses. This program focuses on the acquisition, development,and preservation of new and existing affordable housing assets. In FY 2011-12 PHBinvested $15.2 million which leveraged another $22.25 million in private financingand resulted in 371 affordable homes in Portland.
Housing developers are required to develop implement and report on their effortsto provide Minority, Women, and Emerging Small Business (MWESB) contractingopportunities and must comply with federal and local low-income workforceutilization goals. In FY 2011-12 PHB partners achieved 31% MWESB participationon preservation projects, 37% MWESB participation on rehabilitation projects and25% MWESB participation on new construction projects. This is an overall increasein MWESB participation from the prior year with new construction projectsincreasing by 15% and preservation projects increasing by 6%.
HDF/AM also monitors the Citys investments in an affordable housing portfolio ofover 10,000 units. The goal of Asset Management includes basic compliancemonitoring as well as risk analysis to ensure the availability of housing forPortlands residents for up to 60 years. As needed HDF/AM restructures ongoinginvestment agreements with partners to ensure the long term financialsustainability and capital improvements of properties in the affordable housingportfolio in which we asset manage. In FY 2011-12 PHB performed over 30 of theserestructures.
Goals This team has four major goals:
1. Strategically investing public resources to create and maintain a portfolio of affordable housing equitably throughout the community
2. Structuring investments through the negotiation of investment terms and underwriting and closing these investments in partnership with the City Attorneys office and, as necessary, OMF
3. Providing oversight and disbursements of PHB funds to projects while in construction4. Proactively asset manage PHB investments and use analysis and trending to guide
informed lending decision, including early assessment of risk and opportunity in the public investment in the affordable housing portfolio
Performance HDF/AM performance can be seen in the performance measures table whichincludes trends and projections for performance.

City of Portland, Oregon – FY 2013-14 Requested Budget 19
Portland Housing BureauCommunity Development Service Area
Changes to Servicesand Activities
Current local market conditions are putting substantial upward pressure on rents,making rental housing in Portland more expensive and harder to access for anyonewith any barriers. In response, the HDF/AM team, in will conduct a review of itsinvestment and monitoring processes. The goals include: improving efficiency,making sure limited resources are deployed most effectively to leverage othercommunity amenities (employment, education, transportation, healthcare, etc.)and financial resources, ensuring that resources are deployed equitably, and tomonitor the public investment in the Citys affordable housing infrastructure insuch a way as to proactively take advantage of opportunities to increase the publicbenefit and control risk. During FY 2012-13, Asset Management functions are beingmoved to Housing Production and Preservation to better align with the bureaushousing rehabilitation and preservation activities.
These efforts will be informed by an analysis of the PHB loan portfolio as well as acapital needs assessment of existing projects in which the City has previouslyinvested, the Portland Plan and the Housing Strategy currently underway, reviewof the utilization of investment dollars during construction and by end usersthrough an equity lens, and work with community partners and stakeholders.
The HDF/AM team is also collaborating with partners in the affordable housingindustry to develop innovative strategies to redefine affordable housingproduction and financial repositioning to ensure long term financial sustainabilitywhile maintaining affordability. Under the leadership of the Assistant Director,HDF/AM will review investment priorities, loan modification policies andongoing performance of the portfolio to develop strategies that maintain the longterm financial viability of the portfolio.
FTE & Financials Actual
FY 2010-11 Actual
FY 2011-12 Revised
FY 2012-13
Requested No DP
FY 2013-14 RequestedFY 2013-14
FTE 16.00 10.10 7.41 14.41 14.41Expenditures
Homeownership (12,577) 0 0 0 0Housing Development Support 0 266,871 1,990,158 920,557 889,657Housing Production & Preservation 1,594,039 124,272 0 0 0New Construction 224 36,637,396 44,428,322 26,232,342 25,971,203Preservation 0 606,363 15,871,372 1,564,440 1,564,440Rehabilitation 38,828,088 10,651,468 13,959,622 12,015,781 12,066,285Rental Housing Access & Stabilization 3,004,370 102,807 0 0 0
Total Expenditures 43,414,144 48,389,177 76,249,474 40,733,120 40,491,585
Performance Actual
FY 2010-11 Actual
FY 2011-12 Yr End Est.FY 2012-13
BaseFY 2013-14
TargetFY 2013-14
EffectivenessVacancy Rate of Units Built 0 to 60% MFI 5% 5% 5% 5% 5%Expiring Section 8 rental units preserved affordable for 0-60 MFI 156 144 212Percent of M/W/ESB contracts in housing rehabs (contract $ awarded)
NA 37% 37% 37% 37%

20 City of Portland, Oregon – FY 2013-14 Requested Budget
Portland Housing BureauCommunity Development Service Area
EfficiencyInvestment per affordable housing unit $27,078 $41,000 $41,000 $45,000 $45,000Investment per expiring Section 8 housing unit preserved $21,250 $19,926 $25,000 $25,000 $25,000Investment per affordable unit rehabilitated $21,518 $20,000 $25,000 $25,000 $25,000Number of lead and mold hazards removed from housing units with children
167 145 150 150 150
Workload Rental units built affordable for 0 to 60% MFI 92 125 125 125 125Rental units built affordable for 61+ to 100% MFI 5Rental units rehabilitated affordable for 0 to 60% MFI 181 236 240 200 200# of Housing Assets Monitored 315 315 315 315 315
Performance Actual
FY 2010-11 Actual
FY 2011-12 Yr End Est.FY 2012-13
BaseFY 2013-14
TargetFY 2013-14

City of Portland, Oregon – FY 2013-14 Requested Budget 21
Portland Housing BureauCommunity Development Service Area
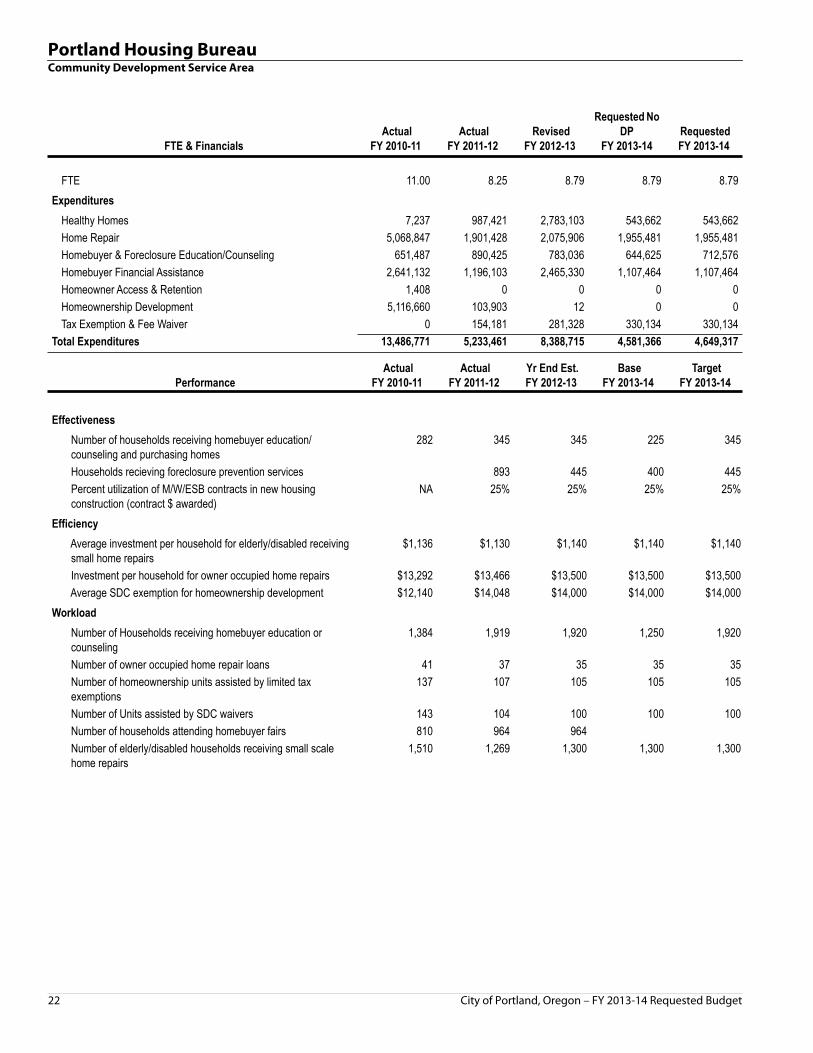
Homeownership Programs Homeowner Access & RetentionDescription Homeowner Access & Retention (HAR) invests in services to help families from
communities of color and others become new homebuyers, access homeownershipopportunities, and support current homeowners in retaining their homes. Supportfor low income first time homebuyers includes education and counseling, andassistance provided for down payments and closing costs. HAR helps currenthomeowners retain their homes by funding foreclosure prevention education andcounseling.
Funding for home repair grants and loans also helps current low-incomehomeowners maintain their homes. Programs to improve the condition of existinghousing addresses the impact that housing condition can have on health. Thesehealthy homes programs include administration of federal funds to reduce lead-based paint hazards in homes with young children, and federal grant funds toaddress habitability issues.
Finally, HAR administers programs that provide incentives for the development ofnew homeownership opportunities for low and moderate income households,including System Development Charge waivers and Limited Tax Exemptions.
In FY 2011-12 HAR served 3,561 households, this is 225 more households or 9%more households than in the prior fiscal year.
Goals The goals of the Homeowner Access & Retention section include:
Closing the minority homeownership gap Provide foreclosure prevention education and counseling Provide support to current homeowners so they can retain their homes Enable homeownership by providing down payment assistance and closing
costs, education and counseling
Performance HAR program performance measures can be found in the performance measurestable, which includes both trends and projections.
Changes to Servicesand Activities
In alignment with the bureau’s Strategic Plan, Homeownership Access andRetention will strengthen the services provided to potential homebuyers andexisting households of color, ensure that the current programs are providingoptimum customer service, and complement existing services available in theprivate market. HAR will measure its performance and that of its contractors withan equity lens, and set goals aimed at closing the minority homeownership gap.Responding to the current market, HAR will convene stakeholders to evaluatehomeownership and foreclosure data to develop strategies to address needs, gaps,and opportunities, including identifying additional resources to bring to thecommunity for this work.
22 City of Portland, Oregon – FY 2013-14 Requested Budget
Portland Housing BureauCommunity Development Service Area
FTE & Financials Actual
FY 2010-11 Actual
FY 2011-12 Revised
FY 2012-13
Requested No DP
FY 2013-14 RequestedFY 2013-14
FTE 11.00 8.25 8.79 8.79 8.79Expenditures
Healthy Homes 7,237 987,421 2,783,103 543,662 543,662Home Repair 5,068,847 1,901,428 2,075,906 1,955,481 1,955,481Homebuyer & Foreclosure Education/Counseling 651,487 890,425 783,036 644,625 712,576Homebuyer Financial Assistance 2,641,132 1,196,103 2,465,330 1,107,464 1,107,464Homeowner Access & Retention 1,408 0 0 0 0Homeownership Development 5,116,660 103,903 12 0 0Tax Exemption & Fee Waiver 0 154,181 281,328 330,134 330,134
Total Expenditures 13,486,771 5,233,461 8,388,715 4,581,366 4,649,317
Performance Actual
FY 2010-11 Actual
FY 2011-12 Yr End Est.FY 2012-13
BaseFY 2013-14
TargetFY 2013-14
EffectivenessNumber of households receiving homebuyer education/counseling and purchasing homes
282 345 345 225 345
Households recieving foreclosure prevention services 893 445 400 445Percent utilization of M/W/ESB contracts in new housing construction (contract $ awarded)
NA 25% 25% 25% 25%
EfficiencyAverage investment per household for elderly/disabled receiving small home repairs
$1,136 $1,130 $1,140 $1,140 $1,140
Investment per household for owner occupied home repairs $13,292 $13,466 $13,500 $13,500 $13,500Average SDC exemption for homeownership development $12,140 $14,048 $14,000 $14,000 $14,000
Workload Number of Households receiving homebuyer education or counseling
1,384 1,919 1,920 1,250 1,920
Number of owner occupied home repair loans 41 37 35 35 35Number of homeownership units assisted by limited tax exemptions
137 107 105 105 105
Number of Units assisted by SDC waivers 143 104 100 100 100Number of households attending homebuyer fairs 810 964 964Number of elderly/disabled households receiving small scale home repairs
1,510 1,269 1,300 1,300 1,300

City of Portland, Oregon – FY 2013-14 Requested Budget 23
Portland Housing BureauCommunity Development Service Area
Performance Measures
Number of Clients Purchasing Homes
The downturn in the housing markets hasnegatively impacted potential clients' abilityto purchase homes. Additionally, PHB isgenerally shifting the way resources areused; the bureau is currently putting fundsinto more robust homebuyer counseling toensure that those buying homes are able tostay in their homes and therefore servingfewer clients.
Clie
nts
Percent of Exits from Shelter into Stable Housing
The percent of participants in the EndingHomelessness Initiative Shelter programsexiting into stable housing has remainedconsistent over the past two years while thenumber of people being served in shelter hasincreased. Pe
rcen
t
Households Receiving Placement Rent Assistance
PHB has been able to effectively use stimulusfunds through the Housing Authority ofPortland to increase the number ofhouseholds receiving rent assistance.
Hou
seho
lds

24 City of Portland, Oregon – FY 2013-14 Requested Budget
Portland Housing Bureau Summary of Bureau BudgetCommunity Development Service Area
Actual
FY 2010-11 Actual
FY 2011-12 Revised
FY 2012-13 Requested No DP
FY 2013-14 RequestedFY 2013-14
ResourcesExternal RevenuesCharges for Services 355,537 402,343 218,924 322,275 322,275Intergovernmental 61,114,560 52,804,085 79,278,963 48,909,440 47,659,935Bond & Note 4,704,000 2,046,000 10,474,298 6,000,000 6,000,000Miscellaneous 8,257,218 12,773,337 8,015,164 4,587,493 4,587,493
Total External Revenues 74,431,315 68,025,765 97,987,349 59,819,208 58,569,703Internal RevenuesGeneral Fund Discretionary 9,059,225 11,003,124 11,071,424 9,754,766 10,838,629Fund Transfers - Revenue 2,139,288 258,190 124,322 0 0Interagency Revenue 57,748 14,313 50,939 73,332 73,332
Total Internal Revenues 11,256,261 11,275,627 11,246,685 9,828,098 10,911,961Beginning Fund Balance 3,952,604 6,118,030 4,848,641 580,267 580,267
Total Resources $89,640,180 $85,419,422 $114,082,675 $70,227,573 $70,061,931
RequirementsBureau ExpendituresPersonnel Services 6,313,245 5,358,242 5,521,993 6,133,673 6,133,673External Materials and Services 70,883,701 70,189,171 102,883,737 58,858,883 58,814,770Internal Materials and Services 2,841,091 1,212,766 1,140,297 1,131,589 1,169,251Capital Outlay 0 0 11,600 0 0
Total Bureau Expenditures 80,038,037 76,760,179 109,557,627 66,124,145 66,117,694Fund ExpendituresDebt Service 1,339,825 1,398,282 1,292,086 1,291,293 1,291,293Contingency 0 0 2,272,631 1,724,654 1,565,463Fund Transfers - Expense 2,144,288 395,745 960,331 1,087,481 1,087,481
Total Fund Expenditures 3,484,113 1,794,027 4,525,048 4,103,428 3,944,237Ending Fund Balance 6,118,030 6,865,216 0 0 0
Total Requirements $89,640,180 $85,419,422 $114,082,675 $70,227,573 $70,061,931ProgramsAdministration & Support 6,560,700 6,389,550 7,875,779 5,997,444 6,035,106Housing Access & Stabilization 13,268,421 14,332,929 14,928,752 12,691,784 13,032,746Housing Production & Preservation 43,414,144 48,389,177 76,249,474 40,733,120 40,491,585Economic Opportunity 3,308,001 2,415,062 2,114,907 2,120,431 1,908,940Homeowner Access & Retention 13,486,771 5,233,461 8,388,715 4,581,366 4,649,317
Total Programs 80,038,037 $76,760,179 $109,557,627 $66,124,145 $66,117,694

City of Portland, Oregon – FY 2013-14 Requested Budget 25
FTE Summary Portland Housing BureauCommunity Development Service Area
Salary Range Revised
FY 2012-13 Requested No DP
FY 2013-14 RequestedFY 2013-14
Class Title Minimum Maximum No. Amount No. Amount No. Amount30000062 Accountant I 39,312 56,514 1.00 54,256 1.00 56,520 1.00 56,52030000064 Accountant III 56,597 71,178 1.00 65,392 1.00 69,792 1.00 69,79230000441 Business Operations Manager 75,109 100,048 1.00 85,248 1.00 90,816 1.00 90,81630000569 Financial Analyst, Principal 75,109 100,048 1.00 100,020 1.00 103,292 1.00 103,29230000568 Financial Analyst, Sr 63,378 84,635 1.00 80,640 1.00 83,632 1.00 83,63230001592 Housing Administrative Specialist, Sr 50,398 66,768 3.00 153,622 3.00 158,525 3.00 158,52530001591 Housing Business Systems Analyst, Asst 54,142 71,739 1.00 59,082 1.00 61,512 1.00 61,51230001361 Housing Construction Coordinator 56,846 75,338 2.00 150,672 2.00 150,672 2.00 150,67230001362 Housing Construction Coordinator, Sr 62,733 83,138 3.00 246,416 3.00 249,408 3.00 249,40830001363 Housing Development Finance Coordinator 65,998 87,422 2.00 174,840 2.00 174,840 2.00 174,84030000417 Housing Director 102,648 146,952 1.00 125,352 1.00 133,089 1.00 133,08930001260 Housing Director, Assistant 86,840 117,686 1.00 107,172 1.00 113,039 1.00 113,03930001587 Housing Financial Analyst 59,717 79,123 1.00 76,008 1.00 78,868 1.00 78,86830001588 Housing Financial Analyst, Assistant 54,142 71,739 1.00 71,736 1.00 71,736 1.00 71,73630001367 Housing Lead Grant Program Coordinator 62,733 83,138 1.00 76,728 1.00 78,300 1.00 78,30030001369 Housing Loan Compliance Analyst II 50,398 66,768 1.00 66,768 1.00 66,768 1.00 66,76830001364 Housing Loan Coordinator 54,142 71,739 1.00 54,144 1.00 56,364 1.00 56,36430001365 Housing Loan Coordinator, Sr 59,717 79,123 2.00 146,948 2.00 149,746 2.00 149,74630001596 Housing Management Assistant 54,142 71,739 1.00 57,329 1.00 59,685 1.00 59,68530001608 Housing Policy Manager 75,109 100,048 1.00 88,248 1.00 94,322 1.00 94,32230001595 Housing Program Coordinator 62,733 83,138 9.90 769,930 9.90 786,430 9.90 786,43030001593 Housing Program Specialist 56,846 75,338 4.00 267,570 4.00 270,150 4.00 270,15030001594 Housing Program Specialist, Assistant 54,142 71,739 4.00 258,709 4.00 262,842 4.00 262,84230000453 Management Analyst, Principal 75,109 100,048 1.00 94,992 1.00 100,854 1.00 100,85430000452 Management Analyst, Sr 63,378 84,635 1.00 84,876 1.00 87,432 1.00 87,43230000012 Office Support Specialist II 32,552 46,758 1.00 46,764 1.00 46,764 1.00 46,76430000464 Program Coordinator 60,341 80,475 2.00 155,688 2.00 163,589 2.00 163,58930000465 Program Manager 63,378 84,635 3.00 244,308 3.00 254,678 3.00 254,67830000466 Program Manager, Sr 75,109 100,048 1.00 87,660 1.00 90,300 1.00 90,30030000495 Public Information Officer 63,378 84,635 1.00 68,832 1.00 73,328 1.00 73,328
TOTAL FULL-TIME POSITIONS 54.90 4,119,950 54.90 4,237,293 54.90 4,237,293TOTAL PART-TIME POSITIONS 0.00 0 0.00 0 0.00 0TOTAL LIMITED TERM POSITIONS 0.00 0 0.00 0 0.00 0GRAND TOTAL 54.90 4,119,950 54.90 4,237,293 54.90 4,237,293


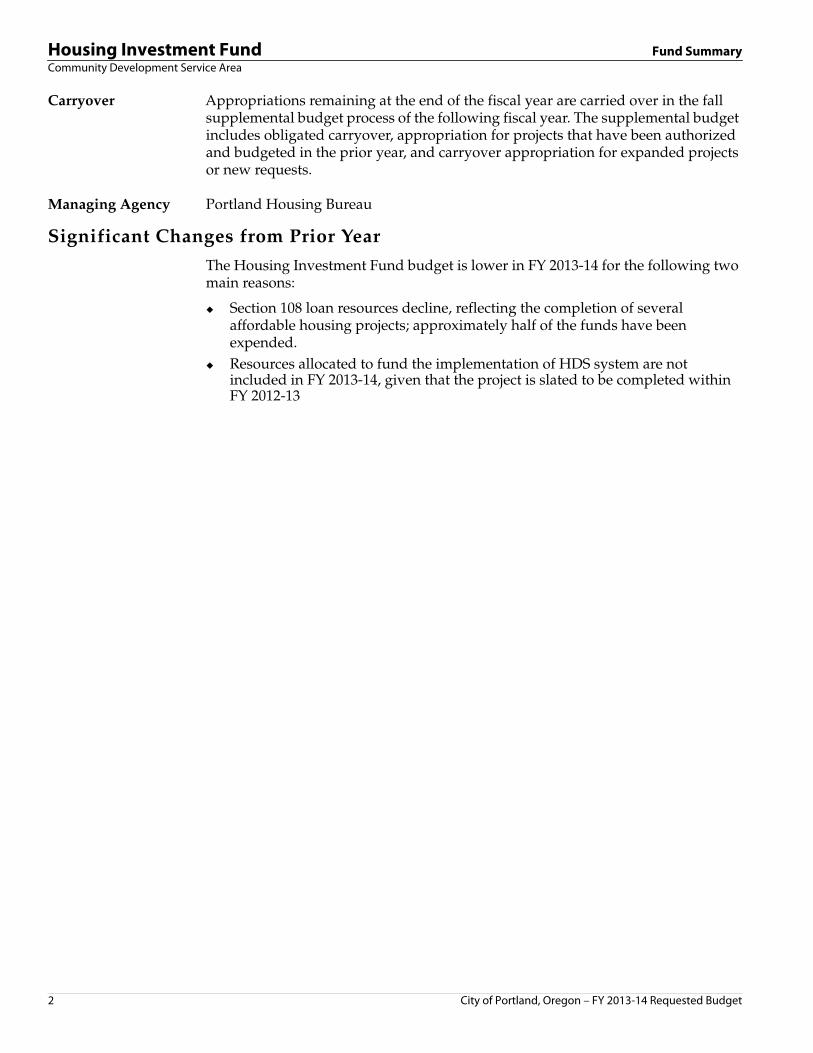
Fund Summary Housing Investment FundCommunity Development Service Area
Community Development Service Area Housing Investment Fund
Fund OverviewThe Housing Investment Fund (HIF) supports the City's housing initiatives, all ofwhich serve to develop or preserve affordable housing in Portland or help low- andmoderate-income individuals to access affordable housing. These programsinclude the Section 108 loan program, the Risk Mitigation Pool, fee-supportedactivities (e.g., administration of City limited tax abatements and systemdevelopment charge waivers) and other Portland Housing Bureau (PHB) programsand activities. The bureau processes HIF loan activity directly. This includesprocessing loan disbursements, recording loan receivables, and receipting programincome associated with loan repayments.
Loan Activity Effective with the July 1, 2010 transition of affordable housing operations from PDCto the City, PHB began processing loan activity directly. This includes processingloan disbursements, recording loan receivables, and receipting program incomeassociated with loan repayments.
Indirect Programs In addition to subfunds for the Homeless Management Information System matchand Risk Mitigation Pool, PHB also established sub-funds in the HIF to track thebureau's "indirect programs" as follows:
Limited tax abatement program fees System development charge program fees Mortgage Credit Certificate program
Actual
FY 2010-11 Actual
FY 2011-12 Revised
FY 2012-13
Requested No DP
FY 2013-14 RequestedFY 2013-14
ProposedFY 2013-14
ResourcesCharges for Services 323,718 383,746 218,924 322,275 322,275Intergovernmental 1,786,098 214,914 138,500 139,894 139,894Bond & Note 4,704,000 400,000 7,531,938 0 0Miscellaneous 1,497,216 1,947,509 789,000 608,600 608,600
Total External Revenues 8,311,032 2,946,169 8,678,362 1,070,769 1,070,769Fund Transfers - Revenue 0 3,855 0 0 0Interagency Revenue 46,248 0 0 0 0
Total Internal Revenues 46,248 3,855 0 0 0Beginning Fund Balance 3,088,123 2,932,326 750,821 580,267 580,267
Total Resources 11,445,403 5,882,350 9,429,183 1,651,036 1,651,036Requirements
Personnel Services 739,062 668,830 877,961 1,009,784 1,009,784External Materials and Services 5,621,744 1,605,728 8,048,521 299,495 299,495
Total Bureau Expenditures 6,360,806 2,274,558 8,926,482 1,309,279 1,309,279Debt Service 12,983 0 0 0 0Contingency 0 0 126,605 124,015 124,015Fund Transfers - Expense 2,139,288 322,001 376,096 217,742 217,742
Total Fund Expenditures 2,152,271 322,001 502,701 341,757 341,757Ending Fund Balance 2,932,326 3,285,791 0 0 0
Total Requirements 11,445,403 5,882,350 9,429,183 1,651,036 1,651,036
City of Portland, Oregon – FY 2013-14 Requested Budget 1
Housing Investment Fund Fund SummaryCommunity Development Service Area
Carryover Appropriations remaining at the end of the fiscal year are carried over in the fallsupplemental budget process of the following fiscal year. The supplemental budgetincludes obligated carryover, appropriation for projects that have been authorizedand budgeted in the prior year, and carryover appropriation for expanded projectsor new requests.
Managing Agency Portland Housing Bureau
Significant Changes from Prior Year
The Housing Investment Fund budget is lower in FY 2013-14 for the following twomain reasons:
Section 108 loan resources decline, reflecting the completion of severalaffordable housing projects; approximately half of the funds have beenexpended.
Resources allocated to fund the implementation of HDS system are notincluded in FY 2013-14, given that the project is slated to be completed withinFY 2012-13
2 City of Portland, Oregon – FY 2013-14 Requested Budget

Fund Summary Community Development Block Grant FundCommunity Development Service Area
Community Development Service Area Community Development Block Grant Fund
Fund Overview
Revenues The Community Development Block Grant (CDBG) Fund accounts for the City'sCDBG entitlement from the United States Department of Housing and UrbanDevelopment (HUD), loan repayments, lien payments, revenue generated fromCDBG-funded activities, carryover funds from prior years, private leveragedresources, and interest and repayments for float activities.
Structure This fund is an annual entitlement grant fund that is reimbursed by the federalgovernment for actual expenditures less any program income received. Becauserequests for reimbursement cannot exceed expenditures less program income, thefund will not have an ending balance. Effective with the affordable housingtransition from the Portland Development Commission (PDC) to the PortlandHousing Bureau (PHB), the bureau began processing CDBG loan activity directly.This includes processing loan disbursements, recording loan receivables, andreceipting loan repayment program income.
Carryover Entitlement appropriations remaining at the end of the fiscal year are carried overin the fall supplemental budget process of the following fiscal year. Thesupplemental budget includes obligated carryover, appropriation for projects thathave been authorized and budgeted in the prior year, and carryover appropriationfor expanded projects or new requests.
Managing Agency Portland Housing Bureau
Actual
FY 2010-11 Actual
FY 2011-12 Revised
FY 2012-13
Requested No DP
FY 2013-14 RequestedFY 2013-14
ProposedFY 2013-14
ResourcesCharges for Services 0 200 0 0 0Intergovernmental 12,654,774 5,733,959 15,803,383 11,460,682 10,690,504Bond & Note 0 1,400,000 0 6,000,000 6,000,000Miscellaneous 9,300 1,058,897 1,064,000 854,000 854,000
Total External Revenues 12,664,074 8,193,056 16,867,383 18,314,682 17,544,504Fund Transfers - Revenue 20,716 0 87,322 0 0
Total Internal Revenues 20,716 0 87,322 0 0Beginning Fund Balance 1,576,438 1,143,733 0 0 0
Total Resources 14,261,228 9,336,789 16,954,705 18,314,682 17,544,504Requirements
Personnel Services 2,069,619 1,481,959 1,606,224 1,194,904 1,194,904External Materials and Services 8,626,024 7,306,133 13,536,706 15,093,798 14,482,811Internal Materials and Services 1,870,304 95,959 30,000 30,000 30,000
Total Bureau Expenditures 12,565,947 8,884,051 15,172,930 16,318,702 15,707,715Debt Service 551,548 405,547 495,000 495,000 495,000Contingency 0 0 1,286,775 1,500,980 1,341,789
Total Fund Expenditures 551,548 405,547 1,781,775 1,995,980 1,836,789Ending Fund Balance 1,143,733 47,191 0 0 0
Total Requirements 14,261,228 9,336,789 16,954,705 18,314,682 17,544,504
City of Portland, Oregon – FY 2013-14 Requested Budget 1

Community Development Block Grant Fund Fund SummaryCommunity Development Service Area
Significant Changes from Prior Year
Federal Entitlements PHB has budgeted 10% less entitlement funding for the FY 2013-14 AdoptedBudget than in the FY 2012-13 Adopted, as a result of federal budget reductions.
2 City of Portland, Oregon – FY 2013-14 Requested Budget

Fund Summary HOME Grant FundCommunity Development Service Area
Community Development Service Area HOME Grant Fund
Fund Overview
The HOME program is a federal entitlement program of the United StatesDepartment of Housing and Urban Development. The purpose of the grant is toassist local governments with the development of affordable housing.
Portland HOMEConsortium
The Portland HOME Consortium consists of the City of Portland, the City ofGresham, and Multnomah County. Portland is the lead partner of the consortiumand is responsible for receiving and administering the HOME grant.
Structure The HOME Grant Fund is reimbursed by the federal government for actualexpenditures less program income. Since requests for reimbursement cannotexceed expenditures less program income, the fund will not have an endingbalance. The bureau processes HOME loan activity directly. This includesprocessing loan disbursements, recording loan receivables, and receipting programincome associated with loan repayments.
Carryover Entitlement appropriations remaining at the end of the fiscal year are carried overin the fall supplemental budget process of the following fiscal year. Thesupplemental budget includes obligated carryover, appropriation for projects thathave been authorized and budgeted in the prior year, and carryover appropriationfor expanded projects or new requests.
Managing Agency Portland Housing Bureau
Actual
FY 2010-11 Actual
FY 2011-12 Revised
FY 2012-13
Requested No DP
FY 2013-14 RequestedFY 2013-14
ProposedFY 2013-14
ResourcesCharges for Services 43 1,401 0 0 0Intergovernmental 6,016,099 2,432,762 7,958,356 5,179,469 4,887,430Bond & Note 0 246,000 0 0 0Miscellaneous 443 266,676 418,164 206,300 206,300
Total External Revenues 6,016,585 2,946,839 8,376,520 5,385,769 5,093,730Total Internal Revenues 0 0 0 0 0
Beginning Fund Balance 114,040 998,925 0 0 0Total Resources 6,130,625 3,945,764 8,376,520 5,385,769 5,093,730Requirements
Personnel Services 363,477 367,338 362,300 362,951 362,951External Materials and Services 4,768,223 3,578,135 7,801,886 5,011,647 4,719,608
Total Bureau Expenditures 5,131,700 3,945,473 8,164,186 5,374,598 5,082,559Contingency 0 0 212,334 11,171 11,171
Total Fund Expenditures 0 0 212,334 11,171 11,171Ending Fund Balance 998,925 291 0 0 0
Total Requirements 6,130,625 3,945,764 8,376,520 5,385,769 5,093,730
City of Portland, Oregon – FY 2013-14 Requested Budget 1

HOME Grant Fund Fund SummaryCommunity Development Service Area
Significant Changes from Prior Year
Entitlement The Portland Housing Bureau has budgeted 10% less in federal entitlementfunding for the FY 2013-14 Adopted Budget than it did in the FY 2012-13 Adopted.This is due to the federal government passing a budget that significantly cutsdomestic discretionary spending.
2 City of Portland, Oregon – FY 2013-14 Requested Budget

Fund Summary Tax Increment Financing Reimbursement FundCommunity Development Service Area
Community Development Service Area Tax Increment Financing Reimbursement Fund
Fund Overview
The Tax Increment Financing (TIF) Reimbursement Fund accounts for thereimbursement of housing-related costs that are funded from tax incrementproceeds in the various Portland Development Commission (PDC) urban renewalareas. Eligible costs will be incurred by the Portland Housing Bureau (PHB) foreach individual urban renewal area, and then reimbursed by PDC. The bureauprocesses loan activity directly. This includes processing loan disbursements,recording loan receivables, and receipting program income associated with loanrepayments. TIF affordable housing program income is netted from TIFreimbursements from PDC.
Carryover Appropriations remaining at the end of the fiscal year are carried over in the fallsupplemental budget process of the following fiscal year. The supplemental budgetincludes obligated carryover, appropriation for projects that have been authorizedand budgeted in the prior year, and carryover appropriation for expanded projectsor new requests.
Managing Agency Portland Housing Bureau
Actual
FY 2010-11 Actual
FY 2011-12 Revised
FY 2012-13
Requested No DP
FY 2013-14 RequestedFY 2013-14
ProposedFY 2013-14
ResourcesCharges for Services 31,776 15,623 0 0 0Intergovernmental 30,406,693 40,117,097 46,697,494 27,596,979 27,596,979Bond & Note 0 0 2,942,360 0 0Miscellaneous 6,739,089 9,174,758 5,744,000 2,909,800 2,909,800
Total External Revenues 37,177,558 49,307,478 55,383,854 30,506,779 30,506,779Fund Transfers - Revenue 2,118,572 0 0 0 0
Total Internal Revenues 2,118,572 0 0 0 0Beginning Fund Balance 347,833 2,290,667 3,629,820 0 0
Total Resources 39,643,963 51,598,145 59,013,674 30,506,779 30,506,779Requirements
Personnel Services 2,097,702 1,822,427 1,698,501 2,382,762 2,382,762External Materials and Services 33,805,471 43,251,449 55,381,787 26,268,143 26,268,143Internal Materials and Services 1,450,123 1,034,895 702,234 903,062 903,062
Total Bureau Expenditures 37,353,296 46,108,771 57,782,522 29,553,967 29,553,967Debt Service 0 15,000 0 0 0Contingency 0 0 646,917 83,073 83,073Fund Transfers - Expense 0 73,744 584,235 869,739 869,739
Total Fund Expenditures 0 88,744 1,231,152 952,812 952,812Ending Fund Balance 2,290,667 5,400,630 0 0 0
Total Requirements 39,643,963 51,598,145 59,013,674 30,506,779 30,506,779
City of Portland, Oregon – FY 2013-14 Requested Budget 1

Tax Increment Financing Reimbursement Fund Fund SummaryCommunity Development Service Area
Significant Changes from Prior Year
Education URA During FY 2012-13, PHB established a sub-fund in to track affordable housingresources and activities associated with the newly-established Education URA inSouthwest Portland.
30% Set Aside PolicyRenewal
In October 2011, Council passed the renewal of the 30% TIF set-aside policy, theCity policy that dedicates a portion of TIF resources to affordable housinginvestment. Updates were made to the calculation of the set-aside funds fromexpenditure based to revenue based using a blended methodology that includesactual expenditures from 2006-2012 and forecasted bond revenue from 2012 - 2015.Program income now remains with the agency where it was generated and staffingand overhead costs are included within set-aside calculations.
Decline in TIFResources
Due to the combined impact of expiring urban renewal districts and growth inproperty values that is weaker than previously forecasted, PHB is projecting adecline in available TIF resources for affordable housing over the next three to fiveyears.
2 City of Portland, Oregon – FY 2013-14 Requested Budget

City of Portland, Oregon – FY 2013-14 Requested Budget 1
Fund Summary Headwaters Apartment Complex FundCommunity Development Service Area
Community Development Service Area Headwaters Apartment Complex Fund
Fund Overview
This fund reflects expenses and revenues for the City-owned HeadwatersApartment complex. The property is managed by the Portland DevelopmentCommission (PDC) through a property management firm. Tenant revenue iscollected by PDC (per bond covenants) and the net income after propertymanagement and insurance costs is sent to the Portland Housing Bureau (PHB)monthly. PHB is responsible for making the semi-annual debt service payments onthe bonds sold for the construction of the property with this revenue.
Managing Agency Portland Housing Bureau
Actual
FY 2010-11 Actual
FY 2011-12 Revised
FY 2012-13
Requested No DP
FY 2013-14 RequestedFY 2013-14
ProposedFY 2013-14
ResourcesIntergovernmental 1,060,568 1,015,468 860,000 860,000 860,000Miscellaneous 0 1,938 0 1,293 1,293
Total External Revenues 1,060,568 1,017,406 860,000 861,293 861,293Fund Transfers - Revenue 0 254,335 0 0 0
Total Internal Revenues 0 254,335 0 0 0Beginning Fund Balance 0 284,260 0 0 0
Total Resources 1,060,568 1,556,001 860,000 861,293 861,293Requirements
External Materials and Services 1,014 176 62,914 65,000 65,000Total Bureau Expenditures 1,014 176 62,914 65,000 65,000
Debt Service 775,294 977,735 797,086 796,293 796,293Total Fund Expenditures 775,294 977,735 797,086 796,293 796,293
Ending Fund Balance 284,260 578,090 0 0 0Total Requirements 1,060,568 1,556,001 860,000 861,293 861,293


FY 2013-14 FY 2013-14 FY 2013-14 FY 2014-15Requested Requested Requested Estimated
FY 2015-16 FY 2016-17 FY 2017-18Estimated Estimated Estimated
1 Time DP Ongoing DP Total DP Budget Budget Budget Budget
Bureau:
Decision Package Summary
Priority: 06 Type: Reductions
Program:Decision Package: SeveralHC_01 - Federal Entitlement Grant Sequestration
Portland Housing Bureau
EXPENDITURESExternal Materials and Services (1,090,314) (1,090,314) 0 0 0 0 00
Contingency (159,191) (159,191) 0 0 0 0 00
TOTAL EXPENDITURES (1,249,505) (1,249,505) 0 0 0 0 00
REVENUESIntergovernmental Revenues (1,249,505) (1,249,505) 0 0 0 0 00
TOTAL REVENUES (1,249,505) (1,249,505) 0 0 0 0 00
Description:PHB projects that our allocation of federal funds from HUD will be reduced up to 10% due to “sequestration”. The proposed budget includes projected cuts to CDBG by $770,210 andHOME by $292,039. We also projected a $78,216 reduction to the Emergency Solutions Grant and $109,072 reduction to Housing Opportunities for People with HIV/AIDS (HOPWA).PHB’s Requested Budget reflects cuts in each of these funds achieved through programmatic reductions based on PHB Strategic Plan priorities. More than 30% of the PHB budget is madeup of federal funding. Because of federal funding rules, only a small percentage of our funds can be used for public services. The 10% cut in these funds not only indicates a permanentfunding loss, but it also constricts the proportional amount of the flexible amount of federal funding that can be used for core services essential to the housing stability of the people we serve.This year, we project that of the $770,210 cut to CDBG, $450,000 will have to be cut from programs providing services, and our other sources of funding cannot be used to backfill thesebecause they are more prescriptive and can only be used for “bricks and sticks”.
Expected Results:Below is a sample of the impacts that result because of the projected federal cuts:
• 1 fewer multi-family property stabilized through rehabilitation • 65 households will not receive short term rent assistance • 4 individuals will not receive housing and outpatient mental health services • 14 households with HIV/AIDS will not receive rent assistance and supportive services • 130 households from communities of color will not receive homeownership education and counseling
2/4/13 14:44sap_b_dp_summary
Page 1 of 7

FY 2013-14 FY 2013-14 FY 2013-14 FY 2014-15Requested Requested Requested Estimated
FY 2015-16 FY 2016-17 FY 2017-18Estimated Estimated Estimated
1 Time DP Ongoing DP Total DP Budget Budget Budget Budget
Bureau:
Decision Package Summary
Priority: 05 Type: Unfunded Ongoing
Program:Decision Package: SeveralHC_02 - Budget Note Clarification
Portland Housing Bureau
EXPENDITURESExternal Materials and Services 0 0 327,635 172,467 178,504 184,751 00
TOTAL EXPENDITURES 0 0 327,635 172,467 178,504 184,751 00
REVENUESGeneral Fund Discretionary 0 0 327,635 172,467 178,504 184,751 00
TOTAL REVENUES 0 0 327,635 172,467 178,504 184,751 00
Description:The FY 2012-13 Adopted budget includes the following Budget Note. "Council directs the Office of Management and Finance to add sustainable funding for the Safety Net to the FY 2013-145-year forecast. The Office of Management and Finance should increase the Portland Housing Bureau’s current appropriation level target by $4,600,000, which will replace the bureau’shistoric reliance on one-time funds." The City Budget Office made a literal interpretation of the Budget Note, and does not intend to add a COLA to this amount as it does with the rest ofPHBs ongoing General Fund discretionary funding. While a literal translation, this decision does not appear to meet the spirit of the Budget Note, that of adding "sustainable funding for theSafety net". PHB uses General Fund discretionary funds primarily for Safety Net services, and not adding an annual COLA (as is done with virtually all ongoing General Fund discretionary)reduces resources available to these programs due to inflation. This package seeks to clarify the Budget Note by requesting the COLA on the $4.6 million ongoing funding be added to theforecast beginning in FY 2014-15, in an amount retroactive to FY 2013-14.
Expected Results:
2/4/13 14:44sap_b_dp_summary
Page 2 of 7

FY 2013-14 FY 2013-14 FY 2013-14 FY 2014-15Requested Requested Requested Estimated
FY 2015-16 FY 2016-17 FY 2017-18Estimated Estimated Estimated
1 Time DP Ongoing DP Total DP Budget Budget Budget Budget
Bureau:
Decision Package Summary
Priority: 07 Type: Bureau Adds
Program:Decision Package: Business OperationsHC_03 - I/A Providers Add-Back Package
Portland Housing Bureau
EXPENDITURESInternal Materials and Services 37,662 37,662 0 0 0 0 00
TOTAL EXPENDITURES 37,662 37,662 0 0 0 0 00
REVENUESGeneral Fund Discretionary 37,662 37,662 0 0 0 0 00
TOTAL REVENUES 37,662 37,662 0 0 0 0 00
Description:Most OMF interagency providers have prepared add back packages to restore funding up to 100% CSL. These add back packages are to restore services that were either cut to get to 90%CSL, or to add back different packages as realignments. PHB is matching these add back packages with their own single decision package per OMF request and CBO direction.
Expected Results:OMF will provide expected results in their packages O
2/4/13 14:44sap_b_dp_summary
Page 3 of 7

FY 2013-14 FY 2013-14 FY 2013-14 FY 2014-15Requested Requested Requested Estimated
FY 2015-16 FY 2016-17 FY 2017-18Estimated Estimated Estimated
1 Time DP Ongoing DP Total DP Budget Budget Budget Budget
Bureau:
Decision Package Summary
Priority: 01 Type: Realignments
Program:Decision Package: Shelter & Emergency ServicesHC_04 - Keep the Clark Center Open
Portland Housing Bureau
EXPENDITURESExternal Materials and Services 424,650 424,650 0 0 0 0 00
TOTAL EXPENDITURES 424,650 424,650 0 0 0 0 00
REVENUESGeneral Fund Discretionary 424,650 424,650 0 0 0 0 00
TOTAL REVENUES 424,650 424,650 0 0 0 0 00
Description:The Clark Center is a 90-bed shelter for single homeless men. The program, operated by Transition Projects, provides shelter to 688 homeless men annually, assisting them in findingpermanent housing and stability. Men primarily access the Clark Center through the Bud Clark Commons Day Center. A waiting list is maintained that averages more than 250 names.
The program offers the following services: • Emergency shelter for up to four months, including meals • Initial assessments and referrals to supportive services • Housing placement services with an emphasis on rapid placement into housing • Financial assistance for application fees, move-in costs and obtaining identification • Case management • Ongoing housing retention support.
PHB funds approximately 72% of the Clark Center budget with a mix of General Fund and federal sources.This decision package aligns with Portland Plan Action #81, which includes continuing implementation of effective, long-term solutions and integration of housing programs with otheressential support services, and working with Multnomah County to maintain a safety net for emergency housing needs.
Expected Results:Failure to fund this decision package will result in service cuts that will eliminate or reduce the following annual outcomes: • 90-bed, facility-based shelter capacity • 688 homeless men served, of which 43% will move to stable housing
2/4/13 14:44sap_b_dp_summary
Page 4 of 7

FY 2013-14 FY 2013-14 FY 2013-14 FY 2014-15Requested Requested Requested Estimated
FY 2015-16 FY 2016-17 FY 2017-18Estimated Estimated Estimated
1 Time DP Ongoing DP Total DP Budget Budget Budget Budget
Bureau:
Decision Package Summary
Priority: 02 Type: Bureau Adds
Program:Decision Package: Shelter & Emergency ServicesHC_05 - Preserve the Safety Net
Portland Housing Bureau
EXPENDITURESExternal Materials and Services 331,050 331,050 0 0 0 0 00
TOTAL EXPENDITURES 331,050 331,050 0 0 0 0 00
REVENUESGeneral Fund Discretionary 331,050 331,050 0 0 0 0 00
TOTAL REVENUES 331,050 331,050 0 0 0 0 00
Description:Provide funding for critical emergency services to vulnerable homeless populations. Youth Shelter will provide 30 beds of year-round shelter for youth. Winter Recuperation Care and WinterShelter provide a safe, warm place to sleep and shelter from severe, life-threatening weather conditions from November through April—the coldest months of the year—to women andmedically vulnerable individuals.
Winter Recuperative Care provides funding to serve 10 medically fragile homeless adults in a recuperative facility where they are connected with a medical provider and housing. Eachwinter, the City provides funding to a non-profit partner to operate a winter shelter for vulnerable homeless women during the winter. Funding also supports additional winter shelter capacityto SAFES women’s shelter. The Youth Shelter serves 229 homeless youth each year.
This decision package aligns with Portland Plan Action #81, which includes continuing implementation of effective, long-term solutions and integration of housing programs with otheressential support services, and working with Multnomah County to maintain a safety net for emergency housing needs.
Expected Results:Failure to fund this decision package will result in service cuts that will eliminate or reduce the following annual outcomes: • 85 beds for highly vulnerable homeless women experiencing mental illness, fleeing from domestic violence and the elderly available during the coldest months from November throughApril • 530 homeless women served • 10 beds of recuperative housing for medically vulnerable homeless transitioning out of the hospital o 75% of which move into stable housing o 100% secure a permanent medical provider • 30 beds serving homeless youth o 25 homeless youth served o 5 youth placed into stable housing o 40% youth are from communities of color
2/4/13 14:44sap_b_dp_summary
Page 5 of 7

FY 2013-14 FY 2013-14 FY 2013-14 FY 2014-15Requested Requested Requested Estimated
FY 2015-16 FY 2016-17 FY 2017-18Estimated Estimated Estimated
1 Time DP Ongoing DP Total DP Budget Budget Budget Budget
Bureau:
Decision Package Summary
Priority: 03 Type: Bureau Adds
Program:Decision Package: Supportive Housing, Access & Stabilization, Shelter HC_06 - Perm Housing & Access for Vulnerable Populations
Portland Housing Bureau
EXPENDITURESExternal Materials and Services 216,300 216,300 0 0 0 0 00
TOTAL EXPENDITURES 216,300 216,300 0 0 0 0 00
REVENUESGeneral Fund Discretionary 216,300 216,300 0 0 0 0 00
TOTAL REVENUES 216,300 216,300 0 0 0 0 00
Description:Provide funding for programs that support permanent housing outreach, placement, services and stabilization for vulnerable people. These programs employ our communities’ most effectivestrategies to end homelessness and stabilize people with significant barriers in housing. They support the Strategic Plan by employing best practices known to transition vulnerable peoplefrom the streets and into stable homes.
Programs include mental health homeless outreach and housing placement, homeless street outreach, housing placement and retention, alcohol and drug free communities, Key Not a Cardrent assistance and housing placement for chronically homeless families, Rose City Resource Guide, Rent Well, Youth Transitional Housing and Community Engagement Program.
This decision package aligns with Portland Plan Action #81, which includes continuing implementation of effective, long-term solutions and integration of housing programs with otheressential support services, and working with Multnomah County to maintain a safety net for emergency housing needs.
Expected Results:Failure to fund this decision package will result in service cuts that will eliminate or reduce the following annual outcomes: • 1 mental health street outreach worker will be funded, resulting in 140 street outreach contacts to unsheltered mentally ill individuals and 15 people not placed into permanent housing andretention support. • 12 homeless individuals in recovery from addictions will receive transition housing and support. • 5 chronically homeless individuals with multiple disabilities will secure permanent housing and support. • 9 chronically homeless families, the majority of whom are from communities of color, will secure permanent housing and support. • 6,000 resource guides will be available annually to homeless and low-income people • 15 civic and community agencies will have access to the resource guide • 300 graduates from Rent Well will have landlord guarantees • 8 youth will receive transitional housing and support, 5 of which will be placed into permanent housing
2/4/13 14:44sap_b_dp_summary
Page 6 of 7

FY 2013-14 FY 2013-14 FY 2013-14 FY 2014-15Requested Requested Requested Estimated
FY 2015-16 FY 2016-17 FY 2017-18Estimated Estimated Estimated
1 Time DP Ongoing DP Total DP Budget Budget Budget Budget
Bureau:
Decision Package Summary
Priority: 04 Type: Bureau Adds
Program:Decision Package: Homebuyer Education and CounselingHC_07 - Stabilize Families and Prevent foreclosure
Portland Housing Bureau
EXPENDITURESExternal Materials and Services 74,201 74,201 0 0 0 0 00
TOTAL EXPENDITURES 74,201 74,201 0 0 0 0 00
REVENUESGeneral Fund Discretionary 74,201 74,201 0 0 0 0 00
TOTAL REVENUES 74,201 74,201 0 0 0 0 00
Description:Provide funding for programs that build the pipeline of potential homebuyers from communities of color and help homeowners retain their home. The Portland housing market had adisproportionate impact on low-income households that has resulted in displacement, gentrification and clusters of people of color living in neighborhoods with less opportunity. Theseprograms support our Equity Agenda, which implements our commitment to equity in opportunity into our Strategic Plan. The North and Northeast Homeowner Retention program providescase management, foreclosure prevention counseling, and information and referrals to assist senior (55 years old or more) homeowners in North and Northeast Portland to retain theirhomes or transition to other affordable housing. It also provides case management to low-income households facing the possibility of losing their homes. Services include identification ofbarriers to maintaining their homes, information and referral, and applying for federal disability and medical subsidies, temporary loan modification, and applying for permanent loanmodification or refinancing.
This decision package aligns with Portland Plan Action #80, which is to support programs that move people of color into homeownership and develop clear strategies and targets; and utilizeand strengthen the existing capacity of nonprofit partners to provide effective home ownership assistance to households of color.
Expected Results:Failure to fund this decision package will result in service cuts that will eliminate or reduce the following annual outcomes: • 671 households from communities of color will receive homeownership counseling and education, 20% who become homeowners • 45 households outside of North and Northeast Portland will be served by the homeownership retention program, 87 will remain in their homes, and the rest will be helped to transition intoalternate affordable housing
2/4/13 14:44sap_b_dp_summary
Page 7 of 7

Page 1
Portland Housing Bureau
FY 2013‐2018 Five‐Year Financial Forecast
Overview
The Portland Housing Bureau (PHB) has a variety of funding sources for the provision of affordable housing in the City of
Portland and throughout the region. In general, the challenge for PHB over the five‐year forecast period is maintaining
affordable housing delivery levels in the face of diminishing resources.
Tax increment financing (TIF) availability drops from a bubble of spending from 2009 through 2014 at level of $40‐54
million to a new normal in the $17‐23 million range. This reflects a slight increase in available TIF funding over the
forecast period due to a more positive revenue outlook in some urban renewal areas (URA). As noted in previous
forecasts, the TIF spending bubble tends to stretch out due to project timing. Loan income for both the HIF and the
major entitlement grant funds continues to decline over the period as well due loans paying off or restructures.
U.S. Department of Housing and Urban Development (HUD) entitlement grant amounts reflect an assumed 10%
reduction in available funds for FY 2013‐14. These grants are projected at these new lower levels, and flat over the
forecast due to the increased scrutiny of federal budget deficits.
The forecast accounts for the conversion of bureau serial one‐time funding ($4.6 million) to ongoing funding starting in
FY 2013‐14, which gives the bureau an ongoing General Fund discretionary allocation of approximately $11 million.
However the $4.6 million does not receive an annual COLA due an interpretation of the CBO.
The reductions in TIF and federal funds have driven the right‐sizing of both the delivery and administrative structure of
the bureau; 8 positions eliminated in FY 2010‐11, 10 in FY 2011‐12, two in FY 2012‐13, and while none in FY 2013‐14 up
to 4‐8 more over the remaining four years of the forecast depending on competitive grant funding.
FY 2011‐12 FY 2012‐13 FY 2013‐14 FY 2014‐15 FY 2015‐16 FY 2016‐17 FY 2017‐18
Resources Actual Revised Forecast Forecast Forecast Forecast Forecast
General Fund 11,661,692 11,757,365 11,325,384 11,591,940 11,910,838 12,103,565 12,297,150
Housing Investment Fund 4,317,099 3,226,673 2,728,070 2,352,806 2,248,301 2,229,741 2,215,963
CDBG 10,146,459 16,801,705 11,544,504 9,076,715 8,579,945 7,988,181 7,822,486
HOME 3,695,049 8,748,820 5,093,730 3,326,301 2,942,683 2,832,173 2,889,143
Federal Grants 3,804,261 7,242,648 3,868,152 3,307,649 3,198,648 2,198,649 2,198,649
Section 108 1,050,048 1,556,494 6,000,000 ‐ ‐ ‐ ‐
Tax Increment Financing 51,771,666 41,193,570 34,201,436 19,851,098 23,232,057 17,406,990 21,515,205
Headwaters 1,301,333 1,253,871 1,350,371 1,452,664 1,554,889 1,654,405 1,754,566
Total 87,747,606$ 91,781,146$ 76,111,647$ 50,959,172$ 53,667,363$ 46,413,704$ 50,693,163$
Requirements
General Fund 11,661,692 11,757,365 11,325,384 11,591,939 11,910,839 12,103,565 12,297,150
Housing Investment Fund 4,317,099 3,226,673 2,728,070 2,352,806 2,248,301 2,229,741 2,215,963
CDBG 10,146,459 16,801,705 11,544,504 9,076,715 8,579,945 7,988,181 7,822,486
HOME 3,695,049 8,748,820 5,093,730 3,326,301 2,942,683 2,832,173 2,889,143
Federal Grants 3,804,261 7,242,648 3,868,152 3,307,650 3,198,649 2,198,649 2,198,650
Section 108 1,050,048 1,556,494 6,000,000 ‐ ‐ ‐ ‐
Tax Increment Financing 51,771,665 41,193,569 34,201,436 19,851,098 23,232,059 17,406,990 21,515,205
Headwaters 1,301,333 1,253,871 1,350,371 1,452,664 1,554,889 1,654,405 1,754,566
Total 87,747,606$ 91,781,146$ 76,111,647$ 50,959,173$ 53,667,364$ 46,413,704$ 50,693,163$

Page 2
The following is a brief discussion of the outlook for these and other funding sources. It contains forward‐looking
statements that are subject to change by future policy direction of the City Council and/or bureau management. Below
is a table that shows the major funding resources and requirements for PHB. The forecast shows bureau funding
stabilizing at approximately $50 million starting in FY 2014‐15; in FY 2013‐14 if prior year carry forward funds are not
counted. Details by funding source follow, as does the bureaus cost of service study.
Note that some fund summaries reflect unbudgeted working capital in order to show the movement of unused funds
from one fiscal year to the next where it may be utilized.
General Fund
Historical Look
PHB has been identified as a General Fund bureau for a number of years, despite the majority of its’ funding coming
from entitlement grants. This funding mix began to change in FY 2006‐07 when over $6 million in one‐time General
Fund discretionary resources were allocated to the bureau in the fall supplemental budget adjustment (BuMP).
General Fund Discretionary
Most of these one‐time resources were targeted to ongoing core program commitments (primarily in the area of
Homeless Services). Funding ongoing needs with one‐time funds created a structural imbalance, or gap, in the bureau’s
General Fund budget. Many of these services are funded with other sources, but PHB is leveraging these sources to the
maximum, as there are grant restrictions on these types of services. For example, Community Development Block Grant
(CDBG) and HOME grant funds may be used for rent assistance and shelter, but only within specified limits – both of
these entitlements grants are more of a “bricks and sticks” resource.
As a result of the structural imbalance created in FY 2006‐07, each subsequent annual budget submission included a
substantial request for General Fund discretionary resources (sometimes ongoing, sometimes one‐time) to fill the gap.
Unfortunately, the gap has been filled primarily with additional one‐time funds. In FY 2012‐13, the City Council directed
that $4.6 million of this serial one‐time funding be converted to ongoing for the future.
FY 2011‐12 FY 2012‐13 FY 2013‐14 FY 2013‐14 FY 2013‐14 FY 2014‐15 FY 2015‐16 FY 2016‐17 FY 2017‐18
Resources Actual Revised Base 90 % Base Request Forecast Forecast Forecast Forecast
Intergovernmental 75,000 75,000
Grant Indirect Charges 577,454 479,536 405,923 405,923 405,923 395,779 409,552 361,385 376,201
General Fund Discretionary
One‐Time 4,332,310 4,909,753
Ongoing 6,078,601 5,861,971 10,838,629 9,754,766 10,838,629 11,113,129 11,415,989 11,654,549 11,830,912
Encunbrance c/o 578,027 343,166
Space Rental/Services 14,313 50,939 73,332 73,332 73,332 75,532 77,798 80,132 82,536
Miscellaneous 5,987 37,000 7,500 7,500 7,500 7,500 7,500 7,500 7,500
Total 11,661,692 11,757,365 11,325,384 10,241,521 11,325,384 11,591,940 11,910,839 12,103,565 12,297,150
Requirements (50,000)
Personnel Services 429,517 294,863 548,314 548,314 548,314 582,067 553,882 576,591 600,231
External/Internal M&S 913,247 1,199,750 964,451 964,451 1,002,113 1,058,595 1,146,602 1,247,975 1,319,979
Contracts
Planning, Policy & Communications 40,700 40,700 40,700 41,412 42,448 42,488 43,000
One‐Time 10,643 139,400
Housing Access & Stabilization 5,388,182 4,899,538 9,256,919 8,295,656 9,267,656 9,435,099 9,681,272 9,735,876 9,818,940
One‐Time 4,684,784 4,723,814
Housing Access & Retention 515,000 392,400 466,601 474,767 486,636 500,636 515,000
One‐Time 235,319 500,000
Total $11,661,692 $11,757,365 $11,325,384 $10,241,521 $11,325,384 $11,591,939 $11,910,839 $12,103,565 $12,297,150

Page 3
In terms of the bureau’s original FY 2013‐14 ongoing General Fund discretionary allocation of $10.8 million,
approximately $9.5 million is targeted to program delivery (again primarily Homeless Services) in the form of pass‐
through contracts with sub‐recipient agencies. The remaining funds cover Homeless Services program delivery staff, and
indirect staffing and costs. Indirect staffing include portions of those positions in the Director’s Office and Policy and
Planning involved with homeless policy setting and planning, as well as Business Operations where the processing of the
sub‐recipient contracts occurs. Indirect costs include building rent, Office of Management and Finance (OMF)
interagencies, and other miscellaneous costs.
Internal Resources
Bureau internal resources consist primarily of indirect cost recovery charges to the CDBG, Lead, and TIF Reimbursement
Funds. The bureau levies an 81.75% indirect charge (as outlined in the City’s A‐87 cost allocation plan, approved by HUD)
against the program staff costs in each of these funds. This rate may change during the budget process when OMF
completes its review of bureau indirect rates. These charges offset the indirect costs (not staffing costs, which are
charged directly) not attributable to the General Fund, while keeping those costs in one accounting area for ease of
tracking and administration. An additional resource is revenue from the Office of Equity for subletting space and some
administrative services on PHBs floor in the Commonwealth Building. Future Look
For FY 2013‐14, PHB still faces gaps in General Fund discretionary resources. These gaps could include:
1. The bureau made a number of shifts in staff funding due to both the conversion of formerly one‐time General
Fund to ongoing, and the need to free up CDBG Admin and Planning cap resources for sub‐recipients
administration costs and an increased focus on asset management. The shift of staffing costs to the General
Fund was accomplished without impacting programs due to increases in indirect cost recovery resources and
reductions in net operating costs.
2. In order to meet budget direction to submit a ninety percent General Fund base budget, PHB made reductions
totally $1,083,863. While add backs in this amount have been requested, it is not certain how much if any may
be restored to the bureau budget
In addition to these gaps, the bureau funds a number of homeownership and rental access and stabilization programs
with tax increment financing resources. While an excellent tool within urban renewal areas, limiting these programs to
those areas does not match with the bureaus’ equity agenda. Outside of urban renewal areas, General Fund dollars are
a potential tool to provide these non‐“bricks and sticks” services Citywide. But the larger issue is that resources are
declining, and the City needs to consider the development of other affordable housing resources.
It should be noted that PHB expects to significantly improve alignment with Multnomah County and Home Forward over
the next few years in the area of homeless services as part of the 10 Year Reset. These three jurisdictions invest
considerable local, state and federal resources in programs designed to end people’s homelessness. With ongoing
collaboration and shared analysis, PHB and its partner jurisdictions hope to both improve outcomes for people and
ensure the best possible use of public funds.

Page 4
Housing Investment Fund
Historical Look
The HIF was formally created in 1995 as a means to achieve the City's housing goals as established in Metro 2040 plan
and provide gap financing for housing projects that fulfilled the goals of the Livable City Housing Initiatives and the
strategies developed by the Livable City Housing Council. The City Council allocated totaled $34.6 million over the five
year period. The funds were almost exclusively transferred to PDC for housing development and retention programs.
These funds were tracked in a PDC Housing Investment Fund that is now merged with the City HIF. A significant portion
of the funds were packaged into loans.
Loan Portfolio
The portfolio of loans in the HIF is currently valued at approximately $20 million. The discounted value is estimated to
be about $6 million. The following discussion gives insight not only into the HIF loan portfolio, but also the bureaus
entire portfolio in general. The CDBG, HOME, and URA funds contain the other portions of the bureau loan portfolio.
The HIF portfolio is made up of several different types of loans: cash flow loans, equity gap loans, amortized loans, and
deferred payment loans. Cash flow loans make up almost $11 million of the book value of the portfolio. Equity gap
loans make up about $5 million of the portfolio. An Equity gap loan is a "last resort" financing product, used only when
other financing has been maximized and the housing project does not generate sufficient cash flow (after operating
expenses and required senior debt service) to allow loan payments back to PHB.
Equity gap loans differ from grants in that grants cannot be used in projects that also use tax credits. Cash flow loans,
like equity gap loans, make payments to PHB only when there are net revenues after paying all expenses and other debt
service. These types of loans contribute to the highly discounted value of the portfolio. They also limit the program
income that accrues back to PHB.
As the bureau looks to more aggressively restructure loans to ensure the long term viability of the City’s affordable
housing infrastructure, there is additional downward pressure on loan income.
FY 2011‐12 FY 2012‐13 FY 2013‐14 FY 2014‐15 FY 2015‐16 FY 2016‐17 FY 2017‐18
Resources Actual Revised Request Forecast Forecast Forecast Forecast
Fund Balance ‐ 954,090 566,921 270,042 200,000 200,000 200,000
Charges for Services 377,552 555,674 322,275 328,720 345,326 352,233 359,277
Intergovernmental Revenues 199,915 138,500 139,894 144,319 148,921 150,092 151,286
Loan Payoffs/Property Sales 650,237 ‐ ‐ ‐ ‐ ‐ ‐
Interest 21,868 6,100 6,292 6,000 6,000 6,000 5,900
Working Capital 2,232,568 872,309 1,086,688 998,725 943,054 916,417 913,500
Program Income 834,959 700,000 606,000 605,000 605,000 605,000 586,000
Total 4,317,099 3,226,673 2,728,070 2,352,806 2,248,301 2,229,741 2,215,963
Requirements
Personnel Services 668,829 896,135 1,044,561 931,251 917,383 897,741 931,425
External M&S 695,220 488,142 297,000 237,500 243,500 244,500 245,500
Transfers 322,001 288,774 217,742 141,000 71,000 74,000 77,000
Working Capital 2,631,049 1,453,622 1,068,767 943,055 916,418 913,500 862,037
Contingency ‐ 100,000 100,000 100,000 100,000 100,000 100,000
Total 4,317,099 3,226,673 2,728,070 2,352,806 2,248,301 2,229,741 2,215,962

Page 5
Indirect Programs
The City Council further directed that a Development Fee (SDC) Waiver program for affordable housing be implemented
within the resources of the HIF, a program now administered by PHB. The program is intended to assist developers by
reducing their costs when building affordable housing, exempting them from paying SDCs levied by the City when they
build residential housing units meeting program requirements. PHB also manages the Limited Tax Exemption Program
for single (HOLTE) and multi‐family properties (MULTE), taking the duties over from PDC and the Bureau of Planning and
Sustainability in FY 2010‐11. The LTE programs offer eligible homebuyers who purchase newly constructed homes in
certain parts of Portland a ten‐year limited property tax exemption. In addition similar exemptions are offered on multi‐
family properties, both for‐profit and not‐for‐profit.
A third program that is managed by bureau staff and that also indirectly makes housing more affordable is the Mortgage
Credit Certificate Program (MCC). MCC is an IRS‐approved tax credit, which reduces homeowners’ federal income taxes
as long as they keep the loan and continuously occupy the home as their principal residence. The maximum amount of
the MCC tax credit equals 20 percent of the annual mortgage interest paid on the homebuyer's first mortgage loan. In
calendar year 2012 the bureau processed 68 certificates valued at approximately $1.8 million over the life of the loans.
Fees are paid by applicants for the LTE, SDC, and MCC programs to cover some of the cost of administration. Sub‐funds
within the HIF track the income that pays County recording fees and staffing costs for programs. Adjustments to SDC
fees were made July 1, 2010, and PHB will be looking at changes to those fees as well as those for the LTE programs in
the near future. Fee structures are discussed in the Cost of Service section later in this document.
Limited Tax Exemption Administration – Single Family
Limited Tax Exemption Administration – Multi‐Family
FY 2011‐12 FY 2012‐13 FY 2013‐14 FY 2014‐15 FY 2015‐16 FY 2016‐17 FY 2017‐18
Resources Actual Revised Request Forecast Forecast Forecast Forecast
Charges for Services 144,331 64,500 109,925 112,124 114,366 116,653 118,986
Interest 100
Working Capital 43,740 76,576 18,708 18,708 18,126 16,933 20,303
Total 188,071 141,176 128,633 130,832 132,492 133,586 139,289
Requirements (5,000)
Personnel Services 43,403 56,968 43,425 45,205 47,059 43,783 45,578
External M&S
Housing Access & Retention 68,092 65,500 66,500 67,500 68,500 69,500 70,500
Working Capital 76,576 18,708 18,708 18,126 16,933 20,303 23,211
Total 188,071 141,176 128,633 130,831 132,492 133,586 139,289
FY 2011‐12 FY 2012‐13 FY 2013‐14 FY 2014‐15 FY 2015‐16 FY 2016‐17 FY 2017‐18
Resources Actual Revised Request Forecast Forecast Forecast Forecast
Beginning Balance 6,100 7,961
Charges for Services 32,232 47,380 58,250 59,415 70,635 72,048 73,489
Interest 82
Working Capital 3,356 35,670 46,709 43,048 30,956 23,382 15,450
Total 35,670 89,150 112,920 102,463 101,591 95,430 88,939
Requirements (3,000)
Personnel Services 9,480 39,872 41,507 43,209 44,980 43,701
External M&S
Housing Access & Retention 25,000 30,000 30,000 35,000 35,000 35,000
Working Capital 35,670 54,670 43,048 30,956 23,382 15,450 10,237
Total 35,670 89,150 112,920 102,463 101,591 95,430 88,938

Page 6
System Development Charge Administration
Mortgage Credit Certificate Program Administration
Primary HIF
In FY 2000‐01, the City Council made the last major decision involving HIF funding by including $500,000 in ongoing and
$3.85 million in one‐time General Fund discretionary resources. These resources were not transferred to PDC and
eventually went to fund ongoing core programming in the bureau (BHCD at the time), in the areas of Homeless Services
and Housing Access and Stabilization Services. The ongoing General Fund discretionary funding was eventually
increased to $958,000 in FY 2007‐08 and moved out of the HIF to be part of the BHCD allocation.
While the initial HIF funding was from General Fund resources, over the years new funding sources (primarily debt
based) and new programs have been added to the HIF. Some have come and gone (Smart Growth, Preservation Line of
Credit, Housing Opportunity Bonds, City Lights, Housing Revolving Loan – all PDC managed), but one project born of
these programs remains – Headwaters, which has been moved to its own fund and is discussed later.
FY 2011‐12 FY 2012‐13 FY 2013‐14 FY 2014‐15 FY 2015‐16 FY 2016‐17 FY 2017‐18
Resources Actual Revised Request Forecast Forecast Forecast Forecast
Charges for Services 112,939 89,028 90,800 92,616 94,468 96,357 98,284
Working Capital 10,776 26,716 26,716 29,611 31,402 31,485 29,752
Interest 68 500 500 500 500 500
Total 123,783 115,744 118,016 122,727 126,370 128,342 128,536
Requirements
Personnel Services 90,937 84,028 83,405 86,825 90,384 94,090 97,948
External M&S
Housing Access & Retention 6,130 5,000 5,000 4,500 4,500 4,500 4,500
Working Capital 26,716 26,716 29,611 31,402 31,485 29,752 26,088
Total 123,783 115,744 118,016 122,727 126,369 128,342 128,536
FY 2011‐12 FY 2012‐13 FY 2013‐14 FY 2014‐15 FY 2015‐16 FY 2016‐17 FY 2017‐18
Resources Actual Revised Request Forecast Forecast Forecast Forecast
Charges for Services 88,050 62,016 63,300 64,566 65,857 67,174 68,518
Local Shared Revenue
Working Capital 72,781 127,862 127,862 111,290 92,914 72,634 50,344
Interest 642 500 500 500 500 500 400
Total 161,473 190,378 191,662 176,356 159,271 140,308 119,262
Requirements
Personnel Services 27,374 62,046 74,872 77,942 81,137 84,464 87,927
External M&S
Housing Access & Retention 6,237 470 5,500 5,500 5,500 5,500 5,500
Working Capital 127,862 127,862 111,290 92,914 72,634 50,344 25,835
Total 161,473 190,378 191,662 176,356 159,271 140,308 119,262

Page 7
Primary HIF
Internal Resources
Internal resources in the HIF consist of a couple of reserves which are earmarked for a specific purpose.
Of the designated reserves, the largest is for the Risk Mitigation Pool. Currently standing at approximately $700,000,
these funds are used to pay damage claims by subscribed landlords for excess wear and tear on housing units used for
supportive housing. A risk factor for this pool is that it is over subscribed. The bureau has worked with OMF Risk
Management to mitigate potential issues, but annual claims will need to be monitored closely for any trends that would
indicate higher usage than the pool can withstand.
Risk Mitigation Pool
FY 2011‐12 FY 2012‐13 FY 2013‐14 FY 2014‐15 FY 2015‐16 FY 2016‐17 FY 2017‐18
Resources Actual Revised Request Forecast Forecast Forecast Forecast
Beginning Balance ‐ 747,990 358,960 70,042 ‐ ‐ ‐
Interest 9,189 5,000 1,000 1,000 1,000 1,000 1,000
Other 6,650
Loan Payoffs/Property Sales 650,237
Program Income 834,959 700,000 606,000 605,000 605,000 605,000 586,000
Working Capital 1,255,032 673,241 123,699 53,657 28,401 32,180 63,229
Total 2,756,067 2,126,231 1,089,659 729,699 634,401 638,180 650,229
Requirements (150,000) (50,000) (50,000)
Personnel Services 462,555 576,546 688,218 560,298 531,221 500,951 521,490
External M&S 2,205 48,000
Next Generation Loan Serv. & Asset Mgt. Sys 368,113 199,139
Equity, Policy, & Communications ‐ 60,000
Housing Production & Preservation 13,100
Projects
PCRI 443,000
Jubilee 75,000
Homeowner Access & Retention 179,962
General Fund Overhead 67,666 288,774 217,742 141,000 71,000 74,000 77,000
Transfer to Headwaters 254,335
Working Capital 1,421,231 482,672 123,699 28,401 32,180 63,229 51,739
Contingency
Total 2,756,067 2,126,231 1,089,659 729,699 634,401 638,180 650,229
FY 2011‐12 FY 2012‐13 FY 2013‐14 FY 2014‐15 FY 2015‐16 FY 2016‐17 FY 2017‐18
Resources Actual Revised Request Forecast Forecast Forecast Forecast
Beginning Balance 200,000 200,000 200,000 200,000 200,000 200,000
Interest 4,709 3,292 4,000 4,000 4,000 4,000
Working Capital 835,669 636,318 636,318 639,610 643,610 647,610 651,610
Total 840,378 836,318 839,610 843,610 847,610 851,610 855,610
Requirements
External M&S
Housing Development Finance 4,060 100,000 100,000 100,000 100,000 100,000 100,000
Working Capital 836,318 636,318 639,610 643,610 647,610 651,610 655,610
Contingency 100,000 100,000 100,000 100,000 100,000 100,000
Total 840,378 836,318 839,610 843,610 847,610 851,610 855,610

Page 8
Another reserve is the Fresh Start Guarantee, which is used in conjunction with a state grant to provide landlord
education. This pool of funds started at $150,000 a few years ago, but has only been expended from recently. It is
anticipated that funds will continue to be drawn down until fully expended.
PHB combined and no longer fully appropriates these two reserves. The cash is tracked separately in a sub fund. As both
are a risk mitigation pool, and have the same original funding source, there is not a need to track in separate funds. In
addition, past usage has shown that a $100,000 appropriation and a $100,000 contingency should be sufficient annually.
The remaining $638,000 reserve can remain in fund balance.
PHB has developed a growing local match for the McKinney HMIS grant, which is providing additional resources for the
staffing of the program. The program provides homeless data collection services statewide, the bureau collects user
fees from participating jurisdictions. The fee structure is discussed in the Cost of Service section later in this document.
HMIS Local Match
Program Income
Beginning in FY 2009‐10, PHB began collecting all program income that is not grant‐related in the HIF. In FY 2010‐11,
additional income streams came into the fund from the PDC HIF. These included loan fees, abatement fees, and loan
income from the original HIF loans discussed earlier. HIF program income is used primarily to cover staff costs and
special projects. The largest source of income, from the original HIF loans, is used as a source for general staff costs that
are difficult to attribute to other funding sources.
The major issue with loan income is that it is forecast to decline over time, due to restructures and loan payoffs. To that
end, the bureau is planning to be more conservative in how much ongoing staff cost to plan against this income stream
and the forecast reflects declining Personal Services usage of HIF resources after FY 2013‐14. This downward trend is
tempered somewhat by the potential of original HIF loans being paid off, and the City being repaid a portion of principle.
This is an unpredictable occurrence, more prevalent recently with the sale of properties due to attractive interest rates.
The forecast does not rely on any such payoffs.
Future Look
A number of future trends for portions of the HIF have been noted in previous sections. However, the bureau is
experiencing a significant cost increase via General Fund overhead charges. This increase is driven by a change in
overhead metrics from one based upon use of services to one based primarily on budget size and secondarily on
staffing. This change was made to fit the Council‐approved City financial policy that overhead charges be “predictable
and equitable”. Because of pass‐though payments related to a PDC first‐mortgage program (that has since been
cancelled) and Section 108 disbursements recently, the HIF saw a 426% increase General Fund overhead charges for FY
FY 2011‐12 FY 2012‐13 FY 2013‐14 FY 2014‐15 FY 2015‐16 FY 2016‐17 FY 2017‐18
Resources Actual Revised Request Forecast Forecast Forecast Forecast
Intergovernmental Revenues 199,915 138,500 139,894 144,319 148,921 150,092 151,286
Working Capital 11,214 106,676 106,676 102,801 97,645 92,193 82,812
Interest 528 500 1,000
Total 211,657 245,676 247,570 247,120 246,566 242,285 234,098
Requirements
Personnel Services 44,560 107,067 114,769 119,475 124,373 129,472 134,781
External M&S 60,421 31,933 30,000 30,000 30,000 30,000 30,000
Working Capital 106,676 106,676 102,801 97,645 92,193 82,812 69,317
Total 211,657 245,676 247,570 247,120 246,566 242,284 234,098

Page 9
2012‐13. As the spike in HIF expenditures passes further into history, the forecast assumes a moderation in these
charges.
Headwaters
One City Lights project, the Headwaters – a multi‐income property, was completed. The project was executed by PDC.
Rental income is collected by a property management firm, income net of property management costs is collected by
PDC and transferred to PHB and held in reserve. This reserve covers the annual debt repayment, interest on the
deferred developer fee, the debt service reserve, and the excess revenue reserve.
At this date it is unclear whether City Lights will generate significant excess revenue from the Headwaters project. The
bureau is conservatively estimating positive excess revenue generation at this point in the forecast. This scenario also
assumes the calling of Series B bonds and the payoff of the deferred developer fee at some point in the future (outside
of the forecast period) as sufficient reserves are available. Staff continues to analyze options.
FY 2011‐12 FY 2012‐13 FY 2013‐14 FY 2014‐15 FY 2015‐16 FY 2016‐17 FY 2017‐18
Resources Actual Revised Request Forecast Forecast Forecast Forecast
Working Capital 284,327 296,371 393,871 491,164 589,889 689,405 789,566
Net Operating Income ‐ PDC 1,015,068 957,000 956,000 961,000 964,000 964,000 964,000
Interest 1,938 500 500 500 1,000 1,000 1,000
Total 1,301,333 1,253,871 1,350,371 1,452,664 1,554,889 1,654,405 1,754,566
Requirements
External M&S 175
Debt Service 786,748 797,086 796,293 799,861 802,570 801,925 795,530
Deferred Developer's Fee 190,987 34,699 34,699 34,699 34,699 34,699 34,699
Insurance 28,215 28,215 28,215 28,215 28,215 28,215
Working Capital 323,423 393,871 491,164 589,889 689,405 789,566 896,122
Total 1,301,333 1,253,871 1,350,371 1,452,664 1,554,889 1,654,405 1,754,566

Page 10
Community Development Block Grant Fund
This fund is used to hold and account for the City’s CDBG entitlement from HUD, as well as program income generated
from the entitlement.
Annual Entitlement
HUD uses a formula to determine each grantee’s share of the CDBG funding pool. That pool for a particular year is
contingent upon the federal budget process. Many times, the HUD budget is the result of a continuing resolution passed
after the start of the federal fiscal year (October 1). Once the total CDBG amount is determined, HUD develops the
FY 2011‐12 FY 2012‐13 FY 2013‐14 FY 2014‐15 FY 2015‐16 FY 2016‐17 FY 2017‐18
Resources Actual Revised Request Forecast Forecast Forecast Forecast
Carryover 8,101,606 3,758,905 1,302,616 862,346 348,082 197,887
Grants 8,098,204 $7,701,777 6,931,599 6,931,599 6,931,599 6,931,599 6,931,599
ARRA 395,148
Program Income 1,653,107 911,000 854,000 842,500 786,000 708,500 693,000
Encumbrance c/o
Miscellaneous 87,322
Total 10,146,459 16,801,705 11,544,504 9,076,715 8,579,945 7,988,181 7,822,486
Requirements (50,000)
Personnel Services 1,481,960 1,606,224 1,234,077 1,284,674 1,285,296 1,337,993 1,392,851
Indirect 421,875 479,536 320,345 333,479 347,152 361,385 376,201
External/Internal M&S 112,591 30,000 30,000 30,000 35,000 35,000 35,000
Contracts
Housing Access & Stabilization 1,219,790 1,108,700 664,950 876,700 875,700 869,700 861,700
Planning, Policy & Communications 82,749 247,400 182,700 157,100 157,100 156,600 155,900
Housing Production & Preservation 30,000 150,281 130,000 130,000 130,000 130,000 130,000
Project & CHDO Support 149,137 ‐ ‐ ‐ ‐ ‐ ‐
Section 108 Repayment 405,546 495,000 495,000 495,000 495,000 495,000 495,000
Homeowner Access & Retention 1,398,534 1,384,361 1,198,750 1,004,000 1,003,200 1,001,200 998,200
BDS Inspections ‐ ‐ ‐ ‐ ‐ ‐ ‐
Economic Opportunity 2,411,939 2,114,907 1,903,416 1,903,416 1,903,416 1,903,416 1,903,416
Projects
Affordable Rental Housing 507,650 2,000,000 2,000,000 1,500,000 1,300,000
Butte 190,706
Sawash/Tisitlal 33,671
Kehillah 275,000
Hatfield 840,865 5,862
Otesha 307,090 1,078,642
Park/Lexington 2,626,181
Bronough 1,500,000
PCRI Restructure 1,525,000
Stephens Creek 1,250,000 550,000
ARRA
Otesha 82,314
Taggart 235,352
PCRI‐4Properties 76,187
Working Capital 856,859 3,758,905 1,302,616 862,346 348,082 197,887 174,218
Total 10,146,459 16,801,705 11,544,504 9,076,715 8,579,945 7,988,181 7,822,486

Page 11
allocations. This can take a minimum of 6‐8 weeks, often after the City deadline for the PHB request budget. This lead
the bureau in the past to budget the prior year entitlement allocation.
In FY 2009‐10, the City received an additional $2.7 million in CDBG funds under the American Re‐Investment and
Recovery Act (CDBG‐ARRA). This was a one‐time allocation of funds, and these funds were expended by fall 2012
deadline.
Currently, HUD is operating under a continuing resolution until March, at which time department funds will be
sequestered unless Congress takes further action on the federal 2012‐13 budget. PHB has assumed a 10% reduction in
federal entitlement grants funds for the FY 2013‐14 (when the HUD 2012‐13 funds will be available to grantees).
Caps
Among the limits on CDBG funding are caps on the use of funds for administration and planning and public service. The
cap percentage for administration and planning is 20% of the entitlement and program income; the percentage for
public service is 15% of the entitlement and program income.
PHB puts a mix of administrative staff and indirect costs under the administration and planning cap in addition to some
service contracts and consulting services. Also found under the administration and planning cap are administrative
activities under contract with area service delivery agencies. Under the public service cap, several eligible homeless
services activities and homebuyer assistance are funded.
Program Income
CDBG program income has been in decline from highs of approximately $2‐5 million in the past 15 years. Loan income is
currently approximately $900,000, boosted by income from four Section 108 loans. PHB and HUD use program income
figures from the HUD tracking system for the purposes of cap calculations.
This resource is also forecast to go down over time due to restructures and loan payoffs, which impacts staffing and
program delivery spending.
Program Delivery
PHB funds program delivery staff under CDBG. Most services are delivered via third party contract (the same is true with
almost all of the bureau’s funding), though in the case of housing development projects, the exact nature and amount of
the funding is not known very far into the future. The bureau will focus on setting aside CDBG to use in years where TIF
resources are scarce; however there will be less future flexibility in using CDBG funds for other programs while
maximizing resources for affordable housing development projects.
Carryover
The CDBG fund has a long history of carryover due to the ebb and flow of housing project schedules. The bureau has
tightened both budgeting and schedule estimates, as well as being more diligent about whether all prior year
entitlement funds have been accessed. Carryover of appropriations will still need to occur, but the bureau will use the
BuMP, Request, and Approved budget processes to be more transparent about those changes.
Future Look
On the one hand, the current federal administration is more amenable to spending funds on affordable housing. On the
other hand, they are facing substantial budget deficits. The bureau has seen reductions in CDBG entitlement funding

Page 12
each of the last three federal fiscal years, including the 10% cut assumed in PHBs FY 2013‐14 budget. The forecast
assumes no growth in the entitlement from that point through the rest of the forecast. In addition, Loan income is
forecast to continue to decline.
Section 108
In the spring of 2009, the Council approved $15 million of borrowing from HUD under the Section 108 program. The
focus of the funding is the preservation of existing affordable housing. This line of credit is backed by the City’s CDBG
entitlement (and secondarily by the City General Fund). Current policy is for no more than 25% of the bureau’s 2008‐09
CDBG commitment (equaling approximately $500,000) to affordable rental housing be used as a principle and interest
repayment source. The CDBG forecast reflects that figure. This assumes that remaining loans made from Section 108
proceeds are hard debt, which would throw off loan income that could be used in lieu of CDBG for repayment to HUD. If
not, further CDBG (up to another $500,000) would be committed long term to debt repayment. Approximately $7.2
million in projects have been completed. Remaining funds may be offered through a NOFA in the future.
FY 2011‐12 FY 2012‐13 FY 2013‐14 FY 2014‐15 FY 2015‐16 FY 2016‐17 FY 2017‐18
Resources Actual Revised Request Forecast Forecast Forecast Forecast
Working Capital 564,226 292,750
Loan Proceeds 400,000 1,263,744 6,000,000
Program Income 85,822
Total 1,050,048 1,556,494 6,000,000 ‐ ‐ ‐ ‐
Requirements
External M&S
Housing Production & Preservation
Projects
Villa De Suenos 86,976
Upshur ‐ 41,500
Briarwood 257,930 65,453
Los Jardines 375,459 24,541
Walnut Park 36,933
Working Capital 292,750
Affordable Rental Housing 1,425,000 6,000,000
Total 1,050,048 1,556,494 6,000,000 ‐ ‐ ‐ ‐

Page 13
HOME
This fund is used to hold and account for the City’s HOME entitlement from HUD, as well as program income generated
from the entitlement.
Entitlement
Much like CDBG, HOME is a formula‐based entitlement grant. It is subject to the same timeline as the CDBG
entitlement, and thus the bureau has tended to budget the prior year entitlement allocation at the start of the City
budget cycle.
Currently, HUD is operating under a continuing resolution until March, at which time department funds will be
sequestered unless Congress takes further action on the federal 2012‐13 budget. PHB has assumed a 10% reduction in
federal entitlement grants funds for the FY 2013‐14 (when the HUD 2012‐13 funds will be available to grantees).
FY 2011‐12 FY 2012‐13 FY 2013‐14 FY 2014‐15 FY 2015‐16 FY 2016‐17 FY 2017‐18
Resources Actual Revised Request Forecast Forecast Forecast Forecast
Carryover 294,696 5,036,967 2,259,080 494,951 126,333 20,823 91,793
Grants 2,988,619 2,920,389 2,628,350 2,628,350 2,628,350 2,628,350 2,628,350
Pre Dev Loan 92,664
Service Charges & Fees 1,401 1,500
Program Income 410,333 697,300 206,300 203,000 188,000 183,000 169,000
Encumbrance c/o
Total $3,695,049 $8,748,820 $5,093,730 $3,326,301 $2,942,683 $2,832,173 $2,889,143
Requirements (50,000) (100,000)
Personnel Services 367,388 362,300 374,122 337,411 351,245 261,546 272,269
External/Internal M&S
Contracts
Housing Access & Stabilization 365,997 436,080 395,000 402,900 410,958 419,177 427,561
Housing Production & Preservation 104,212
CHDO Support 255,264 125,000 131,400 131,400 131,400 131,400 131,400
Projects
Loan Servicing/Asset Mgmt System 206,983 228,846
PCRI ‐ Scattered Big10 26,246 359,424
Providence House 375,000
Elliot/Cook Phase I ‐ 975,000
Firland 1,000,000
Rockwood 111,134
Hawthorne East 1,500,000
Ainsworth Court 1,257,825 142,175
Greenview 2,815,034
Glisan Commons 880,000
Affordable Rental Housing 2,000,000 400,000 1,500,000 1,400,000 1,500,000
Gresham Funds 997,324 389,000 389,000 389,000 389,000 389,000
Multnomah County Funds 143,557 139,257 139,257 139,257 139,257 139,257
Working Capital 2,164,080 409,951 26,333 20,823 91,793 29,656
Total $3,695,049 $8,748,820 $5,093,730 $3,326,301 $2,942,683 $2,832,173 $2,889,143

Page 14
Caps
As with CDBG, HOME has a cap on the use of funds for administration. The HOME cap percentage for administration is
only 10% of the entitlement and program income – there is not a public service cap. PHB puts a mix of administrative
staff and indirect costs under the administration cap. PHB budgets right up to the cap.
Program Income
HOME program income has been in decline from highs of approximately $2 million in the past decade. Program income
is currently approximately $206,000, down from about $500,000 in FY 2007‐08. PHB and HUD use program income
figures from the HUD tracking system for the purposes of cap calculations.
The bureau currently budgets HOME program income less conservatively as the administration cap usage have been
traditionally been low under HOME. This resource is also forecast to go down moderately over time, which impacts staff
and program delivery spending.
Program Delivery
PHB funds program delivery staff working on HOME funded projects from CDBG funds per HUD recommendation. The
bulk of HOME funds are used for affordable housing development. The availability for this use is critical as HOME is one
of the few resources available to PHB outside of URAs.
Carryover
The HOME fund also has a long history of carryover due to the ebb and flow of housing project schedules. The bureau
has tightened both budgeting and schedule estimates, as well as being more diligent about whether all prior year
entitlement funds have been accessed. Carryover of appropriations will still need to occur, but the bureau will use the
BuMP, Request, and Approved budget processes to be more transparent about those changes.
Future Look
HOME is subject to the same uncertainty at the federal level as CDBG. The bureau has seen reductions in HOME
entitlement funding each of the last three federal fiscal years, including the 10% cut assumed in PHBs FY 2013‐14
budget. The forecast assumes no growth in the entitlement from that point through the rest of the forecast. In addition,
Loan income is forecast to continue to decline.

Page 15
Federal Grants
Entitlements
PHB receives two other, smaller entitlement grants – the Emergency Solutions grant (ESG) and Housing for People With
AIDS (HOPWA). They are formula based and subject to a similar allocation timeline process as HOME and CDBG. The
bureau has received a second phase allocations for HOPWA, and these additional funds are reflected in the forecast for
HOPWA.
In FY 2009‐10, the City received an additional $4.2 million in ESG formula funds under ARRA with the Housing Placement
and Rapid Re‐housing Program (HPRRP). This was a one‐time allocation of funds, and funds were expended by fall 2012
deadline.
HOPWA
ESG
HPPRP‐ARRA
FY 2011‐12 FY 2012‐13 FY 2013‐14 FY 2014‐15 FY 2015‐16 FY 2016‐17 FY 2017‐18
Resources Actual Revised Request Forecast Forecast Forecast Forecast
Grants 1,321,867 1,557,845 1,448,773 1,090,649 981,649 981,649 981,649
Encumbrance c/o 140,893 374,483
Total 1,462,760 1,932,328 1,448,773 1,090,649 981,649 981,649 981,649
Requirements
Personnel Services 46,453 74,766 75,051 59,528 33,969 35,361 35,881
External M&S
Housing Access & Stabilization 1,416,307 1,857,562 1,373,722 1,031,121 947,680 946,288 945,768
Total 1,462,760 1,932,328 1,448,773 1,090,649 981,649 981,649 981,649
FY 2011‐12 FY 2012‐13 FY 2013‐14 FY 2014‐15 FY 2015‐16 FY 2016‐17 FY 2017‐18
Resources Actual Revised Request Forecast Forecast Forecast Forecast
Grants 449,036 1,277,205 703,940 703,940 703,940 703,940 703,940
Total 449,036 1,277,205 703,940 703,940 703,940 703,940 703,940
Requirements (5,000)
Personnel Services 30,785 88,742 57,762 60,130 62,596 59,957 62,415
External M&S
Housing Access & Stabilization 418,251 1,188,463 646,178 643,810 641,344 643,983 641,525
Total 449,036 1,277,205 703,940 703,940 703,940 703,940 703,940
FY 2011‐12 FY 2012‐13 FY 2013‐14 FY 2014‐15 FY 2015‐16 FY 2016‐17 FY 2017‐18
Resources Actual Revised Request Forecast Forecast Forecast Forecast
Grants 82,148 85,836
Total 82,148 85,836 ‐ ‐ ‐ ‐ ‐
Requirements
External M&S
Housing Access & Stabilization 82,148 85,836
Total 82,148 85,836 ‐ ‐ ‐ ‐ ‐

Page 16
Categorical Grants
The bureau also receives a number of competitive or categorical grants. The oldest of these is the Lead Grant, the most
recent version of which was awarded in the fall of 2009 and extends into FY 2012‐13. The bureau has re‐applied for lead
funds in the fall 2012 federal funding process, and anticipates up to $3 million over three years if approved. The forecast
assumes grant approval; budget adjustments will need to be made if the bureau does not receive the grant.
The Healthy Homes Grant will end in the spring of 2014. The Neighborhood Stabilization Program (NSP), a
homeownership assistance grant, is in its second phase. The program does throw off income from property sales that
helps extend its work. On the smaller side of categorical grants, Homeless Management Information Systems (HMIS)
funds the Service Point system used by agencies and providers to track a wide range of social services data. As noted in
the HIF section, the bureau receives income for servicing the system from partner agencies as a match in addition to the
grant funds. McKinney/OTIS is another grant that focuses on homeless services. These grants have remained stable
over time, and are forecast to remain so.
Lead
Healthy Homes
FY 2011‐12 FY 2012‐13 FY 2013‐14 FY 2014‐15 FY 2015‐16 FY 2016‐17 FY 2017‐18
Resources Actual Revised Request Forecast Forecast Forecast Forecast
09 Grant 1,020,317 1,495,024
12 Grant 1,000,000 1,000,000 1,000,000
Total 1,020,317 1,495,024 1,000,000 1,000,000 1,000,000 ‐ ‐
Requirements (200,000)
Personnel Services 205,263 209,561 231,390 240,646 250,271
External M&S
Housing Access & Retention 815,054 1,285,463 706,310 697,054 687,329
Indirect 62,300 62,300 62,400
Total 1,020,317 1,495,024 1,000,000 1,000,000 1,000,000 ‐ ‐
FY 2011‐12 FY 2012‐13 FY 2013‐14 FY 2014‐15 FY 2015‐16 FY 2016‐17 FY 2017‐18
Resources Actual Revised Request Forecast Forecast Forecast Forecast
Resources
Grants 146,343 642,619 202,379
Requirements (85,000)
Personnel Services 61,798 104,473 82,272 ‐ ‐ ‐
Indirect 23,278
External M&S 84,545 538,146 96,829
Housing Access & Retention
Total 146,343 642,619 202,379 ‐ ‐ ‐ ‐

Page 17
NSP
McKinney – OTIS
McKinney ‐ HMIS
FY 2011‐12 FY 2012‐13 FY 2013‐14 FY 2014‐15 FY 2015‐16 FY 2016‐17 FY 2017‐18
Resources Actual Revised Request Forecast Forecast Forecast Forecast
Grants (39,661) 807,330
Program Income 172,210 468,000
Total 132,549 1,275,330 ‐ ‐ ‐ ‐ ‐
Requirements
Personnel Services 1,651 49,188
External M&S
Housing Access & Retention 130,898 1,226,142
Total 132,549 1,275,330 ‐ ‐ ‐ ‐ ‐
FY 2011‐12 FY 2012‐13 FY 2013‐14 FY 2014‐15 FY 2015‐16 FY 2016‐17 FY 2017‐18
Resources Actual Revised Request Forecast Forecast Forecast Forecast
Grants 262,828 271,986 271,986 271,986 271,986 271,986 271,986
Total 262,828 271,986 271,986 271,986 271,986 271,986 271,986
Requirements (1,000)
Personnel Services 4,849 6,150 6,914 7,197 6,452 6,716 6,991
External M&S
Housing Access & Stabilization 257,979 265,836 265,072 264,789 265,534 265,270 264,995
Total 262,828 271,986 271,986 271,986 271,986 271,986 271,986
FY 2011‐12 FY 2012‐13 FY 2013‐14 FY 2014‐15 FY 2015‐16 FY 2016‐17 FY 2017‐18
Resources Actual Revised Request Forecast Forecast Forecast Forecast
Grants 248,280 241,074 241,074 241,074 241,074 241,074 241,074
Total 248,280 241,074 241,074 241,074 241,074 241,074 241,074
Requirements (15,000) (15,000)
Personnel Services 174,019 166,026 172,792 179,876 171,636 178,674 170,384
External M&S 74,261 75,048 68,282 61,198 69,438 62,400 70,690
Total 248,280 241,074 241,074 241,074 241,074 241,074 241,074

Page 18
Tax Increment Financing
Tax Increment Financing (TIF) is not new to either the City or to housing development. TIF funds for housing will be
expended by PHB, which will then be reimbursed by PDC, net of program income received by the bureau. PHB receives
the program income directly, because the City now holds all of the affordable housing loans. Affordable housing funding
in urban renewal areas (URAs) is driven by the 30% Housing set‐aside passed by the City Council in 2006.
Structure
PHB has set up a series of funds to be able to track direct costs by URA. Indirect costs are collected in the fund summary
below, and will be allocated based upon the direct expenses. The General Fund section discussed how indirect costs are
allocated. TIF is not very different from many of PHBs’ grant sources in that it has restrictions on use in terms of type of
expense. In addition there are restrictions in terms of location. The location restrictions also put pressure on the
bureaus’ less restrictive funding sources when opportunities arise that cannot be fully addressed with TIF.
The bureau continues to experience a significant cost increase via General Fund overhead charges applied to the TIF
fund. This increase is driven by a change in overhead metrics from one based upon use of services to one based
primarily on budget size and secondarily on staffing. This change was made to fit the Council‐approved City financial
policy that overhead charges be “predictable and equitable”. The bubble of housing development spending in the TIF
fund is caused a 791% in General Fund overhead charges in FY 2012‐13, and another 49% increase in FY 2013‐14. While
these charges will moderate as TIF spending reverts to a new normal, it will be a cost of doing business for the bureau.
Staffing charged to the various TIF funds is increasing as a reflection of several projects anticipated as a result of the
2012 NOFA, and proportionally fewer federally funded projects.
TIF Reimbursement Fund
Tax Revenue Forecast – Future Look
After PDC and OMF took a hard look at tax revenue forecasts in 2011, resources for most URAs had been reset
downward. The reason for the reset was a decline in property values where the real market value of more properties is
coming within 70% of assessed value. In addition, OMF changed to a 200% coverage ratio on future long‐term debt
issuances in response to the financial markets. For FY 2013‐14 and beyond, this reset is holding, and in fact in some
URAs (primarily River District, Interstate, and Gateway) the resource outlook has improved slightly. In addition,
increment is beginning to collect in the new Education URA. The TIF portion of the PHB budget for FY 2013‐14 is
approximately $34 million. This is the end a bubble of funding that stabilizes over the life of the five year life of the
forecast to $19‐23 million, which will challenge the bureau in maintaining the supply of affordable housing delivery
products. The next TIF funding challenge will come beyond the range of this forecast as many URAs lose their ability to
Resources
Tax Increment 2,039,465 2,175,528 3,095,153 3,303,487 3,242,723 3,122,863 3,060,166
Other
Float
Total 2,039,465 2,175,528 3,095,153 3,303,487 3,242,723 3,122,863 3,060,166
Requirements (100,000)
Personnel Services ‐ Direct Staff 976,754 843,445 1,143,483 1,192,500 1,227,500 1,235,000 1,285,000
Personnel Services ‐ Indirect Staff 930,799 889,059 1,322,352 1,428,618 1,539,242 1,498,251 1,559,679
General Fund Overhead 73,771 584,235 869,739 900,000 700,000 615,000 450,000
Bureau Indirect 1,034,895 702,234 903,062 974,869 1,003,481 1,009,613 1,050,488
Staff & Indirect Subtotal 3,016,219$ 3,018,973$ 4,238,636$ 4,495,987$ 4,470,223$ 4,357,863$ 4,345,166$
Total 2,039,465$ 2,175,528$ 3,095,153$ 3,303,487$ 3,242,723$ 3,122,863$ 3,060,166$

Page 19
sell more debt in the early 2020’s. The bureau will need to re‐evaluate service delivery for affordable housing as that
time approaches, much as it did at the time of the merger.
Central Eastside – A URA with minimal available resources, funding available for affordable housing has further
improved from the prior forecast, with higher‐than‐anticipated amount occurring as soon as FY 2014‐15.
FY 2011‐12 FY 2012‐13 FY 2013‐14 FY 2014‐15 FY 2015‐16 FY 2016‐17 FY 2017‐18
Actual Revised Forecast Forecast Forecast Forecast Forecast
Central Eastside URA
Resources
Beginning Balance 47,481 0 27,478 24,041 91,861 68,891 2,219
Loan Income 2,798 3,200 3,200 3,200 3,200 3,200 3,200
Tax Increment 62,430 37,466 1,015,429 2,638,003 88,917 91,719
Other
Central Eastside URA Total $50,279 $65,630 $68,144 $1,042,670 $2,733,064 $161,008 $97,138
Requirements
Personnel Services ‐ Direct Staffing 16,282 10,659 11,898 40,000 100,000 45,000 30,000
Indirect Costs (Staffing and Overhead) 33,997 27,493 32,205 110,809 264,173 113,789 64,919
H89030 Affordable Rental Housing 800,000 2,300,000
Working Capital 27,478 24,041 91,861 68,891 2,219 2,219
Central Eastside URA Total $50,279 $65,630 $68,144 $1,042,670 $2,733,064 $161,008 $97,138
Convention Center URA
Resources
Beginning Balance 15,274 0 830,252 593,224 181,447 61,861 36,145
Predev Loan Payoffs/Property Sales 1,563,882 1,000,000
Loan Income 67,745 62,500 62,500 62,500 62,500 62,500 62,500
Tax Increment 976,536 1,057,986 11,176,364 276,122 ‐ ‐ ‐
Convention Center URA Total $2,623,437 $2,120,486 $12,069,116 $931,846 $243,947 $124,361 $98,645
Requirements
Personnel Services ‐ Direct Staffing 58,755 76,234 207,159 125,000 50,000 25,000 25,000
Indirect Costs (Staffing and Overhead) 122,681 196,633 560,733 346,277 132,086 63,216 59,536
Land Purchase Repayment 752,660
H80003 Lloyd Cascadian Phase II 28,242 8,667 4,000 3,000
Land Purchase Repayment 811,222
H80002 MFH ‐ 2nd and Wasco 6,511 8,700 4,000
H80042 OCC Miracles Club 362,752 ‐ ‐ ‐ ‐ ‐ ‐
H89030 Affordable Rental Housing ‐ 1,000,000 10,700,000 276,122
H89049 McCoy Apartments Rehab 480,614 ‐ ‐ ‐ ‐ ‐ ‐
Working Capital 830,252 593,224 181,447 61,861 36,145 14,109
Convention Center URA Total $2,623,437 $2,120,486 $12,069,116 $931,846 $243,947 $124,361 $98,645
Downtown Waterfront URA
Resources
Beginning Balance 121,282 537,031 1,086,122 9,542 12,865 2,235 434,374
Loan Income 631,146 658,500 658,500 658,500 658,500 658,500 658,500
Tax Increment 517,400 1,717,345 ‐ ‐ ‐
Other 4,288 3,000 5,000 4,500 4,000 3,000 3,000
Downtown Waterfront URA Total $756,716 $1,198,531 $2,267,022 $2,389,887 $675,365 $663,735 $1,095,874
Requirements
Personnel Services ‐ Direct Staffing ‐ 17,436 69,462 100,000 75,000 65,000 65,000
Indirect Costs (Staffing and Overhead) ‐ 44,973 188,018 277,022 198,130 164,361 154,794
H89030 Affordable Rental Housing ‐ 310,000 2,000,000 2,000,000 400,000 800,000
H20001 Butte Hotel 100,000 50,000
Working Capital 537,031 776,122 9,542 12,865 2,235 434,374 76,080
Program Income Repayment 119,685
Downtown Waterfront URA Total $756,716 $1,198,531 $2,267,022 $2,389,887 $675,365 $663,735 $1,095,874

Page 20
Convention Center ‐ An expiring URA, some portions moved to the Interstate URA via a boundary change in
2011. A final bond sale has produced an additional $10 million for affordable housing that is in the bureaus
current NOFA process.
Downtown Waterfront – This URA is also expiring. There is approximately $2.2 million allocated for affordable
housing, but the URA also has a healthy amount of program income that will boost the amount of funds for
affordable housing to approximately $4 million over the next two fiscal years.
FY 2011‐12 FY 2012‐13 FY 2013‐14 FY 2014‐15 FY 2015‐16 FY 2016‐17 FY 2017‐18
Actual Revised Requested Forecast Forecast Forecast Forecast
Gateway Regional Center URA
Resources
Beginning Balance 31,496 0 ‐ ‐ ‐ ‐ ‐
Predev Loan Payoffs/Property Sales 956,974 1,350,000
Loan Income 123 ‐ ‐ ‐ ‐ ‐ ‐
Tax Increment 928,970 3,571,552 1,083,689 765,915 238,712 231,361 1,438,702
Other 158,398 1,062
Gateway Regional Center URA Total $1,118,987 $4,529,588 $2,433,689 $765,915 $238,712 $231,361 $1,438,702
Requirements
Personnel Services ‐ Direct Staffing 73,350 91,522 75,993 70,000 65,000 65,000 70,000
Indirect Costs (Staffing and Overhead) 153,155 236,066 205,696 193,915 171,712 164,361 166,702
H89030 Affordable Rental Housing ‐ ‐ ‐ 500,000 1,200,000
H20017 Ventura Park 84,570 400,000
H89034 Gateway/Glisan 807,689 3,800,000 2,150,000 ‐
H20035 Property Management 223 2,000 2,000 2,000 2,000 2,000 2,000
Working Capital
Gateway Regional Center URA Total $1,118,987 $4,529,588 $2,433,689 $765,915 $238,712 $231,361 $1,438,702
Interstate URA
Resources
Beginning Balance 249,832 0 ‐ 122,306 144,348 35,743 ‐
Intergovernmental 916,711
Fund Transfers
Predev Loan Payoffs/Property Sales 1,795,745 510,000
Loan Income 11,867 6,800 8,300 8,300 8,300 8,300 8,300
Tax Increment 1,725,844 7,357,943 4,288,012 2,218,595 2,193,527 2,625,055 4,727,598
Other (1,873)
Interstate URA Total $4,698,126 $7,874,743 $4,296,312 $2,349,201 $2,346,175 $2,669,098 $4,735,898
Requirements
Personnel Services ‐ Direct Staffing 244,648 155,480 235,786 240,000 250,000 275,000 315,000
Indirect Costs (Staffing and Overhead) 510,826 401,035 638,220 664,853 660,432 694,098 750,158
H34606 Killingsworth Block 181,000 669,000 ‐ ‐ ‐ ‐ ‐
H19032 King/Parks Affordable Housing 22,399 1,613,712
Land Purchase 752,660
H80026 Grant Warehouse ‐ Affordable Housing
Land Purchase 811,222
H80042 Miracles Club 171,391
H89049 McCoy Apartments Rehab 538,585 136,991
H89046 PCRI Homeownership Development 20,125 ‐ ‐ ‐ ‐ ‐ ‐
H20027 PCRI Scattered Sites Big 10 73,684 193,533
H89030 Affordable Rental Housing ‐ 1,300,000 300,000 400,000 700,000 2,600,000
Lifeworks ‐ 3,200,000 ‐ ‐ ‐ ‐
Beech Street 300,000 1,000,000
Redwood/Jubilee 100,000
H89047 Bridge Meadows 71,073 ‐ ‐ ‐ ‐ ‐ ‐
H38711 Rivergate 6 18,891
H89010 Home Repair Projects 411,976 555,685 500,000 500,000 500,000 500,000 500,000
H37932 HAP Afford Ownership/Rehab 479,948 ‐ ‐ ‐ ‐ ‐ ‐
H89020 Home Buyer Assistance 408,583 530,416 500,000 500,000 500,000 500,000 500,000
Working Capital 122,306 144,348 35,743 70,740
Interstate URA Total $4,698,126 $7,874,743 $4,296,312 $2,349,201 $2,346,175 $2,669,098 $4,735,898

Page 21
Gateway – The bulk of available funds are committed to a project currently underway, but by FY 2014‐15 there
may be additional funds available for affordable housing, with more coming online at the end of the forecast
period.
Interstate – This URA has seen some improvement in funds available for affordable housing. There is a project
currently underway, but there are still some funds available through the forecast period, especially at the end..
Lents – There is some improvement in this URA as well, with significant funds becoming available in FY 2014‐15.
North Macadam/South Waterfront – While a newer URA, increment growth has only recently picked up, and has
been used for debt to cover the costs of the Block 49 affordable housing project. After the completion of that
project, there is no funding for affordable housing until the end of the forecast period.
FY 2011‐12 FY 2012‐13 FY 2013‐14 FY 2014‐15 FY 2015‐16 FY 2016‐17 FY 2017‐18
Actual Revised Requested Forecast Forecast Forecast Forecast
Lents Town Center URA
Resources
Beginning Balance 61,605 0 ‐ 21,485 48,033 62,551 76,720
Intergovernmental 1,388,870
Predev Loan Payoffs/Property Sales 1,294,525 540,000
Loan Income 40,832 13,100 13,100 13,100 13,100 13,100 13,100
Tax Increment 2,594,177 3,491,233 2,154,283 2,888,599 3,475,433 2,165,584 5,202,515
Other
Lents Town Center URA Total $5,380,009 $4,044,333 $2,167,383 $2,923,184 $3,536,566 $2,241,235 $5,292,335
Requirements
Personnel Services ‐ Direct Staffing 255,602 151,111 226,045 230,000 240,000 245,000 250,000
Indirect Costs (Staffing and Overhead) 533,698 389,766 611,853 637,151 634,015 619,515 595,363
H33441 Dahlia Commons/Svaboda 1,710,306 90,000 ‐ ‐ ‐ ‐ ‐
H20031 Beyer Court 330,991 141,178 ‐ ‐ ‐ ‐ ‐
H20032 Firland 627,351 486,649
H20033 PCRIScat Site89/Ellis 4,345 54,468
H89030 Affordable Rental Housing ‐ 500,000 300,000 1,000,000 1,600,000 300,000 3,400,000
H89031 Bellrose Station 459,494
H20023 Kah Sahn Chako Haws 19 1,221,147
H89010 Home Repair Projects 347,139 500,000 500,000 500,000 500,000 500,000 500,000
H37930 Scat Site Home Rehab & Subs HAP 645,358 ‐ ‐ ‐ ‐ ‐ ‐
H89020 Home Buyer Assistance 465,706 500,000 500,000 500,000 500,000 500,000 500,000
H20035 Property Management 10,014 8,000 8,000
Working Capital 21,485 48,033 62,551 76,720 46,972
Lents Town Center URA Total $5,380,009 $4,044,333 $2,167,383 $2,923,184 $3,536,566 $2,241,235 $5,292,335
North Macadam URA
Resources
Beginning Balance 233,780 0 ‐ ‐ 9,799 28,415 25,481
Intergovernmental 174,992
Tax Increment 6,521,689 11,218,642 1,437,077 94,629 100,555 1,661,714 3,479,730
Other
North Macadam URA Total $6,930,461 $11,218,642 $1,437,077 $94,629 $110,354 $1,690,129 $3,505,211
Requirements
Personnel Services ‐ Direct Staffing 88,402 73,098 17,718 22,500 22,500 75,000 85,000
Indirect Costs (Staffing and Overhead) 184,584 188,544 47,959 62,330 59,439 189,648 202,423
H10543 Grays Landing 6,657,475 10,957,000 1,371,400 ‐ ‐ ‐ ‐
H89030 Affordable Rental Housing ‐ ‐ ‐ ‐ ‐ 1,400,000 3,100,000
Working Capital 9,799 28,415 25,481 117,788
North Macadam URA Total $6,930,461 $11,218,642 $1,437,077 $94,629 $110,354 $1,690,129 $3,505,211

Page 22
FY 2011‐12 FY 2012‐13 FY 2013‐14 FY 2014‐15 FY 2015‐16 FY 2016‐17 FY 2017‐18
Actual Revised Forecast Forecast Forecast Forecast Forecast
River District URA
Resources
Beginning Balance 66,066 ‐ ‐ 48,438 198,601 30,794 100,694
Intergovernmental 545,166
Predev Loan Payoffs/Property Sales 779,990 80,000
Loan Income 539,125 558,300 558,300 558,300 558,300 558,300 558,300
Tax Increment 23,895,763 4,219,174 6,060,004 8,003,673 11,496,038 8,008,406 3,327,233
Other
River District URA Total $25,826,110 $4,857,474 $6,618,304 $8,610,411 $12,252,939 $8,597,500 $3,986,227
Requirements
Personnel Services ‐ Direct Staffing 166,088 146,614 214,436 275,000 315,000 325,000 325,000
Indirect Costs (Staffing and Overhead) 346,792 378,167 580,430 761,810 832,145 821,806 773,972
H32138 The Ramona 547,758 ‐ ‐ ‐ ‐ ‐ ‐
H12030 Fairfield Apartments (3,918) 65,000 50,000 50,000 50,000 50,000
H37938 Blanchet House Redev 4,028,478
H89030 Affordable Rental Housing ‐ 1,000,000 5,700,000 7,300,000 11,000,000 7,300,000 2,700,000
H37937 Bud Clark Center 17,338,700 ‐ ‐ ‐ ‐ ‐ ‐
H80036 Yards at Union Station 3,407,377 1,766,693 ‐ ‐ ‐ ‐ ‐
Medford ‐ 1,476,000
H20035 Property Management (5,165) 25,000 25,000 25,000 25,000
Working Capital 48,438 198,601 30,794 100,694 187,255
River District URA Total $25,826,110 $4,857,474 $6,618,304 $8,610,411 $12,252,939 $8,597,500 $3,986,227
South Park Blocks URA
Resources
Beginning Balance (11,929) 3,447,508 ‐ 151,676 199,214 272,028 350,496
Intergovernmental 303,880
Predev Loan Payoffs/Property Sales 3,548,581 110,000
Loan Income 339,855 254,900 254,900 254,900 254,900 254,900 254,900
Tax Increment 193,315 1,464,233 2,252,710
Other 13,839 7,500 ‐
South Park Blocks URA Total $4,387,541 $5,284,141 $2,507,610 $406,576 $454,114 $526,928 $605,396
Requirements
Personnel Services ‐ Direct Staffing 73,627 121,291 55,556 55,000 50,000 50,000 50,000
Indirect Costs (Staffing and Overhead) 153,733 312,850 150,378 152,362 132,086 126,432 119,073
H12027 Jefferson West Apartments 69,804 50,000 50,000 ‐ ‐ ‐ ‐
H12036 Admiral Apartments 818 ‐ ‐ ‐ ‐ ‐ ‐
H12037 Chaucer 532,024 ‐ ‐ ‐ ‐ ‐
H34510 SPB Section 8 Preservation ‐
H20038 Park Tower Preservation ‐ 1,400,000 2,100,000
H20037 Lexington Apartments Preservation
H20036 1200 Tower Preservation 110,027 3,400,000
Working Capital 3,447,508 151,676 199,214 272,028 350,496 436,323
South Park Blocks URA Total $4,387,541 $5,284,141 $2,507,610 $406,576 $454,114 $526,928 $605,396
Education URA
Resources
Beginning Balance
Predev Loan Payoffs/Property Sales
Loan Income
Tax Increment ‐ 336,779 413,133 492,771 626,648 715,451
Working Capital 227,688 8,864 33,131 30,418
Education URA Total $0 $0 $336,779 $640,821 $501,635 $659,779 $745,869
Requirements
Personnel Services ‐ Direct Staffing 29,430 35,000 60,000 65,000 70,000
Indirect Costs (Staffing and Overhead) 79,660 96,958 158,504 164,361 166,702
H12027 Jefferson West Apartments
H89030 Affordable Rental Housing 500,000 250,000 400,000 400,000
Working Capital 227,688 8,864 33,131 30,418 109,167

Page 23
River District – This URA has a substantial number of projects completed over the past two fiscal years, but
resource growth and anticipated privately financed development in the URA has boosted the funds available for
affordable rental housing significantly throughout the forecast. Up to $11 million is under consideration in the
bureaus current NOFA process..
South Park Blocks – This URA is expiring. However, loan payoffs have bolstered remaining funds and program
income in the URA to allow work on additional Preservation projects.
Education – The newest URA, initial tax increment collections are allowing the bureau to continue planning work
for future projects.

Page 24
Cost of Service Study – February 2013
Introduction In compliance with the City of Portland’s Comprehensive Financial Management Policy 2.06, the Portland Housing Bureau (PHB) has completed an initial cost of service study for those programs in the bureau whose operations are supported by fees.
Indirect Programs PHB’s Indirect Programs provide indirect financial assistance in the form of tax and development fee exemptions and credits in order to promote development of and access to affordable homeownership and rental housing. The bureau defines affordability in relation to Median Family Income (MFI). The cost of the financial assistance is foregone revenue. PHB incurs expenses in the course of administering these programs, primarily in the form of staff salaries, benefits and indirect costs. The bureau charges fees to the customers (most often low income residents) accessing and benefitting from these programs in order to offset the costs of service delivery. Limited Tax Exemptions PHB administers Limited Tax Exemption (LTE) programs that encourage the construction and preservation of affordable housing. There are three such programs:
Homebuyer Opportunity Limited Tax Exemption (HOLTE) – A 10‐year property tax exemption for residential structural improvements (up to 100% MFI for a family of four)
Multiple‐Unit Limited Tax Exemption (MULTE) – A 10‐year property tax exemption for multi‐unit structural improvements (minimum 20% of units at 60% MFI or below)
Non‐Profit Low Income Housing Limited Tax Exemption (NPLTE) – Full property tax exemptions for non‐profit organizations that own low‐income rental properties (only for units at 60% or below)
System Development Charge Exemptions PHB administers System Development Charge (SDC) programs that assist developers by exempting them from residential SDC’s charged by Water, Parks, Transportation and Environmental Services. There are two such programs:
Homeownership SDC Exemption Program – Exemptions available only for home purchased by homebuyers at 100% MFI for a family of four
Rental SDC Exemption Program – Exemptions available only for units rented to tenants at 60% MFI or below Mortgage Credit Certificate Program PHB offers low and moderate income households (up to 115% of 100% MFI for a family of four depending on household size) in Portland the opportunity to get an ongoing federal tax credit through a Mortgage Credit Certificate (MCC) ‐‐ an IRS‐approved tax credit that reduces federal income taxes owed as long as the homebuyers keep their loan and continuously occupy the home as their principal residence.
Cost Recovery As described above, each of these programs charges fees intended to offset the costs of service delivery. The table below summarizes projected annual costs of each program and the proportion recovered from the fees charged.

Page 25
As the table above illustrates, none of these programs is projected to recover 100% of its costs. Loan Origination Fees
PHB allocates the majority of its budget to providing financial assistance to developers and private citizens in order to promote the development of affordable rental housing and access to affordable homeownership. Most of this financial assistance comes in the form of loans. Loan origination fees are standard practice in the private sector lending industry. Most commonly, a loan origination fee represents a specific percentage of the value of the total loan (e.g., one percent, one half of one percent). In PHB’s multi‐family housing program, PHB at times charges a percentage loan origination fee. This fee, however, is not applied to all projects. Often, a determination is made that the project cannot afford the additional cost of an origination fee to the overall project financing structure. In PHB’s down payment assistance program, PHB charges a standard $500 loan origination fee. Cost Recovery Regarding the multi‐family housing program, since an origination fee is a percentage of the total loan amount, the fee cannot be driven directly by the cost of underwriting and processing the loan. First, the level of effort does not necessarily scale according to the size of the loan; for example, many of the same underwriting, legal, closing and construction management requirements exist regardless of the amount loaned to the borrower. And second, funding source‐specific requirements alter the equation. For instance, a federally funded loan for $1 million requires a higher level of effort than a similarly sized non‐federally funded loan. Regarding the down payment assistance program, the question of cost recovery is simpler but is pre‐empted by another fact. Loan origination fees on down payment assistance loans are funded entirely by PHB; therefore, none of these costs are recovered from an external source. HMIS User Fees PHB manages a homeless management information system (HMIS) as part of the HUD McKinney grant it receives. This reporting system is utilized by government and non‐profit agencies state‐wide. User fees are charged to the user agencies and, in combination with the McKinney grant, funds pay for license fees and bureau staff time that is involved with management of the system, the data, and training. Funds are also reserved for software updates and hardware replacement. The expansion to a state‐wide system began in FY 2011‐12, and fees were developed to recover costs. Cost recovery is scaled to the total number of users in the system as well as the needs of the individual agency and the grant funding. Due to the grant funding component, the fees are not set for full cost recovery. Between the grant and user fees, the program is self‐sufficient.
Cost Fees Fees Fees Cost %
(Gross) (Gross) (Pass‐Through) (Net) (Net) Recovered
HOLTE 116,235 107,750 (74,500) 33,250 82,985 29%
MULTE 46,847 55,000 (30,000) 25,000 21,847 53%
NPLTE 39,774 3,250 ‐ 3,250 36,524 8%
SDC Homeownership 148,114 103,500 (8,520) 94,980 53,134 64%
SDC Rental 27,213 4,600 ‐ 4,600 22,613 17%
MCC 90,239 54,425 (666) 53,759 36,480 60%
Total 468,421 328,525 (113,686) 214,839 253,582 46%

Page 26
Cost Recovery Users pay actual seat license fees as set by the vendor. Fees to the bureau are flat rate based upon vendor charges and the pool of users. These fees will adjust annually based upon cost increases from the vendor and changes to pool of users. Fees for per hour services were set initially at $175, reflective of fees the vendor charges for service. Actual cost per hour plus bureau indirect for staff providing the service came to $176.18. Exhibit A shows a sample pricing table for a larger sized agency. FY 2013‐14 will be the first year that the bureau is collecting full year fees from all participants, allowing for a check‐in review of rates and their cost recovery, as well as some initial actually data on staff time incurred. Next Steps PHB will incorporate this analysis into ongoing processes focused on assessing what fee structure would be appropriate to support these activities going forward. These processes will consider and attempt to answer these questions: Indirect Programs
What is the capacity of clients to absorb fee increases?
What is value of the benefit received vs. the size of the fee itself?
Might a tiered, partially‐refundable fee structure be appropriate? (e.g., where a portion of a total fee could be refunded if an application failed to progress through a key step in the process)
What (if any) subsidy to these programs is appropriate given what the programs achieve in increasing affordable housing in the city?
Loan Origination Fees
What restrictions exist on charging fees when staff time and indirect costs are already reimbursed from a particular funding source (e.g., grants)?
Is there value to collecting an origination fee when PHB provides the borrower the funding for both the loan and the fee?
How do loan origination fees fit into the long‐term vision for the financial stability of PHB’s multi‐family housing program? Is a different fee structure appropriate?

Page 27
Exhibit A
Sample Pricing Table and Notes:
Customer Service Advisory Committee Page 1 of 3
The Customer Service Advisory Committee is helping to implement Bureau Innovation Project #7 recommendations to improve the City of Portland’s customer service. www.portlandonline.com/csac Contacts: John Dutt, Office of Neighborhood Involvement, CSAC Chair, 503-825-2625 or Tenzin Choephel, CSAC Staff 503-823-3542
Customer Service Improvement Status Report Bureau: Portland Housing Bureau Staff Contact: Leslie Goodlow Phone: 503-823-4160 Date: 2/4/2013 Bureau Mission and Goals: Please attach any copies of recent workplans or other policy documents that specifically address customer service improvement efforts in your bureau over the past year. Please describe how your strategic plans include customer service, and any plans for future customer service improvement efforts. Reference materials: Strategic Plan (http://tinyurl.com/b37u65d)
PHB Business Operations Expectations (attached) Subrecipient Contractor Equity Goal Setting Kickoff Meeting (attached)
The Portland Housing Bureau (PHB) serves those Portlanders whose need for safe, affordable housing is not met by the private market. Thus, our customers are both persons with unmet affordable housing needs as well as those local agencies, non-profits and developers with whom PHB partners to deliver services. The following three key documents speak to the bureau’s commitment to customer service. 1. Strategic Plan – PHB has adopted a three-year strategic plan that was developed with
extensive input from our customers, community stakeholders and housing system partners. The following is a sample of strategic goals identified in the plan that speak to customer service:
• Goal 2.C: Increase participation by minority-owned and economically-disadvantaged firms
in the economic opportunities created by PHB investments • Goal 4.B: Establish and meet highest standards for customer service and regulatory
compliance • Goal 4.C: Provide the community with clear, consistent, reliable data on Portland’s
housing needs and trends and on the performance of PHB’s programs and projects. • Goal 4.E: Ensure that a wide range of perspectives inform PHB’s agenda, decision-making
and policy-setting
PHB is managing efforts to meet these goals via a comprehensive implementation plan that details the numerous concrete steps and deadlines necessary to accomplish the strategic goals.
2. Business Operations Expectations – PHB business operations staff have committed themselves to a set of professional standards. Customer service is prominent amongst these. The following is an excerpt from this guiding document.
• “Customer service includes internal and external customers of PHB.” • “Go the extra mile for customers – it will be recognized.” • “Be supportive of other functional areas at PHB. We are all part of the same
organization.” • “Respond to customer emails to let them know you are working on their request, and how
it will be triaged.” • “Inform customers about project status so they know what is happening.” • “Create an extended absence greeting for your voicemail as well as an ‘out of office’
message for email directing customers to someone who can help them in your absence.” 3. Subrecipient Contractor Equity Goals – As a part of PHB’s larger equity agenda, PHB is
working collaboratively with subrecipients to develop contract performance goals intended to

Customer Service Advisory Committee Page 2 of 3
The Customer Service Advisory Committee is helping to implement Bureau Innovation Project #7 recommendations to improve the City of Portland’s customer service. www.portlandonline.com/csac Contacts: John Dutt, Office of Neighborhood Involvement, CSAC Chair, 503-825-2625 or Tenzin Choephel, CSAC Staff 503-823-3542
close disparities in access to PHB’s services experienced by communities of color in Portland. The attached presentation from 5/17/2012 was used in a kickoff meeting with the contractors.
Customer Service Assessment: Please attach a copy of any recent customer service surveys or other customer service assessment tools including results. If you do not currently survey bureau customers, please explain any future plans to do so. Reference Materials: Strategic Plan (http://tinyurl.com/b37u65d)
Portland Housing Advisory Commission (http://tinyurl.com/47kxlee)
PHB did not undertake a formal customer service survey in the past year. We do have plans for a survey to be completed in July of this year, and then annually with the start of each fiscal year. PHB takes very seriously the feedback and priorities of its diverse customer base, the following sample describes several ways in which the bureau listens and responds to this input.
• Strategic Plan – PHB’s customer base had a deep and broad-based role in shaping the strategic plan. (See the reference materials listed above for additional detail.)
• Portland Housing Advisory Commission (PHAC) – As PHB’s citizen advisory body, the PHAC to provides PHB with ongoing feedback regarding the bureau’s strategic direction.
• Equity Council - As PHB’s customer base has made clear, PHB must make positive contributions to increasing Equity through its investments. The PHB Equity Council (EC) provides a forum for discussion and a source for advising PHB leadership on the following:
• Implementation of the PHB Equity Agenda • Adapting and formalizing an Equity Lens for PHB decision making • Development of a PHB bureau equity plan (required for all city bureaus) • Liaison with the Citywide Equity Committee
• Contract Management Workgroup – PHB passes significant resources to “subrecipients” (primarily non-profits) to provide services. In order to improve the effectiveness of these partnerships with subrecipient contractors, PHB has established a standing contract management workgroup whose primary charge is to engage in troubleshooting and ongoing process improvement. The contract management workgroup has published a desk manual for training purposes at all levels.
• Citizen Involvement In Budget Process – In the FY 2013/14 budget development process, PHB responded to a criticism that some of the key vehicles for public input into PHB’s process had come in years past after many budget decisions had been made. The bureau responded this year by working with the Coordinating Committee to End Homelessness (CCEH) and the PHB Federal Consolidated Plan development team to schedule, coordinate and facilitate a single public hearing in the community as part of the PHB public budget involvement process. This hearing took place on 11/14/2012 – well in advance of the Requested Budget submission deadline.
2013 Notice of Funding Availability (NOFA) – In response to feedback from developers regarding PHB’s expectations of proposals in the 2012 NOFA, PHB has done three things to improve the 2013 NOFA process. First, PHB has held mandatory informational sessions for all parties submitting proposals in order to help ensure expectations are clear. Second, the bureau has revised the scoring methodology to be more structured and more easily interpreted by the developers. Third, through the revamped scoring methodology, PHB has significantly increased the ways in which development teams can receive credit for equity and diversity initiatives. Workforce Development: Please describe any efforts you have made to develop customer service competency within your workforce in the areas of recruitment, training, and evaluation over the past year. Please share any details regarding progress in these areas over the past year (training program information, key bureau contacts, recruitment/evaluation material examples, etc.)
Customer Service Advisory Committee Page 3 of 3
The Customer Service Advisory Committee is helping to implement Bureau Innovation Project #7 recommendations to improve the City of Portland’s customer service. www.portlandonline.com/csac Contacts: John Dutt, Office of Neighborhood Involvement, CSAC Chair, 503-825-2625 or Tenzin Choephel, CSAC Staff 503-823-3542
Recruitment While the bureau’s financial forecast has limited PHB’s ability to recruit for vacant positions, PHB continues to prioritize hires that strengthen the bureau’s customer service foundation. To this end, PHB will target candidates with a deep knowledge of:
• Customer Service – Candidates will illustrate an ability to provide customer-friendly operations and responsiveness to contractor and borrower questions.
• Public Funding Stewardship – Candidates will illustrate an ability to maintain sound financial management that minimizes disruptions to sub-recipient contractor projects and services.
• Business Process Improvement – Candidates will embrace the opportunities from process improvement and organizational development, which will focus on optimizing business processes that impact our customers.
• Data Reporting – Candidates will demonstrate a proven ability to both collect and report on key performance indicators that are valuable to PHB’s partners and decision makers.
Education & Evaluation Each member of the PHB administrative staff is held accountable to the bureau’s “Business Operations Expectations” which set a standard for high-quality bureau customer service. Also, each member of the PHB staff is evaluated on customer service competency during his or her annual review. Customer service is considered a core competency for all staff. Additionally, PHB is developing a Bureau-wide training plan which will encompass all trainings for all levels of staff and management, regarding compliance, equity/diversity and customer service. Each staff member will have an individualized training plan developed jointly with their manager to ensure staff receives trainings appropriate to their position and that are beneficial to the Bureau. PHB has also established a $10,000 training fund for AFSCME Local 189 employees as stipulated in its collective bargaining agreement. This fund is intended to support ongoing professional development as opposed to current job-specific requirements.
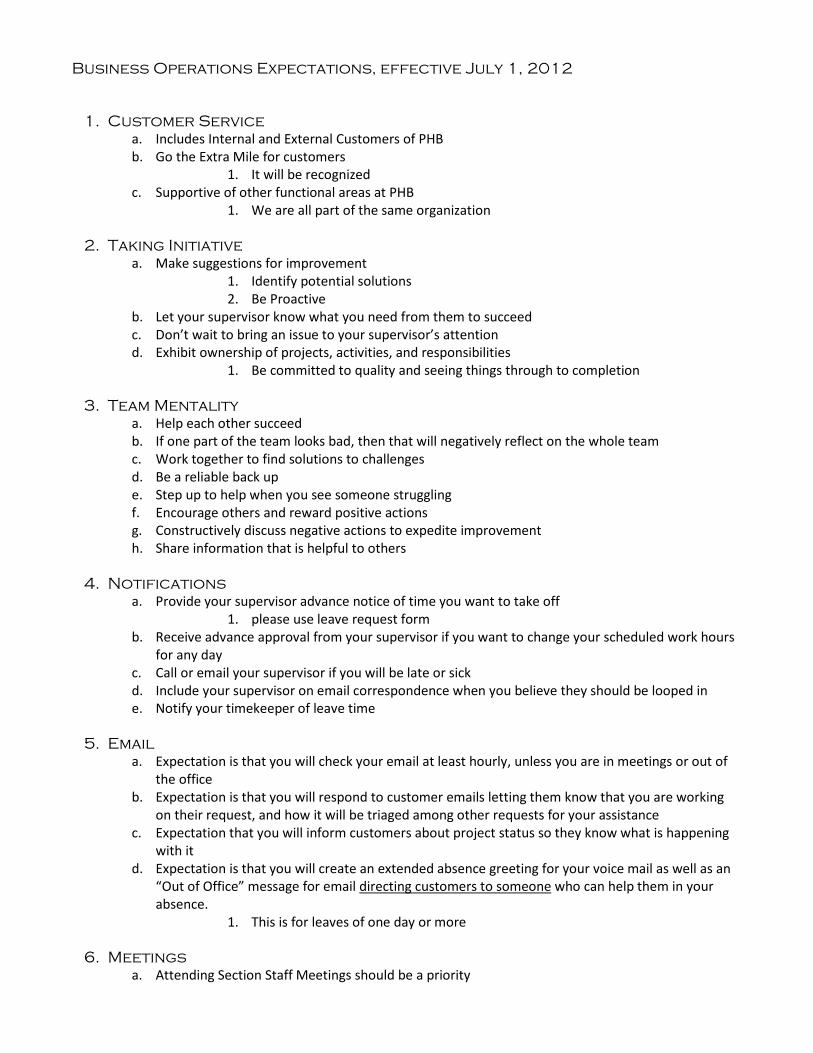
Business Operations Expectations, effective July 1, 2012
1. Customer Service a. Includes Internal and External Customers of PHB b. Go the Extra Mile for customers
1. It will be recognized c. Supportive of other functional areas at PHB
1. We are all part of the same organization
2. Taking Initiative a. Make suggestions for improvement
1. Identify potential solutions 2. Be Proactive
b. Let your supervisor know what you need from them to succeed c. Don’t wait to bring an issue to your supervisor’s attention d. Exhibit ownership of projects, activities, and responsibilities
1. Be committed to quality and seeing things through to completion
3. Team Mentality a. Help each other succeed b. If one part of the team looks bad, then that will negatively reflect on the whole team c. Work together to find solutions to challenges d. Be a reliable back up e. Step up to help when you see someone struggling f. Encourage others and reward positive actions g. Constructively discuss negative actions to expedite improvement h. Share information that is helpful to others
4. Notifications
a. Provide your supervisor advance notice of time you want to take off 1. please use leave request form
b. Receive advance approval from your supervisor if you want to change your scheduled work hours for any day
c. Call or email your supervisor if you will be late or sick d. Include your supervisor on email correspondence when you believe they should be looped in e. Notify your timekeeper of leave time
5. Email
a. Expectation is that you will check your email at least hourly, unless you are in meetings or out of the office
b. Expectation is that you will respond to customer emails letting them know that you are working on their request, and how it will be triaged among other requests for your assistance
c. Expectation that you will inform customers about project status so they know what is happening with it
d. Expectation is that you will create an extended absence greeting for your voice mail as well as an “Out of Office” message for email directing customers to someone who can help them in your absence.
1. This is for leaves of one day or more
6. Meetings a. Attending Section Staff Meetings should be a priority

b. Be prepared for meetings and flag issues for your supervisor in advance of complex or sensitive meetings
By signing this document, you acknowledge that you have read and understand the expectations for the business operations team.

PHB Sub-recipient Contractors Meeting
Equity AgendaMay 17, 2012

PHB Strategic Plan Investment Priorities
Priority 1 – Provide more rental housing for the most vulnerable people
Priority 2 – Move people quickly from homelessness to permanent housing while preventing families from losing their homes (becoming homeless)
Priority 3 – Help Portlanders from communities of color buy a home or keep the home they already own
Priority 4 – Provide a safety net that includes shelters and other short-term help for low-income Portlanders who are homeless or at risk of homelessness.

Equity Goals by Strategic Plan Priority
19%
19%
23%
20%
19%
4%
7%
7%
11%
15%
9%
6%
29%
10%
22%
1%
3%
2%
2%
10%
68%
71%
48%
73%
69%
0% 20% 40% 60% 80% 100% 120% 140% 160%
Emergency Shelter (69% CoC)
Transitional Housing (35% CoC)
Rent Assistance (61% CoC)
Supportive Housing (43% CoC)
% IN POVERTY (134% All; 65% CoC)
Priority 2 & 4 - Move People from homelessness to permanent housing/Prevent housing loss; Safety net for those at risk of homelessness
African American Native American Latino Asian or Pacific Islander White

Example - Sub-recipient Contractor Equity Goal Setting
Priority 2 – Move people quickly from homelessness to permanent housing while preventing families from losing their homes (becoming homeless)
RENT ASSISTANCE # Hshlds Served
African American
Native American Latino
Asian Pacific Islander
OUTPUTS Contractor A(serves general population) 50 12% 7% 24% 1%
Yr 1 50 15% 10% 24% 4%Yr 2 50 18% 13% 24% 7%Yr 3 50 19% 15% 24% 10%
OUTCOMES Contractor AYr 1 Describe organizational equity efforts
Continue effective delivery to Latino Community - Best Practice?
OUTPUTS Contractor B(AA culturally specific) 10 75% 10% 10% 5%
Yr 1 10 75% 10% 10% 5%Yr 2 10 75% 10% 10% 5%Yr 3 10 75% 10% 10% 5%
OUTCOMES Contractor BYr 1 Describe organizational equity efforts
Review Service Model - Learning for Other CS Providers?Collaborate/Refer to other CS Providers

Equity Goals by Strategic Plan Priority
3%
10%
8%
30%
14%
15%
0%
1%
1%
6%
4%
19%
5%
7%
5%
6%
10%
24%
13%
33%
33%
6%
7%
14%
80%
44%
41%
30%
75%
0%
0% 20% 40% 60% 80% 100% 120%
Tax Incentives for New Homebuyers (21% CoC)
Single Family Limited Tax Exemption (51% CoC)
SDC Tax Exemption Program (47% CoC)
DPAL (48% CoC)
Education and Counseling (35% CoC)
% DISPARITY IN HOMEOWNERSHIP RATE (White 48%)
Priority 3 - Help Portlanders from communities of color buy a home
African American Native American Latino Asian or Pacific Islander White
25%
27%
19%
4%
0%
15%
5%
0%
22%
7%
0%
10%
44%
56%
69%
0% 20% 40% 60% 80% 100% 120% 140% 160%
Grants for Home Repairs (41% CoC)
Loans for Home Repairs (27% CoC)
% IN POVERTY (134% All; 65% CoC)
Priority 3 - Help Portlanders from communities of color keep the home they already own
African American Native American Latino Asian or Pacific Islander White

Priority 3 – Help Portlanders from communities of color to buy a home
Example - Sub-recipient Contractor Equity Goal Setting
EDUCATION & COUNSELING# Hshlds Served
African American
Native American Latino
Asian Pacific Islander
OUTPUTS Contractor A(serves general population) 200 10% 4% 24% 10%
Yr 1 100 12% 10% 24% 12%Yr 2 100 13% 13% 24% 14%Yr 3 100 15% 19% 24% 14%
OUTCOMES Contractor AYr 1 Describe organizational equity efforts
Continue effective delivery to Latino Community - Best Practice?
OUTPUTS Contractor B(NA culturally specific) 50 5% 80% 10% 1%
Yr 1 30 6% 80% 10% 2%Yr 2 30 7% 80% 11% 3%Yr 3 30 7% 80% 12% 3%
OUTCOMES Contractor BYr 1 Describe organizational equity efforts
Review Service Model - Learning for Other CS ProvidersCollaborate/Refer to other CS Providers

Priority 3 – Help Portlanders from communities of color keep the home they already own
Example - Sub-recipient Contractor Equity Goal Setting
GRANTS FOR HOME REPAIRS# Hshlds Served
African American
Native American Latino
Asian Pacific Islander
OUTPUTS Contractor A(serves general population) 125 24% 4% 5% 7%
Yr 1 75 24% 7% 10% 8%Yr 2 75 24% 10% 15% 9%Yr 3 75 24% 15% 22% 10%
OUTCOMES Contractor AYr 1 Describe organizational equity efforts
Continue effective delivery to African American Community - Best Practice?
OUTPUTS Contractor B(Latino culturally specific) 50 10% 5% 80% 2%
Yr 1 30 10% 5% 80% 2%Yr 2 30 8% 7% 80% 3%Yr 3 30 9% 8% 80% 3%
OUTCOMES Contractor BYr 1 Describe organizational equity efforts
Review Service Model - Learning for Other CS ProvidersCollaborate/Refer to other CS Providers
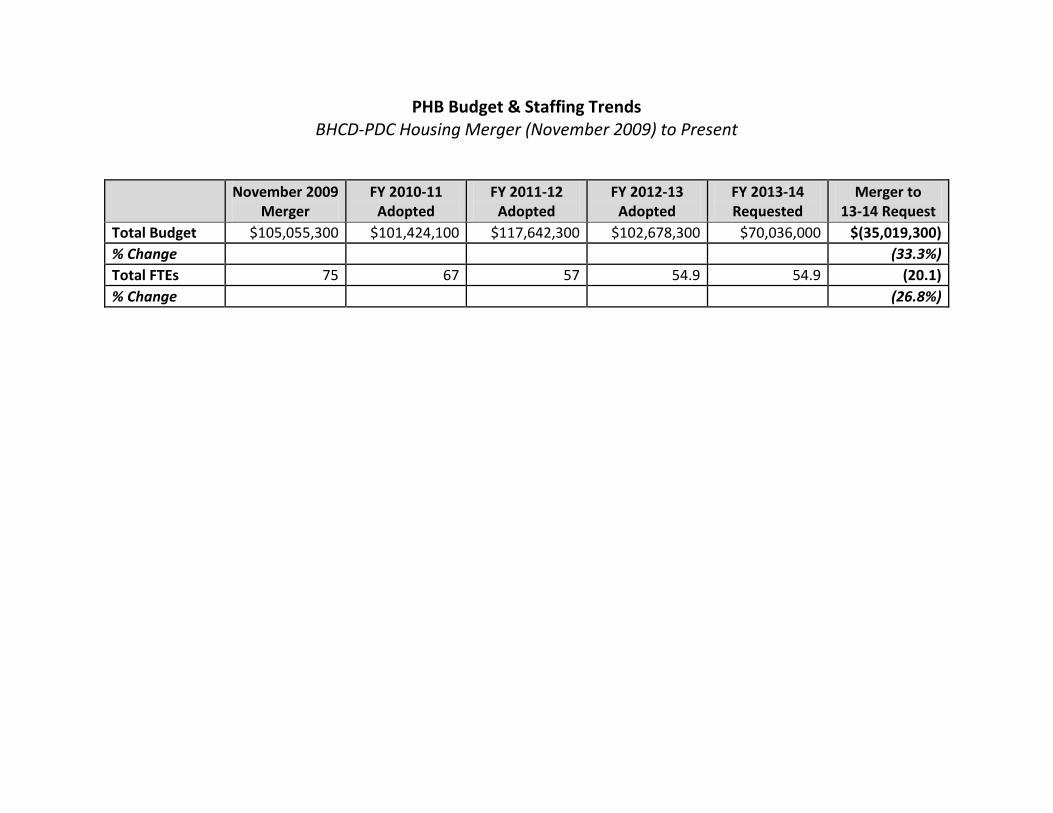
PHB Budget & Staffing Trends BHCD-PDC Housing Merger (November 2009) to Present
November 2009
Merger FY 2010-11
Adopted FY 2011-12
Adopted FY 2012-13
Adopted FY 2013-14 Requested
Merger to 13-14 Request
Total Budget $105,055,300 $101,424,100 $117,642,300 $102,678,300 $70,036,000 $(35,019,300) % Change (33.3%) Total FTEs 75 67 57 54.9 54.9 (20.1) % Change (26.8%)

Summary of General Fund and CDBG Public Service Cap Reductions FY 2013/14 Requested Budget
Strategic Plan Investment
Priority
Functional Area Description
General Fund Reduction
CDBG Public Service Cap Reduction
Total Reduction
Total Budget (All Funds) by
Functional Area
Cut as % of Total
Functional Area Budget
Priority Two
Prevention: Reduce Short Term Rent Assistance $0 $97,890 $97,890 $2,974,554 3% Supportive Housing: Reduce mental health outreach, Alcohol and Drug Free Communities, Community Engagement Program, Key Not a Card family rent assistance, Street outreach, Youth Transitional Housing and the Bridgeview by 5%
$173,300 $23,860 $197,160 $5,095,802
4%
Supportive Housing: Reduce Bud Clark Commons PSH by 10%
$27,000 $0 $27,000
Priority Three
Homebuyer Education and Counseling: Reduce education and counseling contracts, eliminate homeownership fairs
$42,600 $6,250 $48,850 $792,575
16%
Foreclosure Prevention/Home Retention: Reduce homeownership retention program
$80,000 $0 $80,000
Priority Four
Emergency Services: Eliminate winter recuperation care, winter shelter and the Clark Center
$449,000 $322,000 $771,000 $4,504,598
19%
Emergency Services: Reduce youth and other shelters by 5%
$93,190 $0 $93,190
Access: Eliminate Housing Connections, Shared Housing, Rent Well Administration, Oregon Community Warehouse
$215,773 $0 $215,773 $824,126
27%
Access: Reduce Rose City Resource Guide by 10% $3,000 $0 $3,000 Total
$1,083,863 $450,000 $1,533,863

Portland Housing Bureau Add-Back Requests FY 2013/14 Requested Budget
Name Description Amount Keep the Clark Center Open Restore funding to keep the 90 Bed men's Clark Center Shelter Open $424,650
Preserve the Safety Net Provide funding to provide winter recuperation care, winter shelter and the youth shelter
$331,050
Permanent Housing and Access for Vulnerable Populations
Provide funding for programs that support permanent housing outreach, placement, services and stabilization for vulnerable people Programs include mental health outreach and housing placement, street outreach, housing placement and retention, alcohol and drug free communities, family rent assistance, Rose City Resource Guide, Rent Well, youth transitional housing, and Community Engagement Program
$216,300
Stabilize Families: Prevent Foreclosure
Provide funding for programs that build the pipeline of potential homebuyers from communities of color and help homeowners retain their home
$74,241
OMF/IA OMF/IA Add back $37,622
Total $1,083,063

1 of 2
FY 2013-14 FY 2014-15 FY 2015-16 FY 2016-17 FY 2017-18Requested Forecast Forecast Forecast Forecast
Central Eastside URANotice of Funding Availability (NOFA) - 900,000 2,300,000 - -
Convention Center URANotice of Funding Availability (NOFA) 10,700,000 276,122 Lloyd Cascadian Phase II 4,000 3,000 2nd and Wasco 4,000 - - - -
Downtown Waterfront URANotice of Funding Availability (NOFA) 2,000,000 2,000,000 400,000 800,000
Gateway Regional Center URANotice of Funding Availability (NOFA) - 500,000 1,200,000 Gateway/Glisan 2,150,000 - - - - Property Management 2,000 2,000 2,000 2,000 2,000
Interstate URANotice of Funding Availability (NOFA) 1,300,000 300,000 400,000 700,000 2,600,000 Beech Street 1,000,000 Home Buyer Assistance 500,000 500,000 500,000 500,000 500,000 Home Repair Projects 500,000 500,000 500,000 500,000 500,000
Lents Town Center URANotice of Funding Availability (NOFA) 300,000 1,000,000 1,600,000 300,000 3,400,000 Home Repair Projects 500,000 500,000 500,000 500,000 500,000 Home Buyer Assistance 500,000 500,000 500,000 500,000 500,000 Property Management 8,000 8,000 - - -
North Macadam URANotice of Funding Availability (NOFA) - - - 1,400,000 3,100,000 Grays Landing 1,371,400 - - - -
River District URANotice of Funding Availability (NOFA) 5,700,000 7,300,000 11,000,000 7,300,000 2,700,000 Fairfield Apartments 50,000 50,000 50,000 50,000 Property Management 25,000 25,000 25,000 - -
Portland Housing BureauSummary of Financial Assistance Projects

2 of 2
FY 2013-14 FY 2014-15 FY 2015-16 FY 2016-17 FY 2017-18Requested Forecast Forecast Forecast Forecast
Portland Housing BureauSummary of Financial Assistance Projects
South Park Blocks URAPark Tower Preservation 2,100,000 - - - - Jefferson West Apartments 50,000 - - - -
Education URANotice of Funding Availability (NOFA) 500,000 250,000 400,000 400,000
Community Development Block Grant (CDBG)Notice of Funding Availability (NOFA) 507,650 2,000,000 2,000,000 1,500,000 1,300,000 Bronaugh 1,500,000 - - - - PCRI Restructure 1,525,000 - - - - Stephens Creek 550,000 - - - -
HOME GrantNotice of Funding Availability (NOFA) 2,000,000 400,000 1,500,000 1,400,000 1,500,000 Providence House 375,000 - - - - Hawthorne East - 1,500,000 - - - Glisan Commons 880,000 - - - -