portfolio construction with alternatives · portfolio construction with alternatives: correcting...
TRANSCRIPT

NOT FOR RETAIL DISTRIBUTION: This communication has been prepared exclusively for institutional/wholesale/professional clients and qualified investors only as defined by local laws and regulations.
INVESTMENT INSIGHTS
AbstractLofty valuations in traditional assets have encouraged investors to explore alternatives. Unfortunately, the lack of a holistic investment framework to incorporate alternatives poses a challenge. Traditional risk-return based approaches, alone, over-allocate to alternatives - a result of underestimation of risks resulting from a) significant manager dispersion and b) smoothness in the pooled return indices utilized for alternatives. Much research corrects for smoothness of returns; however, the risk from performance dispersion remains unaddressed. In this paper, we discuss a methodology to quantify performance dispersion risk and incorporate it in the portfolio construction process
1. Introduction
We have seen massive monetary stimulus from the world’s central banks during the past decade. The resulting liquidity has resulted in tremendous appreciation in the value of financial assets. Following a multi-year surge in the prices of publicly traded equity and fixed income securities, valuations are arguably stretched across the board. High price-to-earnings multiples in equities and low levels of yields within fixed income do not bode well in terms of future return prospects for these asset classes. The diversification benefit of a negative correlation between equities and high-grade bonds has also come into question with the fear that a sharp rise in rates might trigger a sell-off in equities as well.
Portfolio Construction with Alternatives:Correcting High Performance Dispersion in Active Strategies
The lack of diversification and low expected returns are encouraging investors to contemplate adding alternative investments. However, traditional risk measures fail to incorporate the risks of performance dispersion and smoothness in returns.
Amit SoniPortfolio Manager
Strategic Asset Allocations & SolutionsNew York Life Investment Management
October 2018
NOT FOR RETAIL DISTRIBUTION: This communication has been prepared exclusively for institutional/wholesale/professional clients and qualified investors only as defined by local laws and regulations.October 2018
Portfolio Construction with Alternatives
2
Portfolio Construction with Alternatives
The lack of diversification and low expected returns are encouraging investors to contemplate adding alternative investments, whether liquid or illiquid, into their portfolios. But the traditional optimization methods, run on broader traditional and alternative indices, have delivered results that give investors a pause. The experience from alternatives, for many investors, especially in the liquid space, has not been as good as they initially expected. As a result, investors are not comfortable with the high allocations that these optimization techniques recommend. We believe that part of the problem is an underestimation of risk that comes from utilizing commonly used broad alternative indices, which are derived from aggregating or pooling returns provided by hedge fund or private equity managers. These pooled indices disguise the significant dispersion of returns for managers within the index. They are also subject to a smoothing effect that comes with illiquidity.
A lot of research has already been done to correct for the smoothness of returns in illiquid asset classes, both traditional and alternative. However, we have not yet seen a solution to measure the risk from manager performance dispersion and incorporate it in portfolio construction. This has implications, not only for alternatives, but also for active management in general, where the actual performance of the investment can materially deviate from that of the broad market index.
2. Portfolio Dilemma
Consider an investor interested in diversification through a risk-based approach into 3 key asset classes: equity, investment grade (IG) fixed-income & alternatives. We apply a risk parity approach on widely used corresponding indices; S&P 500 Index1 for equities, ICE BofAML US Corporate Index2 for IG fixed-income and Hedge Fund Research HFRI Fund Weighted Composite Index3 for alternatives. The risk measures used in this optimization are based on monthly historical returns as of 12/31/2017 beginning with the inception of the HFR time series in January 1990.
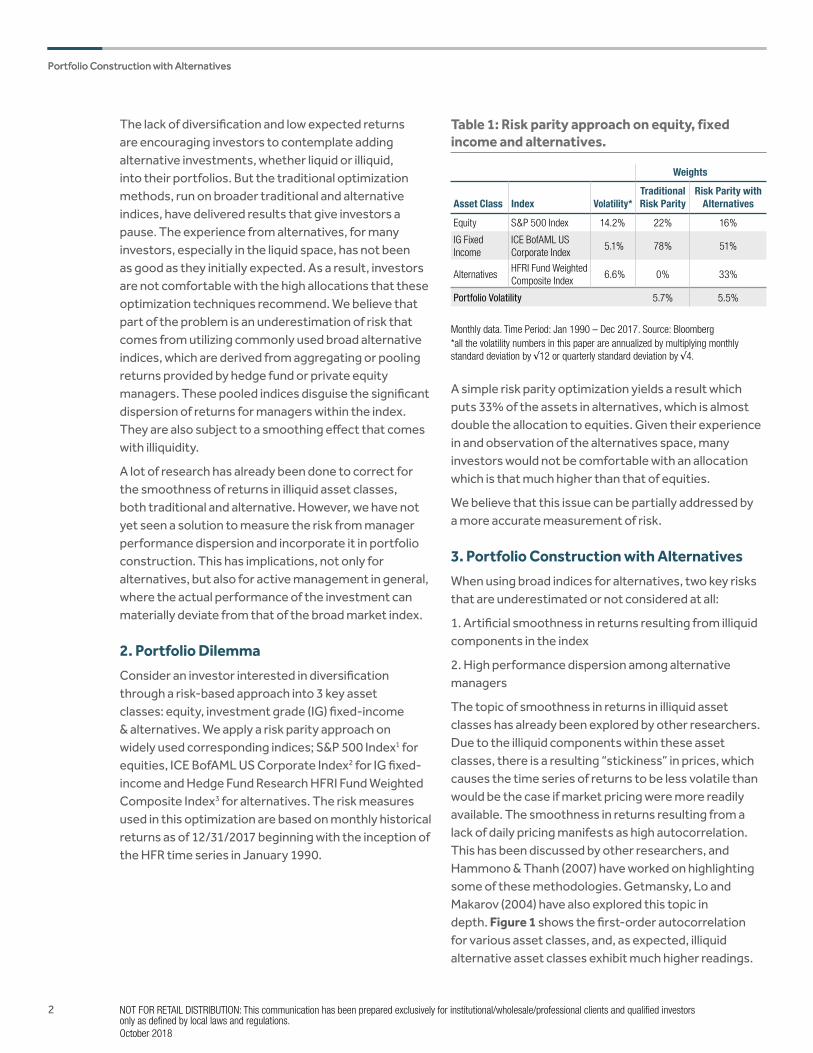
Table 1: Risk parity approach on equity, fixed income and alternatives.
A simple risk parity optimization yields a result which puts 33% of the assets in alternatives, which is almost double the allocation to equities. Given their experience in and observation of the alternatives space, many investors would not be comfortable with an allocation which is that much higher than that of equities.
We believe that this issue can be partially addressed by a more accurate measurement of risk.
3. Portfolio Construction with Alternatives
When using broad indices for alternatives, two key risks that are underestimated or not considered at all:
1. Artificial smoothness in returns resulting from illiquid components in the index
2. High performance dispersion among alternative managers
The topic of smoothness in returns in illiquid asset classes has already been explored by other researchers. Due to the illiquid components within these asset classes, there is a resulting “stickiness” in prices, which causes the time series of returns to be less volatile than would be the case if market pricing were more readily available. The smoothness in returns resulting from a lack of daily pricing manifests as high autocorrelation. This has been discussed by other researchers, and Hammono & Thanh (2007) have worked on highlighting some of these methodologies. Getmansky, Lo and Makarov (2004) have also explored this topic in depth. Figure 1 shows the first-order autocorrelation for various asset classes, and, as expected, illiquid alternative asset classes exhibit much higher readings.
Monthly data. Time Period: Jan 1990 – Dec 2017. Source: Bloomberg*all the volatility numbers in this paper are annualized by multiplying monthly standard deviation by √12 or quarterly standard deviation by √4.
Weights
Asset Class Index Volatility*Traditional Risk Parity
Risk Parity with Alternatives
Equity S&P 500 Index 14.2% 22% 16%
IG Fixed Income
ICE BofAML US Corporate Index
5.1% 78% 51%
AlternativesHFRI Fund Weighted Composite Index
6.6% 0% 33%
Portfolio Volatility 5.7% 5.5%

NOT FOR RETAIL DISTRIBUTION: This communication has been prepared exclusively for institutional/wholesale/professional clients and qualified investors only as defined by local laws and regulations.October 2018
Portfolio Construction with Alternatives
3
Based on the specific problem, investors can pick the right approach to adjust for smoothness in returns for the corresponding alternative indices. This adjustment may also be necessary for some traditional asset classes, such as high yield or bank loans, since some underlying components in their respective indices may not be traded often.
In addition to illiquidity, the alternative asset classes also exhibit a much higher degree of manager performance dispersion. A lot of practitioners have discussed this topic to highlight the importance of selecting a good manager or strategy. However, to our knowledge, no research has been done to quantify this risk. It is important to incorporate the manager performance dispersion risk in portfolio construction for an accurate measurement of risk coming from alternatives.
3.1 Performance Dispersion Risk
For traditional asset classes like equities or bonds, one can use an appropriate passive index such as the S&P 500 for equities or the BofAML US Corporate Bond Index for investment-grade fixed income as a proxy for all strategies operating in that market. The risk characteristics of the index will be generally similar to those of any given manager’s strategy, and actual resulting performance can likewise be expected to be similar, whether the investor ends up selecting a passive strategy or an active manager. The reason for this is that most active managers in traditional asset classes have a well-defined benchmark, and they monitor their active
exposures closely with respect to that benchmark. The universe of investable securities is also well defined and reasonably homogenous in terms of risk characteristics.
However, in alternative investment categories, the managers usually do not have a well-defined benchmark. Instead, they often rely on alternative indices offered by firms like Hedge Fund Research (HFR) or Cambridge Associates, which pool returns from a universe of alternative managers to build a time series of returns. These are useful in modeling the asset class exposure, but since the underlying components are not easily investable, the alternative managers cannot run their portfolios relative to these benchmarks. In addition, many alternatives managers have a “go anywhere” mandate, which can also cause the returns to diverge. As a result, the dispersion among managers is much higher among alternative managers than within traditional investment categories. In Figure 2, we can see the annualized performance of the top (25th percentile) and the bottom (75th percentile) quartile managers over a period of 5 years.
The performance dispersion among traditional asset classes i.e. US large cap equities and intermediate term fixed income, is much smaller compared to the dispersion among alternative asset classes like private equity or US domiciled hedge funds. This means the harm that comes with selecting an underperforming manager is much greater in the alternatives space. This risk is not captured by the volatility of the index, but should be taken into consideration.
Portfolio Construction with Alternatives
Figure 1: First Order Autocorrelation
First order autocorrelation. Monthly data, except for Private Equity, which is Quarterly. Time period: Jan 1990 – Dec 2017. Source: Bloomberg, Cambridge Associates.
Cambridge Associates Private Equity Index
HFRI Fund Weighted Index
S&P 500 Index ICE BofAML US Corp Index
0.37
0.04
0.18
0.30

NOT FOR RETAIL DISTRIBUTION: This communication has been prepared exclusively for institutional/wholesale/professional clients and qualified investors only as defined by local laws and regulations.October 2018
Portfolio Construction with Alternatives
4
Portfolio Construction with Alternatives
Performance Dispersion among top and bottom quartile managers. Annualized performance. Time Period: Jan 2006 – Dec 2010 for Private Equity, Jan 2013 – Dec 2017 for others. Source: Morningstar, Cambridge Associates
Figure 2: Difference Between Top and Bottom Quartile Managers
0
5
10
15
20
25
Private Equity US Hedge Funds US Large Cap Equities US Intemediate Term Fixed Income
11.6%
6.6%
1.9%
0.8%
Top Quartile
Bottom Quartile
Difference
A simple approach to include the performance dispersion risk is to assume that the risk from the index σi and the risk of performance dispersion σpd are uncorrelated, to come up with the total risk σt
σt = √(σpd2 + σi
2) (1)
σpd can be measured as the standard deviation of the cross-sectional distribution of manager returns in a particular investment style or category. However, the entire cross-sectional distribution of manager returns is not always available. σpd from the entire cross-sectional distribution may also be sometimes distorted due to a severely underperforming fund with minimal assets, which likely had no implications for external investors in general. Therefore, quantile (e.g. tercile, quartile, decile) performance numbers, which are much more easily accessible, can be used to arrive at an approximation for σpd. Assuming a normal distribution for the dispersion,
the interquartile (25th and 75th percentile) and/or the interdecile (10th and 90th percentile) ranges can be used to calculate σpd. In most cases, this approximation of the variance or standard deviation is close to the actual variance or standard deviation of the entire distribution, and, therefore, a reasonable approach to compute σpd with easily accessible data.
If we look at the dispersion for private equity, the 25th percentile performance is 19.6%, while the 75th percentile performance is 8.0%. We can assume a normal distribution for this dispersion and can derive the corresponding standard deviation or volatility.
The normal distribution is a 2-parameter family of curves. These parameters are µ, the mean, and σ, the standard deviation. For a standard normal distribution with µ=0
and σ=1, the z-score for 75th percentile is 0.6745.

NOT FOR RETAIL DISTRIBUTION: This communication has been prepared exclusively for institutional/wholesale/professional clients and qualified investors only as defined by local laws and regulations.October 2018
Portfolio Construction with Alternatives
5
For private equity, the dispersion between the 25th and the 75th percentile (25-75SP) performance is 11.6%. Assuming this dispersion is normally distributed, the z-score of the 25th percentile performance should be equal to 0.6745, as reflected in the equation below.
((25th – 75th percentile spread)/2)/ σpd
25-75SP= 0.6745 (2)
σpd
25-75SP = ((25th – 75th percentile spread)/2)/0.6745 (3)
We can also use the spread between 10th and 90th percentile (10-90SP) performance (or any other performance dispersion spread with the corresponding z-score) to measure σ
pd
σpd
10-90SP = ((10th – 90th percentile spread)/2)/1.2816 (4)
Equation (3) implies a standard deviation of 8.6% for private equity performance dispersion. Adding that,
uncorrelated, to the volatility of the index gives us a total risk of 12.8% for an investment in private equity. The volatility of the private equity index alone is only 9.6% and using just that would have underestimated the risk of severely underperforming the index. Table 2 exhibits the impact of performance dispersion risk on key asset classes. It also highlights the differences between using the actual standard deviation of the distribution relative to the standard deviation implied by 25-75SP. Though in this paper, we use σpd, it is acceptable to use σpd
25-75SP (or a combination of σpd
25-75SP and σpd10-90SP) if the outliers
inflating σpd can be avoided through a robust manager selection process with due diligence on investment process and risk management.
Portfolio Construction with Alternatives
Figure 3: Standard Normal Distribution
Table 2: Index annualized volatility adjusted for manager performance dispersion.
Asset Class Index
Volatility of Broad
Asset Class Index (σi)
Performance Dis-persion Volatility
(σpd)
Interquartile (25-75SP) Performance Dispersion Implied Volatility (σpd
25-75SP)
Volatility Adjusted for Performance
Dispersion (σt)
Volatility Adjusted for 25-75SP Implied
Performance Dispersion (σt
25-75SP)
Private EquityCambridge Associates Private Equity Index4 9.6% N/A 8.6% N/A 12.8%
Hedge Funds HFRI Fund Weighted Index 6.6% 6.9% 4.9% 9.5% 8.2%
Equities S&P 500 index 14.2% 1.8% 1.4% 14.3% 14.2%
IG Fixed IncomeICE BofAML US Corporate Index
5.1% 0.8% 0.6% 5.1% 5.1%
Time Period: Jan 1990 – Dec 2017 for indices; For dispersion: Jan 2006 - Dec 2010 for Private Equity, Jan 2013 - Dec 2017 for others. Source: Bloomberg, Morningstar, Cambridge Associates.
0.45
0
z-score
z=050thPercentile
z=0.6775thPercentile
z=1.2890thPercentile
1 2 3-1-2-3
0.4
0.35
0.3
0.25
0.2
0.15
0.1
0.05
0
Standard normal distribution based on random numbers generated in MATLAB

NOT FOR RETAIL DISTRIBUTION: This communication has been prepared exclusively for institutional/wholesale/professional clients and qualified investors only as defined by local laws and regulations.October 2018
Portfolio Construction with Alternatives
6
As expected, there is a significant impact of performance dispersion adjustment on alternative indices. On the other hand, the change in volatility for traditional asset classes, equities and fixed income, after
the performance dispersion adjustment is negligible. As a result, for traditional asset classes, it is acceptable to use broad indices to estimate the risk even if an active manager is being used.
Portfolio Construction with Alternatives
Figure 4: Adjusting Asset Class Volatility for Manager Performance Dispersion
Index annualized volatility adjusted for manager performance dispersion. Time Period: Jan 1990 – Dec 2017 for indices; For dispersion: Jan 2006 - Dec 2010 for Private Equity, Jan 2013 - Dec 2017 for others. Source: Bloomberg, Morningstar, Cambridge Associates
Private Equity Hedge Funds Equities IG Fixed Income
9.6%
12.8%
9.5%
14.3%
5.1%6.5%
14.2%
5.1%
Volatility of Broad Asset Class Index (σi)
Volatility Adjusted for Manager Dispersion (σt)
3.2 Portfolio Construction with Adjusted Risk MeasuresGoing back to the risk parity problem in Table 1, we conduct the same exercise with the three indices adjusted for performance dispersion risk. The results, in Table 3, exhibit an allocation of 26% to alternatives and 17% to equities, which is much more acceptable than the unadjusted numbers, where the allocation to alternatives was more than double the allocation to equities.
Weights
Asset Class IndexUnadjusted
Volatility (σi)
Adjusted Volatility
(σt)
Traditional Risk Parity Unadjusted
Risk Parity with Alternatives Unadjusted
Risk Parity with Alternatives Adjusted for Performance
Dispersion
Equity S&P 500 Index 14.2% 14.3% 22% 16% 17%
Investment Grade Fixed Income ICE BofAML US Corporate Index 5.1% 5.1% 78% 51% 57%
AlternativesHFRI Fund Weighted Composite Index
6.6% 9.5% 0% 33% 26%
Portfolio Volatility (unadjusted risk measures) 5.7% 5.5% 5.5%
Adjusted Portfolio Volatility (adjusted for performance dispersion) 5.8% 6.4% 6.2%
Monthly data. Time Period: Jan 1990 – Dec 2017 for indices; Jan 2013 – Dec 2017 for dispersion. Source: Bloomberg, Morningstar
Table 3: Risk parity approach on equity, fixed income and alternatives.

NOT FOR RETAIL DISTRIBUTION: This communication has been prepared exclusively for institutional/wholesale/professional clients and qualified investors only as defined by local laws and regulations.October 2018
Portfolio Construction with Alternatives
7
The results shown here can change based on the index chosen. A different broad market index or a select category within alternatives may have lower or higher performance dispersion, resulting in numbers different from above. However, regardless of the index or the portfolio construction methodology used, these adjustments are important to be incorporated in the portfolio construction process for a better estimation of risk, especially when alternatives are involved.
4. Performance Dispersion by Asset Class or Strategy TypeThe approach outlined so far is reasonable for a multi-strategy alternative allocation, with no insights on the actual allocation to specific alternative strategy types. However, the actual characteristics of the index, and the dispersion within the category, can vary materially based on the type of asset class or strategy. If an investor has already selected a subset of alternative strategies, which are suitable for his or her portfolio, we can identify better alternative indices to model the exposure. This can help us better measure the dispersion risk as well,
which could be either more or less than the aggregate all-strategy index.
4.1 Performance Dispersion for Hedge Fund StrategiesThe performance dispersion characteristics for hedge fund strategy types are based on data for the US domiciled Global Hedge Fund category from Morningstar. The corresponding alternative indices are selected from Hedge Fund Research Indices (HFRI).
For performance dispersion, we primarily use the entire distribution. However, since the quantile performance numbers are more easily available, we also show the results for volatilities implied by a combination (σ
pdSP)
of 25th-75th percentile spread (25-75SP) and 10th-90th percentiles (10-90SP).
Table 4 highlights various dispersion numbers for several key hedge fund strategy types, for which we had data available. These are based on 5-year performance numbers, which we believe is a sufficiently long time-period to achieve robust results.
Table 4: Analyzing dispersion for alternative asset classes
US Large Blend Equity
US Intermediate
Bond
HF Global Macro
HF Systematic
Futures
HF US L/S Equity
US Hedge Funds
HF Event Driven
HF Long Only
EquityHF
Distressed
HF Merger
Arbitrage
HF FoF Multi-
strategy
IndexS&P 500
ICE BofAML US
Corp
HFRI Macro Total5
HFRI Macro Systematic Diversified6
HFRI Equity Hedge7
HFRI Fund Weighted Composite
HFRI Event Driven8
S&P 500
HFRI ED/Distressed
Restructuring9
HFRI ED Merger
Arbitrage10
HFRI FoF
Composite11
Unadjusted Index Volatility (σi)
14.2% 5.1% 7.1% 7.4% 8.7% 6.6% 6.5% 14.2% 6.4% 3.8% 5.5%
Performance Dispersion Adjustment
# Observations 395 256 25 65 113 596 32 28 16 13 52
10th Percentile 16.0% 3.1% 14.6% 12.9% 17.6% 14.8% 17.0% 19.6% 13.7% 12.3% 7.8%
25th Percentile 15.5% 2.6% 7.2% 9.5% 12.1% 10.0% 10.3% 17.5% 10.7% 6.7% 6.7%
50th Percentile 14.9% 2.2% 2.4% 4.0% 8.7% 6.2% 6.3% 13.4% 7.7% 4.7% 4.5%
75th Percentile 13.7% 1.9% -0.2% 0.6% 4.0% 3.4% 4.1% 10.8% 6.8% 3.9% 3.6%
90th Percentile 12.1% 1.4% -3.3% -2.1% 1.2% 0.7% 2.6% 8.4% 1.6% 3.0% 2.9%
25-75SP 1.9% 0.8% 7.4% 8.9% 8.1% 6.6% 6.1% 6.7% 3.8% 2.8% 3.1%
10-90SP 3.9% 1.7% 17.9% 14.9% 16.4% 14.1% 14.4% 11.2% 12.0% 9.2% 5.0%
25-75SP Volatility (σpd
25-75SP)1.4% 0.6% 5.5% 6.6% 6.0% 4.9% 4.5% 4.9% 2.9% 2.1% 2.3%
10-90SP Volatility (σpd
10-90SP)1.5% 0.7% 7.0% 5.8% 6.4% 5.5% 5.6% 4.4% 4.7% 3.6% 1.9%
Average Spread Implied Performance Disp Volatility (σpd
SP)1.5% 0.6% 6.2% 6.2% 6.2% 5.2% 5.1% 4.6% 3.8% 2.8% 2.1%
Performance Dispersion Volatility (σpd)
1.8% 0.8% 9.5% 8.5% 7.5% 6.9% 6.5% 4.7% 4.5% 4.3% 2.5%
Total Risk (σt=sqrt(σi
2+σpd2))
14.3% 5.1% 11.9% 11.2% 11.5% 9.5% 9.2% 15.0% 7.8% 5.8% 6.0%
Time period: Jan 1990 - Dec 2017 for indices. Jan 2013 - Dec 2017 for dispersion. Source: Bloomberg, Morningstar.

NOT FOR RETAIL DISTRIBUTION: This communication has been prepared exclusively for institutional/wholesale/professional clients and qualified investors only as defined by local laws and regulations.October 2018
Portfolio Construction with Alternatives
8
The order of strategies sorted by σpd
and σpd
SP is exactly the same. The differences between the two, much more significant in alternatives, arise from the outliers. Global Macro stands out in this respect due to its “go anywhere” kind of mandate. We believe it is fair to use σ
pdSP if the investor employs a rigorous manager
selection process with due diligence on investment process and risk management.
As expected, strategies like Global Macro or Systematic Futures, which can take dynamic directional bets on asset classes and which also utilize significant leverage, exhibit a high level of volatility associated with performance dispersion. Long-Short Equity hedge funds also show high dispersion where the net beta to the equity market can vary significantly among peers, which could be a significant driver of divergence in returns. This is in addition to idiosyncratic risk coming from concentrated positions in single names, which is usually not the case with equity mutual funds. On the other hand, strategies like Merger Arbitrage have a well-defined universe in which most of the managers play. Passive solutions also exist in this space. As a result, the dispersion here is on the lower side of the spectrum.
4.2 Performance Dispersion for Private Assets
The impact of adjusting for performance dispersion becomes even more important for private asset classes. In Table 5, we use index returns and performance dispersion data from Cambridge Associates for private equity (Cambridge Associates Private Equity Index), venture capital (Cambridge Associates LLC US Venture Capital Index12) & real estate (Cambridge Associates LLC Real Estate Index13). The dispersion data is based on upper and bottom quartile performance of funds with vintage years between 2006 and 2010. According to Cambridge Associates, it takes almost 6 years for most funds to settle into its final quartile ranking. Therefore, we do not use the data, which was available, for funds with vintage years between 2011 and 2016.
As we can see in Table 5, the performance dispersion is much higher for the private or real asset classes, ranging from 8.2% for real estate to 11.2% for venture capital. Therefore, it is essential to adjust real assets for the performance dispersion risk when combining them with traditional asset classes. In the absence of data on the full distribution, here we have only used σ
pd25-75SP. The full
distribution can be analyzed to gain further insights in the dispersion of manger returns for private assets.
Table 5: Analyzing dispersion for private assets.
Private Equity Venture Capital Real Estate
Index
Cambridge Associates LLC
US Private Equity Index
Cambridge As-sociates LLC US Venture Capital
Index
Cambridge Associates LLC
Real Estate Index
Unadjusted Index Volatility (σi)
9.6% 22.1% 8.8%
Performance Dispersion Adjustment
25th Percentile 19.6% 18.9% 14.4%
50th Percentile 13.8% 10.4% 8.8%
75th Percentile 8.0% 3.8% 3.3%
25-75SP 11.6% 15.1% 11.1%
25-75SP Performance Dispersion Volatility (σpd
25-75SP)8.6% 11.2% 8.2%
Total Risk (σt) 12.8% 24.8% 12.1%
Time Period: Jan 1990 – Dec 2017 for indices; 2006 – 2010 for dispersion. Source: Cambridge Associates.
The performance dispersion is the highest for private or real asset classes.

NOT FOR RETAIL DISTRIBUTION: This communication has been prepared exclusively for institutional/wholesale/professional clients and qualified investors only as defined by local laws and regulations.October 2018
Portfolio Construction with Alternatives
9
4.3 Summary of Adjustments for Performance Dispersion by Asset Class
Based on the data in the previous sections, we can summarize the data and conclusions in the table below.
Table 6: Adjustments for Performance Dispersion by Asset Class
5. Managing Performance Dispersion Risk
So far, we have explored ways to accurately measure the performance dispersion risk for key alternative strategy types. However, some strategy types can reduce this risk for a broad multi-strategy alternative allocation:
a) Passive alternative strategies
b) Replication strategies
5.1 Passive Alternative Strategies
Though not always possible, some alternative strategies can be run in a passive format. Merger arbitrage is a good example of this. Just as there are a limited set of equity securities in a region that can be held in a passive equity index, there are a limited set of merger and acquisition deals outstanding that could be used as the investable universe. Similar to a passive equity strategy, the implementation can include equal weight schemes or weighting based on market cap or deal size. Passive strategies through ETFs or other vehicles already exist in this space.
5.2 Replication Strategies
Another way to reduce the performance dispersion risk is to use replication strategies that try to mimic a broader index of pooled returns. This is accomplished by using quantitative tools to decompose the index into more traditional investable risk factors or securities, and then investing in those risk factors or securities. According to the work from Gupta, Szado and Spurgin (2008), replication products usually follow one of the three approaches: security-based replication, factor-based replication or distribution-based replication. Based on the dynamicity of the underlying strategies, an optimal rebalancing frequency should be chosen to identify and capture the exposures. Rebalancing too often can result in unnecessary transaction costs and rebalancing too infrequently may result in high tracking error to the benchmark index. Just like passive strategies, many replication strategies are also already available through ETFs, separate accounts, open-ended funds etc.
Asset ClassAdjusting for Performance
Dispersion Risk
Publicly Traded Equities or Fixed Income
Not Needed
Alternatives / Hedge Fund Strategies
Important Performance Dispersion volatility usually ranges
between 2% and 10%. In the absence of specific details, the measure of 6.9% for the Global hedge
Fund category can be used
Private Assets
Very Important Performance Dispersion volatility usually ranges
between 8% and 12%. In the absence of specific details, the measure of 8.6% for the Private Equity
category can be used

NOT FOR RETAIL DISTRIBUTION: This communication has been prepared exclusively for institutional/wholesale/professional clients and qualified investors only as defined by local laws and regulations.October 2018
Portfolio Construction with Alternatives
10
Figure 5: 5 Year Return Distribution of US MultiAlternatives
Return distribution of US MultiAlternative Category and performance percentiles of replication strategies. Time Period: Jan 2013 – Dec 2017. Source: Morningstar
QAI CSQIXGJRTX
HDG
0.25
0.2
0.15
0.1
0.05
0-4 -2 0 2 4 6 8 10 12 14
50thPercentile
6. Conclusion
Alternatives are becoming more critical as return expectations fall for traditional asset classes. However, since these have not typically been a part of their portfolio, investors are grappling with the question of the right allocation. Due to their unique properties, classical risk measurement techniques fail to capture some risks that should be incorporated. Performance dispersion risk and smoothness of returns are two key risks that are common for alternatives and should be reflected in the portfolio construction process. Much research corrects for illiquidity or smoothness in returns. However, the performance dispersion risk has remained unaddressed so far.
Performance dispersion risk can be measured by using long term cross-sectional return distribution. The entire cross-sectional distribution can be used to calculate the standard deviation, but interquartile
or interdecile range can also be utilized, which is a simpler approach with easily accessible data. This should be added (uncorrelated) to the volatility of the broader asset class index. Performance dispersion risk may be important for traditional asset classes as well if the implementation is accomplished through active managers with high tracking error or active share. With passive solutions gaining traction, active managers, striving to differentiate themselves from the much cheaper passive solutions, are increasingly taking significant active risks in their portfolios. With more data, further research is possible on checking the stability of the cross-sectional distribution of performance data for various traditional and alternative asset classes. The dispersion data can also be analyzed and adjusted for potential survivorship bias in the selected fund categories.
In Figure 5, we can see the distribution of returns for the US Liquid (Open Ended Funds & ETFs) Multialternative category. The replication strategies in this universe, Goldman Sachs Absolute Ret Trckr Instl (GJRTX), Credit Suisse Multialternative Strat I (CSQIX), ProShares Hedge Replication (HDG) & IQ Hedge Multi-Strategy Tracker ETF (QAI) are close to the median, which is less likely to be the case with a randomly selected manager in the same universe.
Returns represent past performance which is no guarantee of future results. Current performance may be lower or higher. Investment return and principal value will fluctuate, and shares, when redeemed, may be worth more or less than their original cost. Visit nylinvestments.com/etfs for the most recent month-end performance.

NOT FOR RETAIL DISTRIBUTION: This communication has been prepared exclusively for institutional/wholesale/professional clients and qualified investors only as defined by local laws and regulations.October 2018
Portfolio Construction with Alternatives
11
ReferencesGeorges Gallais-Hamonno, Huyen Nguyen-Thi-Thanh. The necessity to correct hedge fund returns:empirical evidence and correction method. 2007
Getmansky, M., Andrew W. Lo and Igor Makarov, 2004, “An Econometric Model of SerialCorrelation and Illiquidity in Hedge Fund Returns” Journal of Financial Economics, 74 (3), pp.529-610
Gupta, Raj and Szado, Edward and Spurgin, William, Performance Characteristics of Hedge Fund Replication Programs (September 1, 2008). Available at SSRN: https://ssrn.com/abstract=1524293 or http://dx.doi.org/10.2139/ssrn.1524293
Index performance is for illustrative purposes only and does not represent actual Fund performance. One cannot invest directly in an index. Performance data for the Index assumes reinvestment of dividends and is net of the management fees for the Index’s components, as applicable, but it does not reflect management fees, transaction costs or other expenses that you would pay if you invested in the Fund directly. No representation is being made that any investment will achieve performance similar to that shown. An investment cannot be made in an index.
List of Indices used:1. S&P 500 Index: The Standard & Poor’s 500 is an American stock market index based on the market capitalizations of 500 large companies having common stock listed on the NYSE or NASDAQ.
2. ICE BofAML US Corporate Index: The ICE BofAML US Corporate Index tracks the performance of US dollar denominated investment grade corporate debt publicly issued in the US domestic market.
3. HFRI Fund Weighted Composite Index: The HFRI Fund Weighted Composite Index is a global, equal-weighted index of over 1,400 single-manager funds that report to HFR Database. Constituent funds report monthly net of all fees performance in US Dollar and have a minimum of $50 Million under management or a twelve (12) month track record of active performance. The HFRI Fund Weighted Composite Index does not include Funds of Hedge Funds.
4. Cambridge Associates Private Equity Index: The Cambridge Associates LLC US Private Equity Index® is a horizon calculation based on data compiled from 1,455 US private equity funds (buyout, growth equity, private equity energy and subordinated capital funds), including fully liquidated partnerships, formed between 1986 and 2017.
5. HFRI Macro Total: Macro: Investment Managers which trade a broad range of strategies in which the investment process is predicated on movements in underlying economic variables and the impact these have on equity, fixed income, hard currency and commodity markets. Managers employ a variety of techniques, both discretionary and systematic analysis, combinations of top down and bottom up theses, quantitative and fundamental approaches and long and
short term holding periods.
6. HFRI Macro Systematic Diversified: Systematic: Diversified strategies have investment processes typically as function of mathematical, algorithmic and technical models, with little or no influence of individuals over the portfolio positioning. Strategies which employ an investment process designed to identify opportunities in markets exhibiting trending or momentum characteristics across individual instruments or asset classes.
7. HFRI Equity Hedge: Equity Hedge: Investment Managers who maintain positions both long and short in primarily equity and equity derivative securities.
8. HFRI Event Driven: Event-Driven: Investment Managers who maintain positions in companies currently or prospectively involved in corporate transactions of a wide variety including but not limited to mergers, restructurings, financial distress, tender offers, shareholder buybacks, debt exchanges, security issuance or other capital structure adjustments. Security types can range from most senior in the capital structure to most junior or subordinated, and frequently involve additional derivative securities.

NOT FOR RETAIL DISTRIBUTION: This communication has been prepared exclusively for institutional/wholesale/professional clients and qualified investors only as defined by local laws and regulations.October 2018
Portfolio Construction with Alternatives
12
9. HFRI ED/Distressed Restructuring: Distressed/Restructuring strategies which employ an investment process focused on corporate fixed income instruments, primarily on corporate credit instruments of companies trading at significant discounts to their value at issuance or obliged (par value) at maturity as a result of either formal bankruptcy proceeding or financial market perception of near term proceedings. Managers are typically actively involved with the management of these companies, frequently involved on creditors’ committees in negotiating the exchange of securities for alternative obligations, either swaps of debt, equity or hybrid securities.
10. HFRI ED Merger Arbitrage: Merger Arbitrage strategies which employ an investment process primarily focused on opportunities in equity and equity related instruments of companies which are currently engaged in a corporate transaction. Merger Arbitrage involves primarily announced transactions, typically with limited or no exposure to situations which pre-, post-date or situations in which no formal announcement is expected to occur.
11. HFRI FoF Composite: Fund of Funds invest with multiple managers through funds or managed accounts. The strategy designs a diversified portfolio of managers with the objective of significantly lowering the risk (volatility) of investing with an individual manager. The Fund of Funds manager has discretion in choosing which strategies to invest in for the portfolio. A manager may allocate funds to numerous managers within a single strategy, or with numerous managers in multiple strategies.
12. Cambridge Associates LLC US Venture Capital Index: The Cambridge Associates LLC US Venture Capital Index® is a horizon calculation based on data compiled from 1,806 US venture capital funds (1,158 early stage, 211 late & expansion stage, and 437 multi-stage funds), including fully liquidated partnerships, formed between 1981 and 2018.
13. Cambridge Associates LLC Real Estate Index: The index is a horizon calculation based on data compiled from 1,001 real estate funds (including opportunistic and value-added real estate funds), including fully liquidated partnerships, formed between 1986 and 2017.
Definitions
14. Active Management refers to a portfolio management strategy where the manager makes specific investments with the goal of outperforming an investment benchmark index or target return.
15. Standard deviation measures how widely dispersed a fund’s returns have been over a specified period of time. A high standard deviation indicates that the range is wide, implying greater potential for volatility.
16. Active Share is is a measure of the percentage of stock holdings in a manager’s portfolio that differs from the benchmark index.
17. t-statistic is the ratio of the departure of the estimated value of a parameter from its hypothesized value to its standard error.
The information and opinions contained herein are for general information use only. New York Life Investments does not guarantee their accuracy or completeness, nor does New York Life Investments assume any liability for any loss that may result from the reliance by any person upon any such information or opinions. Such information and opinions are subject to change without notice, and are not intended as an offer or solicitation with respect to the purchase or sale of any security or as personalized investment advice. There can be no guarantee that any projection, forecast, or opinion in these materials will be realized. Past performance is no guarantee of future results.

NOT FOR RETAIL DISTRIBUTION: This communication has been prepared exclusively for institutional/wholesale/professional clients and qualified investors only as defined by local laws and regulations.October 2018
Portfolio Construction with Alternatives
13
About risk
All investments are subject to market risk, including possible loss of principal. Diversification cannot assure a profit or protect against a loss in a declining market.
High yield securities (junk bonds) have speculative characteristics and present a greater risk of loss than higher quality debt securities. These securities can also be subject to greater price volatility.
Funds that invest in bonds are subject to interest rate risk and can lose principal value when interest rates rise. Bonds are also subject to credit risk which is the possibility that the bond issuer may fail to pay interest and principal in a timely manner.
Liquidity risk is the risk that certain securities may be difficult or impossible to sell at the time that the seller would like or at the price that the seller believes the security is currently worth.
There are risks involved with investing in any such products, including the possible loss of principal. Investors in the Funds should be willing to accept a high degree of volatility and the possibility of significant losses.
Alternative investments are speculative, entail substantial risk and are not suitable for all clients. Alternative investments are intended for experienced and sophisticated investors who are willing to bear the high economic risks of the investment. Investments in absolute-return strategies are not intended to outperform stocks and bonds during strong market rallies. Hedge funds and hedge fund of funds can be highly volatile, carry substantial fees, and involve complex tax structures. Investments in these types of funds involve a high degree of risk, including loss of entire capital. Investments in derivatives often involve leverage, which may increase the volatility of the investment and may result in a loss.
As with all investments, there are certain risks of investing in the Fund. The Fund’s Shares will change in value and you could lose money by investing in the Fund. An investment in the Fund does not represent a complete investment program.
The Multi-Asset Solutions Group of New York Life Investment Management, LLC oversees the day-to-day portfolio management services for the Funds.

NOT FOR RETAIL DISTRIBUTION: This communication has been prepared exclusively for institutional/wholesale/professional clients and qualified investors only as defined by local laws and regulations.
Not FDIC/NCUA Insured Not a Deposit May Lose Value No Bank Guarantee Not Insured by Any Government Agency
New York Life Investments is a service mark and name under which New York Life Investment Management LLC does business. New York Life Investments, an indirect subsidiary of New York Life Insurance Company, located at 51 Madison Avenue, New York, New York 10010, provides investment advisory products and services. IndexIQ® is an indirect wholly owned subsidiary of New York Life Investment Management Holdings LLC and serves as the advisor to the IndexIQ ETFs. ALPS Distributors, Inc. (ALPS) is the principal underwriter of the ETFs. NYLIFE Distributors LLC is a distributor of the ETFs. NYLIFE Distributors LLC is located at 30 Hudson Street, Jersey City, NJ 07302. ALPS Distributors, Inc. is not affiliated with NYLIFE Distributors LLC. NYLIFE Distributors LLC is a Member FINRA/SIPC.
1790918 IIB046-18 IIB38J-09/18
Consider the Funds’ investment objectives, risks, charges and expenses carefully before investing. The prospectus and the statement of additional information include this and other relevant information about the Funds and are available by visiting IQetfs.com or calling (888) 474-7725. Read the prospectus carefully before investing.
For more information 800-624-6782 nylinvestments.com/funds
October 2018