optimal portfolio construction: a case in bursa … portfolio construction ; a... · optimal...
TRANSCRIPT
OPTIMAL PORTFOLIO CONSTRUCTION:
A CASE IN BURSA MALAYSIA
Chin Mei Han
Bachelor of Finance (Honours)
2015
OPTIMAL PORTFOLIO CONSTRUCTION: A CASE IN BURSA MALAYSIA
CHIN MEI HAN
The project is submitted in partial fulfillment of the requirements for the
degree of Bachelor of Finance with Honours
Faculty of Economics and Business
UNIVERSITI MALAYSIA SARAWAK
2015
UNIVERSITI MALAYSIA SARAWAK
Grade: _____________
Please tick ()
Final Year Project Report
Masters
PhD
DECLARATION OF ORIGINAL WORK
This declaration is made on the ……………..day of……………..2015.
Student’s Declaration:
I ----------------------------------------------------------------------------------------------------------------------------------------
(PLEASE INDICATE STUDENT’S NAME, MATRIC NO. AND FACULTY) hereby declare that the
work entitled ------------------------------------------------------------------------------------------------- is my original
work. I have not copied from any other students’ work or from any other sources except where due
reference or acknowledgement is made explicitly in the text, nor has any part been written for me by
another person.
____________________ ________________________
Date submitted Name of the student (Matric No.)
Supervisor’s Declaration:
I-------------------------------------------------------------- (SUPERVISOR’S NAME) hereby certifies that the
work entitled ----------------------------------------------------------------------------(TITLE) was prepared by the
above named student, and was submitted to the “FACULTY” as a * partial/full fulfillment for the
conferment of ------------------------------------------------------------------------- (PLEASE INDICATE THE
DEGREE), and the aforementioned work, to the best of my knowledge, is the said student’s work.
Received for examination by: _____________________ Date:____________________
(Name of the supervisor)
I declare that Project/Thesis is classified as (Please tick (√)):
CONFIDENTIAL (Contains confidential information under the Official Secret Act 1972)*
RESTRICTED (Contains restricted information as specified by the organisation where
research was done)*
OPEN ACCESS
Validation of Project/Thesis
I therefore duly affirm with free consent and willingly declare that this said Project/Thesis shall be
placed officially in the Centre for Academic Information Services with the abiding interest and rights
as follows:
This Project/Thesis is the sole legal property of Universiti Malaysia Sarawak (UNIMAS).
The Centre for Academic Information Services has the lawful right to make copies for the
purpose of academic and research only and not for other purpose.
The Centre for Academic Information Services has the lawful right to digitalise the
content for the Local Content Database.
The Centre for Academic Information Services has the lawful right to make copies of the
Project/Thesis for academic exchange between Higher Learning Institute.
No dispute or any claim shall arise from the student itself neither third party on this
Project/Thesis once it becomes the sole property of UNIMAS.
This Project/Thesis or any material, data and information related to it shall not be
distributed, published or disclosed to any party by the student except with UNIMAS
permission.
Student signature ________________________ Supervisor signature: ________________
(Date) (Date)
Current Address:
_____________________________________________________________________________________________
_____________________________________________________________________________________________
Notes: * If the Project/Thesis is CONFIDENTIAL or RESTRICTED, please attach together as
annexure a letter from the organisation with the period and reasons of confidentiality and
restriction.
[The instrument is duly prepared by The Centre for Academic Information Services]
Statement of Originality
The work described in this Final Year Project, entitled
“Optimum Portfolio Construction: A case in Bursa Malaysia”
is the best of the author’s knowledge that of the author except
where due reference is made.
(Date submitted) Chin Mei Han
35734
ABSTRACT
OPTIMAL PORTFOLIO CONSTRUCTION:
A CASE IN BURSA MALAYSIA
By
Chin Mei Han
This study investigates the adoption of portfolio construction in Malaysia stock
market by using financial ratios such as economic value added (EVA), price earnings
ratio (PER), book-to-market ratio (BM), size or market capitalization (MC) and
dividend yield (DIV) from the year of 2009-2014. The aim of this study is to
identify the optimum portfolio construction that generates maximum revenue for
investors. Only 100 listed companies in Bursa Malaysia are being selected in
constructing the portfolios - ATOP, BBOT, and CMID. The results of mean equality test
derived are mostly insignificant results yet there is positive excess return (0.39%)
found in portfolio with low performing DIV companies. The findings of this study
also revealed that portfolio constructions which employ financial ratios are suitable
for 2-3 years holding period investment. Most of the constructed portfolio show
drastic drop of return after three years of holding period. Among the five portfolios,
this paper suggests the best choice of portfolio construction for short term
investment is to construct portfolio using DIV or MC.
ABSTRAK
PEMBINAAN PORTFOLIO OPTIMUM: KES DI BURSA MALAYSIA
Oleh
Chin Mei Han
Kajian ini mengkaji pembentukan portfolio optimum dalam pasaran saham
Malaysia dengan menggunakan nisbah kewangan seperti nilai tambah ekonomi
(EVA), nisbah harga pendapataan (PER), nisbah buku ke pasaran (BM), saiz atau
permodalan pasaran (MC) dan hasil dividen (DIV) dari tahun 2009-2014. Hanya
100 syarikat yang tersenarai di Bursa Malaysia dipilih untuk tujuan pembinaan
portfolio tersebut dan dibahagikan kepada tiga kumpulan portfolio iaitu – tertinggi
(ATOP), terendah(BBOT), and pertengahan (CMID). Keputusan ujian kesetaraan min
(mean equality test) yang diperolehi menunjukkan bahawa kebanyakan portfolio
yang dibina adalah tidak signifikan. Akan tetapi, portfolio yang merangkumi syarikat
berprestasi DIV rendah menunjukkan pulangan yang positif (0.39%). Hasil kajian ini
menunjukkan bahawa pembinaan portfolio menggunakan nisbah kewangan adalah
sesuai untuk tempoh pegangan selama 2 -3 tahun sebagai strategi pelaburan pilihan
pelabur. Antara lima portfolio yang dibina, pembentukan portfolio menggunakan
DIV atau MC amat sesuai bagi pelaburan jangka pendek.

ACKNOWLEDGEMENTS
Special thanks and deepest gratitude which I want to dedicate to my supervisor,
Mr. Bakri Abdul Karim who provide insights that enable me to complete this research
through one year. With his guidance, I feel the hope in getting through all kinds of
obstacles that I faced in this research particularly after several discussion sessions with
him.
To my best friend, Lee Wei Ping for your help has been invaluable to me. Your
support and guidance in the process of data collection using Datastream allows my
research to progress smoothly.
Also, I would like to thank my family especially my beloved parents, Chin Kok
Kiong and Chen Yun Yong for your understanding, love, and support throughout my
undergraduate studies in UNIMAS.
vii
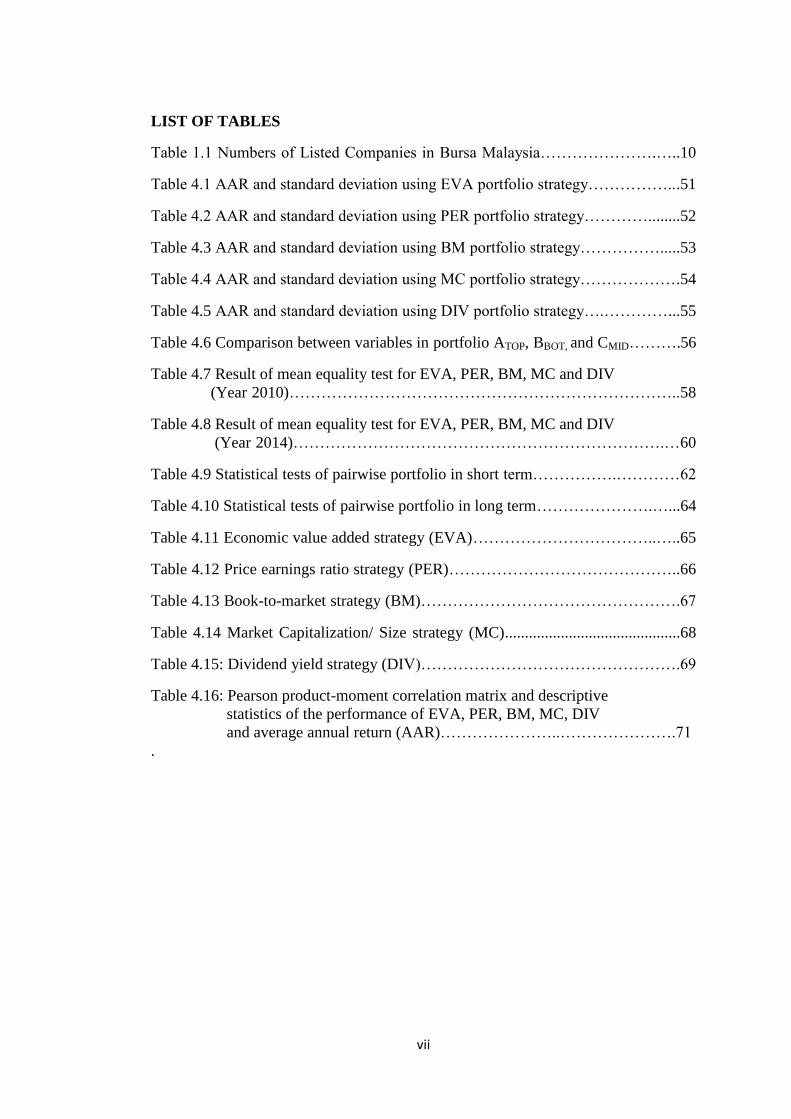
LIST OF TABLES
Table 1.1 Numbers of Listed Companies in Bursa Malaysia………………….…..10
Table 4.1 AAR and standard deviation using EVA portfolio strategy……………...51
Table 4.2 AAR and standard deviation using PER portfolio strategy…………........52
Table 4.3 AAR and standard deviation using BM portfolio strategy…………….....53
Table 4.4 AAR and standard deviation using MC portfolio strategy……………….54
Table 4.5 AAR and standard deviation using DIV portfolio strategy….…………...55
Table 4.6 Comparison between variables in portfolio ATOP, BBOT, and CMID……….56
Table 4.7 Result of mean equality test for EVA, PER, BM, MC and DIV
(Year 2010)………………………………………………………………..58
Table 4.8 Result of mean equality test for EVA, PER, BM, MC and DIV
(Year 2014)…………………………………………………………….…60
Table 4.9 Statistical tests of pairwise portfolio in short term…………….…………62
Table 4.10 Statistical tests of pairwise portfolio in long term………………….…...64
Table 4.11 Economic value added strategy (EVA)……………………………..…..65
Table 4.12 Price earnings ratio strategy (PER)……………………………………..66
Table 4.13 Book-to-market strategy (BM)………………………………………….67
Table 4.14 Market Capitalization/ Size strategy (MC)............................................68
Table 4.15: Dividend yield strategy (DIV)………………………………………….69
Table 4.16: Pearson product-moment correlation matrix and descriptive
statistics of the performance of EVA, PER, BM, MC, DIV
and average annual return (AAR)…………………..………………….71
.

viii
LIST OF FIGURES
Figure 1 The structure of Main Market and Ace Market of Bursa Malaysia………...9
Figure 2 Conceptual Framework of Study…………………………….……34
Figure 3 The composition of 100 stocks based on sector distribution……….……..50
1
TABLE OF CONTENTS
LIST OF TABLE…………………………………………………...………………vii
LIST OF FIGURES………………………………………………………….……..viii
CHAPTER ONE: INTRODUCTION
1.0 Introduction ............................................................................................................ 4
1.1.1 The Evolution of Portfolio Selection .................................................................. 4
1.2 Background of study .............................................................................................. 6
1.2.1 Efficient Market Hypothesis (EMH) ................................................................... 6
1.2.2 Portfolio .............................................................................................................. 7
1.2.3 Malaysian stock market: Bursa Malaysia ........................................................... 8
1.3 Motivation of Study ............................................................................................. 10
1.3.1 Problem Statement ............................................................................................ 10
1.4 Objectives of Study .............................................................................................. 13
1.4.1 General Objective.............................................................................................. 13
1.4.2 Specific Objectives............................................................................................ 13
1.5 Significance of Study ........................................................................................... 14
1.6 Scope of Study ..................................................................................................... 14
1.7 Organization of Study .......................................................................................... 15
CHAPTER TWO: LITERATURE REVIEW
2.1 Introduction .......................................................................................................... 16
2.2 Modern Portfolio Theory (MPT) ......................................................................... 16
2.3 Portfolio Construction in Malaysia ...................................................................... 17
2.4 Related Reviews on Economic Value Added (EVA) .......................................... 21
2.5 Related Reviews on Book to market ratio............................................................ 24
2.6 Related Reviews on Size and Price Earnings Ratio (PER) .................................. 25
2.7 Related Reviews on Dividend Yield .................................................................... 29
2.8 Related Reviews on Length of Formation Period ................................................ 31
2.9 Concluding Remark ............................................................................................. 33
2
CHAPTER THREE: METHODOLOGY
3.1 Introduction .......................................................................................................... 34
3.2 Conceptual Framework ........................................................................................ 34
3.3 Sampling Process ................................................................................................. 35
3.4 Source of Data ...................................................................................................... 35
3.4.1 Dependent variable............................................................................................ 35
3.4.1.1 Stock return .................................................................................................... 35
3.4.1.2 Holding period return ..................................................................................... 36
3.4.2 Independent variable ......................................................................................... 36
3.4.2.1 Economic Value-Added (EVA) ..................................................................... 36
3.4.2.2 Book-to-market ratio (BMR) ......................................................................... 38
3.4.2.3 Price earnings ratio (PER) .............................................................................. 39
3.4.2.4 Size ................................................................................................................. 40
3.4.2.5 Dividend yield ................................................................................................ 40
3.5 Portfolio construction ........................................................................................... 40
3.6 Empirical testing .................................................................................................. 43
3.6.1 Mean Equality Test: Parametric test ................................................................. 43
3.6.2 Pearson product-moment correlation ................................................................ 45
3.6.3 Levene’s test...................................................................................................... 46
3.6.4 Risk adjusted measures: Sharpe ratio and Treynor ratio ................................... 46
3.7 Concluding Remarks ............................................................................................ 48
CHAPTER FOUR: FINDINGS AND DISCUSSION
4.1 Introduction .......................................................................................................... 49
4.2 Performance of Portfolio Return and Risk ........................................................... 51
4.3 Mean Equality Test: Combination of HL, MH, and ML ..................................... 58
4.4 Comparative statistics of pairwise portfolio: Short term and long term .............. 61
4.4 Portfolio construction strategies ........................................................................... 64
4.5 Descriptive Statistics and Correlation Matrix ...................................................... 71
4.6 Discussion ............................................................................................................ 73
3
CHAPTER FIVE: CONCLUSION AND RECOMMENDATION
5.1 Introduction .......................................................................................................... 77
5.2 Summary of Findings ........................................................................................... 77
5.3 Strategy Implications ........................................................................................... 80
5.4 Recommendation for Future Research ................................................................. 81
5.5 Limitations of Study ............................................................................................. 83
References ................................................................................................................. 84
4
CHAPTER ONE
INTRODUCTION
1.0 Introduction
1.1.1 The Evolution of Portfolio Selection
Whether or not you agree, the primary intention to involve in investment is to
create wealth. Among all types of investments available in market, acquisition of
stock is the most preferred by investors in expanding their wealth. Dilemmas of an
individual in making investment decisions concern on how to select and construct an
optimum portfolio as well as diversify risk. It is a natural psychology that investors
would mainly focus on the basic investment concept where high risk associated with
high expected returns. In short, “high risk, high return”.
Portfolio construction is the best method in diversifying the risk tolerance of
an investor. Innovatively, investors use the combination of classes of assets or
selections based on their preference of investment strategies in achieving the
optimum result. Markowitz (1952) was the first who contributed to portfolio theory
called “The Portfolio Selection” which emphasized on the diversification
mechanisms of risk and the expected returns to whom investors are concerned of.
Anticipated risk ˗ it is sometimes best known as expected risk ˗ for a given expected
return can be potentially reduced through diverse portfolio (Hirschey, 2001).
De Bondt and Thaler (1985) studied on the behavior of stock where violation
of Bayes’ rule existed if investors overreacted towards the surprise news. Yu-Nan
(2014) conducted both strategies of contrarian and momentum in Taiwan, Hong
5
Kong and Singapore. The purchasing of the bad performance stocks in the past and
selling of good performance stocks in the past are being entitled as the contrarian
strategy. In contrast, momentum strategy is the purchase of good stocks and sale of
bad stocks. Bajkowski (1998) mentioned that O’Higgins introduced the Dogs of
Dow “DOD” (dividend yield based strategy) which was more likely a buy-hold-
strategy. In addition, it exhibits whether or not the portfolio beats the market. There
were numbers of studies conducted by researchers specifically on DOD strategy
expressed that it was often outperforming the market which consistent to the market
overreaction hypothesis. Yet, in the study of Bhabra and Bruce (2006) displayed the
disappointed results. They articulated that a high yield firm with the poor price
movement could distress the result. O’Higgins discovered a new value investing
strategy called MOAR- Michael O’ Higgins Absolute Return (Hallam, 2012).
MOAR strategy worked and generated 8.6 % of gain in 2011 with a portfolio
comprised of world Dogs, gold or platinum, long-term government bonds, and
intermediate term government bonds. The weightage of the portfolio was subjected
to changes based on the current situation of the market.
Every investor needs to make decision and select the best stock-picking
strategies as the traditional saying goes, “Don’t put all eggs into one basket”.
Investors can shape their desired portfolio by shopping for types of stocks in
accordance to their financial ratios. For instance, Basu (1977) explored the price
earnings ratio (PER) criteria with the performance of expected returns and found out
that low PER tend to generate more returns as compared to high PER ratio. On the
other hand, Sareewiwatthana (2014) and Estrada (2005) further examined on hybrid
PER; PERG ratio (PE ratio being adjusted with growth and risk) in relation with the
6
expected return. To be concerned, this research is to explore more on financial ratios
which can act as the portfolio strategies and further investigate the relationship with
each of the portfolio returns.
1.2 Background of study
1.2.1 Efficient Market Hypothesis (EMH)
Mayo (2011) and Reilly and Norton (2006) specified three similar
assumptions of EMH which indicates the efficient capital market: a huge number of
competitive investors, the availability of new random information in market, and
costless transaction in trading securities. Rapid adjustments of security prices fully
reflect the effect of new information released. In opposition to the previous statement,
Malkiel (2003) introduced the random walk hypothesis theory which tells us that the
unexpected pattern of subsequent price changes must be in random along with the
newly released information. Arguments are made that even if investors are irrational;
presence of valuation error; greater volatility of stock prices, the markets can still be
efficient.
Strong disagreement by Fama (1998) towards casting off the efficiency even
though many researches proposed that inefficiency of market exists in the returns of
long-run. In the events of efficient market, the availability of information which
causes overreaction of prices and there was similar frequency of under-reaction and
overreaction to occur. Large anomalies of long-term return are mostly attributed by
chance. It disappeared when different measures and application of models and
statistical approach are being applied. Fama (1970) categorized form tests regarding
7
the efficient market hypothesis into three: weak form test, semi-strong form test and
strong form test. The center of attention in the study of Bursa Malaysia was the
evidences of weak form test. Fama (1970) mentioned that weak form tests vis-à-vis
to the behavior of past return or prices. However, there could be possibility that our
Malaysian stock market was not behaving as such.
1.2.2 Portfolio
Portfolio is the asset holdings of investors with the combination of certain
proportion of financial assets such as stocks, bonds, cash equivalents and many other
instruments which constructed by themselves or managed by the financial
professionals. The combination of financial assets into a portfolio is formed in
accordance to investor’s financial goals and risk tolerance.
Behaviour of an investor indicates the level of risk tolerance that one can
bear with their own level of risk appetite that eventually motivates them to invest
into specific type of investments. To illustrate, willingness of risk averse investors to
take risk happened only when the return of investment able to compensate the risk
that they took. Jones (1994) defined that risk was being shown when expected return
deviated from the actual return of an investment.
Determinants of the well-diversified portfolios need to be taken into account
as part of the process in portfolio construction. An investor must decide on how to
construct portfolio based on the elements such as number of securities (N), numbers
of types of assets classes included, weights of each securities, portfolio style,
8
portfolio strategy or any combinations to be employed to reduce riskiness of the
portfolio.
Apart from that, the return from the invested portfolio is the main concern by
most of investor. Therefore, evaluation of portfolio performance provides the
incorporated return and risk embedded in the calculation of performance measures
such as Sharpe ratio and Treynor ratio. The highest value of ratios among the
portfolios constructed implies the best performing portfolio.
1.2.3 Malaysian stock market: Bursa Malaysia
History of Bursa Malaysia began in 1930 where Singapore Stockbroker’s
Association was Malaysia’s initially formed securities business organization. It was
then re-registered in the year of 1937 as Malayan Stockbrokers’ Association. Public
shares trading began when Malayan Stock Exchange was being established in 1960.
After the event of separation of Singapore from Malaysia in 1965, the well-known
Stock Exchange of Malaysia transformed into Stock Exchange of Malaysia and
Singapore. They were then further separated into Kuala Lumpur Stock Exchange
Berhad and Stock Exchange of Singapore. Since 14th
April 2004, the name of Kuala
Lumpur Stock Exchange Berhad newly labelled as Bursa Malaysia and listed on the
Main Board of Bursa Malaysia Securities Berhad. On 3rd
August 2009, new board
structure was being implemented by separating the market into Main Market and
Ace market.
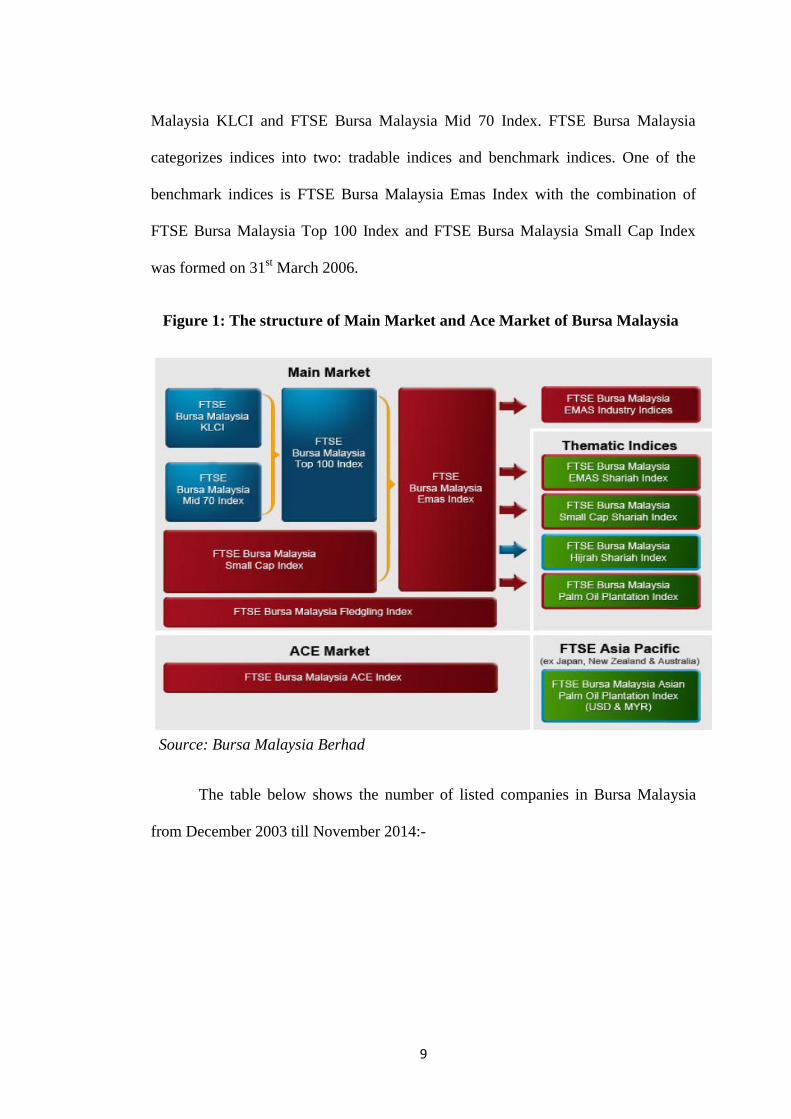
Currently, the main market structure in Bursa Malaysia is FTSE Bursa
Malaysia Top 100 Index which comprises of the top 30 stocks in FTSE Bursa
9
Malaysia KLCI and FTSE Bursa Malaysia Mid 70 Index. FTSE Bursa Malaysia
categorizes indices into two: tradable indices and benchmark indices. One of the
benchmark indices is FTSE Bursa Malaysia Emas Index with the combination of
FTSE Bursa Malaysia Top 100 Index and FTSE Bursa Malaysia Small Cap Index
was formed on 31st March 2006.
Figure 1: The structure of Main Market and Ace Market of Bursa Malaysia
Source: Bursa Malaysia Berhad
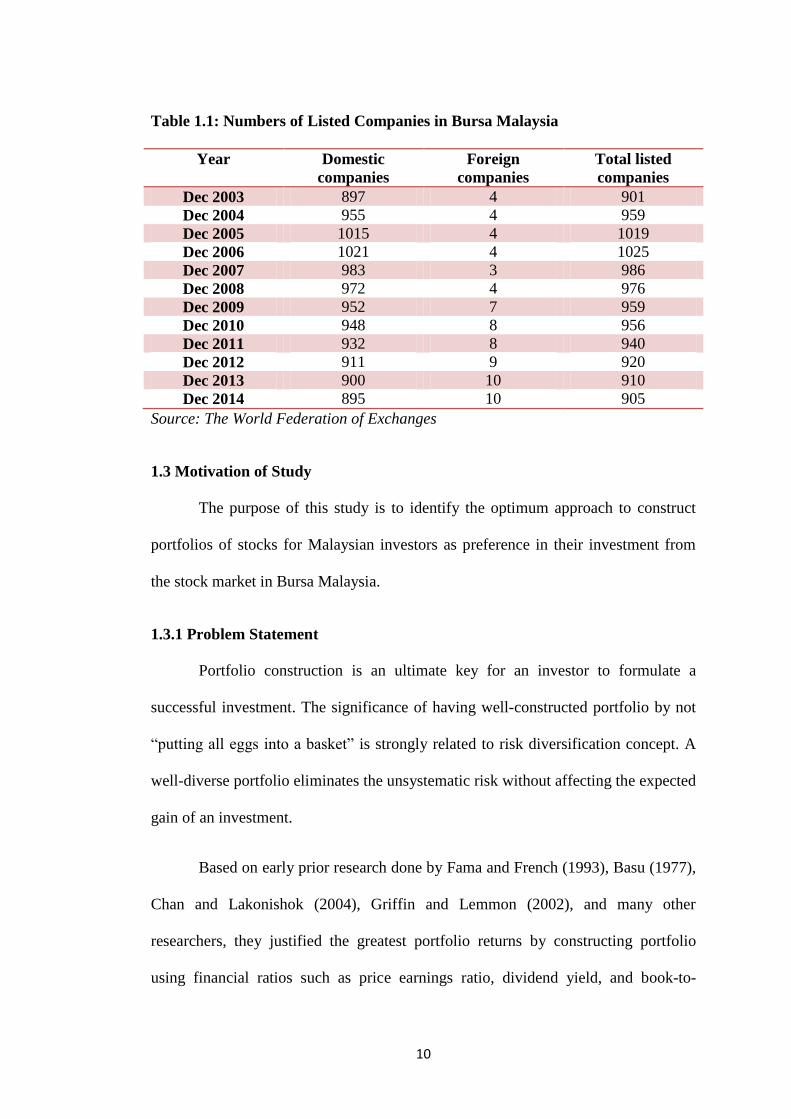
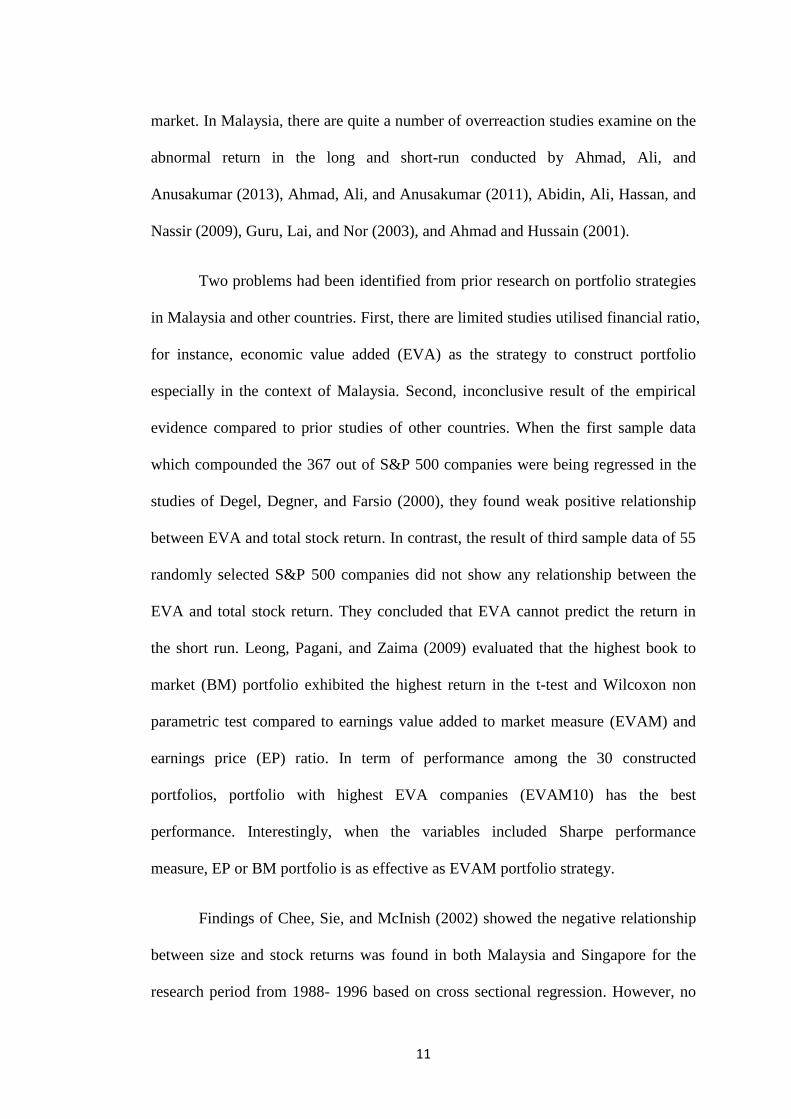
The table below shows the number of listed companies in Bursa Malaysia
from December 2003 till November 2014:-
10
Table 1.1: Numbers of Listed Companies in Bursa Malaysia
Year Domestic
companies
Foreign
companies
Total listed
companies
Dec 2003 897 4 901
Dec 2004 955 4 959
Dec 2005 1015 4 1019
Dec 2006 1021 4 1025
Dec 2007 983 3 986
Dec 2008 972 4 976
Dec 2009 952 7 959
Dec 2010 948 8 956
Dec 2011 932 8 940
Dec 2012 911 9 920
Dec 2013 900 10 910
Dec 2014 895 10 905
Source: The World Federation of Exchanges
1.3 Motivation of Study
The purpose of this study is to identify the optimum approach to construct
portfolios of stocks for Malaysian investors as preference in their investment from
the stock market in Bursa Malaysia.
1.3.1 Problem Statement
Portfolio construction is an ultimate key for an investor to formulate a
successful investment. The significance of having well-constructed portfolio by not
“putting all eggs into a basket” is strongly related to risk diversification concept. A
well-diverse portfolio eliminates the unsystematic risk without affecting the expected
gain of an investment.
Based on early prior research done by Fama and French (1993), Basu (1977),
Chan and Lakonishok (2004), Griffin and Lemmon (2002), and many other
researchers, they justified the greatest portfolio returns by constructing portfolio
using financial ratios such as price earnings ratio, dividend yield, and book-to-
11
market. In Malaysia, there are quite a number of overreaction studies examine on the
abnormal return in the long and short-run conducted by Ahmad, Ali, and
Anusakumar (2013), Ahmad, Ali, and Anusakumar (2011), Abidin, Ali, Hassan, and
Nassir (2009), Guru, Lai, and Nor (2003), and Ahmad and Hussain (2001).
Two problems had been identified from prior research on portfolio strategies
in Malaysia and other countries. First, there are limited studies utilised financial ratio,
for instance, economic value added (EVA) as the strategy to construct portfolio
especially in the context of Malaysia. Second, inconclusive result of the empirical
evidence compared to prior studies of other countries. When the first sample data
which compounded the 367 out of S&P 500 companies were being regressed in the
studies of Degel, Degner, and Farsio (2000), they found weak positive relationship
between EVA and total stock return. In contrast, the result of third sample data of 55
randomly selected S&P 500 companies did not show any relationship between the
EVA and total stock return. They concluded that EVA cannot predict the return in
the short run. Leong, Pagani, and Zaima (2009) evaluated that the highest book to
market (BM) portfolio exhibited the highest return in the t-test and Wilcoxon non
parametric test compared to earnings value added to market measure (EVAM) and
earnings price (EP) ratio. In term of performance among the 30 constructed
portfolios, portfolio with highest EVA companies (EVAM10) has the best
performance. Interestingly, when the variables included Sharpe performance
measure, EP or BM portfolio is as effective as EVAM portfolio strategy.
Findings of Chee, Sie, and McInish (2002) showed the negative relationship
between size and stock returns was found in both Malaysia and Singapore for the
research period from 1988- 1996 based on cross sectional regression. However, no
12
significant relationship between the firm size and stock returns was found after tested
by using multiple regression model on financial and non-financial companies in Sri
Lanka within the period of 2005-2010 (Jariya, Rimziya,and Shafana, 2013). Overall,
we can conclude that there are gap differences in the findings of their research. The
major reasons of the problem can be affected by different application of
methodology, period of study, and selected country. To clarify, this paper is to
identify the relationship between financial ratios and the portfolio performance in
Malaysia.
There are five major concerns in the selection of optimum portfolio which
eventually formed the questions as addressed below:-
i. Is there any relationship between economic value-added (EVA) and
portfolio return in short and long run?
ii. Is there any relationship between book-to-market ratio (BMR) and
portfolio return in short and long run?
iii. Is there any relationship between price earnings ratio (PER) and
portfolio return in the short and long run?
iv. Is there any relationship between size and portfolio return in the short
and long run?
v. Is there any relationship dividend yield and portfolio return in the
short and long run?
13
Thus, the aim of this study is to investigate the relationship between
economic value-added (EVA), book-to-market ratio (BMR), price earnings ratio
(PER), size, dividend yield, and portfolio performance return in long run by focusing
on Bursa Malaysia.
1.4 Objectives of Study
1.4.1 General Objective
The main objective of this study is to construct optimum portfolio selection
strategies in the context of Bursa Malaysia.
1.4.2 Specific Objectives
My research will be concerning on the companies which are listed on Bursa
Malaysia. Hence, the specific objectives for this study include:
i. To examine the relationship between the economic value-added (EVA)
and portfolio performance.
ii. To test whether the book market ratio (BMR) and portfolio
performance has positive relationship.
iii. To investigate the correlation between price earnings ratio and
portfolio performance.
iv. To study the behavior between the size and portfolio performance.
v. To assess the affiliation of dividend yield and portfolio performance.
14
1.5 Significance of Study
This study is regarding the relationship between the application of portfolio
strategy and portfolio returns in Bursa Malaysia. The main intention is to provide an
additional contribution in the area of portfolio construction by identifying the
optimum approach of portfolio strategy to construct portfolios of stocks for
Malaysian investors. In addition, this empirical study on the context of Malaysia
would attract and benefit more investors towards the importance of building an
optimum portfolio for investment purpose as well as to gain abnormal return with a
minimum risk. In future, this study may fascinate more Malaysian researchers who
are interested to further study on optimum portfolio construction.
1.6 Scope of Study
Prior studies on portfolio strategies had shown the popularity of using PER,
dividend yield, overreaction and size to analyze the relationship with returns of
portfolio. With respect to this, economic value-added (EVA), book-to-market ratio
(BMR), price earnings ratio (PER), size, and dividend yield are applied as part of the
portfolio strategies to indicate which component contributes the greatest returns in
portfolio creation strategies. Secondary data are collected by using the times series
data from 2009 till 2014.