revisiting the role of alternatives in asset allocation ias_role of... · portfolio construction,...
TRANSCRIPT

From the US stock market’s bottom in March 2009 through December 2015, US broad market equity indices returned more than 200%, far surpassing the gains made in most alternative strategies. As a result, many institutional investors are finding themselves faced with the question: Why invest in alternative assets if they underperformed equities and cost significantly more than traditional strategies?
To address this question, we expand on previous practitioner research exploring the role of alternatives in institutional portfolios by reviewing hedge funds, private equity, and real estate investment strategies. We analyze the role of these alternatives from the beginning of 2000 to Q1 2015 representing two full market cycles. Our key conclusions:
¡ Alternatives are far from homogenous; characteristics vary widely by strategy.
¡ Many alternative strategies have time-varying albeit significant embedded exposure to cheaply accessible market betas.
¡ Nevertheless, some strategies have historically provided “true” alpha and diversification benefits—including real estate, global macro, and relative value strategies.
¡ Investors should carefully evaluate the market exposures and other key characteristics associated with a range of alternatives in order to craft an allocation that serves their overall investment objectives.
¡ Manager selection is critical, given the wide performance dispersion observed across many types of alternatives.
Unpacking the Performance of Alternatives
In the late 1980s, David Swensen, Yale’s Chief Investment Officer, pioneered the “endowment model.” Through strong manager selection and reallocation from traditional assets to alternatives, Swensen successfully generated outsized returns, prompting others to follow suit. Minimal disclosure requirements and specialized investment mandates (that allow illiquid assets, leverage, short-selling, derivatives, and esoteric assets) provided the alternative managers a unique way to exploit market inefficiencies. Partially due to the success of the endowment model, investors have until recently perceived:
¡ Private equities to offer attractive risk-adjusted returns albeit with a high risk target and a long lock-up period.
¡ Real estate to provide meaningful diversification to a portfolio with the stipulation of possible cyclical returns.
¡ Hedge fund strategies, such as event-driven and relative value, to improve diversification and lower drawdown risk while generating robust alpha.
Despite these perceived advantages, alternatives have come under a fair amount of scrutiny in recent years. For instance,
REVISITING THE ROLE OF ALTERNATIVES IN ASSET ALLOCATION
PGIM INSTITUTIONAL ADVISORY & SOLUTIONS
Authors
Harsh Parikh, Vice President Tully Cheng, Director PGIM Institutional Advisory & Solutions PGIM Institutional Advisory & Solutions
PGIM Institutional Advisory & Solutions
The PGIM Institutional Advisory & Solutions group advises institutional clients on a variety of asset allocation, portfolio construction, and risk management topics. For more information, please contact Karen McQuiston, head of PGIM Institutional Advisory & Solutions, at [email protected].
Ju ly 2016

2 PGIM Institutional Advisory & Solutions
large public pension systems like California Public Employees’ Retirement System and New York City Employees’ Retirement System have recently been trimming their hedge fund exposure.1,2 Indeed, performance at the broad asset class level suggests that alternatives have been underperforming equities since the financial crisis (Exhibit 1).
In reality, not all alternatives are created equal. Taking style differences into account, we disaggregate hedge funds into equity hedge, event-driven, macro, and relative value; private equity into leveraged buyouts and venture capital; and real estate into core, value-add, and opportunistic.3 Large investors (those with more than $1 billion in hedge funds) are estimated to have an average of thirty hedge funds in their portfolio.4 This implies that such investors hold a well diversified set of alternatives, and analysis at the subcategory level can be particularly relevant.
In reality, not all alternatives are created equal. Institutions have long invested in certain kinds of alternatives, such as real estate. We conducted our analysis over the period from January 2000 to March 2015, in order to capture the wave of institutional interest and investment into hedge funds and other alternatives, as investors sought new ways to diversify their risks following the dramatic run up in equities that ended in 2000. This period is relatively short when compared with the histories for equities or for fixed income, and includes two of
the most dramatically negative equity cycles in history—periods when investors would likely expect their alternative investments to provide distinct diversification relative to equities and to protect against downside risk. Of course, the choice of sample period would not only impact the performance metrics but also our derived results. For example, if we include 1995 to 1999 into our sample (the tech boom), equities would have had greater overall performance.
We conducted our analysis at the index level: hedge fund indices were based on the HFRI indices, private equity indices were based on indices from Cambridge Associates, and real estate indices were based on the NCREIF’s ODCE and Townsend Fund Returns. The HFRI indices are monthly reported, equally-weighted hedge fund performance indices net of all fees. The Cambridge private equity and venture capital indices are based on quarterly and yearly financial statements produced by the fund managers for their limited partners and provided to Cambridge by the fund managers themselves. The NCREIF ODCE index is a capitalization-weighted, time-weighted index of investment returns based on the results of 33 open-end commingled funds pursuing a core investment strategy. The NCREIF Townsend Fund Returns index reports internal rates of return and multiples of invested capital by vintage or inception year for closed-end, value-added and opportunistic funds. Further data on these indices can be found in the Appendix.We unsmoothed the data to account for infrequent pricing of the underlying assets which we believe understates realized
1 Preqin Press, “CalPERS Withdraw From Hedge Funds—Start of a Trend?” September 2014.2 Pensions&Investments, “NYCERS pulls the plug on hedge funds,” April 2016. http://www.pionline.com/article/20160418/PRINT/304189975/nycers-pulls-the-plug-on-hedge-funds. Accessed June 2016.3 Fung and Hsieh demonstrate that the broad-based indices of hedge funds are more likely to mask the style diversity of individual hedge funds. William Fung and David Hsieh, “Hedge Fund Benchmarks: Information
Content and Biases,” Financial Analysts Journal, 58(1), 22-34, January 2002.4 Hedge Fund Spotlight, “The $1bn Club: Largest Investors in Hedge Funds,” 5-7. May 2015.
EXHIBIT 1Post-Crisis Cumulative Performance by Asset Class, July 2009 - March 2015
0
100
200
300
Asse
t Cla
ss V
alue
S&P 500
Private Equity
Fund of Hedge Funds
Real Estate
Private Equity: Cambridge [90% LBO/10% VC]Real Estate: NCREIF ODCEFund of Hedge Funds: HFRI Net of Fees
Data sources: NCREIF, Cambridge Associates, HFR, FactSet, Datastream

PGIM Institutional Advisory & Solutions 3
EXHIBIT 3Maximum Drawdowns, January 2000 - March 2015
-20%
-40%
-60%
-80%
0%
Fund of Funds
Equity Hedge
Event- Driven
Macro Relative Value
Venture Capital
Leveraged Buyout
Core RE Value- Add RE
OpportunisticRE
S&P 500 US Agg
Data sources: NCREIF, Cambridge Associates, HFR, FactSet, Datastream
volatility.5 However, we note that some common biases such as self-reporting and survivorship remained due to constraints inherent in the data, possibly leading to somewhat more positive hedge fund and private equity results than investors actually experienced. To begin our analysis, we present some performance metrics for the selected alternative strategies, as well as for traditional assets (equity and fixed income), over the full sample period (Exhibit 2). From this perspective, venture capital’s poor performance and large volatility from the dot-com bust stands out. But most of the other alternative categories, except for fund of funds, outperformed equities over this period. Perhaps not surprisingly, some hedge fund subcategories (equity hedge and fund of funds) underperformed fixed income, which enjoyed strong performance over this sustained declining rate environment.
Additionally, with the exception of venture capital, alternatives produced better risk-adjusted performance than equities over the period studied. In particular, core and opportunistic real estate, leveraged buyout private equity, and macro, event-driven, and relative value hedge fund strategies appear to perform better on a risk/return basis.
Since many institutional investors allocate to alternatives for downside protection, standard deviations may underestimate the risks associated with these subcategories. One of the selling points of certain hedge fund strategies is that they offer lower risk and downside protection as well. Indeed, macro and relative value had the lowest risk and drawdowns amongst alternatives over the period, and were second only to fixed income (Exhibit 3). Not surprisingly, private equity and real estate strategies had high volatility and much larger drawdowns.
5 Using an AR(1) for real estate, private equity, and hedge funds under the Geltner Approach. For real estate, Clayton, et al., uses a property index; since we use NCREIF ODCE for our analysis, we expect fund volatility to be higher based on the amount of leverage applied. We use scaling factors 1.25, 1.5, and 1.75 for Core, Value-Add, and Opportunistic, respectively. J. Clayton, D. Geltner, S. Hamilton, “Smoothing in Commercial Property Appraisals: Evidence from Individual Appraisals,” Real Estate Economics, Fall 2001, 337-360.
6 S&P 500 and US Aggregate bonds are presented gross of fees. Hedge fund and private equity returns are net of fees. Real estate returns are presented net of hypothetical fees. We reduced the real estate indices’ gross annualized return over the given period by hypothetical fee levels of 1% for core, 2% for value-add, and 3% for opportunistic. Hypothetical fee levels were derived by PGIM Institutional Advisory & Solutions based on a historical analysis of gross vs. net real estate index returns and are shown for illustrative purposes only.
EXHIBIT 2Risk/Return of Asset Subcategories, January 2000 - March 20156
Data sources: NCREIF, Cambridge Associates, HFR, FactSet, Datastream
0%
2%
4%
6%
8%
10%
12%
14%
0% 2% 4% 6% 8% 10% 12% 14% 16% 18% 20%
Retu
rn
Risk
S&P 500
Opportunistic RE
Leveraged Buyout
Value-Add RE US Agg Core RE
Relative Value
Hedge FundsPrivate EquityReal EstateTraditional Assets
Event-Driven
Equity Hedge Fund of
Hedge Funds
Macro
Venture Capital

4 PGIM Institutional Advisory & Solutions
Diversification Potential Varies
Beyond the performance metrics that alternatives are expected to generate, another key reason for the inclusion of alternatives in a portfolio is their power of diversification. Theoretically, alternatives should generate returns that are uncorrelated with traditional asset classes due to their unique drivers of returns.
As a starting point, a straightforward correlation of different alternative strategies versus traditional asset classes shows that many alternative strategies, on average, have significant exposures to market betas—as evidenced by the high correlations to equities for funds of funds, equity hedge and event-driven hedge funds, and leveraged buyout private equity. In contrast, real estate and macro hedge fund strategies offer better diversification against equities with correlations less than 0.50
(Exhibit 4). Relative value hedge funds and venture capital show some diversification advantages as well. With the exception of macro hedge funds, almost all of these strategies had negative correlations to fixed income. This is not surprising, given the overall positive correlations observed between alternatives and equities, and the strongly negative correlation between the US Aggregate and the S&P 500 (-0.36) over this same period.
Focusing in on hedge funds alone, an analysis of rolling correlations to the S&P 500 reveals that while there is variation through time, equity hedge and event-driven strategies demonstrate consistently elevated correlations to equity, while macro appears to provide distinct potential for diversification (Exhibit 5). Additionally, macro hedge funds exhibited low correlation to equities during periods of stress such as during the height of the financial crisis.
EXHIBIT 4Correlations of Asset Subcategories to Traditional Equities and Fixed Income7
FULL PERIOD JANUARY 2000 -
MARCH 2015
HEDGE FUND PRIVATE EQUITY REAL ESTATE
Fund of Funds
Equity Hedge
Event- Driven Macro Relative
ValueVenture Capital
Leveraged Buyout Core Value-Add Opportunistic
S&P 500 0.69 0.82 0.79 0.27 0.55 0.58 0.77 0.45 0.33 0.44
World Equities 0.77 0.88 0.84 0.38 0.63 0.52 0.78 0.43 0.33 0.46
US Aggregate -0.22 -0.29 -0.30 0.13 -0.14 -0.30 -0.34 -0.16 -0.11 -0.13
Global Aggregate 0.04 0.02 0.01 0.40 0.02 -0.19 -0.03 -0.07 -0.04 0.03
Data sources: PGIM, NCREIF, Cambridge Associates, HFR, FactSet, Datastream
EXHIBIT 53-Year Rolling Correlations of Hedge Funds to the S&P 500, January 2000 - March 2015
Data sources: PGIM, HFR
-0.20
0.00
0.20
0.40
0.60
0.80
1.00
Dec-
02M
ar-0
3Ju
n-03
Sep-
03De
c-03
Mar
-04
Jun-
04Se
p-04
Dec-
04M
ar-0
5Ju
n-05
Sep-
05De
c-05
Mar
-06
Jun-
06Se
p-06
Dec-
06M
ar-0
7Ju
n-07
Sep-
07De
c-07
Mar
-08
Jun-
08Se
p-08
Dec-
08M
ar-0
9Ju
n-09
Sep-
09De
c-09
Mar
-10
Jun-
10Se
p-10
Dec-
10M
ar-1
1Ju
n-11
Sep-
11De
c-11
Mar
-12
Jun-
12Se
p-12
Dec-
12M
ar-1
3Ju
n-13
Sep-
13De
c-13
Mar
-14
Jun-
14Se
p-14
Dec-
14M
ar-1
5
Corr
elat
ions
End of 3-Year Rolling Period
Equity Hedge
Event-Driven
Macro
Relative Value
Fund of Funds
7 US Aggregate is measured using Barclays US Aggregate Index; World Equity is measured using MSCI ACWI Gross Returns; Global Aggregate is measured using the Barclays Global Aggregate Index.

PGIM Institutional Advisory & Solutions 5
Theoretically, alternatives should generate returns that are uncorrelated with traditional asset classes due to their unique drivers of returns.
Alternative Strategies: Beta or Alpha?
Full PeriodWhile correlations do a decent job in gauging asset diversification, we believe that it is helpful to understand the actual factors driving these alternative subcategories. Therefore, we use a factor approach to build a consistent set of risk characteristics for conventional and alternative asset classes. Extending the original approach by Fung & Hsieh, we implemented a ten factor model that attributes alternatives performance to alpha and exposures to investable market factors.8 Included are both the traditional market factors (equity, bond, size, credit, and emerging markets) and trend-following factors (bond trend, currency trend and commodity trend) cited in that original piece, as well as REITs and mortgage factors to reflect the extension of this analysis to cover additional assets, such as aggregate bonds and real estate. In principle, the less one can replicate returns through factor exposures (suggested by low R-squared), the more the alternative subcategory delivers on its promise. Investors should be wary of paying the high fees that many alternatives managers charge if they can replicate the strategy through market factors.
Investors should be wary of paying the high fees that many alternatives managers charge if they can replicate the strategy through market factors.
Our analysis leads to some key insights (Exhibit 6). Over the historical time period analyzed, returns of fund of funds, equity hedge, and event-driven hedge funds can to a large extent be explained by market beta factors, based on relatively high and significant R-squared values. Macro hedge fund strategies, on the other hand, appeared to be less driven by market factors. Market factors appeared to have very low explanatory power for real estate returns—two of the three types of real estate had the lowest R-squared measures in the analysis. Private equity, as a whole, did not demonstrate particularly high R-squared values. In addition, we analyzed the implied historical alpha (intercept) based on the factor model employed, for each asset class. Core real estate, value-add real estate, and opportunistic real estate, as well as leveraged buyout private equity, had the highest alpha among the strategies studied.9 We believe that, for direct real estate, a combination of outperformance from active management and consistently high current income drove the large model alpha. On the other hand, for leveraged buyout private equity, which does not typically have a significant current income, alpha is more likely driven by outperformance from active management and management of distributions. We also observed significant alpha for event-driven, macro, and relative value hedge fund strategies. We did not, however, find significant alpha associated with funds of funds or equity hedge funds, nor with venture capital. Not surprisingly, private equity demonstrated fairly high and positive factor exposures to the equity market (albeit with moderate R-squared levels). The significant factors associated with real estate included REITs (positive) as well as primarily negative exposure to bonds, mortgages, and size. While macro hedge fund strategies had a positive exposure to the bond market factor, other hedge fund strategies (equity hedge,
EXHIBIT 6Factor Analysis of Asset Subcategories10
Data sources: PGIM, NCREIF, Cambridge Associates, HFR, FactSet, Datastream
FULL PERIOD JANUARY 2000 -
MARCH 2015
ANNUALIZED STANDARD
DEV.
HEDGE FUND PRIVATE EQUITY REAL ESTATE TRADITIONALFund of Funds
Equity Hedge
Event- Driven Macro Relative
ValueVenture Capital
Leveraged Buyout Core Value-
Add Opportunistic S&P 500 US Agg
Annualized Alpha 1.46% 1.58% 3.46% 2.30% 4.46% 0.64% 7.72% 9.38% 7.42% 9.71% 0.00% 0.02%
Bond Trend 67% -0.02 -0.02 -0.02 -0.01 -0.02 -0.04 0.00 0.00 0.01 0.01 0.00 0.00
Currency Trend 70% 0.01 0.01 0.00 0.03 -0.01 -0.01 0.03 0.00 0.00 0.03 0.00 0.00
Commodity Trend 47% -0.03 -0.04 -0.03 0.00 -0.04 0.07 -0.08 -0.03 -0.08 -0.10 0.00 0.00
Equity Market Factor 17% 0.20 0.45 0.31 0.15 0.02 0.70 0.76 0.13 0.24 0.37 1.00 0.00
Size Spread Factor 8% 0.14 0.36 0.37 0.14 0.00 0.09 0.16 -0.41 -0.33 -0.66 0.00 -0.01
Bond Market Factor 5% -0.15 -0.23 -0.40 0.31 -0.46 0.25 -0.04 -0.69 -0.11 -0.38 0.00 0.60
Credit Spread Factor 5% 0.49 0.68 0.70 0.27 0.65 -0.32 -0.20 0.03 -0.50 -0.57 0.00 0.23
Emerging Market Factor 15% 0.14 0.19 0.11 0.13 0.10 0.03 0.23 0.01 0.06 0.18 0.00 0.00
REITS Index 16% -0.12 -0.19 -0.11 -0.10 -0.04 -0.22 -0.15 0.41 0.27 0.27 0.00 0.01
Mortgage Factor 2% -0.67 -0.58 -0.42 -0.41 -0.17 0.39 -0.22 -1.73 -1.03 0.52 0.00 0.37
R-squared 0.77 0.90 0.86 0.58 0.73 0.28 0.65 0.51 0.24 0.36 1.00 0.99
Bold numbers indicate significance of t-statistic at the 90% confidence level
8 William Fung and David Hsieh, “Hedge Fund Benchmarks: A Risk Based Approach,” Financial Analysts Journal, 60(5), September 2004, 65-80.9 Significant at the 90% confidence level. Real estate returns were evaluated on a gross of fees basis due to data availability. Please see Note 10. 10 Hedge fund and private equity analyses are conducted net of fees and carried interest. Real estate and traditional assets are gross of fees. We estimate that fees would reduce the real estate model alpha by
approximately 1%, 2%, and 3% for core, value-add, and opportunistic respectively. A detailed description of the factors can be found in the Appendix.
6 PGIM Institutional Advisory & Solutions
event-driven and relative value) had lower, or even negative, exposure to the bond market, but with greater exposure to the credit factor. For example, relative value strategies had about three times the credit spread exposure of fixed income itself. The equity-oriented hedge fund strategies (fund of funds, equity hedge, and event-driven) carried significant equity, size (small cap), and emerging markets factor exposures, which may explain the drawdowns these categories experienced during the financial crisis. In contrast, the macro and relative value hedge fund strategies provided much lower betas to these factors, and macro additionally provided significant positive systematic exposure to the nonlinear payoffs associated with the currency trend-following factor, which almost none of the other hedge fund categories provided.
Core real estate, value-add real estate, and opportunistic real estate, as well as leveraged buyout private equity, had the highest alpha among the strategies studied.
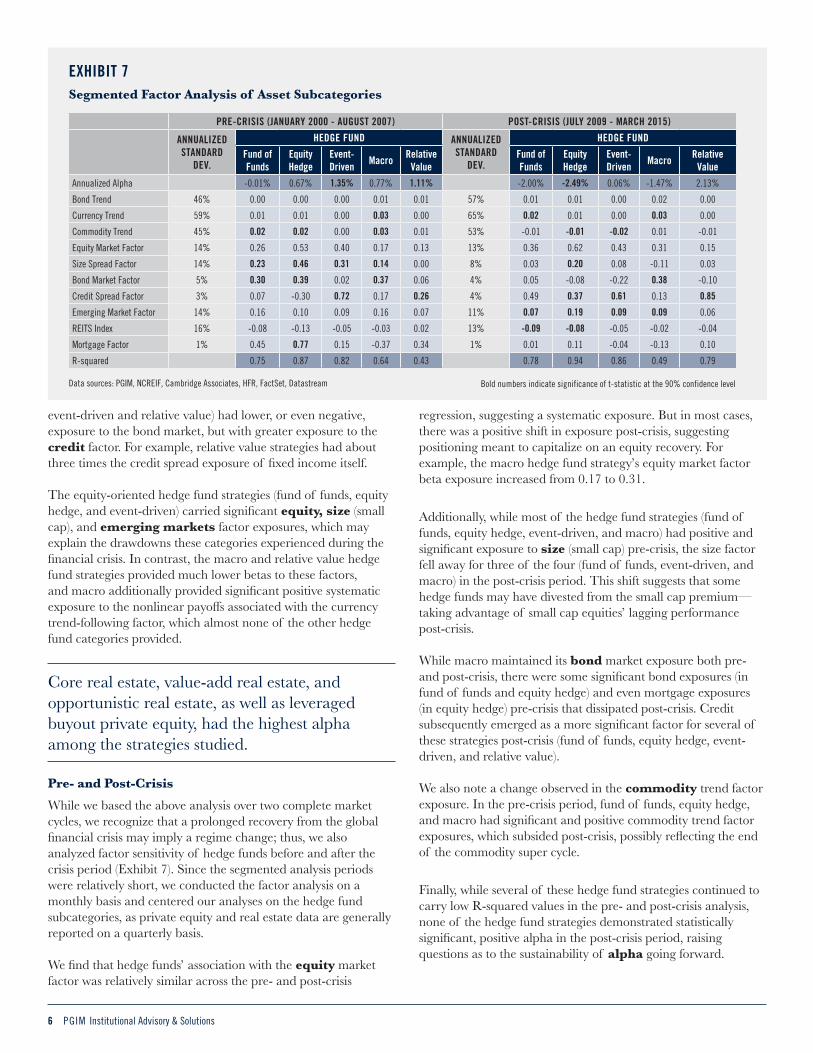
Pre- and Post-CrisisWhile we based the above analysis over two complete market cycles, we recognize that a prolonged recovery from the global financial crisis may imply a regime change; thus, we also analyzed factor sensitivity of hedge funds before and after the crisis period (Exhibit 7). Since the segmented analysis periods were relatively short, we conducted the factor analysis on a monthly basis and centered our analyses on the hedge fund subcategories, as private equity and real estate data are generally reported on a quarterly basis. We find that hedge funds’ association with the equity market factor was relatively similar across the pre- and post-crisis
regression, suggesting a systematic exposure. But in most cases, there was a positive shift in exposure post-crisis, suggesting positioning meant to capitalize on an equity recovery. For example, the macro hedge fund strategy’s equity market factor beta exposure increased from 0.17 to 0.31.
Additionally, while most of the hedge fund strategies (fund of funds, equity hedge, event-driven, and macro) had positive and significant exposure to size (small cap) pre-crisis, the size factor fell away for three of the four (fund of funds, event-driven, and macro) in the post-crisis period. This shift suggests that some hedge funds may have divested from the small cap premium—taking advantage of small cap equities’ lagging performance post-crisis. While macro maintained its bond market exposure both pre-and post-crisis, there were some significant bond exposures (in fund of funds and equity hedge) and even mortgage exposures (in equity hedge) pre-crisis that dissipated post-crisis. Credit subsequently emerged as a more significant factor for several of these strategies post-crisis (fund of funds, equity hedge, event-driven, and relative value). We also note a change observed in the commodity trend factor exposure. In the pre-crisis period, fund of funds, equity hedge, and macro had significant and positive commodity trend factor exposures, which subsided post-crisis, possibly reflecting the end of the commodity super cycle.
Finally, while several of these hedge fund strategies continued to carry low R-squared values in the pre- and post-crisis analysis, none of the hedge fund strategies demonstrated statistically significant, positive alpha in the post-crisis period, raising questions as to the sustainability of alpha going forward.
EXHIBIT 7Segmented Factor Analysis of Asset Subcategories
PRE-CRISIS (JANUARY 2000 - AUGUST 2007) POST-CRISIS (JULY 2009 - MARCH 2015)
ANNUALIZED STANDARD
DEV.
HEDGE FUND ANNUALIZED STANDARD
DEV.
HEDGE FUND
Fund of Funds
Equity Hedge
Event- Driven
Macro Relative Value
Fund of Funds
Equity Hedge
Event- Driven
Macro Relative Value
Annualized Alpha -0.01% 0.67% 1.35% 0.77% 1.11% -2.00% -2.49% 0.06% -1.47% 2.13%
Bond Trend 46% 0.00 0.00 0.00 0.01 0.01 57% 0.01 0.01 0.00 0.02 0.00
Currency Trend 59% 0.01 0.01 0.00 0.03 0.00 65% 0.02 0.01 0.00 0.03 0.00
Commodity Trend 45% 0.02 0.02 0.00 0.03 0.01 53% -0.01 -0.01 -0.02 0.01 -0.01
Equity Market Factor 14% 0.26 0.53 0.40 0.17 0.13 13% 0.36 0.62 0.43 0.31 0.15
Size Spread Factor 14% 0.23 0.46 0.31 0.14 0.00 8% 0.03 0.20 0.08 -0.11 0.03
Bond Market Factor 5% 0.30 0.39 0.02 0.37 0.06 4% 0.05 -0.08 -0.22 0.38 -0.10
Credit Spread Factor 3% 0.07 -0.30 0.72 0.17 0.26 4% 0.49 0.37 0.61 0.13 0.85
Emerging Market Factor 14% 0.16 0.10 0.09 0.16 0.07 11% 0.07 0.19 0.09 0.09 0.06
REITS Index 16% -0.08 -0.13 -0.05 -0.03 0.02 13% -0.09 -0.08 -0.05 -0.02 -0.04
Mortgage Factor 1% 0.45 0.77 0.15 -0.37 0.34 1% 0.01 0.11 -0.04 -0.13 0.10
R-squared 0.75 0.87 0.82 0.64 0.43 0.78 0.94 0.86 0.49 0.79
Data sources: PGIM, NCREIF, Cambridge Associates, HFR, FactSet, Datastream Bold numbers indicate significance of t-statistic at the 90% confidence level

PGIM Institutional Advisory & Solutions 7
EXHIBIT 83-Year Rolling Factor Analysis, January 2000 - March 2015
Data sources: PGIM, HFR
-0.20
-0.10
0.00
0.10
0.20
0.30
0.40
0.50
0.60
0.70
0.80
Dec-
02
Mar
-03
Jun-
03
Sep-
03
Dec-
03
Mar
-04
Jun-
04
Sep-
04
Dec-
04
Mar
-05
Jun-
05
Sep-
05
Dec-
05
Mar
-06
Jun-
06
Sep-
06
Dec-
06
Mar
-07
Jun-
07
Sep-
07
Dec-
07
Mar
-08
Jun-
08
Sep-
08
Dec-
08
Mar
-09
Jun-
09
Sep-
09
Dec-
09
Mar
-10
Jun-
10
Sep-
10
Dec-
10
Mar
-11
Jun-
11
Sep-
11
Dec-
11
Mar
-12
Jun-
12
Sep-
12
Dec-
12
Mar
-13
Jun-
13
Sep-
13
Dec-
13
Mar
-14
Jun-
14
Sep-
14
Dec-
14
Mar
-15
Fact
or V
alue
Equity Market Factor
0.00
0.10
0.20
0.30
0.40
0.50
0.60
0.70
0.80
0.90
1.00
Dec-
02
Mar
-03
Jun-
03
Sep-
03
Dec-
03
Mar
-04
Jun-
04
Sep-
04
Dec-
04
Mar
-05
Jun-
05
Sep-
05
Dec-
05
Mar
-06
Jun-
06
Sep-
06
Dec-
06
Mar
-07
Jun-
07
Sep-
07
Dec-
07
Mar
-08
Jun-
08
Sep-
08
Dec-
08
Mar
-09
Jun-
09
Sep-
09
Dec-
09
Mar
-10
Jun-
10
Sep-
10
Dec-
10
Mar
-11
Jun-
11
Sep-
11
Dec-
11
Mar
-12
Jun-
12
Sep-
12
Dec-
12
Mar
-13
Jun-
13
Sep-
13
Dec-
13
Mar
-14
Jun-
14
Sep-
14
Dec-
14
Mar
-15
Adj.
R-Sq
uare
d Va
lue
Adj. R-Squared
-10.00%
-5.00%
0.00%
5.00%
10.00%
15.00%
Dec-
02
Mar
-03
Jun-
03
Sep-
03
Dec-
03
Mar
-04
Jun-
04
Sep-
04
Dec-
04
Mar
-05
Jun-
05
Sep-
05
Dec-
05
Mar
-06
Jun-
06
Sep-
06
Dec-
06
Mar
-07
Jun-
07
Sep-
07
Dec-
07
Mar
-08
Jun-
08
Sep-
08
Dec-
08
Mar
-09
Jun-
09
Sep-
09
Dec-
09
Mar
-10
Jun-
10
Sep-
10
Dec-
10
Mar
-11
Jun-
11
Sep-
11
Dec-
11
Mar
-12
Jun-
12
Sep-
12
Dec-
12
Mar
-13
Jun-
13
Sep-
13
Dec-
13
Mar
-14
Jun-
14
Sep-
14
Dec-
14
Mar
-15
Alph
a Va
lue
Annualized Alpha
End of 3-Year Rolling Period
End of 3-Year Rolling Period
End of 3-Year Rolling Period
Equity Hedge
Event-Driven
Macro
Relative Value Fund of Funds
Equity Hedge
Equity Hedge
Event-Driven
Event-Driven
Macro
Macro
Relative Value
Relative Value
Fund of Funds
Fund of Funds
None of the hedge fund strategies demonstrated statistically significant, positive alpha in the post-crisis period, raising questions as to the sustainability of alpha going forward.
Rolling PeriodsGiven the tumultuous markets since 2000, investors might expect many hedge funds to have exhibited more frequent, active shifts in their specific exposures. While the full period and pre/post crisis period results are meant to provide investors with a grasp of these strategies’ overall characteristics, we also consider
whether these characteristics might shift more continuously over time. Thus, we also analyzed hedge funds’ factor exposures on a rolling three-year basis (Exhibit 8). We find the rolling equity market factor results to be generally consistent with the full period results, with equity hedge showing the strongest exposure to the equity factor over time, followed by event-driven. Relative value demonstrated relatively stable, low positive exposure to the equity market. Macro exhibited the most dramatic shifts, with both positive and negative exposures over time—yet never reached the levels associated with equity hedge or event-driven. These results were also consistent with the 3-year rolling correlations presented earlier.

8 PGIM Institutional Advisory & Solutions
EXHIBIT 9Alternative Bucket Factor Analysis
Data sources: PGIM, NCREIF, Cambridge Associates, HFR, FactSet, Datastream
FULL PERIOD JANUARY 2000 -
MARCH 2015
ANNUALIZED STANDARD DEV.
ALTERNATIVES ALLOCATIONS
Risk-Off Risk-On Broad
Annualized Alpha 5.38% 6.93% 6.64%
Bond Trend 67% -0.01 0.00 0.00
Currency Trend 70% 0.01 0.02 0.02
Commodity Trend 47% -0.02 -0.07 -0.06
Equity Market Factor 17% 0.10 0.48 0.39
Size Spread Factor 8% -0.09 -0.04 -0.04
Bond Market Factor 5% -0.28 -0.27 -0.21
Credit Spread Factor 5% 0.32 -0.03 0.00
Emerging Market Factor 15% 0.08 0.18 0.15
REITS Index 16% 0.09 0.01 0.03
Mortgage Factor 2% -0.77 -0.04 -0.44
R-squared 0.69 0.70 0.71
Return 7.38% 10.53% 9.54%
Risk 5.43% 12.36% 9.89%
Maximum Drawdown -17.98% -32.75% -26.74%
Sample Alternative Allocations
Core RE 33.33%
Macro HF 33.33%
RelVal HF 33.33%
Risk-Off
Opp RE 33.33%
LBO PE 33.33%
Event- Driven HF
33.33%
Core RE
11.11%
Value-Add RE 11.11%
Opp RE 11.11%
LBO PE 33.33%
Event- Driven HF
11.11%
Macro HF 11.11%
RelVal HF 11.11% Risk-On
Broad
Bold numbers indicate significance of t-statistic at the 90% confidence level
Most—but not all—of the hedge fund strategies were highly explainable by the given factor exposures.
Most—but not all—of the hedge fund strategies were highly explainable by the given factor exposures—with generally high, stable R-squared values—even rolling through time. Equity hedge demonstrated the strongest, and most consistent, R-squared over time. The notable exception was macro, which was by far the most variable. At times, the strategy appeared to be relatively easy to characterize by this approach (note the high R-squared values over 2005-2007), but at most other times was much less so. The rolling alpha analysis suggests that many of the hedge fund strategies generated stronger alphas in the earlier, as opposed to later, years. Equity hedge funds and funds of funds, in particular, appeared to fall into, and remained in, mostly negative alpha territory beginning in 2005. Overall, funds of funds appeared to provide very little alpha over time. In contrast, macro demonstrated very strong countercyclical surges in alpha following both equity market downturns, shifting to a period of negative alpha only over the most recent period. Relative value and event-driven appeared to provide more moderate, and frequently positive, alpha over time. A given strategy’s propensity to demonstrate stable factor weightings and/or R-squared values over time may bring some benefits, but also may raise some concerns. On the positive side, more stable results, which can provide a solid understanding of a strategy’s characteristics, make it easier to model in the context of one’s overall portfolio. However, a high level of explainability (high R-squared), with relatively stable factor weightings and low
(if stable) alpha levels, can indicate that a given strategy might not bring much to the overall portfolio—and could be relatively straightforward to access in the public markets (with lower fees). Based on our analysis, it appears that both equity hedge funds and fund of funds strategies run this risk of “mediocrity.” On the other hand, incorporating some of the more variable, and volatile, strategies would certainly require a thoughtful approach to portfolio diversification.
Relative value and event-driven appeared to provide more moderate, and frequently positive, alpha over time.
Portfolio Level Dynamics
It is clear that the alternatives choices available to investors come with a range of potential factor-related characteristics. Focusing in on the subcategories which demonstrated significant alpha relative to the factors identified over the study period, we analyze how these various strategies might be incorporated at the whole portfolio level and their potential impact on the nature of portfolio risk. For example, we may identify a “risk-off” (or lower-risk) alternatives bucket with a two-thirds allocation to lower-risk hedge funds (macro and relative value) and a third allocation to core real estate. Conversely, a “risk-on” (or higher-risk) alternatives bucket might be allocated with a third in event-driven hedge funds (with stronger ties to equity and credit factors), a third in opportunistic real estate, and a third in leveraged buyout private equity. Finally, we might consider a “broad” alternatives bucket that equally weights the three broad alternative categories (real estate, hedge funds, and private equity) and includes the outperforming alternatives within each of these broad alternative categories (Exhibit 9).

PGIM Institutional Advisory & Solutions 9
EXHIBIT 10Risk and Maximum Drawdown of Illustrative Portfolios, January 2000 - March 2015
Data sources: PGIM, NCREIF, Cambridge Associates, HFR, FactSet, Datastream
0%
2%
4%
6%
8%
10%
12%
14%
16%
18%
0%
10%
20%
30%
40%
50%
60%
70%
80%
90%
100%
Risk
% Fixed Income
-50%
-45%
-40%
-35%
-30%
-25%
-20%
-15%
-10%
-5%
0%
0%
10%
20%
30%
40%
50%
60%
70%
80%
90%
100%
Max
Dra
wdow
n
% Fixed Income
No Alts
20% Risk-Off Alts
20% Risk-On Alts
20% Broad Alts
Risk-off: One half each - HF (Macro, RV); RE (Core only)Risk-on: One third each - HF (ED only); RE (Opp only); PE (LBO)Broad: One third each - HF (all 3 ED, Mac, RV); RE (all 3); PE (LBO)
LOW
ER R
ISK
LESS
DRA
WDO
WN
The charts above represent the risk characteristics associated with a range of hypothetical allocations to fixed income and equity, compared to similar portfolios with an additional allocation of 20% to alternatives (risk-off, risk-on, or broad). For the “No Alts” series, the portfolios represent a range from 90% fixed/10% equity, 80% fixed/20% equity, etc. down to 10% fixed/90% equity. For the "20% Alts" series, a steady allocation of 20% to a particular alternatives bucket is used in place of some of the equity allocation, while the fixed income allocation remains the same. Therefore, the portfolios in these series represent a range from 80% fixed/0% equity/20% alts, 70% fixed/10% equity/20% alts, etc. down to 0% fixed/80% equity/20% alts. Risk is calculated based on excess portfolio returns.
What effect might these differing approaches have on an investor’s overall portfolio? We illustrate by considering a range of hypothetical portfolios over the study period (January 2000 to March 2015). Hypothetical portfolios are allocated to fixed income (proxied by the US aggregate bond index) and equity (proxied by S&P 500) and are compared with similar portfolios that have an allocation of 20% to alternatives (risk-off, risk-on, or broad). In the following examples, we can think of the 20% in alternatives as replacing equity, so one might compare “50% fixed/50% equity” with “50% fixed/30% equity/20% alternatives.” This replacement could just as easily be viewed from the reverse perspective or as an equal subtraction from fixed and equity, but the current view might be particularly useful to those employing alternatives as a diversifier to equities.
First, we note that the introduction of selected alternatives strategies reduces realized volatility and dampens the maximum realized drawdown, relative to a straight fixed income/equity approach (which naturally decreases in risk with greater allocations to fixed income)—compare the 50% fixed income portfolio with no alternatives to one with 20% in one of the selected alternatives buckets (Exhibit 10). Not surprisingly, the “risk-off” bucket is marginally more effective than “risk-on” or “broad” toward this end.
Next, we illustrate which asset categories dominate the portfolio-level volatility along the allocation spectrum (Exhibit 11). Fixed income’s contribution to portfolio-level risk diminishes steeply with decreasing allocations to the asset class, such that even with a 60% allocation to fixed income, its contribution to risk becomes negligible. Of course, these results
would vary considerably depending on the type of fixed income employed; longer duration investments would contribute more risk, which is often desired by specific kinds of investors to offset liability duration.
Equity’s contribution to portfolio-level risk increases sharply as it is included in greater levels, to the point where it dominates the risk budget even as a minority holding in the portfolio. Interestingly, the alternatives considered (which might include hedge funds, real estate, and/or private equity), modeled as a static allocation of 20%, demonstrate a peak contribution to risk at around 70% fixed income (70% fixed/20% alternatives/10% equity). However, as the allocation to equity increases (with lower fixed income allocation), the impact on overall risk from equity allocation overtakes that from alternatives allocation.
How can we use our understanding of the factor sensitivities present in these various assets to describe the nature of portfolio-level risk observed? We know, for example, that private equity will have a strong relationship to the equity market factor and that there are varying equity and credit sensitivities in hedge funds. These sensitivities naturally contribute to the individual asset-level volatility and cross-asset correlations that lead to portfolio risk.
We can make several observations by taking a closer look at the 50% fixed income portfolios as an example. First, while there was a statistically significant factor weighting to mortgages in the “no alternatives” (50% fixed/50% equity) portfolio, that factor falls away in the portfolios diversified with alternatives (Exhibit 12). The equity factor naturally falls nearly in proportion to its

10 PGIM Institutional Advisory & Solutions
EXHIBIT 12Factor Analysis of Illustrative Portfolios
Alternative allocations in risk-off, risk-on, and broad portfolios refer to allocations detailed in Exhibit 9. Data sources: PGIM, NCREIF, Cambridge Associates, HFR, FactSet, Datastream
FULL PERIOD JANUARY 2000 - MARCH 2015
ANNUALIZED STANDARD DEV.
PORTFOLIOS
50FI/50E 50FI/30E/20A Risk-Off 50FI/30E/20A Risk-On 50FI/30E/20A Broad
Annualized Alpha 0.01% 1.09% 1.40% 1.34%
Bond Trend 67% 0.00 0.00 0.00 0.00
Currency Trend 70% 0.00 0.00 0.00 0.00
Commodity Trend 47% 0.00 -0.01 -0.02 -0.01
Equity Market Factor 17% 0.50 0.32 0.40 0.38
Size Spread Factor 8% 0.00 -0.02 -0.01 -0.01
Bond Market Factor 5% 0.30 0.24 0.25 0.26
Credit Spread Factor 5% 0.12 0.18 0.11 0.12
Emerging Market Factor 15% 0.00 0.02 0.04 0.03
REITS Index 16% 0.01 0.02 0.01 0.01
Mortgage Factor 2% 0.19 0.03 0.18 0.10
R-squared 1.00 0.98 0.96 0.97
Return 5.66% 6.14% 6.82% 6.59%
Risk 7.83% 5.32% 6.57% 6.15%
Maximum Drawdown -21.39% -15.22% -17.36% -16.82%
EXHIBIT 11Contribution to Risk in Illustrative Portfolios by Asset Class, January 2000 - March 2015
Data sources: PGIM, NCREIF, Cambridge Associates, HFR, FactSet, Datastream
-20%
0%
20%
40%
60%
80%
100%
120%
0% 10% 20% 30% 40% 50% 60% 70% 80% 90% 100%
Alte
rnat
ives
% R
isk
Cont
ribut
ion
% Fixed Income
No Alts
20% Risk-off Alts
20% Risk-on Alts
20% Broad Alts
-20%
0%
20%
40%
60%
80%
100%
120%
0% 10% 20% 30% 40% 50% 60% 70% 80% 90% 100%
Fixe
d In
com
e %
Ris
k Co
ntrib
utio
n
% Fixed Income
-20%
0%
20%
40%
60%
80%
100%
120%
0% 10% 20% 30% 40% 50% 60% 70% 80% 90% 100%
Equi
ty %
Ris
k Co
ntrib
utio
n
% Fixed Income
Risk-off: One half each - HF (Macro, RV); RE (Core only)Risk-on: One third each - HF (ED only); RE (Opp only); PE (LBO)Broad: One third each - HF (all 3 ED, Mac, RV); RE (all 3); PE (LBO)
The charts above represent the risk characteristics associated with a range of hypothetical allocations to fixed income and equity, compared to similar portfolios with an additional allocation of 20% to alternatives (risk-off, risk-on, or broad). For the “No Alts” series, the portfolios represent a range from 90% fixed/10% equity, 80% fixed/20% equity, etc. down to 10% fixed/90% equity. For the "20% Alts" series, a steady allocation of 20% to a particular alternatives bucket is used in place of some of the equity allocation, while the fixed income allocation remains the same. Therefore, the portfolios in these series represent a range from 80% fixed/0% equity/20% alts, 70% fixed/10% equity/20% alts, etc. down to 0% fixed/80% equity/20% alts. Risk is calculated based on excess portfolio returns.
PGIM Institutional Advisory & Solutions 11
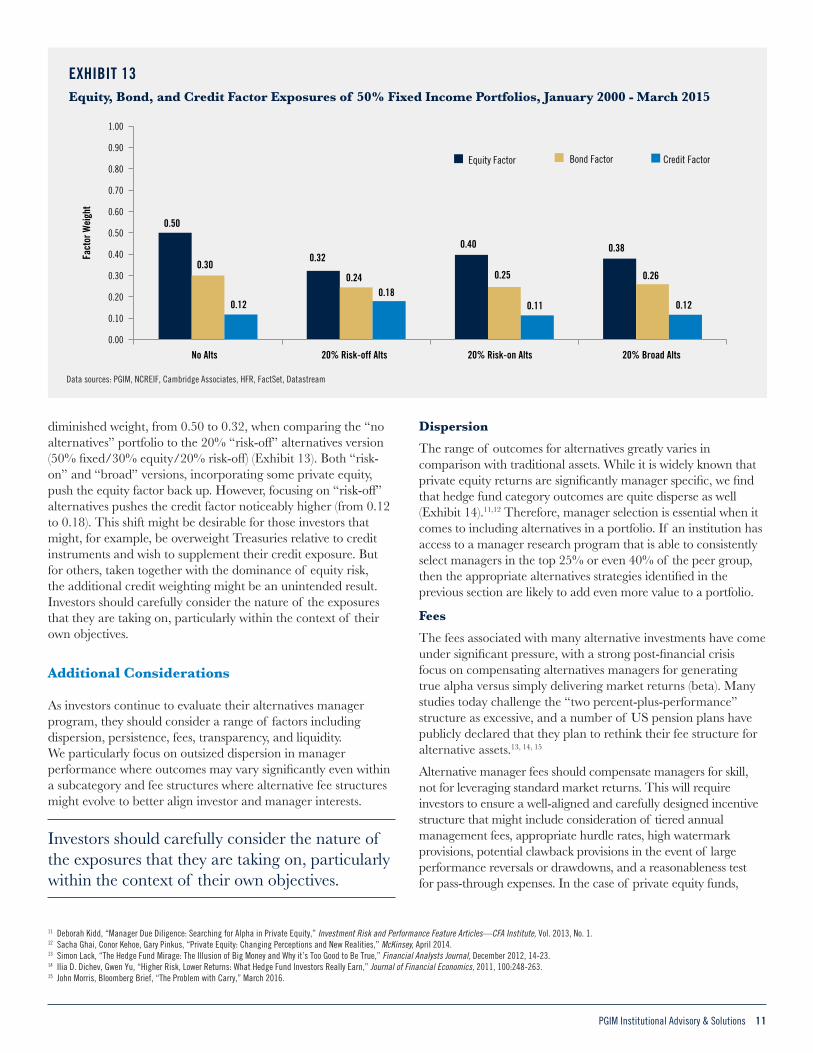
EXHIBIT 13Equity, Bond, and Credit Factor Exposures of 50% Fixed Income Portfolios, January 2000 - March 2015
Data sources: PGIM, NCREIF, Cambridge Associates, HFR, FactSet, Datastream
0.50
0.32 0.40 0.38
0.30 0.24 0.25 0.26
0.12 0.18
0.11 0.12
0.00
0.10
0.20
0.30
0.40
0.50
0.60
0.70
0.80
0.90
1.00
No Alts 20% Risk-off Alts 20% Risk-on Alts 20% Broad Alts
Fact
or W
eigh
t
Equity Factor Bond Factor Credit Factor
diminished weight, from 0.50 to 0.32, when comparing the “no alternatives” portfolio to the 20% “risk-off” alternatives version (50% fixed/30% equity/20% risk-off) (Exhibit 13). Both “risk-on” and “broad” versions, incorporating some private equity, push the equity factor back up. However, focusing on “risk-off” alternatives pushes the credit factor noticeably higher (from 0.12 to 0.18). This shift might be desirable for those investors that might, for example, be overweight Treasuries relative to credit instruments and wish to supplement their credit exposure. But for others, taken together with the dominance of equity risk, the additional credit weighting might be an unintended result. Investors should carefully consider the nature of the exposures that they are taking on, particularly within the context of their own objectives.
Additional Considerations
As investors continue to evaluate their alternatives manager program, they should consider a range of factors including dispersion, persistence, fees, transparency, and liquidity. We particularly focus on outsized dispersion in manager performance where outcomes may vary significantly even within a subcategory and fee structures where alternative fee structures might evolve to better align investor and manager interests.
Investors should carefully consider the nature of the exposures that they are taking on, particularly within the context of their own objectives.
DispersionThe range of outcomes for alternatives greatly varies in comparison with traditional assets. While it is widely known that private equity returns are significantly manager specific, we find that hedge fund category outcomes are quite disperse as well (Exhibit 14).11,12 Therefore, manager selection is essential when it comes to including alternatives in a portfolio. If an institution has access to a manager research program that is able to consistently select managers in the top 25% or even 40% of the peer group, then the appropriate alternatives strategies identified in the previous section are likely to add even more value to a portfolio.
FeesThe fees associated with many alternative investments have come under significant pressure, with a strong post-financial crisis focus on compensating alternatives managers for generating true alpha versus simply delivering market returns (beta). Many studies today challenge the “two percent-plus-performance” structure as excessive, and a number of US pension plans have publicly declared that they plan to rethink their fee structure for alternative assets.13, 14, 15
Alternative manager fees should compensate managers for skill, not for leveraging standard market returns. This will require investors to ensure a well-aligned and carefully designed incentive structure that might include consideration of tiered annual management fees, appropriate hurdle rates, high watermark provisions, potential clawback provisions in the event of large performance reversals or drawdowns, and a reasonableness test for pass-through expenses. In the case of private equity funds,
11 Deborah Kidd, “Manager Due Diligence: Searching for Alpha in Private Equity,” Investment Risk and Performance Feature Articles—CFA Institute, Vol. 2013, No. 1.12 Sacha Ghai, Conor Kehoe, Gary Pinkus, “Private Equity: Changing Perceptions and New Realities,” McKinsey, April 2014.13 Simon Lack, “The Hedge Fund Mirage: The Illusion of Big Money and Why it’s Too Good to Be True,” Financial Analysts Journal, December 2012, 14-23.14 Ilia D. Dichev, Gwen Yu, “Higher Risk, Lower Returns: What Hedge Fund Investors Really Earn,” Journal of Financial Economics, 2011, 100:248-263.15 John Morris, Bloomberg Brief, “The Problem with Carry,” March 2016.

12 PGIM Institutional Advisory & Solutions
investors will likely also include a discussion on the appropriate fee rates for committed versus invested capital, on whether the hurdle thresholds for carried interest are calculated on a deal-by-deal basis or at the aggregate fund level, and whether costs are being adequately shared between the primary fund and associated side-cars or co-investment vehicles.
Conclusion
Alternatives are far from homogenous, and allocation decisions need to be made at a more granular level. By applying a factor model to the alternative subcategory level, we find that many alternatives are exposed to a variety of market betas. While some of these exposures may have a place within total portfolio construction, others might be more efficiently accessed, at more reasonable fees, elsewhere. Based on our analysis, there are certain strategies that appear to have delivered significant alpha as well as attractive
diversification characteristics—real estate strategies as well as macro and relative value hedge funds fared particularly well on this score. But others, such as fund of funds and equity hedge strategies, demonstrated a high level of explainability, relatively stable factor weightings, and lower alpha, and as such might not, on average, contribute much to one’s overall portfolio. Our analysis was conducted with a select set of market factors, over a specific time period, and at a certain level of granularity. We would encourage investors to consider the factors most relevant to their own manager universe, as well as to their overall investment strategy, when determining the diagnostic approach that would be most helpful to them. The characteristics associated with specific strategies might prove to be either desirable or inadvisable to a given investor, depending on their overall investment profile and objectives. With this knowledge in hand, investors can properly address the role of alternatives in the context of their total portfolio.
EXHIBIT 14Annual Manager Dispersion from Median Performance by Asset Class Since 2000
Data source: eVestment
-30% -20% -10% 0% 10% 20% 30%
Equity Hedge
Event-Driven
Macro
Relative Value
Fund of Funds
US Large Cap Equity
Core Fixed Income
25th to 75th Percentile
5th to 95th Percentile

PGIM Institutional Advisory & Solutions 13
ACKNOWLEDGEMENTS
We gratefully acknowledge the suggestions and commentary from the following individuals.
Dr. Marco AiolfiClifford Axelson Edmund BellordDean Deonaldo Dr. Bjorn FlesakerDr. Taimur Hyat Jacqueline Jenkins Christopher Krug
Timothy Lalevee Michael LillardTed LockwoodLee MenifeeKaren McQuistonGregory PetersKeshav Rajagopalan
PGIM Institutional Advisory & SolutionsInstitutional Advisory & Solutions (IAS) is PGIM’s cross-asset class advisory group established to serve institutional clients both in the US and abroad. IAS’s primary objective is to provide tailored, value-added, multi-asset class advice for a variety of asset allocation, portfolio construction, and risk management topics. IAS works closely with CIOs, portfolio managers, researchers, and key client service professionals in the PGIM businesses and other areas of Prudential Financial, Inc. (PFI)16 in order to answer questions related to clients’ most pressing portfolio-level issues.
PGIMPGIM, the global investment management businesses of PFI, is a multi-manager that delivers industry-leading strategies and solutions to retail and institutional investors across all asset classes, including fundamental equity, quantitative equity, public and private fixed income, real estate, commercial mortgages, and mutual funds. With offices located in 16 countries across five continents, PGIM is among the top 10 largest asset managers in the world with $1 trillion in assets under management (as of 03/31/16).17
16 Prudential Financial, Inc. (PFI), a company with corporate headquarters in the US, is not affiliated in any manner with Prudential plc, a company incorporated in the United Kingdom. 17 Pensions & Investments Top Money Managers list, May 30, 2016; based on PFI total worldwide assets under management as of December 31, 2015.

14 PGIM Institutional Advisory & Solutions
HFRI Indices: HFRI indices are equally-weighted hedge fund performance indices reflecting a composite of investment manager performance. To be included into an HFRI index, a manager must report monthly returns, report net of all fee returns, report in USD, and have at least $50 million AUM or have been actively trading for at least 12 months. The HFRI indices are first published as estimates with three updates per month and then finalized after four months. Classification of investment managers in the HFR database are based on the “Strategy Classification System” which was revamped in 2008. The system is used to define pure strategy and sub-strategy buckets and was used to reflect the evolution of strategic trends in the hedge fund industry. As stated on the HFRI Database: A fund will be removed from an Index when: (a) it liquidates, (b) the fund manager requests removal from the Database, or (c) it fails to satisfy the requirements for constituency (outlined above). However, a fund’s past performance will always remain in its respective index up until the point of liquidation or manager-requested removal from HFR Database. In an effort to limit survivorship bias, HFR exhausts all efforts to receive a fund’s performance until the point of final liquidation. This convention provides the most robust characterization of results possible.18 The following HFRI index descriptions are taken directly from HFR.19 HFR Fund of Funds Composite Index: Fund of Funds invest with multiple managers through funds or managed accounts. The strategy designs a diversified portfolio of managers with the objective of significantly lowering the risk (volatility) of investing with an individual manager. The Fund of Funds manager has discretion in choosing which strategies to invest in for the portfolio. A manager may allocate funds to
numerous managers within a single strategy, or with numerous managers in multiple strategies. The minimum investment in a Fund of Funds may be lower than an investment in an individual hedge fund or managed account. The investor has the advantage of diversification among managers and styles with significantly less capital than investing with separate managers. The HFRI Fund of Funds index can be further broken down into the HFRI Conservative, Diversified, Market Defensive, and Strategic Funds of Funds indices. HFR Equity Hedge (Total) Index: Investment Managers who maintain positions both long and short in primarily equity and equity derivative securities. A wide variety of investment processes can be employed to arrive at an investment decision, including both quantitative and fundamental techniques; strategies can be broadly diversified or narrowly focused on specific sectors and can range broadly in terms of levels of net exposure, leverage employed, holding period, concentrations of market capitalizations and valuation ranges of typical portfolios. EH managers would typically maintain at least 50% exposure to, and may in some cases be entirely invested in, equities, both long and short. The HFRI Equity Hedge index includes the HFRI Equity Market Neutral, Fundamental Growth, Fundamental Value, Multi-Strategy, Quantitative Directional, Sector (Energy/ Basic Materials and Technology/Healthcare), and Equity Short Bias indices.
HFR Event-Driven (Total) Index: Investment Managers who maintain positions in companies currently or prospectively involved in corporate transactions of a wide variety including but not limited to mergers, restructurings, financial distress, tender offers, shareholder buybacks, debt exchanges, security issuance or other capital structure adjustments. Security types
APPENDIX 1
Fund Indices for Analysis
Data source: NCREIF, Cambridge Associates, HFR, FactSet, Datastream
ASSET CLASS ASSET TYPE INDEX SOURCEHedge Fund Fund of Funds HFR Fund of Funds Composite Index
Hedge Fund Equity Hedge HFR Equity Hedge (Total) Index
Hedge Fund Event-Driven HFR Event-Driven (Total) Index
Hedge Fund Macro HFR Macro (Total) Index
Hedge Fund Fixed Income Rel. Val. HFR Relative Value (Total) Index
Hedge Fund Fund Weighted HFR Fund Weighted Composite Index
Private Equity Venture Capital Cambridge Associates Venture Capital Index (Data Stream)
Private Equity Leveraged Buyout Cambridge Associates Leveraged Buyout Index (Data Stream)
Real Estate Core US NCREIF: ODCE
Real Estate Value-Add US NCREIF: Townsend Fund Returns - Value-Added NADJ
Real Estate Opportunistic US NCREIF: Townsend Fund Returns - Opportunistic NADJ
Equity US Large Cap Equity S&P 500 Index
Fixed Income US Agg Barclays US Aggregate Bond Index
18 HFR Indices – Basic Methodology and FAQ. https://www.hedgefundresearch.com/pdf/HFRI-HFRX_FAQ.pdf. 19 HFR Indices – Index Descriptions. https://www.hedgefundresearch.com/hfri-indices-index-descriptions.

PGIM Institutional Advisory & Solutions 15
can range from most senior in the capital structure to most junior or subordinated, and frequently involve additional derivative securities. Event-Driven exposure includes a combination of sensitivities to equity markets, credit markets and idiosyncratic, company specific developments. Investment theses are typically predicated on fundamental characteristics (as opposed to quantitative), with the realization of the thesis predicated on a specific development exogenous to the existing capital structure. The HFRI Event-Driven index includes the HFRI Activist, Credit Arbitrage, Distressed, Merger Arbitrage, Multi-Strategy, and Special Situations Event-Driven indices. HFR Macro (Total) Index: Investment Managers which trade a broad range of strategies in which the investment process is predicated on movements in underlying economic variables and the impact these have on equity, fixed income, hard currency and commodity markets. Managers employ a variety of techniques, both discretionary and systematic analysis, combinations of top down and bottom up theses, quantitative and fundamental approaches and long and short term holding periods. Although some strategies employ RV techniques, Macro strategies are distinct from RV strategies in that the primary investment thesis is predicated on predicted or future movements in the underlying instruments, rather than realization of a valuation discrepancy between securities. In a similar way, while both Macro and equity hedge managers may hold equity securities, the overriding investment thesis is predicated on the impact movements in underlying macroeconomic variables may have on security prices, as opposes to EH, in which the fundamental characteristics on the company are the most significant are integral to investment thesis. The HFRI Macro index includes the HFRI Active Trading, Commodity, Currency, Discretionary Thematic, Multi-Strategy, and Systematic Diversified Macro indices. HFR Relative Value (Total) Index: Investment Managers who maintain positions in which the investment thesis is predicated on realization of a valuation discrepancy in the relationship between multiple securities. Managers employ a variety of fundamental and quantitative techniques to establish investment theses, and security types range broadly across equity, fixed income, derivative or other security types. Fixed income strategies are typically quantitatively driven to measure the existing relationship between instruments and, in some cases, identify attractive positions in which the risk adjusted spread between these instruments represents an attractive opportunity for the investment manager. RV position may be involved in corporate transactions also, but as opposed to ED exposures, the investment thesis is predicated on realization of a pricing discrepancy between related securities, as opposed to the outcome of the corporate transaction. The HFRI Relative Value index includes the HFRI Fixed Income Asset Backed, Fixed Income Convertible Arbitrage, Fixed Income Corporate, Fixed Income Sovereign, Fixed Income Multi-Strategy, Volatility, and Yield Alternatives indices.
Cambridge Associates Indices: [Cambridge Associates’] benchmark database utilizes the quarterly unaudited and annual audited fund financial statements produced by the fund managers (GPs) for their Limited Partners (LPs). These documents are provided to Cambridge Associates by the fund managers themselves. Unlike other data providers, Cambridge Associates does not use Freedom of Information Act (FOIA) requests, regulatory filings, manager surveys, or press “scrapings” to obtain information. Cambridge Associates’ goal is to have a complete historical record of the quarterly cash flows and net asset values for all funds in the benchmarks. [Cambridge Associates] uses a number of paths to encourage fund managers to submit their data to [their] database: [their] clients for whom [they] provide private investment performance reporting, [their] research organization’s regular meetings with thousands of managers, [their] special projects designed to enhance existing benchmarks or launch new ones, [their] exclusive relationships with over ten globally-diverse fund manager associations, and finally, [their] exclusive relationships with Thomson Reuters and the Institutional Limited Partners Association (ILPA).20
NCREIF Indices: The NFI-ODCE, short for NCREIF Fund Index - Open End Diversified Core Equity, is the first of the NCREIF Fund Database products and is an index of investment returns reporting on both a historical and current basis the results of 33 open-end commingled funds pursuing a core investment strategy, some of which have performance histories dating back to the 1970s. The NFI-ODCE Index is capitalization-weighted and is reported gross of fees. Measurement is time-weighted. NCREIF will calculate the overall aggregated Index return.21 The Townsend indices are jointly produced by NCREIF and The Townsend Group. Value-Added and Opportunistic Fund indices demonstrate the general risk/return characteristics of the broad investment styles within real estate. The indices are designed to reflect the performance of funds available to US institutional investors, investing in private real estate equity/equity-oriented investments, without regard to geographic location. Opportunistic funds typically utilize high leverage, take on more market risk, and may invest domestically and/or internationally. Value-Added funds generally fall somewhere between opportunistic and Core funds. Indices represent gross of fee time-weighted returns of the Limited Partners in the respective funds weighted based on the Limited Partners’ weighted net invested capital of each fund.22
PGIM IAS recognizes that there are some significant drawbacks associated with the NCREIF Townsend Fund Returns indices. Reporting by managers is voluntary and returns are calculated based on the reported performance of the funds. The Townsend series ends Q3 2013. To project the index forward, we used the NCREIF CEVA fund for Value-Add and used beta adjusted leverage to model Opportunistic.
20 Cambridge Associates, U.S. Private Equity Index and Selected Benchmark Statistics. http://www.cambridgeassociates.com/wp-content/uploads/2015/05/Public-USPE-Benchmark-2014-Q4.pdf.21 NCREIF Fund Index Open-End Diversified Core (ODCE) Returns. https://www.ncreif.org/fund-index-odce-returns.aspx.22 Closed-End Real Estate Fund Indices and Vintage Period Performance Report. https://www.ncreif.org/news-single.aspx?post=219.

16 PGIM Institutional Advisory & Solutions
APPENDIX 2Factor Descriptions
PTFS Lookback Straddles: The bond trend, currency trend, and commodity trend series were developed by Fung and Hsieh using portfolio of straddles rolled every three months in order to proxy lookback straddles which are not exchange traded.23 This concept of lookback option was developed to provide a payout profile equal to the difference between the maximum and minimum price achieved by the underlying asset from inception to expiration. Trend followers should deliver returns resembling the portfolio of bills and lookback straddles as described in Fung, W. and D. Hsieh, 2001, “The Risk in Hedge Fund Strategies: Theory and Evidence From Trend Followers.”
The Primitive trend-following strategy (PTFS) “has the same payout as a structured option known as the “lookback straddle.” The owner of a lookback call option has the right to buy the underlying asset at the lowest price over the life of the option. Similarly, a lookback put option allows the owner to sell at the highest price. The combination of these two options is the lookback straddle, which delivers the ex post maximum payout of any trend-following strategy. Within this context, trend followers should deliver returns resembling those of a portfolio of bills and lookback straddles.” 24 These lookback straddles “can be replicated by dynamically rolling standard straddles over the life of the option.” 25 As lookback straddles are not exchange-traded contracts, the price was replicated by rolling a pair of standard straddles. The PTFS used in the analysis are a long position based on three-month straddles.
Bond Trend: Return of PTFS Bond Lookback Straddle. This PTFS portfolio is an equally weighted portfolio of the US 30 yr, the UK Gilt, the German Bund, the French 10 yr, and the Australian 10 yr.Currency Trend: Return of PTFS Currency Lookback Straddle. This PTFS portfolio is an equally weighted portfolio of the British Pound, the Deutsche Mark, the Japanese Yen, and the Swiss Franc.Commodity Trend: Return of PTFS Commodity Lookback Straddle. This PTFS portfolio is an equally weighted portfolio of Corn, Wheat, Soybean, Crude Oil, Gold, and Silver.Equity Market Factor: S&P 500 monthly excess returnSize Spread Factor: Russell 2000 monthly excess return less beta adjusted S&P 500 monthly excess returnsBond Market Factor: (Barclays US Aggregate Government) less (Treasury monthly excess return)Credit Spread Factor: (Barclays US Aggregate Credit - Corporate monthly excess return) less (beta adjusted Barclays US Aggregate Government - Treasury monthly excess return)Emerging Market Factor: MSCI Emerging Market monthly excess return less beta adjusted S&P 500 monthly excess returnREITs Factor: Dow Jones US Select Real Estate Securities monthly excess return less beta adjusted S&P 500 monthly excess returnMortgage Factor: (Barclays US Aggregate Securitized - MBS monthly excess returns) less (beta adjusted combination of Barclays US Aggregate Government - Treasury and Corporate spread returns)
23 William Fung and David Hsieh, “The Risk in Hedge Fund Strategies: Theory and Evidence from Trend Followers,” Review of Financial Studies, Vol. 14, No. 2, Summer, 2001, 313-341.24 Ibid.25 Ibid.
IMPORTANT INFORMATION The information contained herein is provided by PGIM, Inc., the principal asset management business of Prudential Financial, Inc. (PFI), and an investment adviser registered with the US Securities and Exchange Commission. PFI is not affiliated in any manner with Prudential plc, a company incorporated in the United Kingdom. These materials represent the views, opinions and recommendations of the author(s) regarding the economic conditions, asset classes, securities, issuers or financial instruments referenced herein. Distribution of this information to any person other than the person to whom it was originally delivered and to such person’s advisers is unauthorized, and any reproduction of these materials, in whole or in part, or the divulgence of any of the contents hereof, without prior consent of PGIM is prohibited. Certain information contained herein has been obtained from sources that PGIM believes to be reliable as of the date presented; however, PGIM cannot guarantee the accuracy of such information, assure its completeness, or warrant such information will not be changed. The information contained herein is current as of the date of issuance (or such earlier date as referenced herein) and is subject to change without notice. PGIM has no obligation to update any or all of such information; nor do we make any express or implied warranties or representations as to the completeness or accuracy or accept responsibility for errors. These materials are not intended as an offer or solicitation with respect to the purchase or sale of any security or other financial instrument or any investment management services and should not be used as the basis for anyEndnotes investment decision. Past performance is no guarantee or reliable indicator of future results. No liability whatsoever is accepted for any loss (whether direct, indirect, or consequential) that may arise from any use of the information contained in or derived from this report. PGIM and its affiliates may make investment decisions that are inconsistent with the recommendations or views expressed herein, including for proprietary accounts of PGIM or its affiliates. The opinions and recommendations herein do not take into account individual client circumstances, objectives, or needs and are not intended as recommendations of particular securities, financial instruments or strategies to particular clients or prospects. No determination has been made regarding the suitability of any securities, financial instruments or strategies for particular clients or prospects. For any securities or financial instruments mentioned herein, the recipient(s) of this report must make its own independent decisions.
© 2016 PFI and its related entities. PGIM, the PGIM logo, and the Rock symbol are service marks of PFI and its related entities, registered in many jurisdictions worldwide.
IAS 0621-100