‘pollution potential of cemeteries’ - r&d p223
TRANSCRIPT

AMENDMENT
Science Group: Air, Land and Water - March 2004
‘Pollution potential of cemeteries’ - R&D P223
In early 2004 a number of errors were noticed in the report on the ‘Pollution potential of cemeteries’R&D P223, which is available from the Agency’s National Customer Contact Centre (NCCC).These errors were in the calculations given as worked examples of pollutant loading in 3hypothetical cemeteries. The errors are therefore largely confined to Appendix B of the report. Anew edition of the report is now being sold as before by the NCCC however, for those who havealready purchased a copy the revised Appendix B and a short excerpt from Section 3. The mainchanges from the original version are highlighted in red.
The risk assessment methodology provided in the main report was not affected by these errors,however readers are advised that the examples and calculations below can offer only a flavour ofthe subject. In view of the increased availability of contaminant transport models since this reportwas prepared, site-specific model use is to be preferred where this is appropriate.
Copies of the revised Appendix B and Section 3 will be made available soon for download from theAgency’s Science & Research Publications web site:http://www.environment-agency.gov.uk/science/454158/110943/?version=1&lang=_e
This do
cumen
t is ou
t of d
ate an
d was
with
drawn (
14/03
/2017
)
3. CHARACTERISTICS OF CEMETERIES AS SOURCESOF POTENTIAL POLLUTION
3.1 Introduction
This section examines the possible contaminant loading that may be derived from burials inthe United Kingdom. The processes controlling the release of potential contaminants arecomplex, involving the interaction of hydrogeological and climatic factors, cemeterymanagement practices and variations in practices associated with the preparation of bodies forburial, for example coffin manufacturing and embalming processes.
In considering human interments, it is assumed that current UK practices are followedregarding the preparation of the body and in the method of burial. In particular:
• Embalming - that no toxic metals or alkaloid substances have been used inpreparation of corpses since 1951, when their use was banned. Half of all humanburials having undergone some embalming with a formalin solution;
• Coffins - constructed predominantly of chipboard or MDF with a paper veneer;
• Depth of single burial 1.8 m (bottom of coffin 1.8 metres below ground level).
For other interments it is assumed that:
• Burial of farm stock follows the Code of Good Agricultural Practice for theProtection of Water (MAFF 1998);
• Commercial burial of pets (pet cemeteries) is in accordance with the voluntary codeof conduct advanced by the Association of Private Pet Cemeteries and Crematoria;
• At green burial site the corpse is enclosed in a readily degradable coffin, or onlyshrouded in woollen cloth. Burial at depth of 1.3 metres. Grass or shrub cover tograve.
3.2 Potential pollution loads from human and animal burials
3.2.1 Composition of corpses and accompanying burial material
Table 3.1 illustrates that the composition of human and animal bodies is very similar,although there will be some variation as a consequence of differences in build betweenindividuals. Forbes (1987) estimated the broad elemental composition of the human body. Thecomposition, shown in Table 3.2, is consistent with the range of principal chemicalcontaminants found at cemeteries, as described in Chapter 2.
This do
cumen
t is ou
t of d
ate an
d was
with
drawn (
14/03
/2017
)
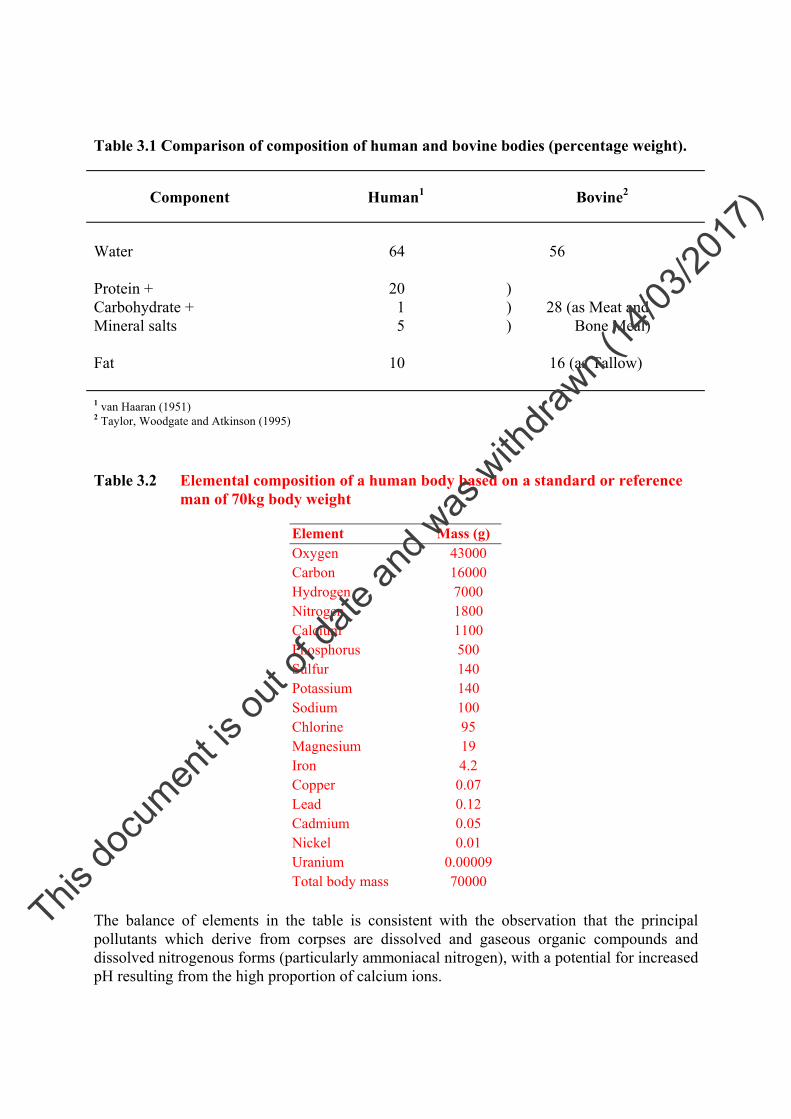
Table 3.1 Comparison of composition of human and bovine bodies (percentage weight).
Component Human1 Bovine2
Water 64 56
Protein + 20 )Carbohydrate + 1 ) 28 (as Meat andMineral salts 5 ) Bone Meal)
Fat 10 16 (as Tallow)
1 van Haaran (1951)2 Taylor, Woodgate and Atkinson (1995)
Table 3.2 Elemental composition of a human body based on a standard or referenceman of 70kg body weight
Element Mass (g)Oxygen 43000Carbon 16000Hydrogen 7000Nitrogen 1800Calcium 1100Phosphorus 500Sulfur 140Potassium 140Sodium 100Chlorine 95Magnesium 19Iron 4.2Copper 0.07Lead 0.12Cadmium 0.05Nickel 0.01Uranium 0.00009Total body mass 70000
The balance of elements in the table is consistent with the observation that the principalpollutants which derive from corpses are dissolved and gaseous organic compounds anddissolved nitrogenous forms (particularly ammoniacal nitrogen), with a potential for increasedpH resulting from the high proportion of calcium ions.
This do
cumen
t is ou
t of d
ate an
d was
with
drawn (
14/03
/2017
)

3.2.2 Factors affecting the rate of release of contaminants from burials
The process which controls the production, release and potential migration of pollutants fromburied corpses is microbial decay and is essentially the same as that which controls thestabilisation of wastes in landfills. Landfill decay processes are described in some detail inAppendix A of Waste Management Paper No 26A (Department of the Environment, 1993). Inthe case of landfilled wastes, the initial aerobic phase is completed rapidly and, because theinput of wastes exceeds the rate at which oxygen may gain access to the degrading mass, thegreater part of decomposition takes place under anaerobic conditions. The analogy withlandfilled putrescible waste is useful in assessing potential impacts and Dent and Knight,(1998) have remarked - “Cemeteries are best thought of as special kinds of landfill in thatthey mostly comprise a limited range of organic matter covered by soil fill”. However, acomparison of the elemental compositions of vertebrate bodies with typical domestic wastehighlights some important contrasts:
• The water content of a human body is about twice that of domestic refuse (65-70% ina corpse, compared to 34% in domestic waste). Lack of available moisture mayinhibit both aerobic and anaerobic decay (Department of the Environment, 1993).
• The C:N:P ratio in vertebrate cadavers (about 30:3:1) provides a good balancebetween the principal microbial nutrients; whereas the ratios in domestic wastesshow a deficiency in terms of phosphorus.
Both these factors encourage rapid and complete degradation of corpses, when compared withdomestic waste. The relative rate of degradation of different types of carbon compounds hasbeen estimated by the Environment and Industry Research Unit, Polytechnic of East London(1992). This indicates that 70% of the weight (including water) comprises rapidly degradableprotein, carbohydrates and lipids, with some 30% comprising resistant bone, enamel (teeth)and keratin (nails and hair). Allowing for a 70 kg corpse, buried in a 10 kg chipboard coffin,the proportions of readily to slowly degraded matter are recorded in Table 3.3.
Table 3.3 Proportions of readily and slowly degraded matter in a coffined humancorpse
Category %
Component Readilydegradable
Moderatelydegradable
Slowlydegradable
Inert (Non-degradable)
Human corpse 60 15 20* 5*
Note * Assumes mineral salts (ashes) represent final stable residue; slowly degradable component of bones may beconsidered essentially inert for practical purposes.
Farm or domestic animals and poultry corpses show degradation characteristics eithercomparable to those of a human or with increased proportions of less rapidly degraded tissues,particularly poultry feathers.
This do
cumen
t is ou
t of d
ate an
d was
with
drawn (
14/03
/2017
)

In human corpses that are not embalmed, aerobic bacteria are initially inhibited due tochanges in body tissues. The only exception is the skin surface which is exposed to theatmosphere. The principal agents of putrefaction are therefore anaerobic bacteria essentiallyakin to those found in solid waste degradation processes. However, the analogy with landfillis likely to cease as the decay products migrate from the grave, where they may encounteraerobic conditions within the ground. At a normal burial density the volume of soil adjacentto, and overlying, each coffin will be equal to some eight times the volume of the burial (seeAssumptions in Appendix B1).
Consequently, the zone in which anaerobic conditions persist during decay of the body islikely to be restricted to the immediate vicinity of the grave, particularly in the case of freedraining soils. Subsequent transformations of initial degradation products will be essentiallyaerobic. At sites where poor drainage causes waterlogging, rather more extensive anaerobicconditions may develop. The extent will, however, be a function of the rate of burials and theinitial oxygen content of the water accumulating in the ground. In contrast, at landfill sites thelarge relative mass and loading rate of decomposing waste creates long-term anaerobicconditions.
Manufacturers of embalming fluids claim that high index cavity and arterial embalming mayinhibit “wet” anaerobic degradation. Instead, dry aerobic decay is believed to take place.
Coffins and shrouds are composed of less rapidly degraded materials than the corpses whichthey enclose. Nevertheless, in modern burial practice chipboard and MDF coffins may beginto disintegrate rapidly in the ground compared with solid wooden boxes. Decay and collapseof chipboard coffins is reported to be evident within one month of burial, compared with 15 to20 years in the case of pine or over 60 years for elm boxes, whilst cardboard coffins arereported to collapse onto the cadaver almost immediately on infilling the grave (West, 1998).
The rate of decay is also influenced by climatic and physical factors, including:
(a) Climate - warm temperatures accelerate decomposition, whilst freezing will inhibit orsuspend the process;
(b) Soil lithology- a well drained soil, such as a coarse sand, will accelerate decomposition,whereas a poorly drained soil has the reverse effect. Peat bogs have been found toinhibit bacterial growth and bodies may remain preserved for thousands of years.
(c) Burial practice - including the depth of burial and construction of the coffin. Both thesefactors control the ease with which invertebrates and vertebrates may gain access to thecorpse and hasten its decay.
Table 3.4 illustrates the effects of burial conditions on the rate of decay.
Further details are given in Section 5.6 of the Project Record (P2/024/1).
This do
cumen
t is ou
t of d
ate an
d was
with
drawn (
14/03
/2017
)

Table 3.4 Condition of burial affecting decay rate
Condition of burial Timescale to skeleton Comment
Body unburied, without clothes 3 to 4 months Destruction by bacteriaand scavengers
Body unburied, fully clothed considerably shorterthan 3 to 4 months.
Agents of decay workfaster under cover.
Uncoffined body buried 2 metresdeep - in friable soil and body notembalmed
10 to 12 years Analogous to manymodern burials, withrapid collapse of coffin
Bodies buried deep outlast thosein shallow graves:0.5 m deep1.5 m deep
<1 year (months even)many years
Any increase in depthmakes a body lessaccessible to worms andmaggots.
Body wrapped in polythene Increases time todecompose
3.2.3 Potential contaminant release rates
Humans
A human corpse normally decays within a period of 10 to 12 years (Table 3.4). It is estimatedthat over half of the loading will be leached within the first year. In successive years there willbe a declining source term, in which half the residual loading is leached. After 10 years lessthan 0.1% of the original loading may remain. An example of such a potential release rate isgiven in Table 3.5.
A similar estimate of the release rate for formaldehyde can be made using figures from Davies(1998) and Soo Chan et al (1992). This would result in a potential total release ofapproximately 90g of formaldehyde per body. If all were leached in the first year it wouldresult in an effluent containing approximately 80 mg l-1 formaldehyde. Following the sourcedepletion term model, the concentration after 10 years would be estimated to be less than 20mg l-1. These estimates take no account of the natural degradation of formaldehyde in theground. The absence of reports of widespread groundwater contamination by formaldehydeleads to the conclusion that natural attenuation processes in the ground prevent contamination.
The embalming of bodies for green burial is discouraged. In view of the positive choice that ismade by persons wishing green burial (or on their behalf by relatives) it is concluded thatsuch burial sites do not provide a significant potential source of formaldehyde release.
This do
cumen
t is ou
t of d
ate an
d was
with
drawn (
14/03
/2017
)

Table 3.5 Potential annual release (kg) of principal components from a single 70 kgburial
Year TOC NH4
1 6.0 0.872 3.0 0.443 1.5 0.224 0.75 0.115 0.37 0.056 0.19 0.037 0.10 0.018 0.05 <0.019 0.02 <0.01
10 0.01 <0.01
The discussions in the previous section have focused on single burials, or possibly theinterment of a second body in a family grave (currently second burials in a family grave mayaccount for up to 40% of interments in large municipal cemeteries (Nash, 1997). In addition,common graves are still prepared in large cemeteries, in which such burials may represent2 or 3% of annual interments. Common graves are typically dug to 2.7 metres (9 feet), tocontain three coffins, each covered by 150 mm of soil above the lid before the next is placed.In some areas common graves may be extended to 3.4, 4.0 or 4.6 metres (11, 13 or 15 feet) toaccommodate 4, 5 or 6 burials. Common graves are normally completed (filled to the top)within one year of opening and the potential pollution load may be assessed by scaling fromthat associated with a single interment.
Animals
With respect to animal carcasses, it is suggested that the potential release rates are estimatedby the use of multiplier factors to account for the differences in body weight and burialpractices. Suggested conversion factors are given in Table 3.6
Table 3.6 Factors to modify human cadaver pollution indices to animal corpses
Animal type Weight factor(x human value)
Infiltration factor(x human grave size)
Cattle and horses 8 – 10 4Pigs 1 1Sheep 0.8 1Dog 0.15 0.25Cat 0.03 0.1
This do
cumen
t is ou
t of d
ate an
d was
with
drawn (
14/03
/2017
)
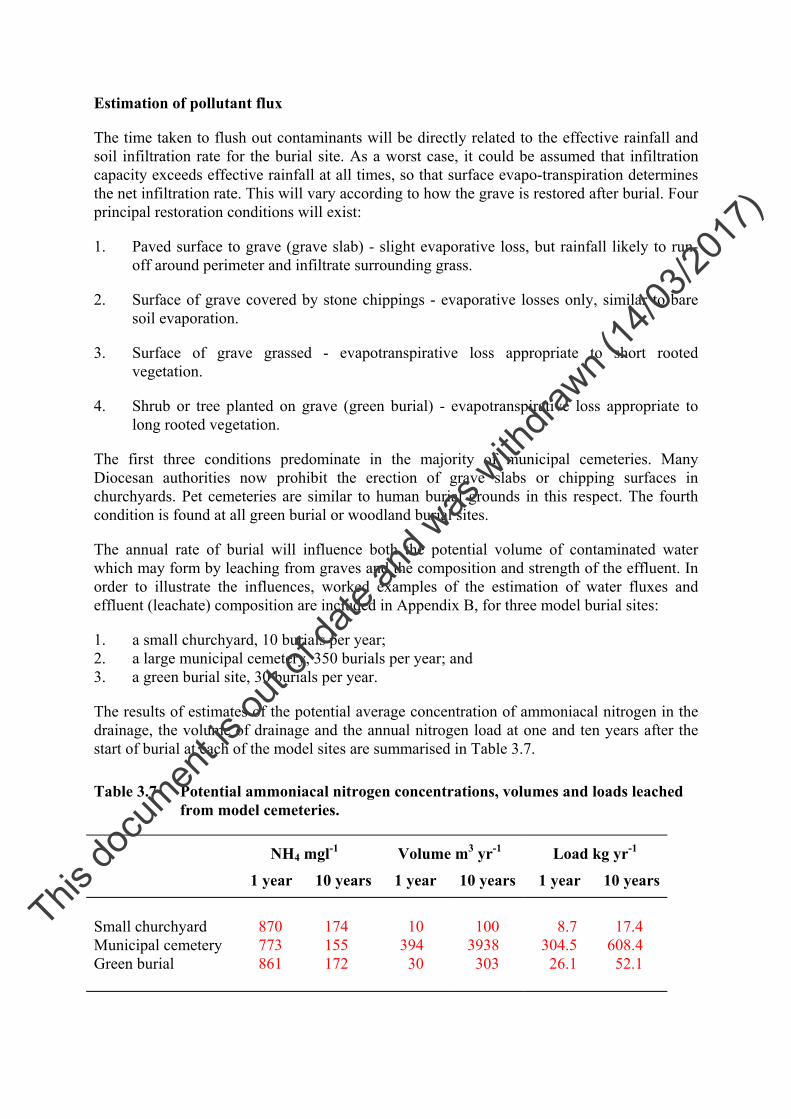
Estimation of pollutant flux
The time taken to flush out contaminants will be directly related to the effective rainfall andsoil infiltration rate for the burial site. As a worst case, it could be assumed that infiltrationcapacity exceeds effective rainfall at all times, so that surface evapo-transpiration determinesthe net infiltration rate. This will vary according to how the grave is restored after burial. Fourprincipal restoration conditions will exist:
1. Paved surface to grave (grave slab) - slight evaporative loss, but rainfall likely to run-off around perimeter and infiltrate surrounding grass.
2. Surface of grave covered by stone chippings - evaporative losses only, similar to baresoil evaporation.
3. Surface of grave grassed - evapotranspirative loss appropriate to short rootedvegetation.
4. Shrub or tree planted on grave (green burial) - evapotranspirative loss appropriate tolong rooted vegetation.
The first three conditions predominate in the majority of municipal cemeteries. ManyDiocesan authorities now prohibit the erection of grave slabs or chipping surfaces inchurchyards. Pet cemeteries are similar to human burial grounds in this respect. The fourthcondition is found at all green burial or woodland burial sites.
The annual rate of burial will influence both the potential volume of contaminated waterwhich may form by leaching from graves and the composition and strength of the effluent. Inorder to illustrate the influences, worked examples of the estimation of water fluxes andeffluent (leachate) composition are included in Appendix B, for three model burial sites:
1. a small churchyard, 10 burials per year;2. a large municipal cemetery, 350 burials per year; and3. a green burial site, 30 burials per year.
The results of estimates of the potential average concentration of ammoniacal nitrogen in thedrainage, the volume of drainage and the annual nitrogen load at one and ten years after thestart of burial at each of the model sites are summarised in Table 3.7.
Table 3.7 Potential ammoniacal nitrogen concentrations, volumes and loads leachedfrom model cemeteries.
NH4 mgl-1 Volume m3 yr-1 Load kg yr-1
1 year 10 years 1 year 10 years 1 year 10 years
Small churchyard 870 174 10 100 8.7 17.4Municipal cemetery 773 155 394 3938 304.5 608.4Green burial 861 172 30 303 26.1 52.1
This do
cumen
t is ou
t of d
ate an
d was
with
drawn (
14/03
/2017
)

Comparison of the estimates for the three scenarios indicates only a small difference inpredicted average effluent concentrations, apparently suggesting comparable threats to waterquality. However, if for the three scenarios, the total mass loadings of nitrogen are consideredin terms of in terms of kg NH4 yr-1 (Table 3.8) the greater potential impact of the largecemetery is clearly illustrated.
Table 3.8 Changes in ammonia release (kg (NH4) yr-1) from model cemeteries duringfirst ten years operation
Year 1 2 3 4 5 6 7 8 9 10
Small cemetery 8.7 13.1 15.3 16.4 16.9 17.1 17.2 17.3 17.4 17.4Large cemetery 305 459 532 571 590 600 604 607 608 608Green burial 26 39 46 49 51 51 52 52 52 52
Notes: Times for model cemeteries to cover 1 hectare: small churchyard 198 years; large municipal cemetery 5.6 years;green burial site 52.7 years.
This do
cumen
t is ou
t of d
ate an
d was
with
drawn (
14/03
/2017
)
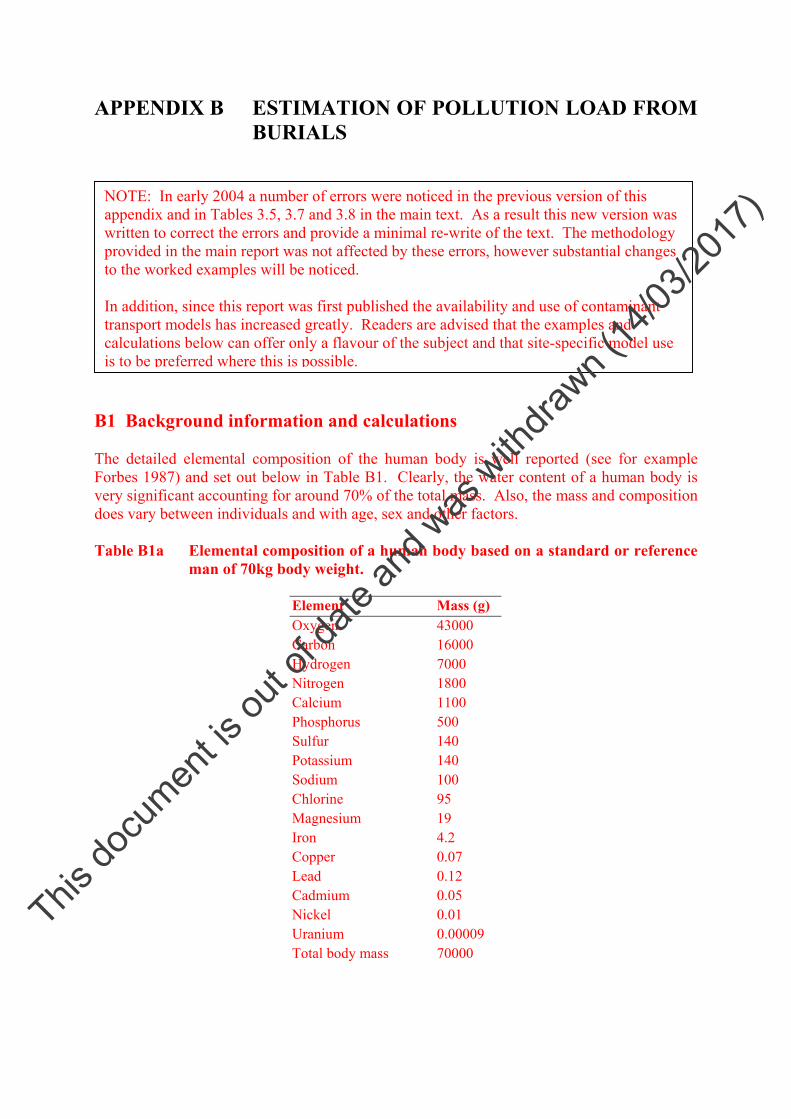
APPENDIX B ESTIMATION OF POLLUTION LOAD FROMBURIALS
B1 Background information and calculations
The detailed elemental composition of the human body is well reported (see for exampleForbes 1987) and set out below in Table B1. Clearly, the water content of a human body isvery significant accounting for around 70% of the total mass. Also, the mass and compositiondoes vary between individuals and with age, sex and other factors.
Table B1a Elemental composition of a human body based on a standard or referenceman of 70kg body weight.
Element Mass (g)Oxygen 43000Carbon 16000Hydrogen 7000Nitrogen 1800Calcium 1100Phosphorus 500Sulfur 140Potassium 140Sodium 100Chlorine 95Magnesium 19Iron 4.2Copper 0.07Lead 0.12Cadmium 0.05Nickel 0.01Uranium 0.00009Total body mass 70000
NOTE: In early 2004 a number of errors were noticed in the previous version of thisappendix and in Tables 3.5, 3.7 and 3.8 in the main text. As a result this new version waswritten to correct the errors and provide a minimal re-write of the text. The methodologyprovided in the main report was not affected by these errors, however substantial changesto the worked examples will be noticed.
In addition, since this report was first published the availability and use of contaminanttransport models has increased greatly. Readers are advised that the examples andcalculations below can offer only a flavour of the subject and that site-specific model useis to be preferred where this is possible.
This do
cumen
t is ou
t of d
ate an
d was
with
drawn (
14/03
/2017
)

Table B1b Structural composition of a human body based on a standard or referenceman of 70kg body weight.
Tissue Mass (g)Total body mass 70000Skeletal muscle 28000Adipose tissue 15000Bone 5000Cartilage 1100Periarticular tissue 900Marrow 3000Skin 4900Liver 1800Brain 1400
Unsurprisingly then much of the human corpse is very amenable to biological degradation byboth micro-organisms and scavengers. This is promoted by:
• an attractive elemental composition with macro- and micro- nutrients• a readily utilisable chemical composition (e.g. protein, fats, fixed nitrogen and water)• a relatively small proportion of slowly degradable or inert material (e.g. bones,
enamel).
Table B2 Proportions of degradable material of a coffined human body
Degradability PercentageHigh 60Moderate 15Slow 20Inert 5
Estimation of the potential pollution which may result from an interment may be made basedon the data above and in the main body of this report and, crucially by making a range ofassumptions about the release of chemicals to the wider environment.
Assumptions
Burials areas: 800 burials per acre = 1976 per ha = 5.06 m2 per burial plotGreen burials areas: 1580 per hectare = 6.33m2 per burial plotBurials volumes: As above to a depth of 1.8m = 9.10m3 per burialGrave dimensions: 2.1 x 1.2 x 1.8m = 4.54m3 per grave dugCoffin dimensions: a) 2.1 x 1.2 x 0.4m = 1.01m3 – rectangular casket
b) 2.1 x 0.75 x 0.4m = 0.63m3 – tapered coffinBody mass 70kgCoffin mass 10kgInterred mass: 70kg body plus 10kg coffin = 80kgSoil density: 1.6 tonnes per m3
This do
cumen
t is ou
t of d
ate an
d was
with
drawn (
14/03
/2017
)

Hence burials represent between 5% and 11% of a cemetery volume to the 1.8m burial depthand about 0.6% of the mass.
B2 Potential releases from a single human burial
Table 3.4 (p25 of main report) notes that modern burials would degrade to skeleton in 10 –12years. Assuming that 75% of the carbonaceous body mass is readily degraded (Table B2)and hence that this represents the ten-year leachable fraction a simple one year half-liferepresentation of leach masses per year is calculated in Table B3 below. Note that the tableaddresses Nitrogen as ammoniacal and Sulfur as sulfate for ease of comparison with normalsite analytical data. Note also that this table in effect provides a simple reference but that thereader may prefer to use a structured contaminant transport model instead such as CONSIM.
Comparisons
These are included here for completeness as such calculations were part of the original version of thisAppendix.
Volume comparison
Burial volume: a) 1976 x 1.01m3 = 1995m3
b) 1976 x 0.63m3 = 1245m3
(green burials): b) 1580 x 0.63m3 = 995m3
Land volume: 100 x 100 x 1.8m = 18000m3
Soil volumes: a) 18000 – 1995m3 = 16005m3
b) 18000 – 1245m3 = 16755m3
(green burials) b) 18000 – 995m3 = 17005m3
Mass comparisons
Burial mass: 1976 x 80kg = 158 tonnes(green burials): 1580 x 80kg = 126t
Soil mass: a) 16005 x 1.6 = 25608tb) 16755 x 1.6 = 26808t
(green burials) b) 17005 x 1.6 = 27208t
This do
cumen
t is ou
t of d
ate an
d was
with
drawn (
14/03
/2017
)

Table B3 Example annual potential releases from a single human burial
Potential mass release (g)Year C NH4 P SO4 Cd Ni
1 6000.0 870.0 250.0 210.0 0.01875 0.003752 3000.0 435.0 125.0 105.0 0.009 0.0023 1500.0 217.5 62.5 52.5 0.005 0.0014 750.0 108.8 31.3 26.3 0.002 0.0005 375.0 54.4 15.6 13.1 0.001 0.0006 187.5 27.2 7.8 6.6 0.001 0.0007 93.8 13.6 3.9 3.3 0.000 0.0008 46.9 6.8 2.0 1.6 0.000 0.0009 23.4 3.4 0.98 0.82 0.000 0.000
10 11.7 1.7 0.49 0.41 0.000 0.000
B3 Estimation of flux of water
Assuming a mean annual rainfall of 650 mm (typical of much of central and southern lowlandEngland) typical annual evapotranspirative losses and infiltration values would be:
Surface type Evapotranspiration(mm yr-1)
Infiltration(mm yr-1)
Chippings 350 300Grass 450 200Trees / shrubs 550 100
The dimensions of a standard grave are 1.2 by 2.1 metres (2.5 m2), so that in one year thevolume of infiltrating water based on the above would be as below.
Surface type Annual volume, litres
Chippings 750Grass 500
Trees/shrubs 250
Application of such infiltration estimates to the release of ammonia predicted fromconsideration of the elemental composition of the human body and table B3 suggests initialconcentrations of the order of 1.17 to 3.5 g l-1 of ammonia in the effluent. Clearly, asignificant concentration comparable to landfill leachate.
However, lateral flows and dispersion within the unsaturated zone is likely to mix theproducts of decay with water infiltrating through the areas separating individual graves. Agrave population of 2470 per hectare (1000 per acre) is commonly assumed, but in practicalterms, making allowance for driveways, paths etc., then for municipal cemeteries the value iscloser to 1976 per hectare (800 per acre). Hence, each grave may be considered to be centred
This do
cumen
t is ou
t of d
ate an
d was
with
drawn (
14/03
/2017
)

in an area of about 5.06 m2. For green burial sites usage is about 80% of that at typical lawn(municipal) cemeteries, that is about 1580 per hectare (640 per acre), so each has acontributing area of 6.32 m2. The annual infiltration volume for each grave area may then beestimated assuming that the areas between graves are grass covered):
Grave cover Surfaceinfiltration (l yr-1)
Infiltration from grasssurrounds (l yr-1)
Total(l yr-1)
Chippings 750 500 1250Grass 500 500 1000Green burial 250 760 1010
B4 Estimation of pollutant load from cemeteries
The approximations above may then be used to estimate the potential composition of effluentreaching the water table beneath a burial ground. Three scenarios are examined below, basedon the assumptions with respect to timing and rate of contaminant release (Table B3) and forthe model values of rainfall and evapotranspiration employed above. The scenarios are:
1. Small churchyard, 10 burials per year, graves and surrounds all grass covered;
2. Large municipal cemetery 350 burials per year, grave cover of half grass cover/halfchippings and surrounds all grass;
3. Green burial site, 30 burials per year. Grave cover of shrubs and surrounds as grass.
Note that the assumptions regarding the rate and duration of release of potential contaminantsimply that after ten years, at a constant annual burial rate, the annual release of contaminantswill reach equilibrium. However, since the area of burials will continue to expand, thepredicted concentrations averaged over the whole burial ground will continue to decrease.
Country churchyard
The predicted burials area, annual volume of effluent produced and predicted concentrationsfor ammonia in the effluent for a burial ground accepting 10 per year are listed in Table B4.
Table B4 Example of estimates of effluent concentrations, small burial ground
Year Cumulativeburials
Cumulative burialsarea (m2)
Annual effluentproduction (l)
Annual leachedmass NH4 (g)
Mean concentrationNH4 (mg l-1)
1 10 51 10000 8700 8702 20 101 20000 13050 6533 30 152 30000 15225 5084 40 202 40000 16313 4085 50 253 50000 16856 3376 60 304 60000 17128 2857 70 354 70000 17264 2478 80 405 80000 17332 2179 90 455 90000 17366 193
10 100 506 100000 17383 174
This do
cumen
t is ou
t of d
ate an
d was
with
drawn (
14/03
/2017
)

Large municipal cemetery
The predicted areas, volumes and concentrations for a municipal cemetery receiving 350burials per year are shown in Table B5.
Table B5 Example of estimates of effluent concentrations, large municipal cemetery
Year Cumulativeburials
Cumulative burialsarea (m2)
Annual effluentproduction (l)
Annual leachedmass NH4 (g)
Mean NH4 concentration(mg l-1)
1 350 1771 393750 304500 7732 700 3542 787500 456750 5803 1050 5313 1181250 532875 4514 1400 7084 1575000 570938 3635 1750 8855 1968750 589969 3006 2100 10626 2362500 599484 2547 2450 12397 2756250 604242 2198 2800 14168 3150000 606621 1939 3150 15939 3543750 607811 172
10 3500 17710 3937500 608405 155
Green (woodland) burial ground
The predicted areas, volumes and concentrations for a green burial ground receiving 30burials per year are shown in Table B6.
Table B6 Example of estimates of effluent concentrations, green (woodland) burialground
Year Cumulativeburials
Cumulative burialsarea (m2)
Annual effluentproduction (l)
Annual leachedmass NH4 (g)
Mean NH4 concentration(mg l-1)
1 30 190 30300 26100 8612 60 380 60600 39150 6463 90 570 90900 45675 5024 120 760 121200 48938 4045 150 950 151500 50569 3346 180 1139 181800 51384 2837 210 1329 212100 51792 2448 240 1519 242400 51996 2159 270 1709 272700 52098 191
10 300 1899 303000 52149 172
Formaldehyde
Estimation of the possible release of formaldehyde from embalming can be made assuming:
• an average of 9 litres of 2% formalin solution is used per body (Davies, 1998)
This do
cumen
t is ou
t of d
ate an
d was
with
drawn (
14/03
/2017
)
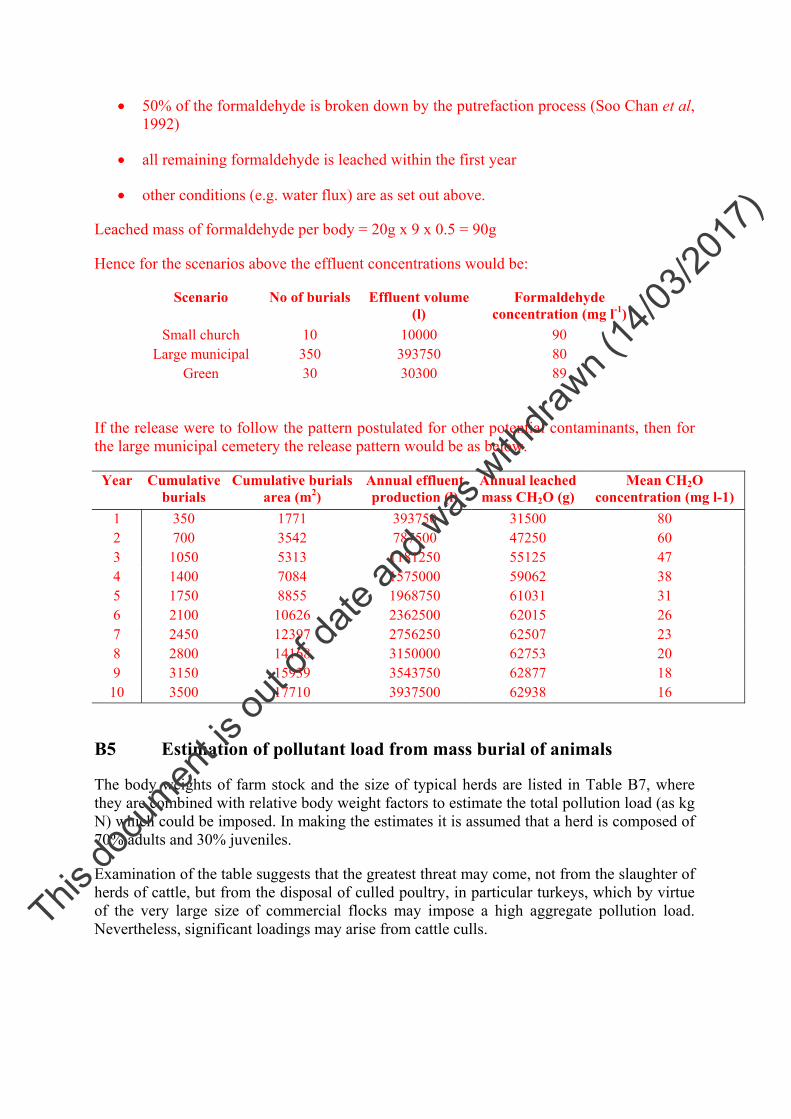
• 50% of the formaldehyde is broken down by the putrefaction process (Soo Chan et al,1992)
• all remaining formaldehyde is leached within the first year
• other conditions (e.g. water flux) are as set out above.
Leached mass of formaldehyde per body = 20g x 9 x 0.5 = 90g
Hence for the scenarios above the effluent concentrations would be:
Scenario No of burials Effluent volume(l)
Formaldehydeconcentration (mg l-1)
Small church 10 10000 90Large municipal 350 393750 80
Green 30 30300 89
If the release were to follow the pattern postulated for other potential contaminants, then forthe large municipal cemetery the release pattern would be as below.
Year Cumulativeburials
Cumulative burialsarea (m2)
Annual effluentproduction (l)
Annual leachedmass CH2O (g)
Mean CH2Oconcentration (mg l-1)
1 350 1771 393750 31500 802 700 3542 787500 47250 603 1050 5313 1181250 55125 474 1400 7084 1575000 59062 385 1750 8855 1968750 61031 316 2100 10626 2362500 62015 267 2450 12397 2756250 62507 238 2800 14168 3150000 62753 209 3150 15939 3543750 62877 18
10 3500 17710 3937500 62938 16
B5 Estimation of pollutant load from mass burial of animals
The body weights of farm stock and the size of typical herds are listed in Table B7, wherethey are combined with relative body weight factors to estimate the total pollution load (as kgN) which could be imposed. In making the estimates it is assumed that a herd is composed of70% adults and 30% juveniles.
Examination of the table suggests that the greatest threat may come, not from the slaughter ofherds of cattle, but from the disposal of culled poultry, in particular turkeys, which by virtueof the very large size of commercial flocks may impose a high aggregate pollution load.Nevertheless, significant loadings may arise from cattle culls.This do
cumen
t is ou
t of d
ate an
d was
with
drawn (
14/03
/2017
)
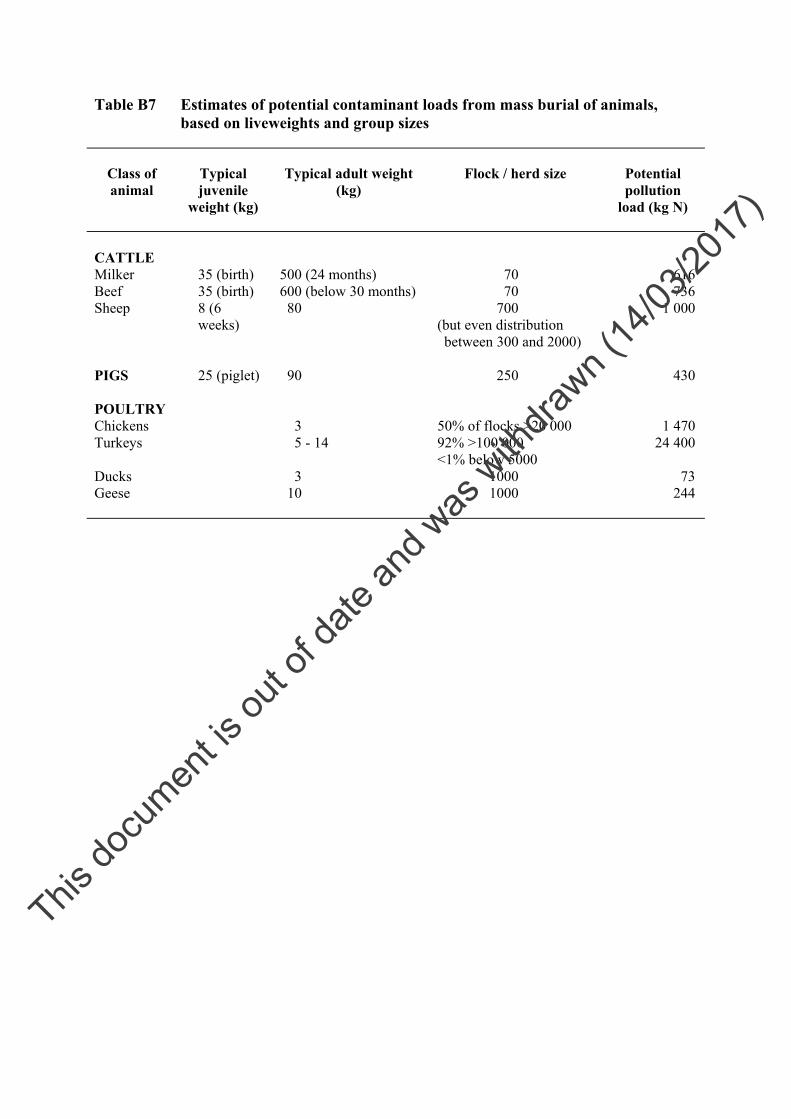
Table B7 Estimates of potential contaminant loads from mass burial of animals,based on liveweights and group sizes
Class ofanimal
Typicaljuvenile
weight (kg)
Typical adult weight(kg)
Flock / herd size Potentialpollution
load (kg N)
CATTLEMilker 35 (birth) 500 (24 months) 70 616Beef 35 (birth) 600 (below 30 months) 70 736Sheep 8 (6
weeks)80 700
(but even distributionbetween 300 and 2000)
1 000
PIGS 25 (piglet) 90 250 430
POULTRYChickens 3 50% of flocks >20 000 1 470Turkeys 5 - 14 92% >100 000
<1% below 500024 400
Ducks 3 1000 73Geese 10 1000 244
This do
cumen
t is ou
t of d
ate an
d was
with
drawn (
14/03
/2017
)