poland - xmission wikiwiki.xmission.com/images/b/be/fxinvpres20120620.pdf · 742,265 . 1.4% current...
TRANSCRIPT

1
A Unique Play on the Strong European Gas Market
June 2012
POLAND

NASDAQ: FXEN 2
Corporate Headquarters FX Energy, Inc. 3006 Highland Drive Salt Lake City, UT 84106 Ph: (801) 486-5555 website: www.fxenergy.com Contact Scott Duncan VP Investor Relations [email protected]
• NASDAQ Symbol: FXEN • Market Cap: $290 million @ $5.50/sh • 50 day avg. volume 270,000 shares/day • 52 week price range $3.67 - $10.27 • Institutional ownership 42% • Officer/director ownership 6.0% (6.6% fully diluted) • Shares outstanding 52.9 million • Fully diluted 53.6 million
FORWARD LOOKING STATEMENTS This presentation contains forward-looking statements within the meaning of the Private Securities Litigation Reform Act of 1995, including with respect to potential and probable reserves, cash flow, value, risked value, timing of drilling and exploration activities and revenue projections. These statements relate to future events or to future financial performance and involve known and unknown risks, uncertainties and other factors that may cause actual results, levels of activity, performance or achievements to be materially different from any future results, levels of activity, performance or achievements expressed or implied by these forward-looking statements. You should not place undue reliance on these forward-looking statements because they involve known and unknown risks, uncertainties and other factors that are, in some cases, beyond our control and that might materially affect actual results, levels of activity, performance or achievements. For example, exploration, drilling, development, construction or other projects or operations may be subject to the successful completion of technical work; environmental, governmental or partner approvals; equipment availability, or other things that are or may be beyond the control of the Company. The Company’s exploration or development operations that are anticipated, planned or scheduled may be changed, delayed, take longer than expected, fail to accomplish intended results, or not take place at all. In carrying out exploration it is necessary to identify and evaluate risks and potential rewards. This identification and evaluation is informed by science but remains inherently uncertain. Subsurface features that appear to be possible traps may not exist at all, may be smaller than interpreted, may not contain hydrocarbons, may not contain the quantity or quality estimated, or may have reservoir conditions that do not allow adequate recovery to render a discovery commercial or profitable. Forward looking statements about the size, potential or likelihood of discovery with respect to exploration targets are certainly not guarantees of discovery or of the actual presence or recoverability of hydrocarbons, or of the ability to produce in commercial or profitable quantities. Estimates of potential typically do not take into account all the risks of drilling and completion nor do they take into account the fact that hydrocarbon volumes are never 100% recoverable. Such estimates are part of the complex process of trying to measure and evaluate risk and reward in an uncertain industry. Other factors that could materially affect actual results, levels of activity, performance or achievement can be found in the Company’s Annual Report on Form 10-K filed on March 12, 2012 and in the documents incorporated therein by reference. If any of these risks and uncertainties develop, or if any of our underlying assumptions prove to be incorrect, out actual results, levels of activity, performance or achievement may vary significantly from what we projected. Any forward looking statement contained in or made during this presentation reflects the Company’s current views with respect to such future events and is subject to these and other risks, uncertainties and assumptions. We assume no obligation to publicly update or revise these forward-looking statements for any reason, whether as a result of new information, future events or developments or otherwise.
FX Energy Corporate Information
Prepared: June 21, 2012; Printed: June 22, 2012

NASDAQ: FXEN
6.6%
42.3%
51.1%
Ownership by Shareholder Category
Officers andDirectors
Institutional
Retail
$50.0 $30.0
$15.0
2012 Liquidity Sources (millions)
Cash
Cash Flow
BankProceeds
Major Institutional Shareholders as of 3/31/2012 Financial Information as of 3/31/2012
Shareholder Split – Shares Outstanding
Number of Shares % Holding Vanguard Group, Inc. 2,781,788 5.2% BlackRock Fund Advisors 2,762,339 5.2% Erste Asset Management 1,290,202 2.4% Jennison Associates LLC 1,246,882 2.4% Clear Harbor Asset Management LLC 1,243,042 2.3% Wellington Shields & Co 1,097,499 2.0% Harris Investment Management, Inc. 1,021,508 1.9% State Street Global Advisors 1,010,450 1.9% Odey Asset Management LLP 973,479 1.8% Goldman Sachs & Co. 805,770 1.4% Northern Trust 742,265 1.4% BlackRock Advisors LLC 726,630 1.4% ING Investment Mgt. Co. 641,190 1.2% Tom Lovejoy 879,163 1.4% David Pierce 563,963 1.1% Ordinary Shares Outstanding 52,926,098 Options 668,129 Fully Diluted Shares 53,579,227
3
Corporate Overview Balance Sheet Data ($mm)
unaudited 03/31/12
Audited 12/31/11
Current assets $58.9 $60.2
Property, net 54.3 47.9
Other assets 2.1 2.1
Total assets $115.3 $110.2
Current liabilities $9.1 $10.4
Long term debt 40.0 40.0
Other long term 1.3 1.2
Shldrs Equity 64.9 58.6
Total $115.3 $110.2
Income Statement Data ($mm) unaudited
unaudited
1Q12 1Q11
Total revenues $8.6 $7.1
Operating Costs 1.5 0.9
Exploration Costs 3.0 2.9
Non-cash expenses 1.5 1.1
G&A 1.9 2.0
Total Costs 7.9 6.9
Operating income $0.7 $0.3
Cash flow is after G&A but before exploration and development
(fully diluted)

NASDAQ: FXEN 4
Oil & Gas Concessions in Poland
FX has “first mover” advantage in conventional exploration in Poland
• Largest foreign acreage holder • Built an interactive database of nearly
2000 wells along with 2D/3D seismic
FX is producing and exploring for conventional fields with high value
• One of only two producers in Poland • Balanced portfolio of low and high
risk prospects • Current and near term production
benefits from favorable prices
Most recent arrivals in Poland are exploring for unconventional shale gas
Fences Concession PGNiG; FX Energy Poland
shale gas only
Conventional plus some shale gas
Tornquist Line

NASDAQ: FXEN 5
FX Energy Today Significant assets
• 25 licenses in Poland covering 3.6 million net acres (over 14,000 km2) • $300 million NAV (reserves(1) + net cash); $5.67/share NAV – before prospect and acreage value
Strong growth in production and revenues continues • 2011 production: 12 Mmcfe/d (322 Mcme/d) average net to FX; net revenues of approx. $26mm • 2012 production: add 5 Mmcf/d additional (est.) from wells already drilled at KSK and Winna Gora • 2013 production: add 4 Mmcf/d additional (est.) from last year’s Lisewo-1 discovery + Lisewo-2
High European gas prices boost revenues • FX 2012 full year wellhead price est. $8.44/mmbtu(2)
Major increase in drilling activity – potential for significant discoveries • $60-$70 million capex planned for 2012 operations – similar budget anticipated for 2013 and 2014 • Up to 7 wells planned to test in the second half of 2012 • 4 of these wells will test prospects that could (fully developed) multiply company reserves • A major step up from FX’s average 1.5 wells per year over the past 8 years
Note: (1) As per RPS Energy and Hohn Engineering
(2) FX 2012 est. based on $1=pln3.35 avg. for 2012; at 6/20/2012 $1 ≈ PLN 3.4

WHY POLAND?
6
Sound economy; rule of law
Untapped conventional resources
Strong gas market
Attractive economics

NASDAQ: FXEN 7
Size: 312,000 sq. km (120,000 sq. mi.); comparable to Germany - or New Mexico
Population: 38 million people; well educated, multi-lingual, culturally homogeneous; (Germany has 80 million; France has 60 million)
Political stability: Poland is a member of the European Union (EU) and NATO; it has a long history of adhering to the rule of law
Economy:
• Poland is Europe’s sixth largest economy
• Poland has its own currency (zloty) and its own central bank
• Poland’s GDP has continued to grow steadily despite recession in the rest of the EU
Poland: Stable & Growing in the EU

NASDAQ: FXEN
North European
Permian Basin
150 Tcf 4.0 Tcm
40 Tcf 1.1 Tcm
60 Tcf 1.6 Tcm
5 Tcf 0.1 Tcm
Poland has significant hydrocarbon potential
• Geology doesn’t stop at the border; Poland is just under-explored
• Permian Basin extends across Europe: Permian (Rotliegend) gas fields in Poland are direct analogs to those found in the UK and Dutch sectors of the Southern North Sea and onshore Holland and Germany
• Only one company (state owned) was exploring Poland during the Iron Curtain decades
• The North Sea was (and is) explored by dozens of companies
FX
8
Untapped Resources in Poland

NASDAQ: FXEN 9
Europe imports 1/2 of its gas supply from Russia
Poland imports 2/3 of its gas supply from Russia/Gazprom • Domestic production: 430 Mmcf/day; 156 Bcf/year (11,500 mcm/day; 4.2 bcm/year) • Imports: 1.0 Bcf/day; 377 Bcf/year; (27,000 mcm/day; 10.1 bcm/year)
Russian gas exports get interrupted or withheld • Politics, limited infrastructure, and tough business practices are common reasons
Russian gas prices are tied to oil
LNG is too small to shift the balance
Gas Supply is Tight
Nord Stream now operational
10
Gas Prices Are High and Holding
NASDAQ: FXEN
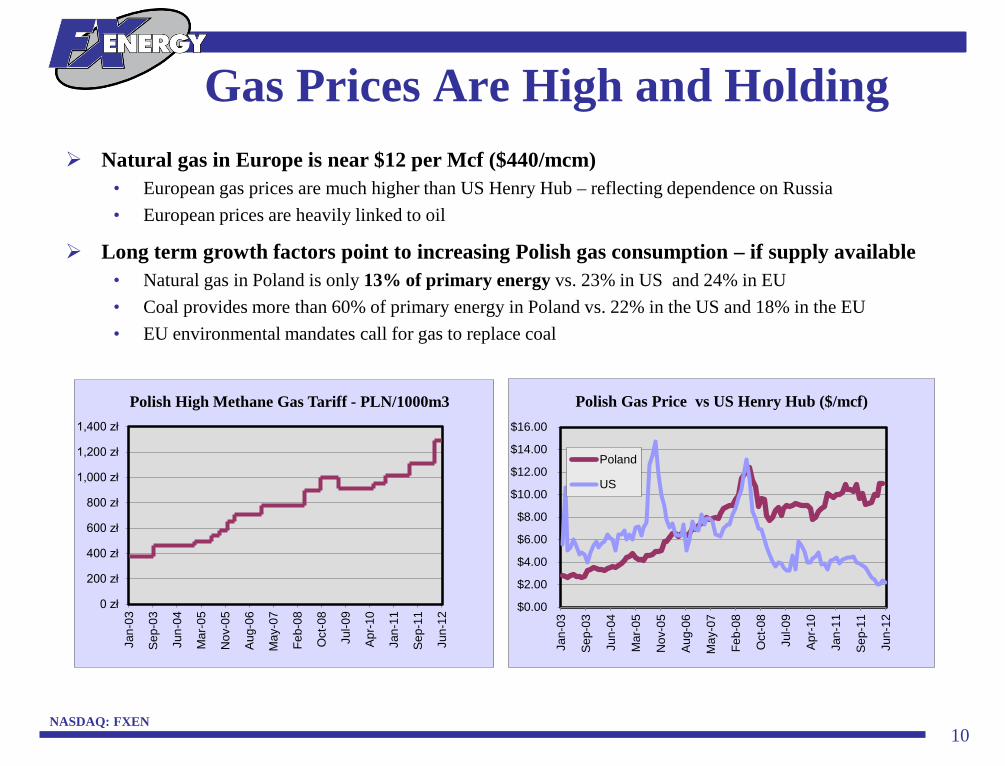
Natural gas in Europe is near $12 per Mcf ($440/mcm) • European gas prices are much higher than US Henry Hub – reflecting dependence on Russia • European prices are heavily linked to oil
Long term growth factors point to increasing Polish gas consumption – if supply available • Natural gas in Poland is only 13% of primary energy vs. 23% in US and 24% in EU • Coal provides more than 60% of primary energy in Poland vs. 22% in the US and 18% in the EU • EU environmental mandates call for gas to replace coal
0 zł
200 zł
400 zł
600 zł
800 zł
1,000 zł
1,200 zł
1,400 zł
Jan-
03
Sep
-03
Jun-
04
Mar
-05
Nov
-05
Aug
-06
May
-07
Feb-
08
Oct
-08
Jul-0
9
Apr
-10
Jan-
11
Sep
-11
Jun-
12
Polish High Methane Gas Tariff - PLN/1000m3
$0.00
$2.00
$4.00
$6.00
$8.00
$10.00
$12.00
$14.00
$16.00
Jan-
03
Sep
-03
Jun-
04
Mar
-05
Nov
-05
Aug
-06
May
-07
Feb-
08
Oct
-08
Jul-0
9
Apr
-10
Jan-
11
Sep
-11
Jun-
12
Polish Gas Price vs US Henry Hub ($/mcf)
Poland
US

NASDAQ: FXEN
$0.04 $1.45
$0.25
$1.85
$0.70
$0.32
$2.77
$3.51 $2.99
$0.48
$-
$1.00
$2.00
$3.00
$4.00
$5.00
$6.00
$7.00
$8.00
FX Poland US Indep.
CashMargin
F&D
Taxes
LOE
Royalty
Production Economics - Poland v. US
11
Lower costs in Poland than in US • Low taxes: 19% vs. 40% • Low lifting costs: $0.25 vs. $1.93 • Low royalties: 1% vs. 19% • FX 7 year F&D costs = $2.77/Mcfe
FX wellhead price (est. 2012 full year) • $8.44/mmbtu ($315/mcm) • $6.75/mcf ($252/mcm) • FX gas is 80% methane / 20% nitrogen
(2) US Independents 2011 forecast (per JP Morgan 6/14/2012) a) wellhead price: $7.61/Mcfe (37% oil) b) royalty rate: 19% c) forecast 2012 LOE: $1.85/Mcfe d) US income tax rate: 40%
(1) FX Poland 2012 assumptions a) wellhead price: $6.75/Mcfe/$8.44/mmbtu b) royalty rate: 0.60% c) LOE: $0.25/Mcfe d) Polish income tax rate: 19% of net income e) $1=PLN 3.35 average full year 2012
Attractive Production Economics
NASDAQ: FXEN $3
$4
$5
$6
$7
$8
300400500600700800900
1000
$/M
cf
PLN
/000
m3
FXEN Avg. PLN Gas Price FXEN Avg. USD Gas Price
$0
$2
$4
$6
$8
1.00
1.50
2.00
2.50
3.00
3.50
4.00
$/M
cf
PLN
/USD
PLN/USD Exchange Rate FXEN USD Gas Price

NASDAQ: FXEN
David Pierce President and CEO, Director
Jerzy Maciolek VP International
Exploration, Director
Arnold Grundvig, Jr.
Non Exec. Director
Dennis Goldstein Non Exec. Director
Richard Hardman Non Exec.
Director, Chief Technical Advisor
Tom Lovejoy Executive VP and Chairman
12
Corporate Structure; Poland in-Country Team
H. Allen Turner
Non Exec. Director
Executive Directors Non-Executive Directors
In-Country Team
Zbigniew Tatys Country Manager
Geology/Geophysics 9 in Poland
Drilling 2 in Poland
Production Engineering 2 in Poland
1 in UK
Accounting/Administrative 3 in Poland
Jerzy Maciolek, Director, VP International Exploration – a proven explorer in Poland
• Brilliant explorationist and the driving force behind FXEN in Poland • Received Gulf Oil President’s award for outstanding research • Geophysical degrees from Mining and Metallurgical Academy, Krakow,
Poland
Zbigniew Tatys, Head of Warsaw Office – proven leader with extensive production experience in Poland
• 20 year career with PGNiG; former General Director of PGNiG’s Upstream E&P Division
Richard Hardman, CBE, Director – the leading figure in North Sea exploration • 40 year international exploration career; VP Exploration for Amerada
Hess 1983-2002 • Responsible for key Amerada N. Sea discoveries – Valhall, Scott, S. Arne • Awarded CBE; served as: Chairman, PESGB; Pres., Geological Society;
Pres., AAPG Europe
Jack Scott, Consulting Petroleum Engineer – analogous Rotliegend experience • Rotliegend experience with Ranger Oil (UK) and Pennzoil (Netherlands) • 35 years of international experience
Jerzy Maciolek VP International
Exploration
Andy Pierce VP Operations
Clay Newton VP Finance
Eva Sokolowski Director of Operations
Administration

PRODUCTION and DEVELOPMENT
---
The Fences Concession
13
55%
45%
2012 Capital Allocation (est.)
Fences
Non-Fences

NASDAQ: FXEN 14
$289 million P50 (2P) reserves pv-10 pre-tax at 12/31/2011
$5.67/share – including net cash of $0.21/share – before prospect and acreage value
Over 90% of 2011 company wide reserves come from just 8 wells (out of 11 Rotliegend structural traps drilled) in the “Fences” concession
4 more such wells are budgeted for 2012; relatively low risk
Further reserves growth from Fences drilling anticipated
NASDAQ: FXEN
Reserves Growth Track Record
2011 Reserves Bcfe Bcm
PV-10 (pre-tax millions)
P90 (1P) 53 1.4 $195
P50 (2P) 95 2.5 $289
P10 (3P) 150 4.0 $356 Source: RPS Energy and Hohn Engineering
$0
$50
$100
$150
$200
$250
$300
2003 2004 2005 2006 2007 2008 2009 2010 2011
P-50 Reserves - PV-10 (pre-tax millions)
Poland
US
0102030405060708090100
0
20
40
60
80
100
2003 2004 2005 2006 2007 2008 2009 2010 2011
P-50 (2P) Reserves – Volumes (bcfe)
Year-endReserves
Production
NASDAQ: FXEN 15
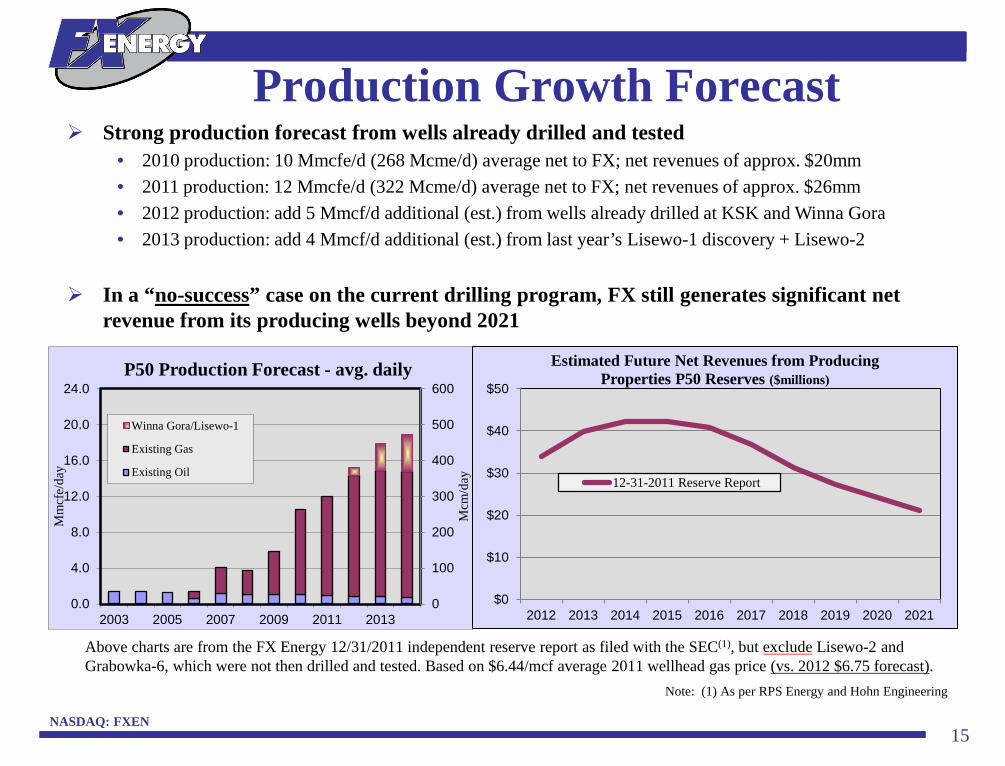
Production Growth Forecast Strong production forecast from wells already drilled and tested
• 2010 production: 10 Mmcfe/d (268 Mcme/d) average net to FX; net revenues of approx. $20mm • 2011 production: 12 Mmcfe/d (322 Mcme/d) average net to FX; net revenues of approx. $26mm • 2012 production: add 5 Mmcf/d additional (est.) from wells already drilled at KSK and Winna Gora • 2013 production: add 4 Mmcf/d additional (est.) from last year’s Lisewo-1 discovery + Lisewo-2
In a “no-success” case on the current drilling program, FX still generates significant net revenue from its producing wells beyond 2021
Above charts are from the FX Energy 12/31/2011 independent reserve report as filed with the SEC(1), but exclude Lisewo-2 and Grabowka-6, which were not then drilled and tested. Based on $6.44/mcf average 2011 wellhead gas price (vs. 2012 $6.75 forecast).
Note: (1) As per RPS Energy and Hohn Engineering
0
100
200
300
400
500
600
0.0
4.0
8.0
12.0
16.0
20.0
24.0
2003 2005 2007 2009 2011 2013
Mcm
/day
Mm
cfe/
day
P50 Production Forecast - avg. daily
Winna Gora/Lisewo-1
Existing Gas
Existing Oil
$0
$10
$20
$30
$40
$50
2012 2013 2014 2015 2016 2017 2018 2019 2020 2021
Estimated Future Net Revenues from Producing Properties P50 Reserves ($millions)
12-31-2011 Reserve Report

NASDAQ: FXEN
-
2.0
4.0
6.0
8.0
10.0
12.0
1 2 3 4 5 6 7 8 9 10 11 12
Mm
cf/d
ay
Year
Zaniemysl Well - Daily Production (Mmcfd)
Actual Production
2006 Y/E P50 Forecast
2006 Y/E P90 Forecast
- 20 40 60 80 100 120 140 160 180
-
1.0
2.0
3.0
4.0
5.0
6.0
1 2 3 4 5 6 7 8 9 10 11 12
Mcm
e/da
y
Mm
cfe/
day
Year
Average Fences Well - Production Profile
P50 Production Forecast
P90 Production Forecast
16
Economics: Average of 8 Fences Wells (100%)
Well cost (current estimated) $10 mm
Facilities cost (current estimated) $5 mm
Pre-tax 1P/2P value (PV-10) (avg.) $67/$91 mm
1P/2P cumulative undiscounted net cash flow (avg.)
$92/$150 mm
Pre-tax 1P/2P reserves (avg.) 17/27 Bcf (0.5/0.8 Bcm)
Initial production rate (avg.) 6.0 Mmcf/d (160 Mcm/d)
Working interest (assumed) 49%
Royalty (current) $0.04/mcf
NOTES: Averages based on 2011 SEC reserve report for 8 Fences wells: Kleka, Zaniemysl, Sroda-4, Winna Gora, Roszkow, Kromolice-1, Kromolice-2, and Lisewo-1
Figures include only reserves in wells already drilled All figures are for 100% working interest
NASDAQ: FXEN
Long Lived Wells
NASDAQ: FXEN
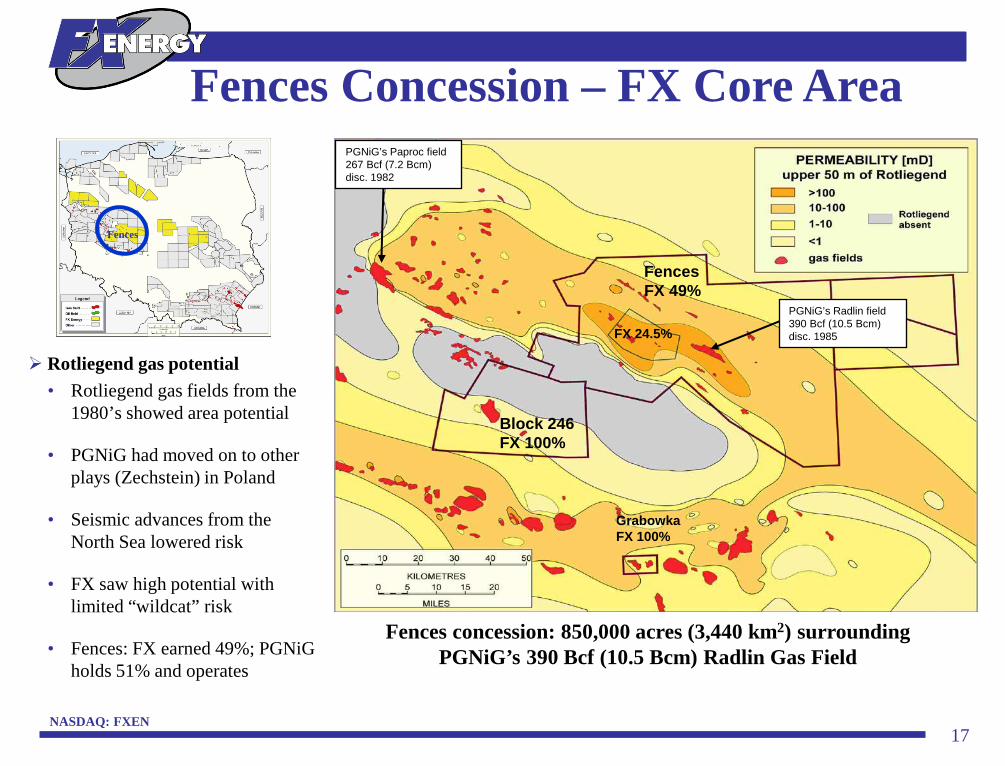
Fences concession: 850,000 acres (3,440 km2) surrounding PGNiG’s 390 Bcf (10.5 Bcm) Radlin Gas Field
17
Rotliegend gas potential • Rotliegend gas fields from the
1980’s showed area potential
• PGNiG had moved on to other plays (Zechstein) in Poland
• Seismic advances from the North Sea lowered risk
• FX saw high potential with limited “wildcat” risk
• Fences: FX earned 49%; PGNiG holds 51% and operates
Fences
Fences Concession – FX Core Area
Block 246 FX 100%
Grabowka FX 100%
PGNiG’s Paproc field 267 Bcf (7.2 Bcm) disc. 1982
PGNiG’s Radlin field 390 Bcf (10.5 Bcm) disc. 1985
Fences FX 49%
FX 24.5%

NASDAQ: FXEN
Commercial Discoveries
Gross P50 Reserves(1) /well
Kleka-11 3 bcf 0.1 bcm
Zaniemysl 42 bcf 1.1 bcm
Sroda-4 36 bcf 1.0 bcm
Winna Gora 12 bcf 0.3 bcm
Roszkow 55 bcf 1.5 bcm
Kromolice-1 30 bcf 0.8 bcm
Kromolice-2 15 bcf 0.4 bcm
Lisewo-1 36 bcf 1.0 bcm
Total 229 bcf 6.1 bcm
18 NASDAQ: FXEN
Results to Date in Fences Concession
Fences
Note: (1) P50 reserves on discovery as per RPS Energy, independent petroleum engineers
8 commercial successes out of 11 wells (72%) targeting Rotliegend structural traps • Discoveries averaged 17/27 Bcf (0.5/0.8 Bcm) 1P/2P ($67/$91 million pre-tax pv10%) • Now producing; Zaniemysl, Roszkow, Kromolice-1, Kromolice-2 and Sroda-4 (Kleka-
11 now fully drained) • Waiting on production facilities: Winna Gora and Lisewo-1
Kromolice-1 Kromolice-2
Zaniemysl Lisewo-1
Kleka-11
Roszkow
Winna Gora
Sroda-4
Fences Concession

NASDAQ: FXEN
Lisewo prod 2H2013
KSK prod 2Q2012
Mieczewo 3Q2012
Komorze-3 drilling now
Lisewo-SE 4Q2012
Lisewo-2 3Q2012
WG prod 3Q2012
Plawce-2 frac/test mid-2012
Operations Plan • Production: KSK
unconstrained end 2Q2012; Winna Gora facility online late 3Q2012; Lisewo facility online 2H2013
• Drilling: test Plawce-2; drill 4 new wells in 2012 near Lisewo and KSK facilities: reduced time to production at Lisewo
• 3-D seismic: expand 3-D coverage for drilling targets in 2013 and beyond
19 NASDAQ: FXEN
2012 Drilling/Production Plans
Fences

NASDAQ: FXEN 20
NASDAQ: FXEN
Plawce - Tight Gas Play in Fences
Fences Concession
Plawce
Tight Rotliegend gas field analogs in north German onshore and UK offshore
5 old wells (Siekierki and Plawce-1) drilled in 1970’s/1980’s; all tight, never produced; 100 meters of tight rock above a water zone
Plawce-2: drilled in 2011; 480 meters of tight Rotliegend with no free water on test
Plawce horst - a tight uplifted horst block with potential up to 100-125 Bcf (2.7-3.4 Bcm) recoverable net to FX 49% interest fully developed
Frac /test results 3Q2012 (est): 3 stage vertical frac planned over three intervals in upper Rotliegend; porosity range 10%-16%
Plawce East conventional prospect: 3-D seismic planned for 2012
Plawce-1
Plawce East: conventional
prospect
Plawce-2: waiting on
frac
NASDAQ: FXEN 21
NASDAQ: FXEN
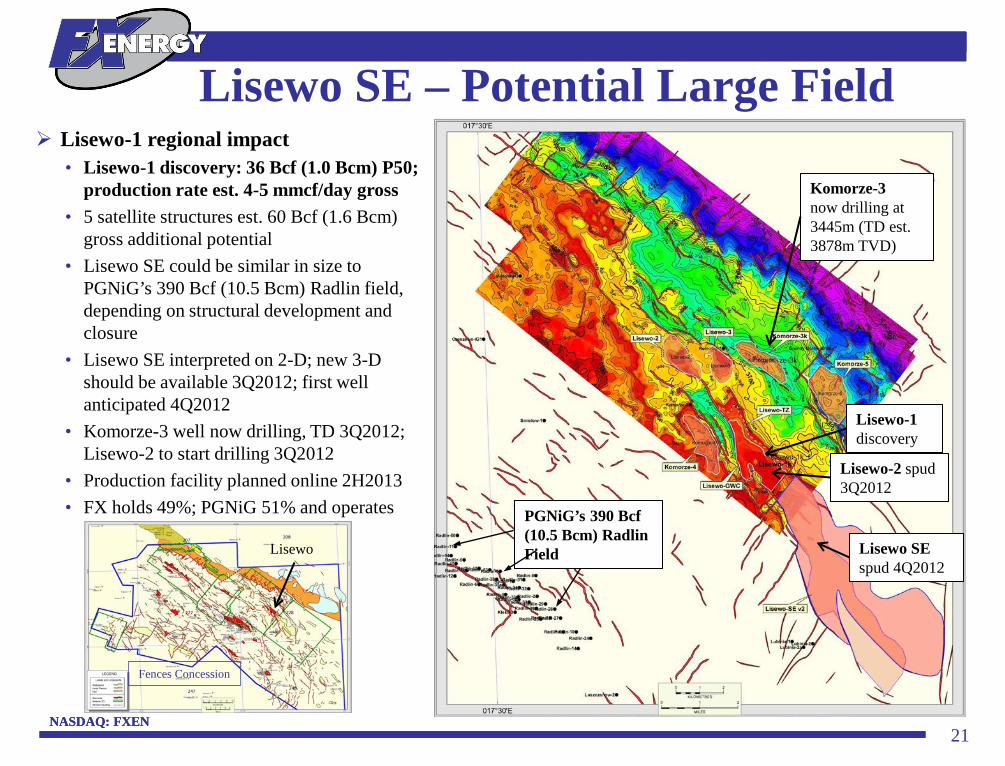
Lisewo SE – Potential Large Field Lisewo-1 regional impact
• Lisewo-1 discovery: 36 Bcf (1.0 Bcm) P50; production rate est. 4-5 mmcf/day gross
• 5 satellite structures est. 60 Bcf (1.6 Bcm) gross additional potential
• Lisewo SE could be similar in size to PGNiG’s 390 Bcf (10.5 Bcm) Radlin field, depending on structural development and closure
• Lisewo SE interpreted on 2-D; new 3-D should be available 3Q2012; first well anticipated 4Q2012
• Komorze-3 well now drilling, TD 3Q2012; Lisewo-2 to start drilling 3Q2012
• Production facility planned online 2H2013 • FX holds 49%; PGNiG 51% and operates
Lisewo-2 spud 3Q2012
PGNiG’s 390 Bcf (10.5 Bcm) Radlin Field Lisewo SE
spud 4Q2012
Lisewo-1 discovery
Komorze-3 now drilling at 3445m (TD est. 3878m TVD)
Lisewo
Fences Concession

NASDAQ: FXEN 22
NASDAQ: FXEN
FENCES
FX Concession Strategy Fences Concession
• Located on Rotliegend basin edge in the path of gas migration
• Existing Rotliegend fields lowered exploration risk
• Goal: build reserves and production to fund Fences growth; use some of the revenues to explore other concessions
Non-Fences Concessions • Potentially higher upside than
Fences, but with higher risk • Possibility of other play types not
previously tested in Poland; an opportunity to bring outside experience to bear on the hydrocarbon opportunity

23
HIGH POTENTIAL EXPLORATION
---
Outside the Fences Concession
55%
45%
2012 Capital Allocation (est.)
Fences
Non-Fences

NASDAQ: FXEN 24
Optionality: High Impact Exploration • High potential identified in large exploration
concessions covering 3.6 million net acres • Kutno drilling now; TD est. 3Q2012 • Edge and Block 246 should see first wells tested
4Q2012 • Warsaw South next well(s) est. 2013 • Block 229 well est. 2014
FX Energy Exploration Concessions
Main gas distribution lines in red
229
Fences
246
NW Warsaw S.
Kutno
Edge
* 50% after farmout earn in
Gross (mm acres)
Working Interest
Net (mm acres)
Net (km2) Concession
Fences 0.85 49% 0.41 1,647 Block 229 0.23 100% 0.23 941 Block 246 0.24 100% 0.24 975 NW 0.62 100% 0.62 2,494 NW Ostrow. 0.21 51% 0.11 437 Warsaw S. 0.88 51% 0.44 1,769 Kutno * 0.71 100% 0.71 2,856 Edge 0.88 100% 0.88 3,567 Block 287 0.01 100% 0.01 52 4.63 3.64 14,738

NASDAQ: FXEN 25
NASDAQ: FXEN
Kutno-2 Drilling
Kutno mega-structure
• Massive 35,000 acre / 142 km2 2-D defined Rotliegend structure at 21,000 feet / 6,450 meters
• Potential up to 9.5 Tcf (255 Bcm) recoverable; (more than 25 times Poland’s annual gas imports)
• FX holds 100% and operates; PGNiG to earn 50%
• Drilling now over 5,000 meters – TD est. 3Q2012
• Huge optionality – high risk (depth, gas quality, reservoir quality)
Kutno
Kutno drillsite TD est. 6450
NASDAQ: FXEN 26
NASDAQ: FXEN
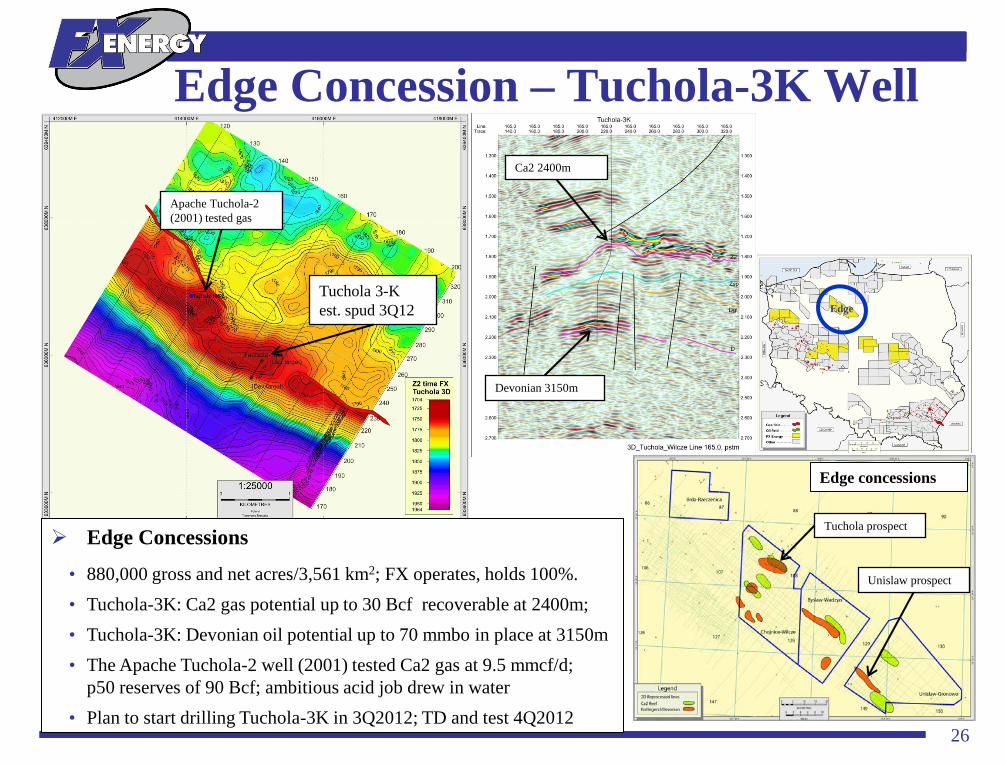
Edge Concession – Tuchola-3K Well
Edge
Edge concessions
Tuchola prospect
Unislaw prospect
Tuchola 3-K est. spud 3Q12
Apache Tuchola-2 (2001) tested gas
Ca2 2400m
Devonian 3150m
Edge Concessions
• 880,000 gross and net acres/3,561 km2; FX operates, holds 100%. • Tuchola-3K: Ca2 gas potential up to 30 Bcf recoverable at 2400m; • Tuchola-3K: Devonian oil potential up to 70 mmbo in place at 3150m • The Apache Tuchola-2 well (2001) tested Ca2 gas at 9.5 mmcf/d;
p50 reserves of 90 Bcf; ambitious acid job drew in water • Plan to start drilling Tuchola-3K in 3Q2012; TD and test 4Q2012

NASDAQ: FXEN
246
27 NASDAQ: FXEN
Block 246 – Frankowo Well
Frankowo-1
Bright reflection at top Rotliegend - strat trapped gas?
Block 246 Concession • 240,000 acres/975 km2; FX operates, holds 100% • Updip from 1 Tcf Ca1 production in Bronsko/Koscian fields • Frankowo prospect: Rotliegend potential up to 50 Bcf recoverable gas at 2200m • Success could open up Rotliegend potential in eastern portion of Block 246 • Plan to start drilling Frankowo well 3Q2012; TD and test 4Q2012
Block 246 concession
Frankowo
Gorka Duchowna
Bronsko field 700 Bcf
Koscian field 300 Bcf
NASDAQ: FXEN
W-S
28 NASDAQ: FXEN
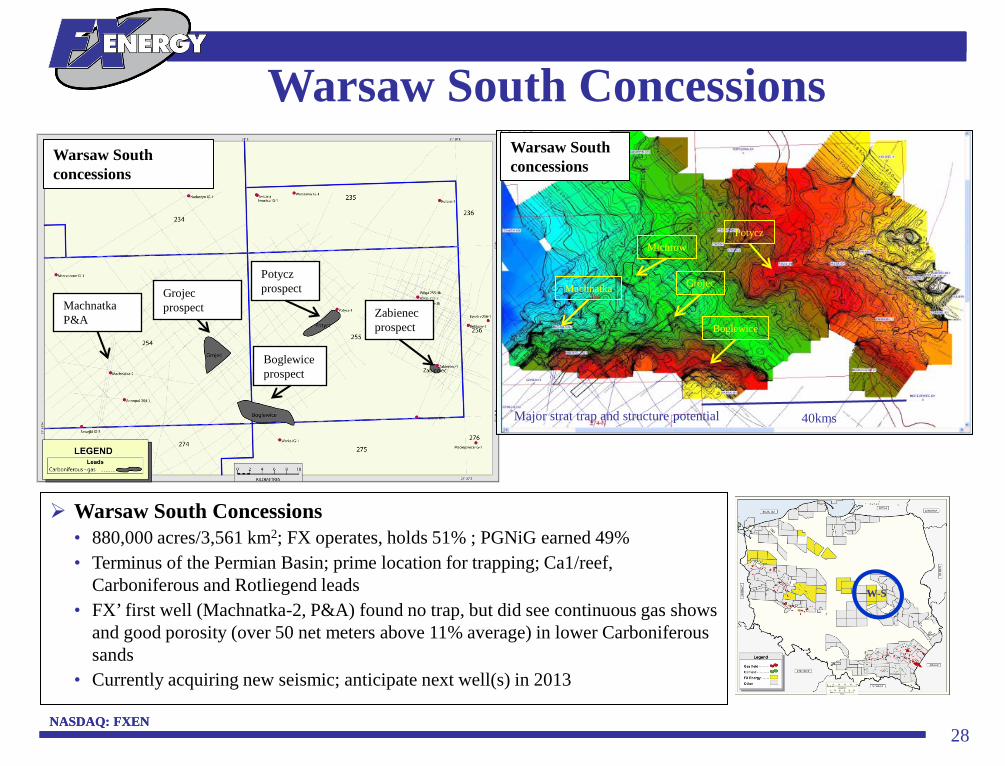
Warsaw South Concessions
Warsaw South Concessions • 880,000 acres/3,561 km2; FX operates, holds 51% ; PGNiG earned 49% • Terminus of the Permian Basin; prime location for trapping; Ca1/reef,
Carboniferous and Rotliegend leads • FX’ first well (Machnatka-2, P&A) found no trap, but did see continuous gas shows
and good porosity (over 50 net meters above 11% average) in lower Carboniferous sands
• Currently acquiring new seismic; anticipate next well(s) in 2013
Machnatka P&A
Boglewice prospect
Grojec prospect
Potycz prospect
Warsaw South concessions
Zabienec prospect
40kms
Machnatka Grojec
Michrow
Major strat trap and structure potential
Boglewice
Potycz
Warsaw South concessions
NASDAQ: FXEN 29
NASDAQ: FXEN
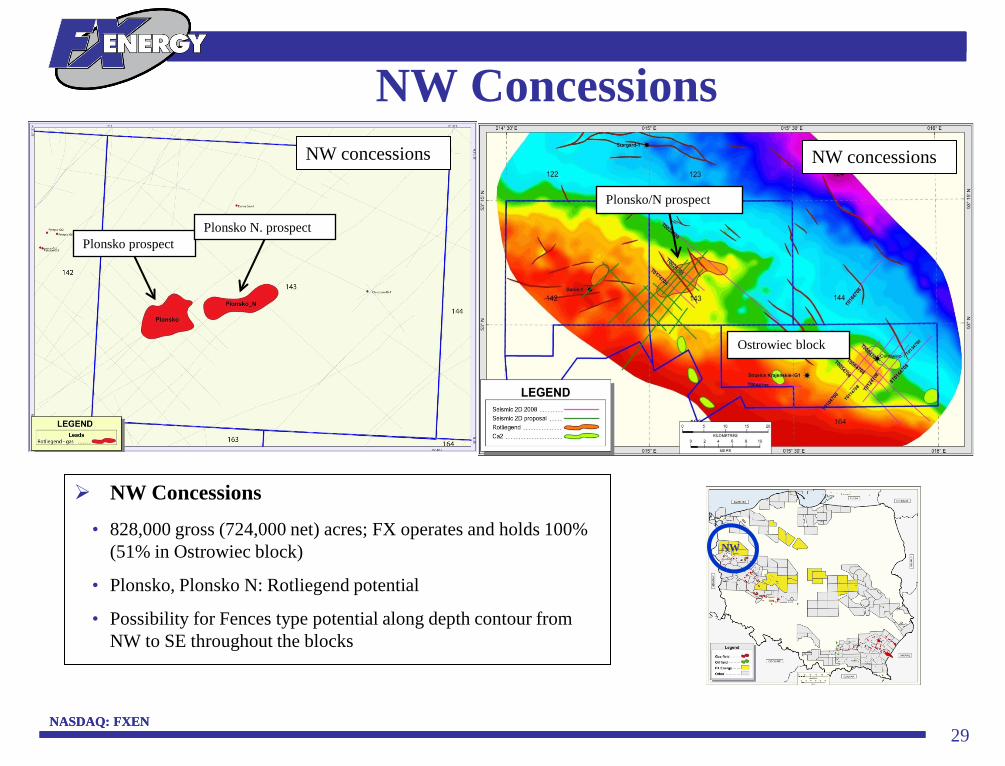
NW Concessions
NW
NW Concessions
• 828,000 gross (724,000 net) acres; FX operates and holds 100% (51% in Ostrowiec block)
• Plonsko, Plonsko N: Rotliegend potential
• Possibility for Fences type potential along depth contour from NW to SE throughout the blocks
Plonsko/N prospect
NW concessions
Ostrowiec block
Plonsko prospect
NW concessions
Plonsko N. prospect

NASDAQ: FXEN 30
NASDAQ: FXEN
Block 229
229
Block 229 Concession
• 230,000 gross and net acres; FX operates and holds 100%
• Five reef prospects: Ca2 potential – analog to PGNiG’s BMB and LMG fields, with reported aggregate 1 Tcfe recoverable oil and gas
• Block 229 leads (5) cover more total acreage than BMB
Lead-1
Grundy 2: 23 meters of Ca2, porosity 10-30%
Lead-1

NASDAQ: FXEN 31
FX 2011 year end reserves • 95 Bcfe (2.5 Bcm) of 2P(P50) reserves at 12/31/2011; $289mm pre-tax pv10%
Fences • Potential up to 125 Bcf (3.4 Bcm) net to FX fully developed from Plawce tight sand
prospect; first well to frac mid-2012
• Potential up to 170 Bcf (4.6 Bcm) net to FX fully developed from Lisewo SE: 3-D seismic processing/interpretation due 3Q2012; first well to spud 4Q2012
• Potential up to 45 Bcf (1.2 Bcm) net to FX from satellite wells in Lisewo area and Mieczewo well in KSK area; Komorze-3 results expected 3Q2012; Mieczewo results expected 4Q2012
Kutno • Potential up to 4.75 Tcf (125 Bcm) net to FX fully developed from Kutno 35,000
acre prospect; potential for gas in Rotliegend; results expected 3Q 2012
Frankowo • Potential up to 50 Bcf (1.3 Bcm) net to FX fully developed from Frankowo prospect:
potential for gas in Rotliegend; results expected 4Q2012
Tuchola • Potential up to 110 Bcfe (2.9 Bcme) net to FX fully developed from Tuchola
prospect: potential for gas in Ca2 and oil in Devonian; results expected 4Q2012
Upside Potential – 6 Major Projects

NASDAQ: FXEN 32
NASDAQ: FXEN
NAV and Forward Drilling Program
Note: estimated net value calculated at $3.05/mcf or $113/mcm; $3.05 is the average 2P (P50) pv-10 value in the Company’s 12/31/2011 reserve report. (The 1P (P90) value is $3.70/mcf.) Development costs are not shown and may be expected to vary considerably from project to project.
Net Asset Value (NAV) Analysis 12/31/2011 ($ in millions, except per share amounts) Total per share per share P50 value pre-tax $289 $5.46 $5.46 Net cash $11 $0.21 $0.21 P-50 Net Asset Value $300 $5.67 $5.67
Prospect Potential FX Net Net Potential Est. Net Risked Unrisked Net Cost Recoverable Interest Recoverable Chance of Value (mm) Value Value to FX (mm) BOLD=Well in current budget (Bcfe) (Bcme) after 1st well (Bcfe) (Bcme) Success * per share per share First Well Fences - Lisewo satellites (5) 60 1.6 49% 29 0.8 75% $67 $1.27 $1.69 $5 Fences - Lisewo SE 350 9.4 49% 172 4.6 50% $262 $4.94 $9.88 $5 Fences - Plawce (tight gas) 250 6.7 49% 123 3.3 50% $187 $3.53 $7.06 $7 Fences - Mieczewo 30 0.8 49% 15 0.4 50% $22 $0.42 $0.85 $5 Fences - Miloslaw 50 1.3 49% 25 0.7 20% $15 $0.28 $1.41 $5 Fences - Plawce East 875 23.5 49% 429 11.5 20% $262 $4.94 $24.71 $5 Block 246 - Frankowo 50 1.3 100% 50 1.3 20% $31 $0.58 $2.88 $6 Block 246 - Gorka Duchowna 50 1.3 100% 50 1.3 20% $31 $0.58 $2.88 $6 Edge - Tuchola 110 2.9 100% 110 2.9 20% $67 $1.27 $6.34 $10 Edge - Unislaw 110 2.9 100% 110 2.9 20% $67 $1.27 $6.34 $12 WS - Grojec 100 2.7 51% 51 1.4 20% $31 $0.59 $2.94 $5 WS - Boglewice 200 5.4 51% 102 2.7 20% $62 $1.18 $5.88 $5 WS - Potycz 90 2.4 51% 46 1.2 20% $28 $0.53 $2.65 $5 NW - Plonsko N 150 4.0 100% 150 4.0 20% $92 $1.73 $8.64 $12 Kutno 9500 254.7 50% 4750 127.3 10% $1,449 $27.37 $273.73 $10 Total Risked Potential 11,975 321.0 6,210 166.5 $2,671 $50.47 $357.88 $103
Shares Outstanding (millions) 52.9 52.9 Risked Discovery Potential and Net Asset Value Per Share $56.14 $363.55