poland - emis insight - poland ict... · poland's state-run post poczta polska provided nearly...
TRANSCRIPT

- 1 - Any redistribution of this information is strictly prohibited.
Copyright © 2015 EMIS, all rights reserved.
Produced by:
Any redistribution of this information is strictly prohibited.
Copyright © 2015 EMIS, all rights reserved.
ICT Sector Poland
July 2015
PL_517_0001_Jul'2015_TO_NY EMISPDF nyanakieva from 91.216.253.59 on 2015-10-07 14:44:13 BST. DownloadPDF.
Downloaded by nyanakieva from 91.216.253.59 at 2015-10-07 14:44:13 BST. EMIS. Unauthorized Distribution Prohibited.

- 2 - Any redistribution of this information is strictly prohibited.
Copyright © 2015 EMIS, all rights reserved.
Table of Contents
I. Sector Overview
1. Sector Highlights
2. Economic Importance
3. Sector Forecast
4. Main Sector Indicators
5. EU Comparison
6. Telecom Business Sentiment
7. Postal Services
8. Postal Services (cont’d)
9. Consumer Surveys
10.Bundled Services
11.Investments
12.Government Policy
II. Mobile Telephony
1. Segment Highlights
2. Key Segment Data
3. Market Shares
4. Customer Preferences
5. Roaming
6. Equipment: Brands
7. Equipment: Smartphones
III.Fixed-line Telephony
1. Segment Highlights
2. Basic Data
3. Traffic
4. Customers Preferences
5. VoIP
IV.Internet Access
1. Segment Highlights
2. EMEA Comparison
3. Key Segment Data
4. Internet Services Providers
5. Fixed-line Internet
6. Enterprises & Internet
7. Households & Internet
8. Wholesale Market
9. Internet Content
10.E-commerce
11.E-commerce (cont’d)
12.Segment Forecasts
EMISPDF nyanakieva from 91.216.253.59 on 2015-10-07 14:44:13 BST. DownloadPDF.
Downloaded by nyanakieva from 91.216.253.59 at 2015-10-07 14:44:13 BST. EMIS. Unauthorized Distribution Prohibited.

- 3 - Any redistribution of this information is strictly prohibited.
Copyright © 2015 EMIS, all rights reserved.
Table of Contents
V. Pay TV
1. Basic Data & Forecasts
2. TV Audience
3. Terrestrial Digital TV
4. Added & Multimedia Services Market
VI. Main Players
1. M&A Activity
2. Top Companies
3. Orange Polska
4. Orange Polska (cont'd)
5. Orange Polska (cont'd)
6. Cyfrowy Polsat
7. T-Mobile Polska
8. P4
9. Netia
EMISPDF nyanakieva from 91.216.253.59 on 2015-10-07 14:44:13 BST. DownloadPDF.
Downloaded by nyanakieva from 91.216.253.59 at 2015-10-07 14:44:13 BST. EMIS. Unauthorized Distribution Prohibited.

- 4 - Any redistribution of this information is strictly prohibited.
Copyright © 2015 EMIS, all rights reserved.
I. Sector Overview
EMISPDF nyanakieva from 91.216.253.59 on 2015-10-07 14:44:13 BST. DownloadPDF.
Downloaded by nyanakieva from 91.216.253.59 at 2015-10-07 14:44:13 BST. EMIS. Unauthorized Distribution Prohibited.

- 5 - Any redistribution of this information is strictly prohibited.
Copyright © 2015 EMIS, all rights reserved.
Sector Highlights
The share of telecom industry in Poland's GDP has remained 2.5%, while the entire ICT account for nearly 8%. According to forecasts, cited by the
Economy Ministry, it should rise to 15% over the next 10 years.
In 2013, Poland’s ICT market ranked 11th and its telecom market - 9th in Europe in terms of value.
ICT Sector
Market Decline
Workforce
Segment Penetration
The telecom market has been declining in value for a second year in a row – by 2.6% in 2014 and by 3.7% in 2013. This trend is expected to be
sustained (e.g. market researcher PMR expects a 1.1% fall in 2015), although others forecast stabilisation (P4 sees a growth of 2%). The declines
are largely due to the results of the mobile telephony segment. Declines in traditional voice services have also been dragging down the fixed-line
segment, even though VoIP and WLL-based services are growing.
As a result of tighter operating conditions, telecoms tend to lay off sizeable parts of their workforce. E.g. group layoffs were implemented in T-
Mobile Polska (340 persons), Netia (350 persons) and Orange Polska has continued its voluntary resignations scheme (1,500 persons).
The highest market penetration is registered in the mobile segment (150.8% in Q1 2015 and growing), while in the fixed-line segment, the decline
that started in 2005 has continued, with market penetration of 14.2%. Meanwhile, the internet access penetration reached 75% in 2014.
EMISPDF nyanakieva from 91.216.253.59 on 2015-10-07 14:44:13 BST. DownloadPDF.
Downloaded by nyanakieva from 91.216.253.59 at 2015-10-07 14:44:13 BST. EMIS. Unauthorized Distribution Prohibited.

- 6 - Any redistribution of this information is strictly prohibited.
Copyright © 2015 EMIS, all rights reserved.
Source:
Comments
Economic Importance
The telecom market continues to play an important role, but its impact on the Polish economy has been decreasing. The country is stronger in consumer
electronics in terms of production facilities and market dynamics. All in all, the market is expected to rebound – possibly already this year.
Key Data
Central Statistical Office (GUS), Electronic Communications Office (UKE)
2009 2010 2011 2012 2013 2014
GDP (real value) PLN bn 1,344.5 1,416.6 1,553.6 1,615.9 1,662.7 1,728.7
GDP (real value) % change 1.6 3.7 4.8 1.8 1.7 3.4
Telecom market, PLN bn 42.0 42.5 43.0 43.5 40.2 39.2
Telecom market, % change -4.0 1.2 1.1 1.5 -3.7 -2.6
Telecom market, % of GDP 3.1 3.0 2.8 2.7 2.4 2.3
EMISPDF nyanakieva from 91.216.253.59 on 2015-10-07 14:44:13 BST. DownloadPDF.
Downloaded by nyanakieva from 91.216.253.59 at 2015-10-07 14:44:13 BST. EMIS. Unauthorized Distribution Prohibited.

- 7 - Any redistribution of this information is strictly prohibited.
Copyright © 2015 EMIS, all rights reserved.
Source:
Sector Forecasts
Forecasts: Nominal Values (mn)
Forecasts: Per 100 People (%)
Forecasts: Revenue* (USD bn)
Pyramid Research, Economist Intelligence Unit (EIU) (left); International Telecommunication Union; OECD; EIU (right)
5.48 5.41 5.05 4.71 4.40
57.47 59.04 60.44 61.74 62.85
2014 2015 2016 2017 2018
Telephone main lines Mobile subscriptions
14.2 14.1 13.2 12.3 11.5
149.3 153.7 157.6 161.4 164.3
2014 2015 2016 2017 2018
Telephone main lines Mobile subscriptions
1.36 1.24
0.99 0.87 0.88 0.89
5.79 5.89
4.95
4.69
5.13
5.64
2013 2014 2015 2016 2017 2018
Fixed-line Mobile
EMISPDF nyanakieva from 91.216.253.59 on 2015-10-07 14:44:13 BST. DownloadPDF.
Downloaded by nyanakieva from 91.216.253.59 at 2015-10-07 14:44:13 BST. EMIS. Unauthorized Distribution Prohibited.
- 8 - Any redistribution of this information is strictly prohibited.
Copyright © 2015 EMIS, all rights reserved.
Source:
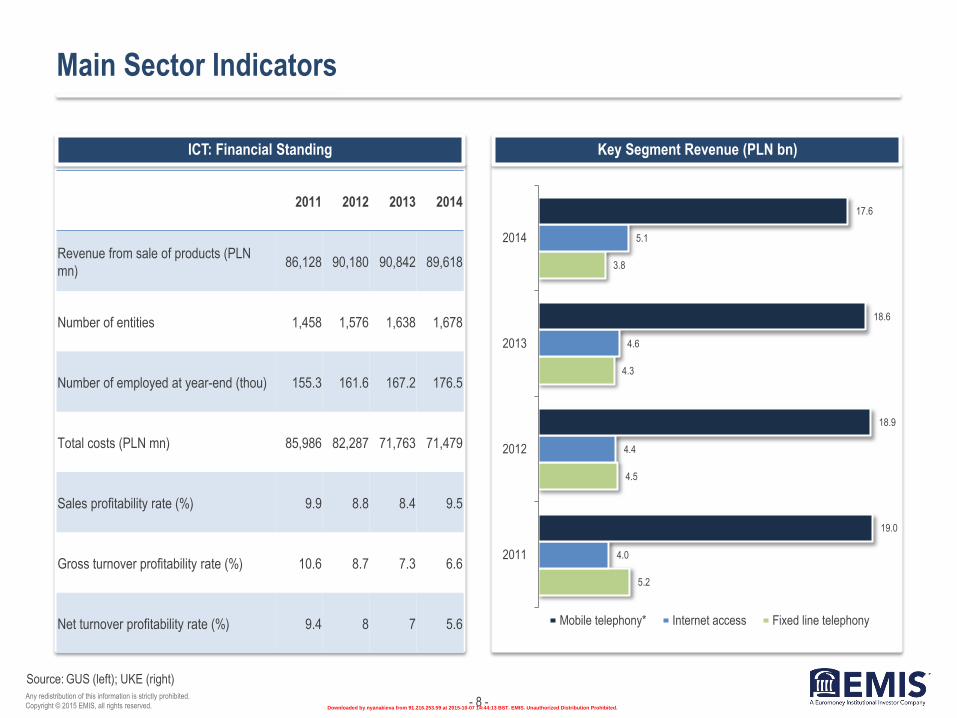
Main Sector Indicators
ICT: Financial Standing Key Segment Revenue (PLN bn)
GUS (left); UKE (right)
2011 2012 2013 2014
Revenue from sale of products (PLN
mn) 86,128 90,180 90,842 89,618
Number of entities 1,458 1,576 1,638 1,678
Number of employed at year-end (thou) 155.3 161.6 167.2 176.5
Total costs (PLN mn) 85,986 82,287 71,763 71,479
Sales profitability rate (%) 9.9 8.8 8.4 9.5
Gross turnover profitability rate (%) 10.6 8.7 7.3 6.6
Net turnover profitability rate (%) 9.4 8 7 5.6
5.2
4.5
4.3
3.8
4.0
4.4
4.6
5.1
19.0
18.9
18.6
17.6
2011
2012
2013
2014
Mobile telephony* Internet access Fixed line telephony
EMISPDF nyanakieva from 91.216.253.59 on 2015-10-07 14:44:13 BST. DownloadPDF.
Downloaded by nyanakieva from 91.216.253.59 at 2015-10-07 14:44:13 BST. EMIS. Unauthorized Distribution Prohibited.

- 9 - Any redistribution of this information is strictly prohibited.
Copyright © 2015 EMIS, all rights reserved.
Source:
EU Comparison
Syrvey of Households in 2014 (%)
Percentage of Households with Bundled Telecom Services (%)
European Commission
30
68
91
15
44 44
91 92 91 98
92 87
57 65
76 65
55 54
Poland EU avg Germany Czech Rep. Hungary Romania
Households with fixed telephone access Individual mobile telephone access Households with internet access
21
46
61
23
48 47
Poland EU avg Germany Czech Rep. Hungary Romania
EMISPDF nyanakieva from 91.216.253.59 on 2015-10-07 14:44:13 BST. DownloadPDF.
Downloaded by nyanakieva from 91.216.253.59 at 2015-10-07 14:44:13 BST. EMIS. Unauthorized Distribution Prohibited.

- 10 - Any redistribution of this information is strictly prohibited.
Copyright © 2015 EMIS, all rights reserved.
Source:
Comments
Telecom Business Sentiment
Executives from enterprises operating in the area of information and communications have been positive on the business climate since the beginning of
2014.
According to the most recent round of surveys from June 2015, executives assessed current demand, sales and financial situation to be better than in the
previous three months. They did not report any major delays in payments for services. Furthermore, they expect prices to continue to fall in the coming
months (Poland has been experiencing CPI deflation since the middle of 2014). Employment growth in the sector is anticipated to retain its momentum.
Business Climate in ICT Sector
GUS
11 12
16
19 18
21
8 6
5
0
5
10
15
20
25
Jan2014
Feb2014
Mar2014
Apr 2014 May2014
Jun2014
Jul 2014 Aug2014
Sep2014
Oct 2014 Nov2014
Dec2014
Jan2015
Feb2015
Mar2015
Apr 2015 May2015
Jun2015
Indicator Improvement Worsening
EMISPDF nyanakieva from 91.216.253.59 on 2015-10-07 14:44:13 BST. DownloadPDF.
Downloaded by nyanakieva from 91.216.253.59 at 2015-10-07 14:44:13 BST. EMIS. Unauthorized Distribution Prohibited.

- 11 - Any redistribution of this information is strictly prohibited.
Copyright © 2015 EMIS, all rights reserved.
Source:
Postal Services
Postal Services Revenue (Polish Post plus alternative operators (PLN bn)
UKE
Volume of Packages (in domestic and cross-border services, mn items)
Comments
Poland's state-run post Poczta Polska provided nearly 1.8bn postal services (universal services, courier and other services), which translated into revenue
of over PLN 4.6bn (EUR 1.1bn) last year. Alternative operators provided nearly 4.2bn services, generating over PLN 2.9bn in revenue.
5.6 5.8 5.5 5.8 5.8 5.9 5.9
7.5 7.6
5.4 5.6
5.3 5.6
5.6 5.8
5.8
7.4 7.4
2006 2007 2008 2009 2010 2011 2012 2013 2014
Incl. mass mailing
Excl. mass mailing
5,091 5,193 5,411 5,360 5,597 5,750 5,151 4,877 5,973
1,802 1,994 2,003 2,011 2,019 2,019 2,002 2,086
3,991
2006 2007 2008 2009 2010 2011 2012 2013 2014
Incl. mass mailing
Excl. mass mailing
EMISPDF nyanakieva from 91.216.253.59 on 2015-10-07 14:44:13 BST. DownloadPDF.
Downloaded by nyanakieva from 91.216.253.59 at 2015-10-07 14:44:13 BST. EMIS. Unauthorized Distribution Prohibited.

- 12 - Any redistribution of this information is strictly prohibited.
Copyright © 2015 EMIS, all rights reserved.
Source:
Postal Services (cont’d)
Comments
Top Alternative Postal Services Operators both in Volume ad Value Terms
Number of Alternative Operators
Number of Post Offices
UKE
Apart from the Polish Post, who is the designated operator (i.e.
the one responsible for delivering some basic services to the
entire population), there were 294 entities in the post operators
registry, maintained by the Electronic Communications Office
(UKE). However, only 165 alternative operators were actually in
operation last year. 157
164
182
209
244
247
267
275
295
91
100
106
125
152
154
153
163
166
2006
2007
2008
2009
2010
2011
2012
2013
2014
Operating Registered
InPost
InPost Paczkomaty
PGP
Speedmail
ABC Direct Contact
8,553 8,692
8,489 8,378 8,365 8,383
8,459
7,884
7,540
2006 2007 2008 2009 2010 2011 2012 2013 2014
EMISPDF nyanakieva from 91.216.253.59 on 2015-10-07 14:44:13 BST. DownloadPDF.
Downloaded by nyanakieva from 91.216.253.59 at 2015-10-07 14:44:13 BST. EMIS. Unauthorized Distribution Prohibited.

- 13 - Any redistribution of this information is strictly prohibited.
Copyright © 2015 EMIS, all rights reserved.
Source:
Consumer Surveys
Retail: What Telecom Services Do You Use in 2014 (%*) Corporate: What Telecom Services Do You Use in 2014? (%*)
PBS, Indicator, UKE
88
58
72
27
23
mobile phone
internet (in total)
fixed-line internet
mobile internet
fixed-line phone
* - n = 1600 * - n = 423
89
80
52
mobile phone internet (in total) fixed-line phone
EMISPDF nyanakieva from 91.216.253.59 on 2015-10-07 14:44:13 BST. DownloadPDF.
Downloaded by nyanakieva from 91.216.253.59 at 2015-10-07 14:44:13 BST. EMIS. Unauthorized Distribution Prohibited.

- 14 - Any redistribution of this information is strictly prohibited.
Copyright © 2015 EMIS, all rights reserved.
Source:
Bundled Services
Comments
Retail: Telecom Services Bundles in 2014 (%, n = 1600)
Most Popular Bundles in 2014 (%)
Corporate: Telecom Services Bundles (%, n = 418)
UKE (upper); PBS, Indicator, UKE (lower)
More than 4.2 million customers used bundled services in 2014. These
services generated nearly PLN 2bn (EUR 480mn) in revenues.
Customers used 42 types of packages of bundles services.
30.0
18.8
15.2
11.3
10.9
13.7
Fixed-line internet + TV
Fixed-line telephony + fixed-lineinternet + TV
Mobile telephony + mobile internet
Fixed-line internet + TV + VoIPtelephony
Fixed-line telephony + fixed-lineinternet
Others
Mobile phone and internet
47%
Only mobile phone 27%
Fixed-line and mobile
phones, internet 11%
Only fixed-line phone 9%
Fixed-line and mobile phones
4%
Fixed-line phone and internet 0%
No phone and internet 2%
Mobile phone and internet
34%
Only mobile phone 13%
Fixed-line and mobile
phones, internet 35%
Fixed-line and mobile phones
7%
Fixed-line phone and
internet 10%
Only fixed-line phone 1%
EMISPDF nyanakieva from 91.216.253.59 on 2015-10-07 14:44:13 BST. DownloadPDF.
Downloaded by nyanakieva from 91.216.253.59 at 2015-10-07 14:44:13 BST. EMIS. Unauthorized Distribution Prohibited.

- 15 - Any redistribution of this information is strictly prohibited.
Copyright © 2015 EMIS, all rights reserved.
Source:
Investments
Investment Breakdown (PLN mn) Market Share of Investments by Technology (%)
BuddeComm based on ITU and regulator data
980
517
845
910
83
99
330
753
10
53
448
2011
2012
2013
2014*
State aid Fibre networks Access networks
* - BuddeCom Communication's estimates for 2014
Sector 2011 2012 2013 2014*
2G/3G 29.4 53.4 55.1 -
LTE - - 14.3 21.6
DSL 62.8 32.9 4.2 4.3
Cable 3.7 7.5 13.0 16.8
FWA - 2.4 - -
Ethernet - 1.6 - 2.2
FttX 1.6 0.7 10.4 41.3
WiMAX 0.2 0.6 - 11.9
Other 0.2 0.9 3.0 1.3
* - BuddeCom Communication's estimates for 2014
EMISPDF nyanakieva from 91.216.253.59 on 2015-10-07 14:44:13 BST. DownloadPDF.
Downloaded by nyanakieva from 91.216.253.59 at 2015-10-07 14:44:13 BST. EMIS. Unauthorized Distribution Prohibited.

- 16 - Any redistribution of this information is strictly prohibited.
Copyright © 2015 EMIS, all rights reserved.
Government Policy
LTE Auction
The state is currently auctioning off frequencies in the 800MHz and 2600MHz bands suitable for 4G Long Term Evolution (LTE)
technology, but the bidding has dragged on for several months.
The watchdog originally expected the auction to bring at least PLN 1.8bn to the state coffers and market estimates were at up
to PLN 3bn , while on July 20, 2015, the value of the highest bids for all these frequencies totalled PLN 5.19bn.
Even though operators have already broadly covered Poland with LTE services, they expect the new frequencies to provide a
boost for this segment's rapid growth.
MTR Policy
In the past few years, the Polish telecoms regulator UKE implemented new regulations for call termination in mobile networks to introduce symmetric wholesale rates (MTR) based on the operator costs designed to significantly reduce their level.
Over the last six years, MTR cuts (now accomplished) and price wars triggered by no-limit offers have led to a combined revenue decline of the three biggest mobile telephony networks to the tune of 7%. Hence, analysts expect mobile firms' revenue to stabilise already this year, while P4 (operator of the Play network, which was not subject to MTR cuts and thus was able to increase its revenue in the recent years) expects them to post revenue growth of 2%. However, Orange Polska expects the market to post yet another decline.
Universal
Services
The UKE has selected the Poczta Polska to be the provider of universal postal services until 2025. Under the law, the state-owned enterprise was selected as the so-called designated operator (i.e. the one providing universal services) in 2013-2015. During the 2015 tender, no competitor filed a viable offer (although PGP did submit an offer, admitting itself it failed to meet all the requirements of the tender).
The obligation to provide universal postal services involves the offer of posting letters and packages, domestic and foreign, but - as UKE's representatives point out - it also includes the obligation to provide postal services to persons with disabilities or those living in areas where the profitability of postal services is not guaranteed.
Eighth
TV Multiplex
Emitel has recently won the tender for operator of the eighth multiplex (MUX-8) intended for the terrestrial digital broadcasting
or re-broadcasting of TV programmes, for a period of 15 years from the date of delivering the decision on frequency
reservation. MUX-8 will include 3 slots for the public TVP (3 SD channels or 1 HD and 1 SD channel) and four slots for
channels that will be provided by winners of new respective licences. Currently, terrestrial digital TV is available via three
multiplexes: MUX-1 and MUX-2 broadcast thematic channels (8 channels each), while MUX-3 is focused on the public TVP's
channels (also 8 channels, including TVP1 HD, TVP2 HD and 4 thematic channels).
EMISPDF nyanakieva from 91.216.253.59 on 2015-10-07 14:44:13 BST. DownloadPDF.
Downloaded by nyanakieva from 91.216.253.59 at 2015-10-07 14:44:13 BST. EMIS. Unauthorized Distribution Prohibited.

- 17 - Any redistribution of this information is strictly prohibited.
Copyright © 2015 EMIS, all rights reserved.
II. Mobile Telephony
EMISPDF nyanakieva from 91.216.253.59 on 2015-10-07 14:44:13 BST. DownloadPDF.
Downloaded by nyanakieva from 91.216.253.59 at 2015-10-07 14:44:13 BST. EMIS. Unauthorized Distribution Prohibited.

- 18 - Any redistribution of this information is strictly prohibited.
Copyright © 2015 EMIS, all rights reserved.
Segment Highlights
The market declined for a second consecutive year in 2014, but is expected to stabilise in value in 2015, as the MTR cuts that have undermined
revenue in the past few years are over. Mobile operator P4 expects the market to grow by 2% this year, while the Economist Intelligence Unit has
forecast CAGR of around 2.2% in the 2015-2019 period.
Market Value
The mobile telephony penetration in Poland is above the average compiled by the Telecom Market Matrix database. In 2014, Poland ranked 8th in
the European Union with a penetration rate of 139.2%, 7.2pps above the EU average. However, according to the Polish statistics office, the
penetration rate exceeded 150%.
Currently, 27 million Poles use mobile telephony services and this number is projected to grow by another 1mn by 2018. The number of mobile
telephony customers increased by 1.4% y/y last year. At the end of 2014, the number of registered SIM cards was 57.8mn.
The number of customers who switched their operators in 2014 stood at 1.81 million, up by 16.8% from the previous year.
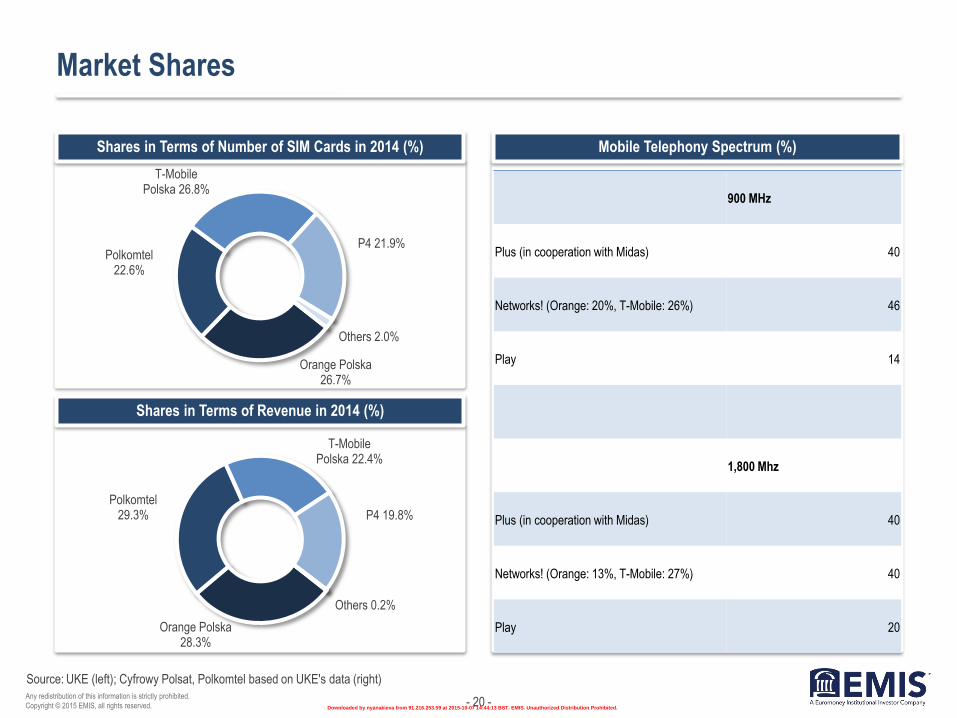
T-Mobile Polska, Deutsche Telekom's Polish business, remained the market leader with a 26.8% share, down by 0.2pps y/y, while the biggest growth was noted by P4 (Play network) - by 1.5 million users, or 14.1%. Operators outside of top 4 (MNO and MVNO) registered a combined fall of revenues by 22.1% y/y.
In terms of revenue, Polkomtel, a unit of media group Cyfrowy Polsat, became the leader, though its share inched down by 0.2pps to 29.3%.
At the end of 2014, as many as 69% of Polish internet users were equipped with smartphones, according to data by IAB Polska, which means that their penetration was equal to that of notebooks. In addition, 27% of them used tablets. The penetration indicators are expected to stabilise in the next two years. According to research firm TNS Polska, the penetration rates in May 2015 were 58% and 21%, respectively. The share of smartphone users surged by a total of 32pps over the last four years.
Penetration
Customer Base
Market Players
Smartphones
EMISPDF nyanakieva from 91.216.253.59 on 2015-10-07 14:44:13 BST. DownloadPDF.
Downloaded by nyanakieva from 91.216.253.59 at 2015-10-07 14:44:13 BST. EMIS. Unauthorized Distribution Prohibited.

- 19 - Any redistribution of this information is strictly prohibited.
Copyright © 2015 EMIS, all rights reserved.
Source:
Key Segment Data
Nominal Number of Users and Mobile Market Penetration in Poland
Share of Pre-paid and Post-paid Customers in Total Number of Subscribers (%)
UKE
41.4 43.9 44.8 47.0 50.1 53.9 57.0 57.8
108.6 115.2 117.4
123.2 131.6
140.0 148.0 150.2
2007 2008 2009 2010 2011 2012 2013 2014
SIM cards (mn)
Penetration (%)
51.2 52.6
54.2 54.2 54.0
48.8 47.3
45.8 45.8 46.0
2010 2011 2012 2013 2014
Pre-paid
Post-paid
EMISPDF nyanakieva from 91.216.253.59 on 2015-10-07 14:44:13 BST. DownloadPDF.
Downloaded by nyanakieva from 91.216.253.59 at 2015-10-07 14:44:13 BST. EMIS. Unauthorized Distribution Prohibited.
- 20 - Any redistribution of this information is strictly prohibited.
Copyright © 2015 EMIS, all rights reserved.
Source:
Market Shares
Shares in Terms of Number of SIM Cards in 2014 (%)
Shares in Terms of Revenue in 2014 (%)
Mobile Telephony Spectrum (%)
UKE (left); Cyfrowy Polsat, Polkomtel based on UKE's data (right)
Orange Polska 26.7%
Polkomtel 22.6%
T-Mobile Polska 26.8%
P4 21.9%
Others 2.0%
Orange Polska 28.3%
Polkomtel 29.3%
T-Mobile Polska 22.4%
P4 19.8%
Others 0.2%
900 MHz
Plus (in cooperation with Midas) 40
Networks! (Orange: 20%, T-Mobile: 26%) 46
Play 14
1,800 Mhz
Plus (in cooperation with Midas) 40
Networks! (Orange: 13%, T-Mobile: 27%) 40
Play 20
EMISPDF nyanakieva from 91.216.253.59 on 2015-10-07 14:44:13 BST. DownloadPDF.
Downloaded by nyanakieva from 91.216.253.59 at 2015-10-07 14:44:13 BST. EMIS. Unauthorized Distribution Prohibited.
- 21 - Any redistribution of this information is strictly prohibited.
Copyright © 2015 EMIS, all rights reserved.
Source:
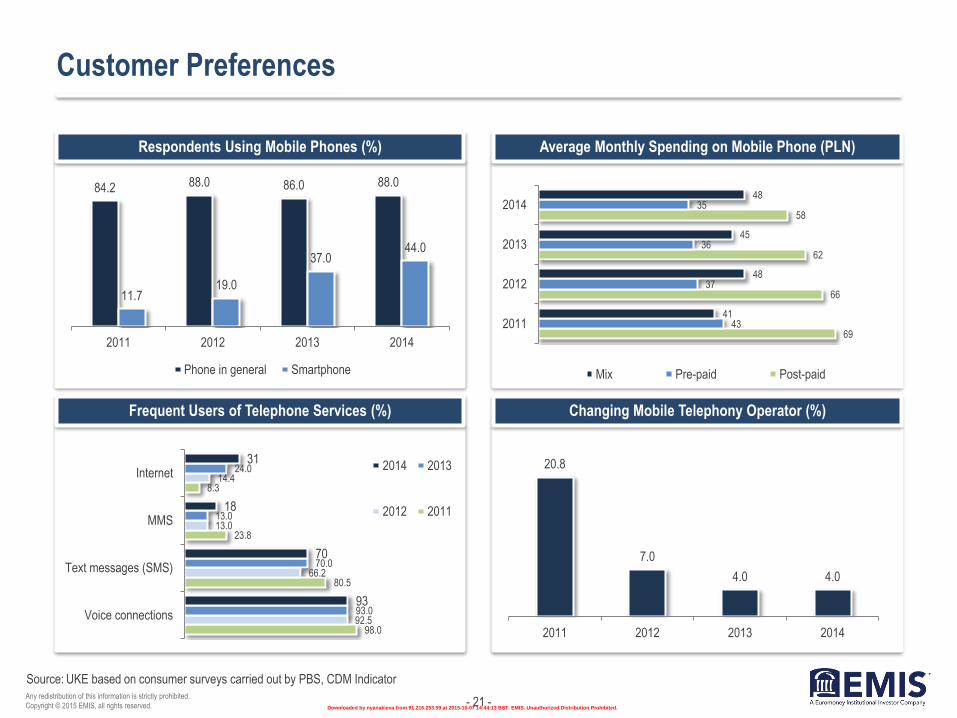
Customer Preferences
Respondents Using Mobile Phones (%)
Frequent Users of Telephone Services (%)
Average Monthly Spending on Mobile Phone (PLN)
Changing Mobile Telephony Operator (%)
UKE based on consumer surveys carried out by PBS, CDM Indicator
84.2 88.0 86.0 88.0
11.7 19.0
37.0 44.0
2011 2012 2013 2014
Phone in general Smartphone
69
66
62
58
43
37
36
35
41
48
45
48
2011
2012
2013
2014
Mix Pre-paid Post-paid
98.0
80.5
23.8
8.3
92.5
66.2
13.0
14.4
93.0
70.0
13.0
24.0
93
70
18
31
Voice connections
Text messages (SMS)
MMS
Internet2014 2013
2012 2011
20.8
7.0
4.0 4.0
2011 2012 2013 2014
EMISPDF nyanakieva from 91.216.253.59 on 2015-10-07 14:44:13 BST. DownloadPDF.
Downloaded by nyanakieva from 91.216.253.59 at 2015-10-07 14:44:13 BST. EMIS. Unauthorized Distribution Prohibited.

- 22 - Any redistribution of this information is strictly prohibited.
Copyright © 2015 EMIS, all rights reserved.
Source:
Roaming
Roaming Volumes Maximum Rates - Retail Level (PLN, incl. VAT)
UKE
1.70
1.48
1.48
1.22
1.22
0.97
0.54
0.41
0.41
0.36
0.36
0.25
0.54
0.46
0.46
0.41
0.41
0.31
3.57
2.3
2.3
1.02
H1/2012
H2/2012
H1/2013
H2/2013
H1/2014
H2/2014
Data transmission (MB) SMS sent
Incoming calls (min) Outgoing calls (min)
357
543 544
791
601
406
457
502
539 570
6 9 16 39
139
2010 2011 2012 2013 2014
Voice connections (mn minutes) Text messages (SMS) (mn)
Data transmission (MB)
EMISPDF nyanakieva from 91.216.253.59 on 2015-10-07 14:44:13 BST. DownloadPDF.
Downloaded by nyanakieva from 91.216.253.59 at 2015-10-07 14:44:13 BST. EMIS. Unauthorized Distribution Prohibited.
- 23 - Any redistribution of this information is strictly prohibited.
Copyright © 2015 EMIS, all rights reserved.
Source:
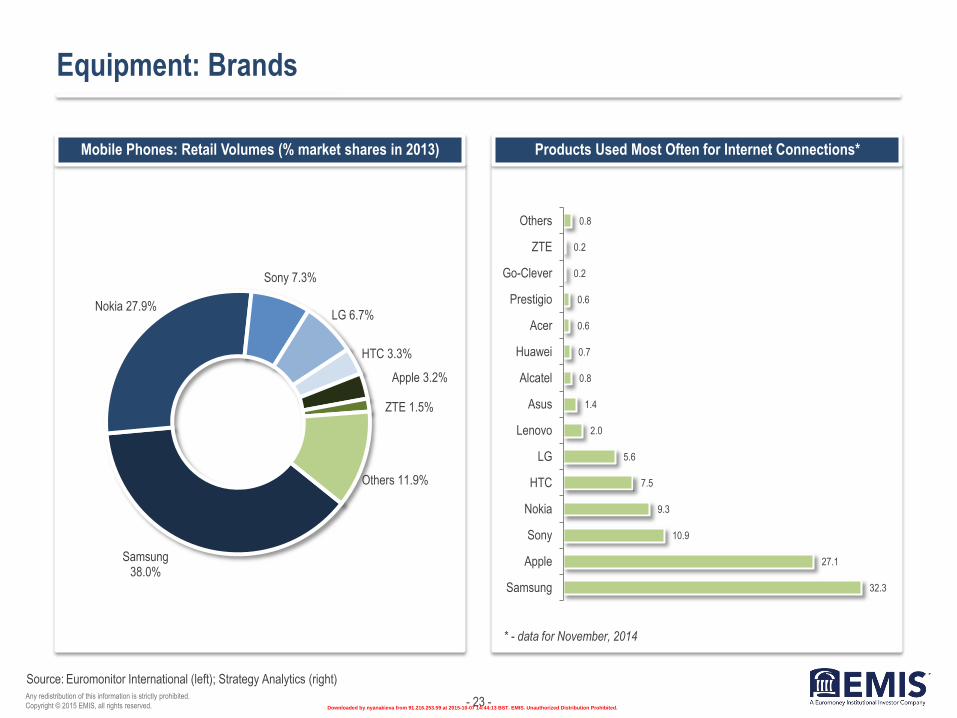
Equipment: Brands
Mobile Phones: Retail Volumes (% market shares in 2013) Products Used Most Often for Internet Connections*
Euromonitor International (left); Strategy Analytics (right)
Samsung 38.0%
Nokia 27.9%
Sony 7.3%
LG 6.7%
HTC 3.3%
Apple 3.2%
ZTE 1.5%
Others 11.9%
32.3
27.1
10.9
9.3
7.5
5.6
2.0
1.4
0.8
0.7
0.6
0.6
0.2
0.2
0.8
Samsung
Apple
Sony
Nokia
HTC
LG
Lenovo
Asus
Alcatel
Huawei
Acer
Prestigio
Go-Clever
ZTE
Others
* - data for November, 2014
EMISPDF nyanakieva from 91.216.253.59 on 2015-10-07 14:44:13 BST. DownloadPDF.
Downloaded by nyanakieva from 91.216.253.59 at 2015-10-07 14:44:13 BST. EMIS. Unauthorized Distribution Prohibited.

- 24 - Any redistribution of this information is strictly prohibited.
Copyright © 2015 EMIS, all rights reserved.
Source:
Equipment: Smartphones
Growth Dynamics of Mobile Devices* (%)
Smartphones Penetration in Poland (%)
Smartphone Operating Systems in 2014 (%)
Main Players
IAB Polska Mobile (upper left); TNS Polska (upper left and right)
Around 10% of the internet traffic in Poland is estimated to be generated
by mobile devices. A total of 60% of the local smartphone and tablet
users take to devices produced by Samsung and Apple.
53
15 22 5
167
125
66
15
2013 2014 2015 2016
Smartphones Tablets
* - Q1 of each year, among internet users aged 15 and above
25
31
44
55
61 64
9
19
40
51
57 60
Jan 2012 Jan 2013 Jan 2014 Jan 2015 Jan 2016 Jun 2016
Declarations Parameters
Android 65%
Windows Phone 16%
iOS 4%
Others 3%
Don't know 12%
EMISPDF nyanakieva from 91.216.253.59 on 2015-10-07 14:44:13 BST. DownloadPDF.
Downloaded by nyanakieva from 91.216.253.59 at 2015-10-07 14:44:13 BST. EMIS. Unauthorized Distribution Prohibited.

- 25 - Any redistribution of this information is strictly prohibited.
Copyright © 2015 EMIS, all rights reserved.
III. Fixed-line Telephony
EMISPDF nyanakieva from 91.216.253.59 on 2015-10-07 14:44:13 BST. DownloadPDF.
Downloaded by nyanakieva from 91.216.253.59 at 2015-10-07 14:44:13 BST. EMIS. Unauthorized Distribution Prohibited.

- 26 - Any redistribution of this information is strictly prohibited.
Copyright © 2015 EMIS, all rights reserved.
Segment Highlights
The segment's value continued to decline in 2014 when it fell by 12.7% to PLN 3.8bn (EUR 0.92bn). The number of fixed-line telephony users was
6.2mn (down by 8.4% y/y) and has remained on a downward trend since 2005.
Market Value
According to surveys, the main reason for owning a fixed-line telephone is being accustomed to having one. At the same time, fixed-to-mobile
substitution is increasingly accompanied by fixed-to-VoIP substitution.
The average monthly revenue per user in the segment declined by nearly 5% y/y to PLN 50.3 (EUR 12.19) in 2014 and was down by around PLN 7
since 2010.
The length of voice connections in the fixed-line segment amounted to 10.4bn minutes, down by over 1bn compared to 2013. The length of calls
per user was 145 minutes per year.
The market leader was Orange Polska (a unit of France's Orange), with 56.1% of the segment's users and 54.1% of its revenue, followed by Netia,
with 8.0% and 20.5%, respectively, and UPC with 8.7%. Other major players are UPC and Telefonia Dialog.
Substitution
ARPU
Traffic
Key Players
EMISPDF nyanakieva from 91.216.253.59 on 2015-10-07 14:44:13 BST. DownloadPDF.
Downloaded by nyanakieva from 91.216.253.59 at 2015-10-07 14:44:13 BST. EMIS. Unauthorized Distribution Prohibited.

- 27 - Any redistribution of this information is strictly prohibited.
Copyright © 2015 EMIS, all rights reserved.
Source:
Basic Data
Market Shares in Terms of Number of Subscribers (%)
Key Market Data
Market Shares in Terms of Revenue (%)
UKE
7.2 6.0
5.2 4.5 4.3 3.8
9.2 8.7 7.9 7.4 6.8 6.2
17.6
16.1 14.7
13.0 11.5
10.4
2009 2010 2011 2012 2013 2014
Revenue (PLN bn) Users (mn) Minutes (bn)
62.6
10.7
3.8
5.5
3.4
55.7
11.2
6.3
5.3
3.6
56.9
10.8
7.7
4.7
3.5
56.1
8
8.7
2.2
3.4
Orange
Netia
UPC
Telefonia Dialog
T-Mobile2014
2013
2012
2011
60.6
15.7
5.5
2.5
1.7
57.4
14.6
5.8
4.4
2.4
52.1
22.3
4.8
4.8
2.3
54.1
20.5
4.1
4.7
1.9
Orange
Netia
Telefonia Dialog
UPC
Telekomunikacja Novum 2014
2013
2012
2011
EMISPDF nyanakieva from 91.216.253.59 on 2015-10-07 14:44:13 BST. DownloadPDF.
Downloaded by nyanakieva from 91.216.253.59 at 2015-10-07 14:44:13 BST. EMIS. Unauthorized Distribution Prohibited.

- 28 - Any redistribution of this information is strictly prohibited.
Copyright © 2015 EMIS, all rights reserved.
Source:
Traffic
ARPU, Traffic
Average Monthly Use (minutes)
Revenue Structure by Service Elements (%)
UKE
65.2 57.4 55.4 51.1 52.7 50.3
160 154 154 147 141 145
2009 2010 2011 2012 2013 2014ARPU (PLN) Min per user/ month
108
8
28
Domestic calls International calls Fixed-to-mobile calls
50.1
51.2
62.6
62.9
62.3
37.8
34.7
33.3
26.4
25.5
12.1
14.0
4.1
10.7
12.1
2010
2011
2012
2013
2014
Others Calls Subscription fees
EMISPDF nyanakieva from 91.216.253.59 on 2015-10-07 14:44:13 BST. DownloadPDF.
Downloaded by nyanakieva from 91.216.253.59 at 2015-10-07 14:44:13 BST. EMIS. Unauthorized Distribution Prohibited.

- 29 - Any redistribution of this information is strictly prohibited.
Copyright © 2015 EMIS, all rights reserved.
Source:
Customers Preferences
Comments
Uninterested in Fixed-to-Mobile Substitution (%)
Owners & Spenders
Interested in Fixed-to-VoIP Substitution (%)
UKE
The owners of fixed-line telephones were mostly aged 60 and above
(51% from all age groups) as well as old-age and disability pensioners
(52% of all professional groups). Merely 7% of the people aged 15-24
used fixed-line telephony services and 8% in the 25-34 years bracket. 39
31
31
23
62
49
51
51
2011
2012
2013
2014
Average monthly spending (PLN)
Share of respondents owning fixed-line phone (%)
68.6
25.0
39.0 45.0
2011 2012 2013 2014
7.1
6.0
8.0
9.0
2011 2012 2013 2014
EMISPDF nyanakieva from 91.216.253.59 on 2015-10-07 14:44:13 BST. DownloadPDF.
Downloaded by nyanakieva from 91.216.253.59 at 2015-10-07 14:44:13 BST. EMIS. Unauthorized Distribution Prohibited.

- 30 - Any redistribution of this information is strictly prohibited.
Copyright © 2015 EMIS, all rights reserved.
Source:
VoIP
Traffic Volumes (bn min)
Number of Subscribers (mn)
Market Shares - Operators Offering VoIP in Own Network (%)
UKE
0.47 0.48
0.70
0.84
0.93
0.59
0.37 0.42
0.34
0.42
2010 2011 2012 2013 2014
In own operator's network
In other operator's network
0.75 0.92
1.05
1.47
1.89
0.26 0.40
0.52 0.59 0.63
2010 2011 2012 2013 2014
In own operator's network In other operator's network
Orange Polska 57.1%
Multimedia Polska 16.4%
Netia 12.9%
Telefonia Dialog 1.7%
Others 11.9%
EMISPDF nyanakieva from 91.216.253.59 on 2015-10-07 14:44:13 BST. DownloadPDF.
Downloaded by nyanakieva from 91.216.253.59 at 2015-10-07 14:44:13 BST. EMIS. Unauthorized Distribution Prohibited.

- 31 - Any redistribution of this information is strictly prohibited.
Copyright © 2015 EMIS, all rights reserved.
IV. Internet Access
EMISPDF nyanakieva from 91.216.253.59 on 2015-10-07 14:44:13 BST. DownloadPDF.
Downloaded by nyanakieva from 91.216.253.59 at 2015-10-07 14:44:13 BST. EMIS. Unauthorized Distribution Prohibited.

- 32 - Any redistribution of this information is strictly prohibited.
Copyright © 2015 EMIS, all rights reserved.
Segment Highlights
Broadband internet access continues to be more popular than mobile access services, but market penetration in both types of access exceeds
70%. In the case of the mobile segment, last year saw a rise of unlimited offers.
Broadband vs. Mobile
Among internet service providers, Orange Polska remained the leader with a market share of 29.1% (down by 3pps y/y), followed by Polkomtel
(Plus network) with an 8.8% share and T-Mobile Polska with an 8.3% share.
In December 2014, a total of 21.5mn people used the internet in Poland, up by 17.5% from December 2010, according to data from a Megapanel
PBI/Gemius survey. Data from pollster CBOS shows that 96% of local people aged 18-24 and 94% of those aged 25-34 used the internet, while in
the 55-64 years bracket the share was 42%; it was 20% in the case of users aged 65 and above.
According to Eurostat, 75% of the Polish households had internet access in 2014, which is a rise of 16pps from 2009. The statistics office reports
that nearly 75% of households in 2014 had at least one computer and 74.8% of them - internet access (up by 2pps y/y).
In 2014, a total of 94.4% of local enterprises used computers including almost all large enterprises. In 2014, 65% of the Polish enterprises had a
website, 75% of them placed orders via computer networks and 10% of them received orders via the internet.
Key Players
Internet Users
Households
Enterprises
EMISPDF nyanakieva from 91.216.253.59 on 2015-10-07 14:44:13 BST. DownloadPDF.
Downloaded by nyanakieva from 91.216.253.59 at 2015-10-07 14:44:13 BST. EMIS. Unauthorized Distribution Prohibited.

- 33 - Any redistribution of this information is strictly prohibited.
Copyright © 2015 EMIS, all rights reserved.
Source:
EMEA Comparison
Internet Access Penetration at EU Households (%) EMEA Average Peak Connection Speeds in Q1 2015 (Mbps)
Eurostat (left); akamai (right)
54
61
67
65
73
78
59 63 67
70 72
75
55 60
65
69 71
75
66
70 73
76
79 81
2009 2010 2011 2012 2013 2014
Cech Rep. Poland Hungary EU average
17.4
13.6
12.8
10.2
9.8
9.4
9.4
9.4
3.4
Ireland
Czech Rep.
Romania
Germany
Poland
Russia
Slovakia
Hungary
South Africa
EMISPDF nyanakieva from 91.216.253.59 on 2015-10-07 14:44:13 BST. DownloadPDF.
Downloaded by nyanakieva from 91.216.253.59 at 2015-10-07 14:44:13 BST. EMIS. Unauthorized Distribution Prohibited.

- 34 - Any redistribution of this information is strictly prohibited.
Copyright © 2015 EMIS, all rights reserved.
Source:
Key Segment Data
Actual Number of Internet Users (mn)
Internet Speed
Average Monthly Cost of Internet Access (PLN)
Frequency of Using Internet (%)
UKE (polls data based on consumer surveys carried out by PBS, CDM Indicator)
2.8 3.3 3.6
4.3
5.8 6.2 6.5
7.1 7.6 7.2
2010 2011 2012 2013 2014
Mobile Fixed-line
57
54
55
53
56
55
52
53
2011 2012 2013 2014
Fixed-line Mobile
2011 2012 2013 2014
up to 1.99 Mb/s 26.0 7.0 5.0 1.0
2-9.99 Mb/s 44.8 29.0 17.0 12.5
10-29.99 Mb/s 9.9 17.0 24.0 27.4
30 Mb/s and above 4.2 8.0 18.0 19.3
40.6
41.0
44.0
43.0
15.2
14.0
11.0
12.0
3.8
6.0
3.0
3.0
0.5
0
1
0
2011
2012
2013
2014
Several times a year Several times a monthSeveral times a week Everyday
EMISPDF nyanakieva from 91.216.253.59 on 2015-10-07 14:44:13 BST. DownloadPDF.
Downloaded by nyanakieva from 91.216.253.59 at 2015-10-07 14:44:13 BST. EMIS. Unauthorized Distribution Prohibited.

- 35 - Any redistribution of this information is strictly prohibited.
Copyright © 2015 EMIS, all rights reserved.
Source:
Internet Services Providers
Internet Services Providers in Total - Market Shares (%)
UKE
31.8
8.3
9.5
8.5
8.4
3.9
4.0
4.1
3.8
2.2
1.2
1.0
1.0
0.9
11.5
29.1
8.8
8.3
7.6
7.0
4.9
4.4
3.9
3.4
3.0
1.0
0.9
0.8
0.8
16.1
Orange Polska
Polkomtel
T-Mobile Polska
UPC
P4
Aero2
Netia
Vectra
Multimedia Polska
Cyfrowy Polsat
Inea
Telefonia Dialog
Internetia
Toya
Others
2014 2013
EMISPDF nyanakieva from 91.216.253.59 on 2015-10-07 14:44:13 BST. DownloadPDF.
Downloaded by nyanakieva from 91.216.253.59 at 2015-10-07 14:44:13 BST. EMIS. Unauthorized Distribution Prohibited.

- 36 - Any redistribution of this information is strictly prohibited.
Copyright © 2015 EMIS, all rights reserved.
Source:
Fixed-line Internet
Retail Market Penetration (%) Fixed-line Providers' Revenue Breakdown (%)
UKE
21.3 23.0 24.5 25.6 24.3 24.9 27.3
29.4 30.2 31.6
61.0
65.9 70.0
73.3 69.3 70.9
77.7
83.6 86.1
90.0
Per 100 inhabitants Of all households
38.0
18.2
23.1
9.3
6.4
5.0
32.3
23.3
22.9
9.7
6.9
4.9
30.1
26.8
22.4
8.8
6.4
5.4
27.1
31.8
20.7
7.5
7.5
5.5
xDSL
2G/3G modem
CATV modem
LAN-Ethernet
WiFi
other2014 2013 2012 2011
other - incl. fixed wireless access, leased
lines, satellite links, CDMA and WiMax
EMISPDF nyanakieva from 91.216.253.59 on 2015-10-07 14:44:13 BST. DownloadPDF.
Downloaded by nyanakieva from 91.216.253.59 at 2015-10-07 14:44:13 BST. EMIS. Unauthorized Distribution Prohibited.

- 37 - Any redistribution of this information is strictly prohibited.
Copyright © 2015 EMIS, all rights reserved.
Source:
Enterprises & Internet
Share of Firms Where Employees Use Computers* (%)
Share of Firms with Computers with Internet Access* (%)
Share of Firms with Internet by Types of Activity (%)
GUS
* - at least once a week in 2010-2013; without specifying frequency in 2014
33.3
35.2 36.1 37.2 36.3 33.6
34.3 35.7 36.4
34.6 30.8
34.4 34.1
36.0 36.1
34.8
36.2 37.6 38.6 37.7
2010 2011 2012 2013 2014
Total Small Medium Large
DSL Computer with 3G
modem 3G handset
Manufacturing 85.6 53.9 41.5
Electricity, gas, steam and air
conditioning supply 95.7 67.9 62.4
Water supply; sewerage, waste
management and remediation
activities
92 54.4 39.8
Construction 79.8 56.4 39.5
Trade; repair of motor vehicles 84 55.4 41.7
Transportation and storage 83.7 54.8 37
Accommodation and catering 78.3 50.1 32.6
Information and communication 95.6 79.2 74.5
Financial and insurance activities 97.7 60.4 50.8
Real estate activities 91.3 44.1 30.8
Professional, scientific and technical
activities 91.4 64.5 50.8
Administrative and support service
activities 84.8 62.4 43.6
Repair of computer and
communication equipment 98.7 75.3 70.1
37.1 38.3 39.0 39.4 37.6 34.6
39.1 39.3 40.4 39.8
45.9 46.8
47.9 48.7 46.7
40.1
42.3 42.8
43.8
42.1
2010 2011 2012 2013 2014
Small Medium Large Total
EMISPDF nyanakieva from 91.216.253.59 on 2015-10-07 14:44:13 BST. DownloadPDF.
Downloaded by nyanakieva from 91.216.253.59 at 2015-10-07 14:44:13 BST. EMIS. Unauthorized Distribution Prohibited.

- 38 - Any redistribution of this information is strictly prohibited.
Copyright © 2015 EMIS, all rights reserved.
Source:
Households & Internet
Type of Internet Connections in Households in 2014 (%) Households with Broadband Access to Internet at Home (%)
GUS
Mobile narrowband connection
4.4%
Connection over normal
telephone line or digital
connection 2.8%
Mobile wideband connection
24.6%
Fixed connection
with wideband access 59.7%
56.8
61.1
67.0
68.8
71.1
75.2
81.7
87.8
89.9
89.7
47.6
51.0
56.6
58.1
61.8
2010
2011
2012
2013
2014
Households without children Households with children Total
EMISPDF nyanakieva from 91.216.253.59 on 2015-10-07 14:44:13 BST. DownloadPDF.
Downloaded by nyanakieva from 91.216.253.59 at 2015-10-07 14:44:13 BST. EMIS. Unauthorized Distribution Prohibited.

- 39 - Any redistribution of this information is strictly prohibited.
Copyright © 2015 EMIS, all rights reserved.
Source:
Wholesale Market
Alternative Operators – Market Share by BSA Lines, 2014 (%)
Alternative Operators – Market Shares by LLU Lines in 2014
Structure of Market - Type of Infrastructure Used (%)
UKE
67.3
62.9 63.9
71.2
10.5 14.7 14.4
10.3
17.8 16.5
15.8 12.4
4.4 5.9 5.9 6.0
2010 2011 2012 2013
Orange Polska AO's own infrastructure BSA LLU
Netia 84.7%
T-Mobile 11.0%
Telestrada 1.9%
Telefonia Dialog 1.4%
Others 0.9%
98.9
1.1
Netia
Others
%
EMISPDF nyanakieva from 91.216.253.59 on 2015-10-07 14:44:13 BST. DownloadPDF.
Downloaded by nyanakieva from 91.216.253.59 at 2015-10-07 14:44:13 BST. EMIS. Unauthorized Distribution Prohibited.

- 40 - Any redistribution of this information is strictly prohibited.
Copyright © 2015 EMIS, all rights reserved.
Comments
Source:
Internet Content
The value of the Polish online advertisement market was estimated at USD 2.7bn in 2014 and according to global consultancy firm PwC should exceed
USD 4.0bn in 2018.
According to PwC, the share of online ads in the entire market should increase to around 36% in 2018, becoming its biggest segment.
Research firm IAB Polska forecasts 2014-2015 CAGR of the online ads segment at 5.3-7.8% (and 7.7-10.0% in its dynamic scenario) to PLN 2.56bn in
2014 an PLN 2.76bn in 2015.
Online Ad Spending (PLN bn) Internet Companies in Poland: Number of Users (end-2014)
0.743
1.216 1.373
1.582
2.003
2.206
2.432 2.609
2007 2008 2009 2010 2011 2012 2013 2014
20.2
16.8 16.4 15.6 15.3 15.3 12.6
11.1
mn users
EMISPDF nyanakieva from 91.216.253.59 on 2015-10-07 14:44:13 BST. DownloadPDF.
Downloaded by nyanakieva from 91.216.253.59 at 2015-10-07 14:44:13 BST. EMIS. Unauthorized Distribution Prohibited.

- 41 - Any redistribution of this information is strictly prohibited.
Copyright © 2015 EMIS, all rights reserved.
Comments
Source:
E-commerce
The value of the e-commerce market grew to EUR 7.4bn in 2014 from EUR 5.2bn in 2012, according to data by the Boston Consulting Group. BCG
expects this growth to continue and forecasts the market's value at EUR 22.6bn in 2020.
Poles spending online is smaller than the EU average: at EUR 535 and EUR 1,376, respectively, in 2013.
Persons Buying Online in Last 12 months (% of population) Devices Used for E-Shopping in 2014 (%)
GUS (left); mShopper Mobile Institute (right)
28.9
29.7
30.3
31.6
34.2
31.7
32.6
32.4
34.0
35.9
26.4
27.1
28.5
29.5
32.7
2010
2011
2012
2013
2014
Women Men Total
Computer 65%
Smartphone 17%
Tablet 12%
Other equipment 6%
EMISPDF nyanakieva from 91.216.253.59 on 2015-10-07 14:44:13 BST. DownloadPDF.
Downloaded by nyanakieva from 91.216.253.59 at 2015-10-07 14:44:13 BST. EMIS. Unauthorized Distribution Prohibited.

- 42 - Any redistribution of this information is strictly prohibited.
Copyright © 2015 EMIS, all rights reserved.
Source:
E-commerce (cont’d)
What Was Purchased Online (% of individuals ordering) Number of E-Commerce Services Users by Type in 2014 (mn)
GUS (left); Megapanel PBI/ Gemius (right)
2010 2011 2012 2013 2014
Clothes, sports goods 48.7 52.3 53.2 57.4 60.6
Other equipment* 43.5 40.9 45.3 44.3 41.6
Books, magazines 31 29.4 27.3 27.6 22.9
Electronic equipment excl. computers 19.9 16.2 19.1 17.5 19
Food and cosmetics 19.4 18.9 21.5 24.3 23.8
Films, music 19.8 15.9 16.7 16.5 11.6
Computer hardware 11.8 10.1 11.1 10.9 13.8
Tickets for sports or cultural events 16.7 14.4 14.9 16.5 16.3
Software (incl. games) 18.1 15.6 15.9 15.6 13.6
Holidays, tours, accommodation and
tickets 13 17.1 12 19.4 19.3
* Furniture, vehicles, household appliances, garden goods, hobby goods, tools,
toys, jewellery, works of art and collectibles
13.1
12.9
8.0
2.9
2.7
2.5
1.4
Shops
Auctions
Price comparison
Shopping hubs
Group buying
Discount sales
Opinions on shops and products
EMISPDF nyanakieva from 91.216.253.59 on 2015-10-07 14:44:13 BST. DownloadPDF.
Downloaded by nyanakieva from 91.216.253.59 at 2015-10-07 14:44:13 BST. EMIS. Unauthorized Distribution Prohibited.
- 43 - Any redistribution of this information is strictly prohibited.
Copyright © 2015 EMIS, all rights reserved.
Source:
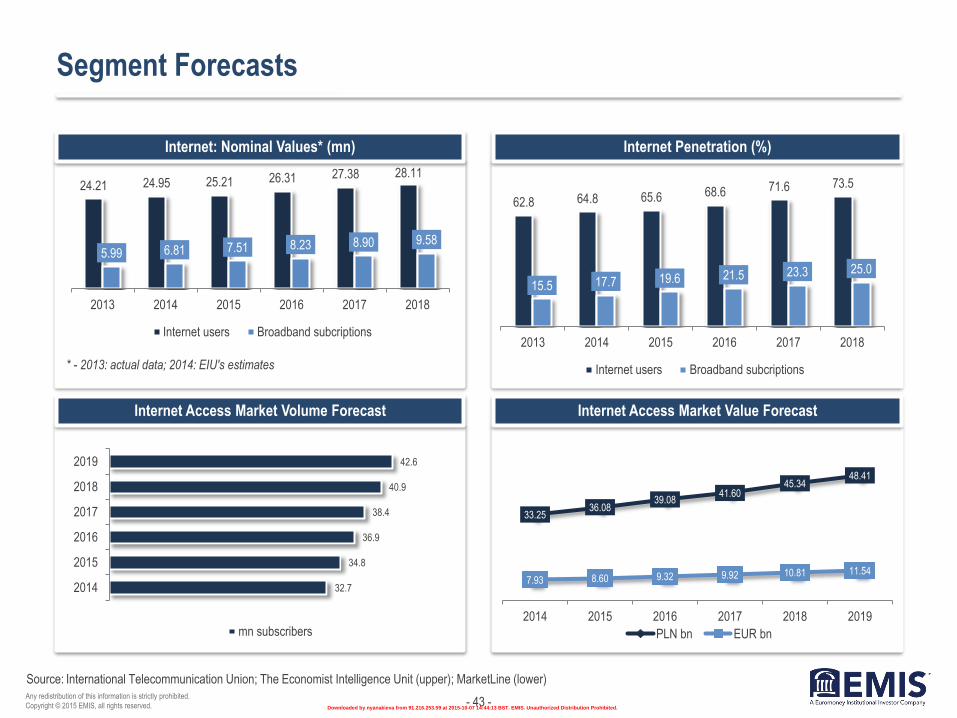
Segment Forecasts
Internet: Nominal Values* (mn)
Internet Access Market Volume Forecast
Internet Penetration (%)
Internet Access Market Value Forecast
International Telecommunication Union; The Economist Intelligence Unit (upper); MarketLine (lower)
24.21 24.95 25.21 26.31 27.38 28.11
5.99 6.81 7.51 8.23 8.90 9.58
2013 2014 2015 2016 2017 2018
Internet users Broadband subcriptions
* - 2013: actual data; 2014: EIU's estimates
62.8 64.8 65.6 68.6 71.6 73.5
15.5 17.7 19.6 21.5 23.3 25.0
2013 2014 2015 2016 2017 2018
Internet users Broadband subcriptions
32.7
34.8
36.9
38.4
40.9
42.6
2014
2015
2016
2017
2018
2019
mn subscribers
33.25 36.08
39.08 41.60
45.34 48.41
7.93 8.60 9.32 9.92 10.81 11.54
2014 2015 2016 2017 2018 2019
PLN bn EUR bn
EMISPDF nyanakieva from 91.216.253.59 on 2015-10-07 14:44:13 BST. DownloadPDF.
Downloaded by nyanakieva from 91.216.253.59 at 2015-10-07 14:44:13 BST. EMIS. Unauthorized Distribution Prohibited.

- 44 - Any redistribution of this information is strictly prohibited.
Copyright © 2015 EMIS, all rights reserved.
V. Pay TV
EMISPDF nyanakieva from 91.216.253.59 on 2015-10-07 14:44:13 BST. DownloadPDF.
Downloaded by nyanakieva from 91.216.253.59 at 2015-10-07 14:44:13 BST. EMIS. Unauthorized Distribution Prohibited.

- 45 - Any redistribution of this information is strictly prohibited.
Copyright © 2015 EMIS, all rights reserved.
Source:
Basic Data & Forecasts
Number of Households with Pay TV (mn) Top Cable TV Operators (in Q4/2014, % market share)
PwC (left);
4.7 4.6 4.6 4.5 4.5 4.5
5.8 5.8 5.8 5.8 5.7 5.7
0.2 0.3 0.4 0.4 0.5 0.6
2012 2013 2014 2015 2016 2017
Cable Sat IPTV
UPC Polska 31.25%
Vectra 19.98%
Multimedia Polska 17.83%
Inea 4.54%
Toya 3.70%
Others 22.70%
EMISPDF nyanakieva from 91.216.253.59 on 2015-10-07 14:44:13 BST. DownloadPDF.
Downloaded by nyanakieva from 91.216.253.59 at 2015-10-07 14:44:13 BST. EMIS. Unauthorized Distribution Prohibited.

- 46 - Any redistribution of this information is strictly prohibited.
Copyright © 2015 EMIS, all rights reserved.
Comments
Source:
TV Audience
The average Polish citizen watched TV for 4 hours and 48 minutes per day in Q1 2015, which is 3 minutes more than a year earlier. The growth trend is
attributed to the wider number of offered channels.
Viewers interest in the so-called big four channels, i.e. TVP1, TVP2, TVN, and Polsat, continues to fall: their combined share was 44.9% of the market in
Q1 2015, down by 3.1pps on the year.
TV Channels' Shares (according to audience) in Q1 2015 (%) Ad Market Shares (%, Q4 of each year)
National Broadcasting Council (KRRiT) (left); Starlink for the market, own data for TVN, airtime and sponsoring (right)
12.9
11.6
10.9
9.4
3.4
3.2
3.1
3.0
2.9
TVP1
Polsat
TVN
TVP2
TVN7
TV Puls
TVP Info
TV 4
TVN24
23.7
23.0 23.1
24.5
22.9 22.6
2013 2014
TVP Polsat TVN
EMISPDF nyanakieva from 91.216.253.59 on 2015-10-07 14:44:13 BST. DownloadPDF.
Downloaded by nyanakieva from 91.216.253.59 at 2015-10-07 14:44:13 BST. EMIS. Unauthorized Distribution Prohibited.

- 47 - Any redistribution of this information is strictly prohibited.
Copyright © 2015 EMIS, all rights reserved.
Highlights
Source:
Terrestrial Digital TV
Viewing Figures: Shares in Q1 2015 (%)
Viewing Figures: Shares in Q1 2015 (%) (cont’d)
At the end of Q1 2015, nearly 15.9mn Poles had access to
terrestrial digital TV services compared to 14.5mn a year
before. The number of people who used exclusively such
services (i.e. they had no access to cable or sat TV) was
close on 11.5mn vs. slightly above 10mn a year earlier.
In Q1 2015, the public TV channels (TVP1, TVP2, TV
Polonia, TVP Info, TVP Regionalna, TVP Rozrywka, TVP
Kultura, TVP Seriale, TVP Sport, TVP HD, TVP Historia,
and TVP ABC) held a 32% market share vs. 33% a year
earlier.
The average viewing audience of top 4 channels in Q1
2015 was 1.25mn.
KRRiT
Channel Share (%)
TVP1 16
Polsat 14.83
TVP2 11.49
TVN 10.63
TVP Info 5.65
TV Puls 5.13
TV4 4.23
TVN7 4.11
Puls 2 3.86
TV6 2.54
TTV 2.43
TVP Regionalna 1.92
Channel Share (%)
TVP Rozrywka 1.85
TVP ABC 1.71
Stopklatka 1.62
Fokus TV 1.57
ATM Rozrywka 1.56
Polo TV 1.32
TVP Historia 1.23
Eska TV 0.92
TVP Polonia 0.9
TVP Kultura 0.81
Polsat Sport News 0.56
EMISPDF nyanakieva from 91.216.253.59 on 2015-10-07 14:44:13 BST. DownloadPDF.
Downloaded by nyanakieva from 91.216.253.59 at 2015-10-07 14:44:13 BST. EMIS. Unauthorized Distribution Prohibited.

- 48 - Any redistribution of this information is strictly prohibited.
Copyright © 2015 EMIS, all rights reserved.
Source:
Comments
Added & Multimedia Services Market
The added and multimedia services market includes pay TV, mobile internet, fixed-line and mobile added services. Its growth is expected to accelerate this
year, which market researcher PMR attributes to the mobile internet segment.
Research firm PMR expects the Polish telecom market to drop in value by 1.1% in 2015, while the entire telecom and multimedia market (i.e. including also
pay TV) is expected to fall by 0.5%. Analysts expect the pay TV market to grow this year, though the outflow of customers to the terrestrial digital TV (that
offers over 20 channels already) may mean that this segment would have to fight declines.
Market Value & Dynamics
PMR
9.0 10.0
10.8 11.5
12.3 13.3
13.8
11.4
8.3
6.7 6.5
8.1
2010 2011 2012 2013 2014 2015
PLN bn % y/y change
EMISPDF nyanakieva from 91.216.253.59 on 2015-10-07 14:44:13 BST. DownloadPDF.
Downloaded by nyanakieva from 91.216.253.59 at 2015-10-07 14:44:13 BST. EMIS. Unauthorized Distribution Prohibited.

- 49 - Any redistribution of this information is strictly prohibited.
Copyright © 2015 EMIS, all rights reserved.
VI. Main Players
EMISPDF nyanakieva from 91.216.253.59 on 2015-10-07 14:44:13 BST. DownloadPDF.
Downloaded by nyanakieva from 91.216.253.59 at 2015-10-07 14:44:13 BST. EMIS. Unauthorized Distribution Prohibited.

- 50 - Any redistribution of this information is strictly prohibited.
Copyright © 2015 EMIS, all rights reserved.
Source:
M&A Activity
M&A Deals of 2015
EMIS DealWatch
Date Target Company Deal Type Buyer Seller EUR mn Stake %
03/06/2015 NextWeb Media Acquisition Wirtualna Polska Holding SA NextWeb Holdings Sarl 4.72 100.00
27/05/2015 OpenFM; PolskaStacja Acquisition Wirtualna Polska Holding SA GG Network; Polska Stacja sc 0.97 100.00
08/05/2015 Data center in Warsaw of MNI Acquisition Expedite Advisors Ltd MNI SA 4.37 100.00
08/05/2015 TK Telekom Privatization Netia SA Polskie Koleje Panstwowe SA 55.37 100.00
07/05/2015 Wirtualna Polska Holding SA IPO Institutional and private investors, EBRD Innova Capital Sp z oo 72.53 32.54
05/05/2015 3S SA Acquisition Enterprise Investors PCC SE; Polish private investors 22.00 76.00
13/04/2015 Ertel Acquisition Leon EDF SA 100.00
24/03/2015 Grupa Nokaut SA Acquisition HubStyle 2.54 53.33
16/03/2015 TVN SA Acquisition Scripps Networks Interactive Inc Grupa ITI SA; Canal Plus Group SA 584.00 52.70
25/02/2015 CallFreedom Acquisition Aspenta
04/02/2015 Wykop Acquisition Garvest BV Naspers Ltd 100.00
29/01/2015 Unizeto Technologies SA Acquisition Asseco Poland SA 4.57 81.30
14/01/2015 Gruper.pl Acquisition Zumzi.com Polskapresse
13/01/2015 Grupa Bankier.pl Acquisition Bonnier AB Naspers Ltd 4.70 100.00
EMISPDF nyanakieva from 91.216.253.59 on 2015-10-07 14:44:13 BST. DownloadPDF.
Downloaded by nyanakieva from 91.216.253.59 at 2015-10-07 14:44:13 BST. EMIS. Unauthorized Distribution Prohibited.

- 51 - Any redistribution of this information is strictly prohibited.
Copyright © 2015 EMIS, all rights reserved.
Source:
Top Companies
Top 10 Companies (according to 2014 sales revenue)
WSE-listed Companies from Telecom Sector
Incurred and Planned Investments (PLN mn)
Company data, Rzeczpospolita
12,212
7,410
6,245
4,392
1,674
1,594
1,483
1,000
706
617
Orange Polska
Cyfrowy Polsat
T-Mobile Polska
P4
Netia
TVN
UPC Polska
FH Kar-Tel
Multimedia Polska
Vectra
Company 12m price change Market value (PLN mn)
Cyfrowy Polsat -3.78 14,837
Hawe -55.48 143
Hyperion 31.48 117
Midas 12.73 917
MNI -2.99 129
Mediatel 100 222
Netia -0.89 1,963
Orange Polska -14.16 10,499
Tele-Polska Holding -58.6 28
2,335
432
1,511
367
279
1,916
711
1,091
358
280
1,775
491
1,230
511
232
2000
910
1000
520
200
Orange Polska
Polkomtel*
T-Mobile Polska
P4
Netia
2015 2014 2013 2012
* - in 2015, combined data for Polkomtel and Cyfrowy Polsat (the latter is now
the former's owner)
EMISPDF nyanakieva from 91.216.253.59 on 2015-10-07 14:44:13 BST. DownloadPDF.
Downloaded by nyanakieva from 91.216.253.59 at 2015-10-07 14:44:13 BST. EMIS. Unauthorized Distribution Prohibited.

- 52 - Any redistribution of this information is strictly prohibited.
Copyright © 2015 EMIS, all rights reserved.
Highlights
Source:
Orange Polska
Financial performance (PLN mn)
Employment Evolution
TPSA is a successor of state-owned enterprise Polska
Poczta, Telegraf i Telefon (Polish Post, Telegraph and
Telephone) that was established in 1947. TPSA started its
operations (after parting with the Polish Post) in 1992 and
debuted on the Warsaw Stock Exchange (WSE) in 1998. In
2000, the consortium of France Telecom and Kulczyk
Holding purchased 35% in the telecom in the first phase of
its privatisation and increased the share to 47.5% in 2001.
In 2004, Kulczyk sold his stake to France Telecom.
Currently, FT holds 49.79% in TPSA.
Telekomunikacja Polska and PTK Centertel merged at the
end of 2013: since then they have been operating as a
single company, Orange Polska. The merger was designed
to improve operational efficiency and enhance customer
care.
In March, 2014, Orange Polska and Commerzbank's
mBank announced the setting up of a mobile retail bank
earmarked for smartphone and tablet users. The services
will be delivered under the Orange brand; their debut has
been planned for H2/2014.
In February, 2014, Orange Polska finalised the sale of
Wirtualna Polska, one of the country's most popular general
interest internet portals, for PLN 383mn to private equity
fund Innova Capital.
Company data
16,560 15,715 14,922 14,147 12,923 12,212
6,280 4,711
5,928 4,845 4,084 3,921
1,281 107
1,918 855 294 535
2009 2010 2011 2012 2013 2014
Revenue EBITDA Net income
68,437
27,075 24,913 23,286 21,920 19,923 18,047
2001 2009 2010 2011 2012 2013 2014
workforce
EMISPDF nyanakieva from 91.216.253.59 on 2015-10-07 14:44:13 BST. DownloadPDF.
Downloaded by nyanakieva from 91.216.253.59 at 2015-10-07 14:44:13 BST. EMIS. Unauthorized Distribution Prohibited.

- 53 - Any redistribution of this information is strictly prohibited.
Copyright © 2015 EMIS, all rights reserved.
Highlights
Source:
Orange Polska (cont'd)
Group Revenue Evolution (% y/y; excl. regulatory impact)
Financial indicators
The group's revenue decline last year was limited to 2.5%
y/y excluding regulatory impact (i.e. impact of regulation of
rates, such as Mobile Termination Rate, Fixed Termination
Rate, Fixed-to-Mobile rate, customer and visitor roaming
rates, Bitstream Access rates). Overall, its revenue dropped
by 4.5% y/y to PLN 12.79bn.
Its pre-regulatory 2014 mobile revenues went up by 1.4%
y/y, driven by customer base increase, growing usage and
higher sales of equipment.
Restated EBITDA for 2014 amounted to PLN 3,921mn and
stood at 32.1% of revenues, i.e. they decreased by PLN
125mn on the year, however, the margin improved by 0.5
pp. The pre-regulatory decline resulted mainly from lower
revenues (an impact of PLN 319mn) and from higher
interconnect costs (PLN 171mn).
Company data
-6.4 -7.2
-9.9 -7.9
-9.3 -7.9 -5.4
-3.6
-0.8
-6.0
-9.6 -10.4
-10.9 -10.9
-5.4 -3.9
0.3 1.7
-18.5 -16.9 -17.0 -15.9 -15.6 -15.1 -13.1 -12.2
-14.2
6.0
9.4 6.6 6.0
3.7
-0.2 -1.2 -1.7
-2.6 Q4/2012 Q1/2013 Q2/2013 Q3/2013 Q4/3013 Q1/2014 Q2/2014 Q3/2014 Q4/2014
Group Mobile
Fixed voice Fixed broadband, TV and VoIP
0.7 0.4 1.0 1.1 1.1 3.8
1.7
5.0 4.5 4.1
21
11
28 26 25
2010 2011 2012 2013 2014
net debt/EBITDA net debt (PLN bn) net gearing (%)
EMISPDF nyanakieva from 91.216.253.59 on 2015-10-07 14:44:13 BST. DownloadPDF.
Downloaded by nyanakieva from 91.216.253.59 at 2015-10-07 14:44:13 BST. EMIS. Unauthorized Distribution Prohibited.

- 54 - Any redistribution of this information is strictly prohibited.
Copyright © 2015 EMIS, all rights reserved.
Comments
Source:
Orange Polska (cont'd)
Organic cash flow amounted to PLN 1,149mn in 2014, up by PLN 44mn versus 2013, and was in line with the group's full-year guidance (i.e. keeping this
figure at least stable at the 2013 level of PLN 1.1bn). The target for 2015 is around PLN 900mn (including cash capex for fibre access network project).
Capex Reduction Key Investment Areas in 2014 (%)
Company data
2.2
2.7
2.6
2.3
1.9
1.8
13.3
17.3
17.5
16.5
14.8
14.5
2009
2010
2011
2012
2013
2014
Capex/sales PLN bnFixed access network (incl.
fibre) 24%
Mobile network 20%
Core network 9%
IT systems and infrastructure
32%
Other 5%
CPE 10%
EMISPDF nyanakieva from 91.216.253.59 on 2015-10-07 14:44:13 BST. DownloadPDF.
Downloaded by nyanakieva from 91.216.253.59 at 2015-10-07 14:44:13 BST. EMIS. Unauthorized Distribution Prohibited.

- 55 - Any redistribution of this information is strictly prohibited.
Copyright © 2015 EMIS, all rights reserved.
Highlights
Source:
Cyfrowy Polsat
Revenue (PLN mn)
Customer Base (mn)
Cyfrowy Polsat is one of the largest Polish companies and a
leading media and telecommunications group in the region. It
provides 16.5mn services to 6.1mn customers.
The Group consists of the following companies and brands:
* Cyfrowy Polsat - Poland's largest and Europe's fourth-
biggest satellite TV platform (with a 32% market share in Poland in
2014)
* Polkomtel - the operator of the Plus mobile telephony
network (with a 28.1% market share in terms of contract SIM
cards in 2014, i.e. the leader of this segment)
* Polsat TV - the leading commercial broadcaster in Poland in
terms of both audience and ad market shares (its flagship channel
achieved 13.3% all-day audience share in 2014 vs. 13.0% of its
major competitor's main channel TVN).
* ipla - the leader of the online video market in Poland (with
over 1,600 feature films and over 100 TV series).
Recently, Cyfrowy Polsat has successfully issued corporate
unsecured series A bearer bonds having with the nominal
value of PLN 1bn. On Jul 10, the bonds were allocated to 52
investors who included numerous investment and pension
funds as well as the European Bank for Reconstruction and
Development (EBRD). In June, 2015, the company and a
group of financial institutions commenced negotiations that are
intended to provide Cyfrowy Polsat with financial resources
which will enable refinancing of the outstanding indebtedness
of the company and its subsidiaries.
Company data
7,773
7,673
7,312
7,133
6,682
6,570
1,266
1,482
2,366
2,778
2,521
7,410
2009
2010
2011
2012
2013
2014
Cyfrowy Polsat Polkomtel
Note: Cyfrowy Polsat has not consolidated Polkomtel fully yet.
14.04
3.20
14.06
3.44
13.99
3.55
13.84
3.57
14.13
3.54
n.a.
4.40
Polkomtel Cyfrowy Polsat
2009 2010 2011 2012 2013 2014
EMISPDF nyanakieva from 91.216.253.59 on 2015-10-07 14:44:13 BST. DownloadPDF.
Downloaded by nyanakieva from 91.216.253.59 at 2015-10-07 14:44:13 BST. EMIS. Unauthorized Distribution Prohibited.

- 56 - Any redistribution of this information is strictly prohibited.
Copyright © 2015 EMIS, all rights reserved.
Highlights
Source:
T-Mobile Polska
Financial Results (PLN mn)
Customer Groups
T-Mobile Polska (until May, 2013 - Polska Telefonia
Cyfrowa, PTC) was founded in 1995 as a limited liability
company and was transformed into a joint-stock company
in 2011. Its current sole owner, Deutsche Telekom Group,
was one of its co-founders. In 2011, it replaced the Era
brand with the T-Mobile brand.
T-Mobile and PTK Centertel, operator of the Orange
network, signed an agreement in 2011 to share their radio
access networks. The agreement covers management,
planning, support, development and maintenance of the
joint networks. They established NetWorkS!, a company in
which both operators hold an equal 50% of shares. They
stress that each party remains the owner of their networks
and frequencies. Both operators will continue to compete in
the wholesale and retail market of telecommunications
services under their existing brands.
In the spring of 2014, T-Mobile Polska and Alior Bank
launched what they called the most advanced bank-
telecom cooperation in Europe: "T-Mobile Usługi Bankowe,
dostarczane przez Alior Bank" (T-Mobile Banking Services,
delivered by Alior Bank), which replaced Alior Sync - the
bank's internet-only offer.
Company data
7,602 7,345 7,157 7,023 6,648
6,245
2,661 2,758 2,595 2,454 2,516 2,420
2009 2010 2011 2012 2013 2014
Revenue EBITDA
7.00 7.01 7.04 7.06 7.05 6.99 6.93 6.89 6.82 6.78 9.04 8.91 8.93 8.61 8.51 8.76 8.75 8.84 8.88 9.01
16.04 15.92 15.97 15.67 15.56 15.75 15.68 15.73 15.70 15.79
2006 2007 2008 2009 2010
Post-paid Pre-paid Total
EMISPDF nyanakieva from 91.216.253.59 on 2015-10-07 14:44:13 BST. DownloadPDF.
Downloaded by nyanakieva from 91.216.253.59 at 2015-10-07 14:44:13 BST. EMIS. Unauthorized Distribution Prohibited.

- 57 - Any redistribution of this information is strictly prohibited.
Copyright © 2015 EMIS, all rights reserved.
Highlights
Source:
P4
Financial results (PLN bn)
Customer Groups (mn)
In 2005, Netia Mobile – backed by Icelandic tycoon Thor
Bjorgolfsson - won the tender for the fourth infrastructure-
based mobile telephony operator in Poland, (beating e.g.
Hutchison Whampoa). Later that year, Bjorgolsson's
Novator Telecom Poland SARL merged with Netia Mobile.
Still in 2005, the company was renamed P4 (limited liability
company). P4's current shareholders are Novator (49.7%)
and Tollerton (50.3%). According to media reports, the
owners have invested PLN 2.61bn in the company, of
which PLN 2.3bn (EUR 0.6bn) was in cash and the
remaining part - by a contribution in kind (telecom
equipment shop chain Germanos).
In March, 2007, P4 launched its Play network for retail
customers (an in October - for business customers). In
January, 2008, it reached the first 1mn customers. In early
2013, P4 announced it had 8.7mn customers. In October,
2013, P4 announced it reached 10mn customers and
became the 20th biggest operator in the EU.
At the end of Q1 2015, its customer base grew to 12.7mn
(i.e. by 15.9% y/y), while the share of post-paid custoemrs
rose to 48.3% from 45.0% a year before. Thus, Play's
market share increased by 2.6pps to 21.9%. At the same
time, it had 75% of Poland's territory within its LTE services
network.
Company data
2.00
2.67
3.58 3.72
4.39
0.46 0.87
0.56 0.71 1.07
2010 2011 2012 2013 2014Revenue Adjusted EBITDA
2.93 3.96
4.81 5.96
6.48
2.24
3.12 3.88
4.77 5.81
5.16
7.08
8.69
10.73
12.29
2006 2007 2008 2009 2010
Pre-paid Post-paid Total
EMISPDF nyanakieva from 91.216.253.59 on 2015-10-07 14:44:13 BST. DownloadPDF.
Downloaded by nyanakieva from 91.216.253.59 at 2015-10-07 14:44:13 BST. EMIS. Unauthorized Distribution Prohibited.

- 58 - Any redistribution of this information is strictly prohibited.
Copyright © 2015 EMIS, all rights reserved.
Highlights
Source:
Netia
Financial Results (PLN mn)
Operating Results (thou)
R.P. Telekom (Netia's predecessor) was set up in 1990. In 1991, the company received its first license for delivering telecom services - in the city of Pila. In 1999, it received licenses for offering data transmission and internet access services; also that year, Netia debuted on NASDAQ. In 2000, it debuted on the Warsaw Stock Exchange (WSE).
In 2008, Netia sold a minority stake in P4 - the operator of the Play mobile network - and took over Tele2 Polska. In 2011, it carried out acquisitions of Crowley Data Poland and Telefonia Dialog.
Netia has around 14 thousand km of fibre-optic infrastructure and around 70% of Polish offices within the reach of its network.
In late July, 2015, Netia signed a final agreement to acquire 100% shares of TK Telekom from the Polish state railways PKP. for "just below" PLN 222mn. The transaction has been funded from available credit lines and Netia’s own resources (earlier, Netia secured a PLN 400mn loan from mBank and DNB, earmarked for, among others, paying for TK Telekom). Thanks to this deal, the reach of the Netia group's own fiber backbone network will grow by around 7,5 thousand kilometers. The transaction will scale up the Netia Group's operations in the B2B segment even by over 28% (pro-forma data for 2014).
Netia also stressed that after paying out dividends of PLN 0.60 per share and canvassing TK Telekom the financial leverage of the company remains on a comfortable level.
Company data
1,506 1,569 1,619
2,121 1,876
1,674
304 359 408 591 551 493
2009 2010 2011 2012 2013 2014
Revenue Adjusted EBITDA
559
690
912
875
849
790
1,158
1,218
1,745
1,644
1,489
1,331
n.a.
n.a.
2,789
2,688
2,526
2,305
2009
2010
2011
2012
2013
2014
Services (RGUs) Fixed voice subscribers Broadband subscribers
EMISPDF nyanakieva from 91.216.253.59 on 2015-10-07 14:44:13 BST. DownloadPDF.
Downloaded by nyanakieva from 91.216.253.59 at 2015-10-07 14:44:13 BST. EMIS. Unauthorized Distribution Prohibited.

- 59 - Any redistribution of this information is strictly prohibited.
Copyright © 2015 EMIS, all rights reserved.
Contact:
Corporate Headquarters
6-8 Bouverie Street
London EC4Y 8DD
UK
Voice: +44 20 7779 8100
Fax: +44 20 7779 8224
Americas Headquarters
225 Park Avenue South
New York, New York 10003
US
Voice: +1 212 610 2900
Fax: +1 212 610 2950
Asia Headquarters
Eucharistic Congress Bldg. No.
III
4th Floor, 5 Convent Street
Mumbai 400 001
India
Voice: +91 22 22881123
Fax: +91 22 22881137
Disclaimer:
The material is based on sources which we believe are reliable, but no warranty, either expressed or implied, is provided in relation to the accuracy or completeness
of the information. The views expressed are our best judgment as of the date of issue and are subject to change without notice. EMIS and Euromoney Institutional
Investor PLC take no responsibility for decisions made on the basis of these opinions.
Any redistribution of this information is strictly prohibited. Copyright © 2015 EMIS, all rights reserved. A Euromoney Institutional Investor company.
About EMIS Insight
EMIS Insight is a unit of EMIS that produces proprietary strategic research and analysis. The service features market overviews, industry trend analysis, legislation
and profiles of the leading sector companies provided by locally-based analysts.
About EMIS
Founded in 1994, EMIS (formerly known as ISI Emerging Markets) was acquired by Euromoney Institutional Investor PLC in 1999. EMIS works from over 15 offices
around the world to deliver electronic information products, by subscription, to institutional customers globally. EMIS provides hard-to-get information covering more
than 100 emerging markets. Its flagship products are EMIS Intelligence and EMIS Professional.
EMIS clients include top investment banks, corporations, law firms, consultants, investment and insurance companies, universities and libraries, multilateral
organisations, and others.
EMISPDF nyanakieva from 91.216.253.59 on 2015-10-07 14:44:13 BST. DownloadPDF.
Downloaded by nyanakieva from 91.216.253.59 at 2015-10-07 14:44:13 BST. EMIS. Unauthorized Distribution Prohibited.