piecing together the indicators of student achievement
TRANSCRIPT

Piecing Together the Indicators of Student Achievement
Module 1.5: Facilitator Guide
Module: -Review School Partnership Agreement -Oak Tree Metaphor: Quantitative v. Qualitative Data -School Report Card Jigsaw (or) -Here’s What, So What, Now What
Level: All School Levels
Participants: A Leadership Team representing all stakeholders including certificated, classified, parents, community and students at the secondary level
Facilitator: Participant Ratio
1:25 (1 Facilitator for every 25 participants)
Approximate Time Frame:
1 hr.

1
Module 1 Summary
The “Big Ideas”
This module was designed to help all school stakeholders see the importance of piecing together quantitative and qualitative indicators of student achievement. Data alone are only able to provide a snapshot of growth and performance and do not tell the story of the various supports implemented at the school site to support student achievement. The LAUSD School Report Card is a unique tool that captures a few of both. By using the oak tree as a metaphor, the module uses the participants’ prior knowledge of the support needed to grow a strong oak tree. The conversation transitions from the oak tree to the student. In the end participants will learn that gains and drops in student performance indicators cannot solely be measured by numbers but pieced together with qualitative indicators.
Participants’ Learning Objectives
By the end of this training module, participants should be able to:
Learn how quantitative and qualitative data can be pieced together to tell the full story of what is taking place at a school
Become familiar with a few school performance indicators by use of the LAUSD School Report Card
Understand that quantitative and qualitative measures (data) tell a credible story about a school when pieced together
Presenter’s Activities to Support this Learning
During this training, the presenter will engage participants in
Activity 1: Forming Small Groups
Activity 2: Oak Tree Metaphor: Quantitative v. Qualitative Data
Activity 3: Ice Breaker: Data Quest-ion
Activity 4: LAUSD School Report Card Jigsaw or Here’s What, So What, Now What
Activity 5: Partnership Agreement Process (Gallery Walk)
Next Steps:
o Closing Thought
o What Did We Achieve
Tools and Materials
Handouts
Partnership Agreement
PowerPoint slides
Ice Breaker Handout
2 Oak Tree Posters (1 Copy 8.5x14 and 1 Copy 10x17)

2
Topic Presentation Points Supporting Materials
Opening
(10 Minutes)
TIMES ARE APPROXIMATES
Display and review slide 1.
Lead Facilitator welcomes all participants emphasizing that we will become familiar with quantitative and qualitative performance indicators.
“Thank you for taking the time to participant in this important meeting space for learning, reflecting and relationship building
Introduce yourself, state who you are, your role at the school and communicate that you are today’s LEAD FACILITATOR
Define your role as a facilitator: a guide for the conversation and decision-making that takes place during the session
“I will have no direct input or share biases while facilitating. In the case I become a participant, another member from my team will then serve as a support facilitator, and will clearly communicate the shift of roles”
Always follow this step when a facilitator enters or leaves the facilitator role
Display and review slide 2.
“At LAUSD we provide parents a resource called the LAUSD School Report Card. The intent of the report card is to inform parents about their school’s process and to learn that we must observe a variety of performance indicators to better understand the school as a whole”
“In order to have a full picture

3
Topic Presentation Points Supporting Materials
we rely on quantitative and qualitative data. Today’s session will help you become familiar with both”
Introduce participants to the Oak Tree and share that like a tree we rely on various elements/information, data, to determine what affects a tree’s growth or what affects a student’s/school’s achievement or performance gains
“Today’s gathering brings together a few key partners who are critical in the academic growth of our youth as we prepare them for college, career and life readiness”
Emphasize that by the end of the gathering we provide you a space to reflect and learn about the holistic performance of our school.
Session Objectives & Group Agreements
(20 minutes)
Display and review slide 3.
Learning objectives
Clarify any questions from the session participants
Also reference the partnership icon which was introduced during the partnership workshop: explain that this partnership is important because data is information that all partners must become familiar with as advocates for the students

4
Topic Presentation Points Supporting Materials
Display and review slide 4.
Introduce the important role that group agreements play in a community, particularly in the process of forming partnerships for student achievement
“During our last partnership workshop we came together with representatives from all stakeholders to adopt our group agreements, definition of partnership for student achievement and examples of ways in which we will model the partnership. It is the responsibility of each of us to see that the agreements are present in our daily interactions”
Display and review slide 5.
Building small groups will be very helpful for this workshop
As you form small groups see that each small group has a bilingual representative who can support small group translation
Use this slide to form small groups and to energize the participants
Once completed ask the small groups to gather their personal belongings and find a seat with their small group members
Display and review slide 6.
“Data tells us a lot about the environment that is designed for any living organism to grow. Take this Oak Tree for example. If the Oak Tree is provided the essential environment in which it can build on its strengths and grow,

5
Topic Presentation Points Supporting Materials
quantitative data will be used to assess quality of its environment. The growth in inches each year gives us the quantitative result however; the care the tree was given, the soil it grows in and the access to sunlight provide a qualitative glimpse into its growth for that one year”
Display and review slide 7
Click once over slide 7 and leave the small standing tree image on the screen: Highlight that the growth of this tree in year 1, 2 and 3 will vary depending on the resources that are available to achieve the highest gains of growth
Click again and the full grown tree will appear: To measure the impact of the resources provided to the tree in its environment we rely on data which is a type of information collected
“No matter the environment, if given the proper care, support and resources necessary a tree will grow”
Click again and show the dessert scene
Click again and show the tropical scene
Click again and show the urban environment
Click again and show the forest environment
“Whether the environment be tropical, dry or cloudy growth is possible”

6
Topic Presentation Points Supporting Materials
Display and review slide 8
This slide provides a definition for quantitative data as well as qualitative data
Ask a participant from the audience to read the first definition out-loud
Ask another participant to describe what this definition might mean to them based on their prior knowledge
Ask a participant from the audience to read the second definition out-loud
Ask another participant to describe what this definition might mean to them based on their prior knowledge
Take your small tree and large tree templates provided with this facilitator’s guide and post those in a visible space for all participants
Write the data points for year 1 found on Slide 9 (each post it note should contain one of the data points)
o Ex. Tree 1 Growth of 15 in Tree
o Ex. Tree 2 Growth of 35 in.
Do the same for each of the data points
One by one place the post it notes on Tree 1 and 2 and ask the audience what qualitative information might help us understand why one tree grew more than the other tree
Feel free to take a few perspectives from the audience to clarify why one tree grew
Tree 1 Growth:
15 Inches

7
Topic Presentation Points Supporting Materials
more than the other
Display and review slide 9
Display and review slide 10
Ask one of the participants to read the quote out-loud: “From a Small Seed a Mighty Trunk May Grow”
Guide participants back to the idea of the environment and to the picture which shows how a tree can grow in any environment with the right resources and support
Display and click once as you review slide 10
Begin by showing participants that just like our Oak Tree, our schools represent various learning environments for our unique student learners
Click the slide again and communicate to your participants that the differentiated/individualized learning that is available to students will greatly support their own growth over time
“Some students are most successful when they receive additional support from their teacher working 1-on-1. This learning environment might help the student reflect on their behavior and allow the educator to see how to address the learning style of the student”

8
Topic Presentation Points Supporting Materials
“Some students are most successful when they are paired with a partner during a lesson. This learning environment might allow a student to focus on their partner as they work on a task”
“Other students might have the greatest growth if their learning environment is structured as work stations where the students develop unique skills while working on a learning objective”
“Some students are most successful when an individualized learning plan is adopted for the student with the support of the parent and the educator”
“This is why we are here today learning about data”
Display and review slide 12
This ice breaker transitions parents to take the information learned and make a connection with a personal experience at home
Distribute the sheet of paper that has the following questions printed on it:
o What activity or chore consumes the greatest amount of time for you after school hours?
o How many hours do you invest in this activity/chore?
After the 10 minutes are over ask participants to write down any categories of chores they found during their investigation: Laundry, Dinner, Television

9
Topic Presentation Points Supporting Materials
“Who might want to share which activity took the greatest amount of time after school?”
Ask a few participants to share their findings
Conclude by telling parents that we quantified pastime data for our parents but do not have the qualitative data to explain why parents engage in these activities
Ask any parents if helping their child with homework was a category discussed
Display and review slide 13
Display and review slide 14
Introduce participants to the LAUSD School Report Card
The School Report Card is a valuable tool for parents where they can access both quantitative and qualitative data to better understand their school’s progress as a whole
Say: The LAUSD School Report Card is broken down by the following sections:
o Status: Include performance indicators that are part of the LAUSD School Performance Framework (SPF)
CST Prof Math/ELA,
10
Topic Presentation Points Supporting Materials
CAHSEE Pass rate, Attendance, Graduation, Suspensions
o Growth: Includes the school’s cumulative points earnws on the SPF and a tiered ranking from Focus to Excelling; the schools Academic Growth Over Time (AGT) is also located here
o Learning Environment: Captures stakeholder survey data from the School Experience Survey
o Student Groups: Include student demographic data and CST proficiency data by demographic
o Readiness: Data that inform about student readiness for middle/high school and college/career at the secondary level
o Learn More: Include data of student groups who have been historically underserved
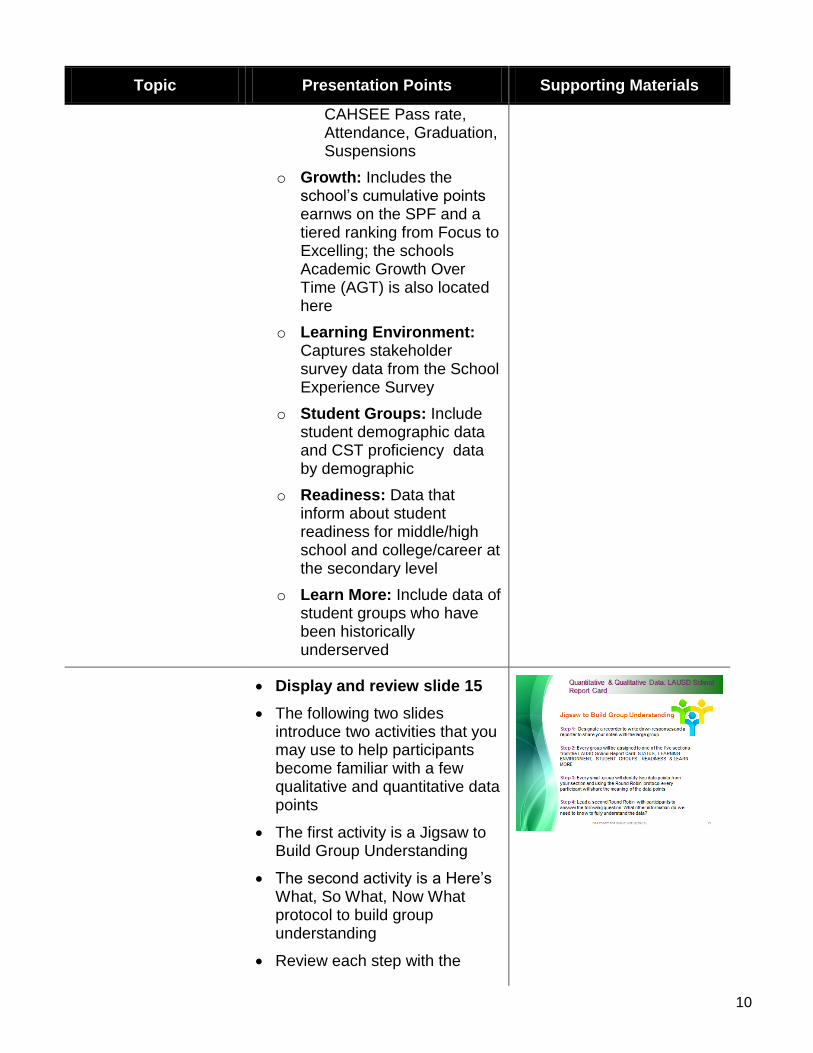
Display and review slide 15
The following two slides introduce two activities that you may use to help participants become familiar with a few qualitative and quantitative data points
The first activity is a Jigsaw to Build Group Understanding
The second activity is a Here’s What, So What, Now What protocol to build group understanding
Review each step with the
11
Topic Presentation Points Supporting Materials
audience
Ask a participant to repeat the steps out-loud as a test to check understanding
Once the task is completed ask a team representative to share their team analysis with the large group
Ask clarifying questions such as:
o Would you consider this data point a quantitative or qualitative piece of data?
o What other information might we need to know more about what the data is telling us?
o Why might this data not give a complete picture of the whole school?
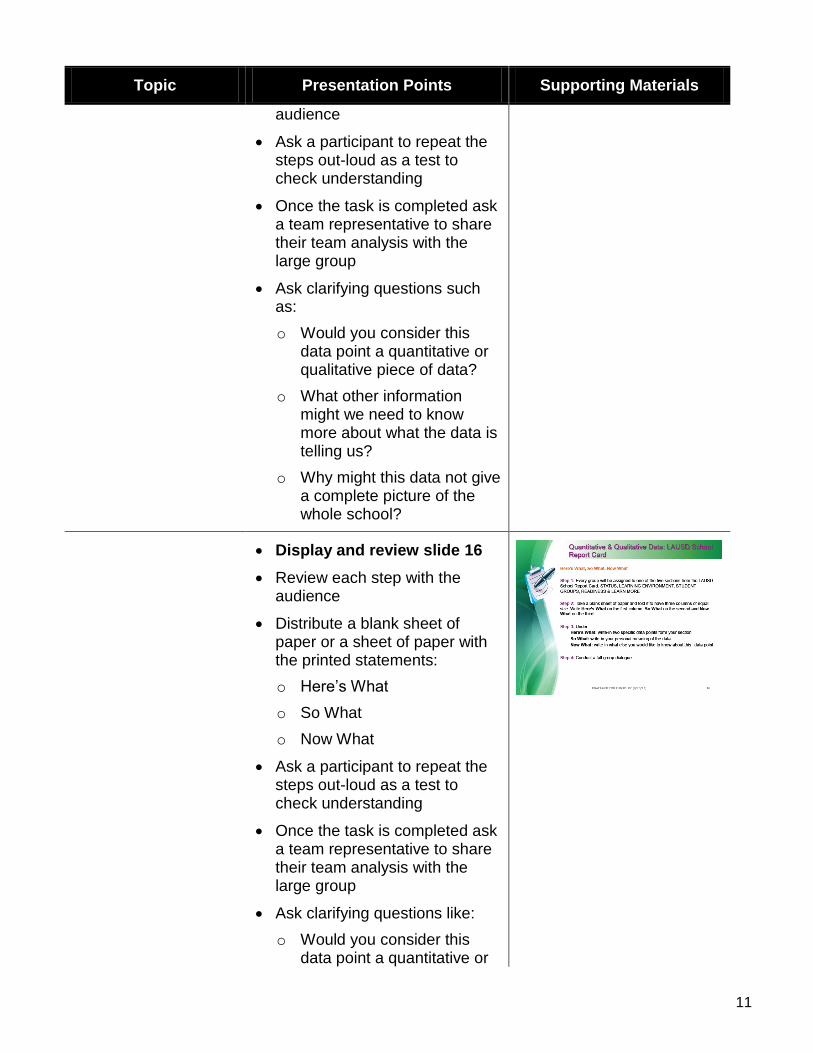
Display and review slide 16
Review each step with the audience
Distribute a blank sheet of paper or a sheet of paper with the printed statements:
o Here’s What
o So What
o Now What
Ask a participant to repeat the steps out-loud as a test to check understanding
Once the task is completed ask a team representative to share their team analysis with the large group
Ask clarifying questions like:
o Would you consider this data point a quantitative or

12
Topic Presentation Points Supporting Materials
qualitative piece of data?
o What other information might we need to know more about what the data is telling us?
Why might this data not give a complete picture of the whole school?
Display and review slide 17
Display and review slide 18
“Before we close it is important to restate the importance of offering meeting spaces where we come together to become familiar with the various support systems and steps to provide a unique learning environment for all students”
“As the School Report Card demonstrates, our students have unique skills, talents and growth opportunities”
“In partnership we can work towards building model learning environments for all students”
“Like our Oak Tree our students can grow to their full potential once given the resources and the individualized learning environment deserved or required”
13
Topic Presentation Points Supporting Materials
Display and review slide 19
“We must form a partnership that strives to build the best for our students and that partnership includes all of us”
Display and review slide 20
Review the step for this activity
Ask a participant to repeat the step out-loud to check for understanding
Ask a few participants to share their ideas with the larger group
Display and review slide 21
Ask participants to read each learning objective out-loud
Display and review slide 22
Review next steps for the group