alberta k–9 mathematics achievement indicators...the alberta k–9 mathematics achievement...
TRANSCRIPT
2015
A lber ta K – 9 MATHEMATICS
Achievement Indica tors
Alberta K–9 Mathematics Achievement Indicators ISBN 978-1-4601-2398-0 (PDF) Questions or concerns regarding this document can be addressed to the Director, Mathematics, Arts and Communication Branch, Alberta Education. Telephone 780–427–2984. To be connected toll-free inside Alberta, dial 310–0000 first. The primary intended audience for this document is:
Administrators Counsellors General Audience Parents Students Teachers
Copyright © 2015, Alberta Education. The Crown in Right of Alberta, as represented by the Minister of Education. Every effort has been made to provide proper acknowledgement of original sources. If cases are identified where this has not been done, please notify Alberta Education so appropriate corrective action can be taken. Permission is given by the copyright owner to reproduce this document for educational purposes and on a nonprofit basis.
Alberta K–9 Mathematics Achievement Indicators Table of Contents / iii Alberta Education, Alberta, Canada 2014 (Updated 2015)
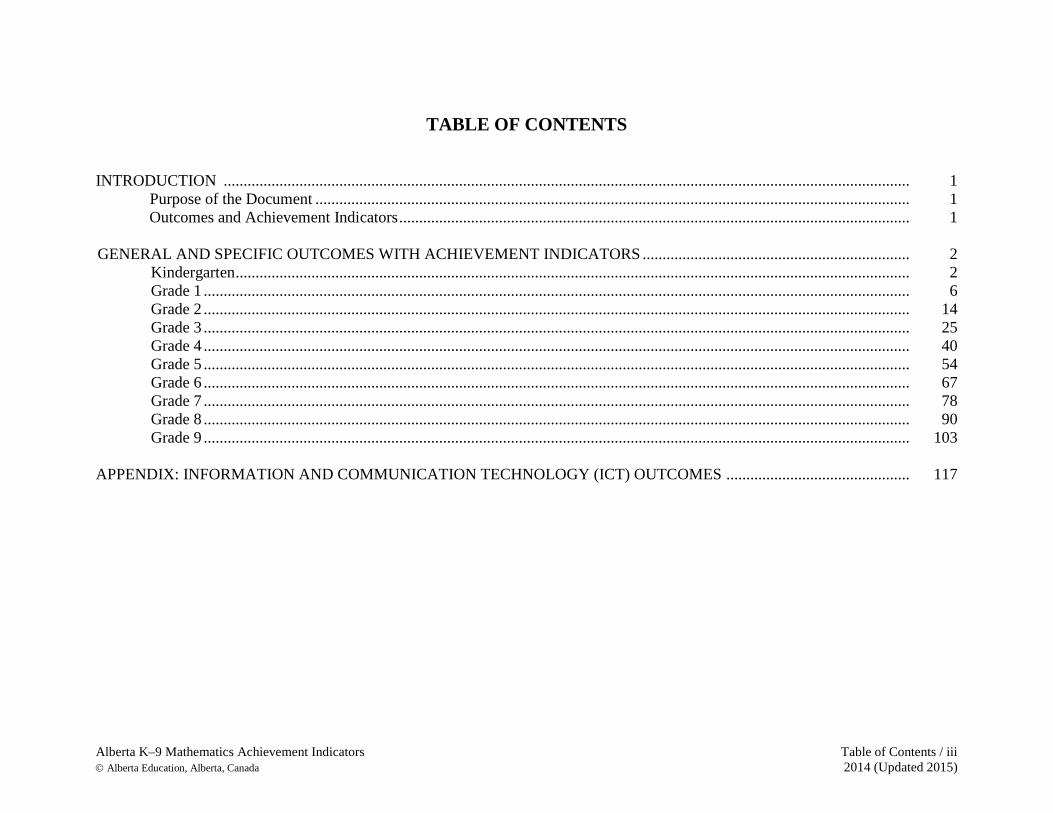
TABLE OF CONTENTS
INTRODUCTION ............................................................................................................................................................................ 1
Purpose of the Document ..................................................................................................................................................... 1 Outcomes and Achievement Indicators ................................................................................................................................ 1
GENERAL AND SPECIFIC OUTCOMES WITH ACHIEVEMENT INDICATORS ................................................................... 2 Kindergarten ......................................................................................................................................................................... 2 Grade 1 ................................................................................................................................................................................. 6 Grade 2 ................................................................................................................................................................................. 14 Grade 3 ................................................................................................................................................................................. 25 Grade 4 ................................................................................................................................................................................. 40 Grade 5 ................................................................................................................................................................................. 54 Grade 6 ................................................................................................................................................................................. 67 Grade 7 ................................................................................................................................................................................. 78 Grade 8 ................................................................................................................................................................................. 90 Grade 9 ................................................................................................................................................................................. 103
APPENDIX: INFORMATION AND COMMUNICATION TECHNOLOGY (ICT) OUTCOMES .............................................. 117

Alberta K–9 Mathematics Achievement Indicators Introduction / 1 Alberta Education, Alberta, Canada 2014 (Updated 2015)
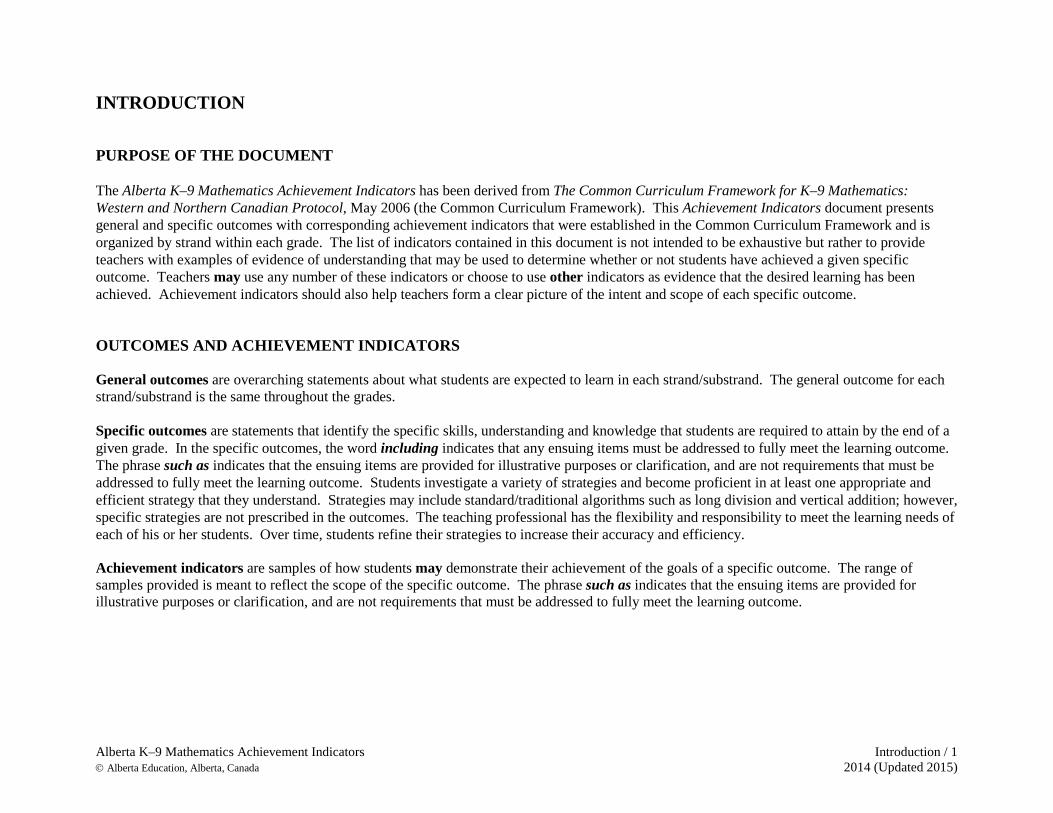
INTRODUCTION PURPOSE OF THE DOCUMENT The Alberta K–9 Mathematics Achievement Indicators has been derived from The Common Curriculum Framework for K–9 Mathematics: Western and Northern Canadian Protocol, May 2006 (the Common Curriculum Framework). This Achievement Indicators document presents general and specific outcomes with corresponding achievement indicators that were established in the Common Curriculum Framework and is organized by strand within each grade. The list of indicators contained in this document is not intended to be exhaustive but rather to provide teachers with examples of evidence of understanding that may be used to determine whether or not students have achieved a given specific outcome. Teachers may use any number of these indicators or choose to use other indicators as evidence that the desired learning has been achieved. Achievement indicators should also help teachers form a clear picture of the intent and scope of each specific outcome. OUTCOMES AND ACHIEVEMENT INDICATORS General outcomes are overarching statements about what students are expected to learn in each strand/substrand. The general outcome for each strand/substrand is the same throughout the grades. Specific outcomes are statements that identify the specific skills, understanding and knowledge that students are required to attain by the end of a given grade. In the specific outcomes, the word including indicates that any ensuing items must be addressed to fully meet the learning outcome. The phrase such as indicates that the ensuing items are provided for illustrative purposes or clarification, and are not requirements that must be addressed to fully meet the learning outcome. Students investigate a variety of strategies and become proficient in at least one appropriate and efficient strategy that they understand. Strategies may include standard/traditional algorithms such as long division and vertical addition; however, specific strategies are not prescribed in the outcomes. The teaching professional has the flexibility and responsibility to meet the learning needs of each of his or her students. Over time, students refine their strategies to increase their accuracy and efficiency. Achievement indicators are samples of how students may demonstrate their achievement of the goals of a specific outcome. The range of samples provided is meant to reflect the scope of the specific outcome. The phrase such as indicates that the ensuing items are provided for illustrative purposes or clarification, and are not requirements that must be addressed to fully meet the learning outcome.
2 / Outcomes with Achievement Indicators (Kindergarten) Alberta K–9 Mathematics Achievement Indicators 2014 (Updated 2015) Alberta Education, Alberta, Canada
GENERAL AND SPECIFIC OUTCOMES WITH ACHIEVEMENT INDICATORS Kindergarten
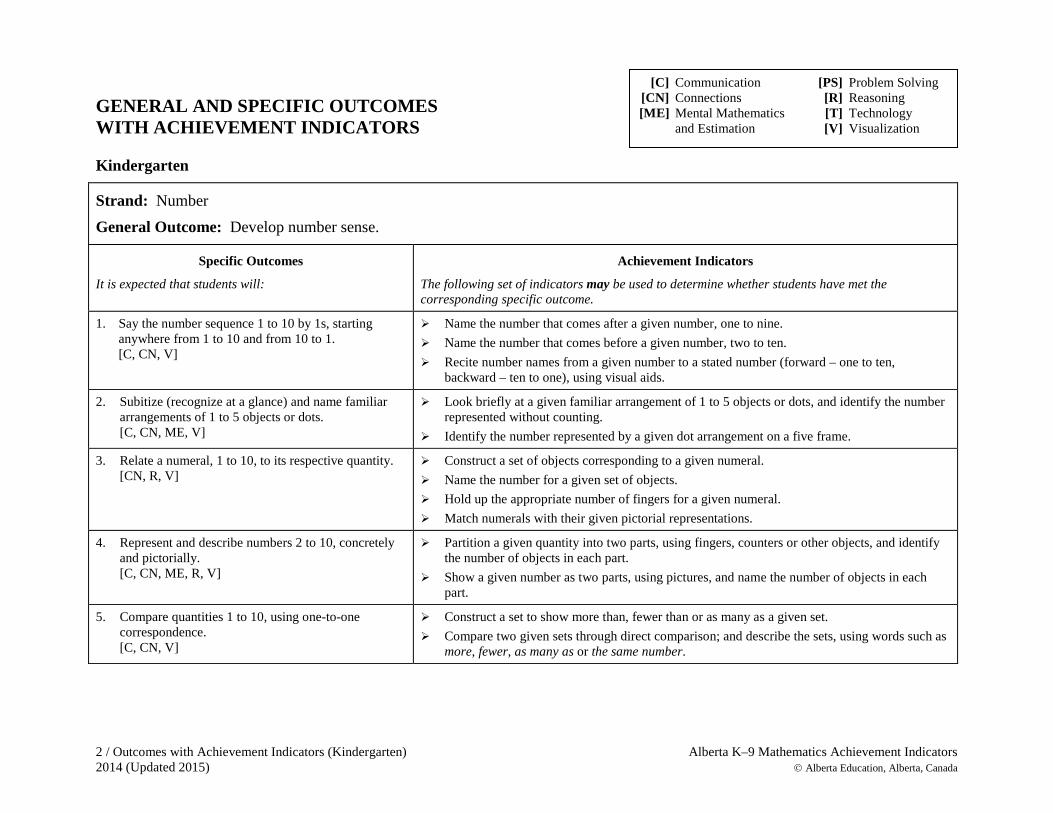
Strand: Number General Outcome: Develop number sense.
Specific Outcomes
It is expected that students will:
Achievement Indicators
The following set of indicators may be used to determine whether students have met the corresponding specific outcome.
1. Say the number sequence 1 to 10 by 1s, starting anywhere from 1 to 10 and from 10 to 1. [C, CN, V]
Name the number that comes after a given number, one to nine. Name the number that comes before a given number, two to ten. Recite number names from a given number to a stated number (forward – one to ten,
backward – ten to one), using visual aids.
2. Subitize (recognize at a glance) and name familiar arrangements of 1 to 5 objects or dots. [C, CN, ME, V]
Look briefly at a given familiar arrangement of 1 to 5 objects or dots, and identify the number represented without counting.
Identify the number represented by a given dot arrangement on a five frame.
3. Relate a numeral, 1 to 10, to its respective quantity. [CN, R, V]
Construct a set of objects corresponding to a given numeral. Name the number for a given set of objects. Hold up the appropriate number of fingers for a given numeral. Match numerals with their given pictorial representations.
4. Represent and describe numbers 2 to 10, concretely and pictorially. [C, CN, ME, R, V]
Partition a given quantity into two parts, using fingers, counters or other objects, and identify the number of objects in each part.
Show a given number as two parts, using pictures, and name the number of objects in each part.
5. Compare quantities 1 to 10, using one-to-one correspondence. [C, CN, V]
Construct a set to show more than, fewer than or as many as a given set. Compare two given sets through direct comparison; and describe the sets, using words such as
more, fewer, as many as or the same number.
[C] Communication [PS] Problem Solving [CN] Connections [R] Reasoning [ME] Mental Mathematics [T] Technology and Estimation [V] Visualization
Alberta K–9 Mathematics Achievement Indicators Outcomes with Achievement Indicators (Kindergarten) / 3 Alberta Education, Alberta, Canada 2014 (Updated 2015)
Kindergarten
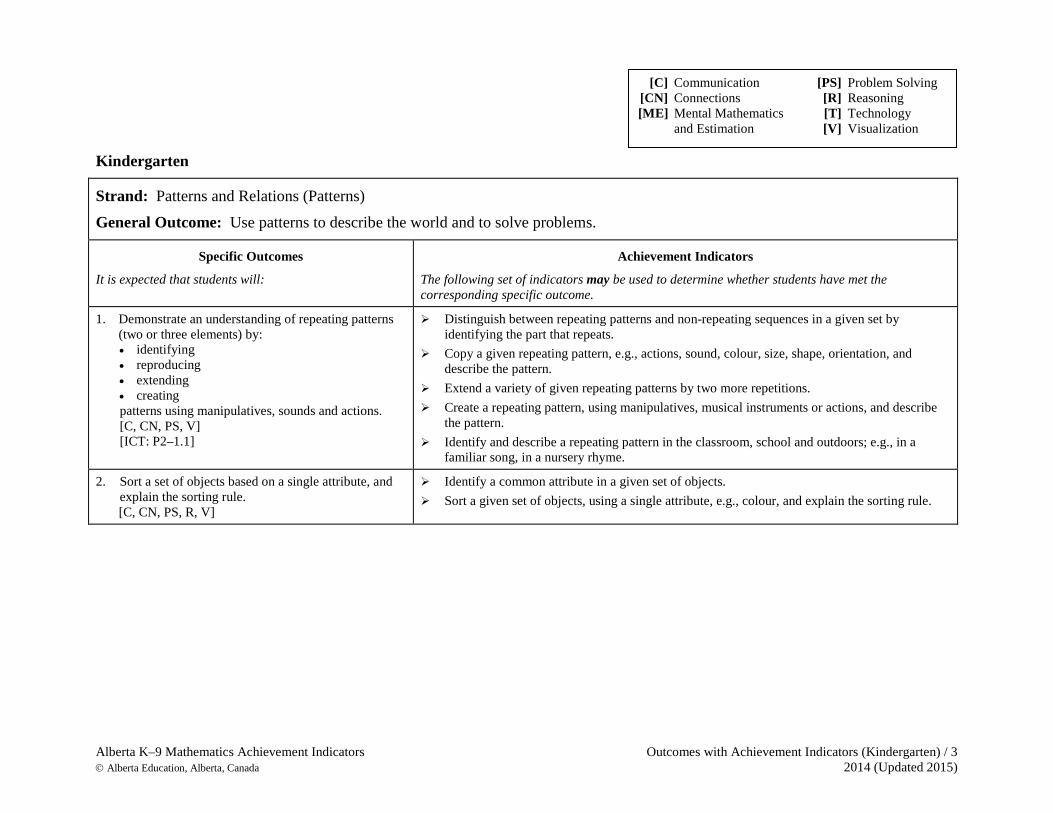
Strand: Patterns and Relations (Patterns) General Outcome: Use patterns to describe the world and to solve problems.
Specific Outcomes
It is expected that students will:
Achievement Indicators
The following set of indicators may be used to determine whether students have met the corresponding specific outcome.
1. Demonstrate an understanding of repeating patterns (two or three elements) by: • identifying • reproducing • extending • creating patterns using manipulatives, sounds and actions. [C, CN, PS, V] [ICT: P2–1.1]
Distinguish between repeating patterns and non-repeating sequences in a given set by identifying the part that repeats.
Copy a given repeating pattern, e.g., actions, sound, colour, size, shape, orientation, and describe the pattern.
Extend a variety of given repeating patterns by two more repetitions. Create a repeating pattern, using manipulatives, musical instruments or actions, and describe
the pattern. Identify and describe a repeating pattern in the classroom, school and outdoors; e.g., in a
familiar song, in a nursery rhyme.
2. Sort a set of objects based on a single attribute, and explain the sorting rule. [C, CN, PS, R, V]
Identify a common attribute in a given set of objects. Sort a given set of objects, using a single attribute, e.g., colour, and explain the sorting rule.
[C] Communication [PS] Problem Solving [CN] Connections [R] Reasoning [ME] Mental Mathematics [T] Technology and Estimation [V] Visualization
4 / Outcomes with Achievement Indicators (Kindergarten) Alberta K–9 Mathematics Achievement Indicators 2014 (Updated 2015) Alberta Education, Alberta, Canada
Kindergarten
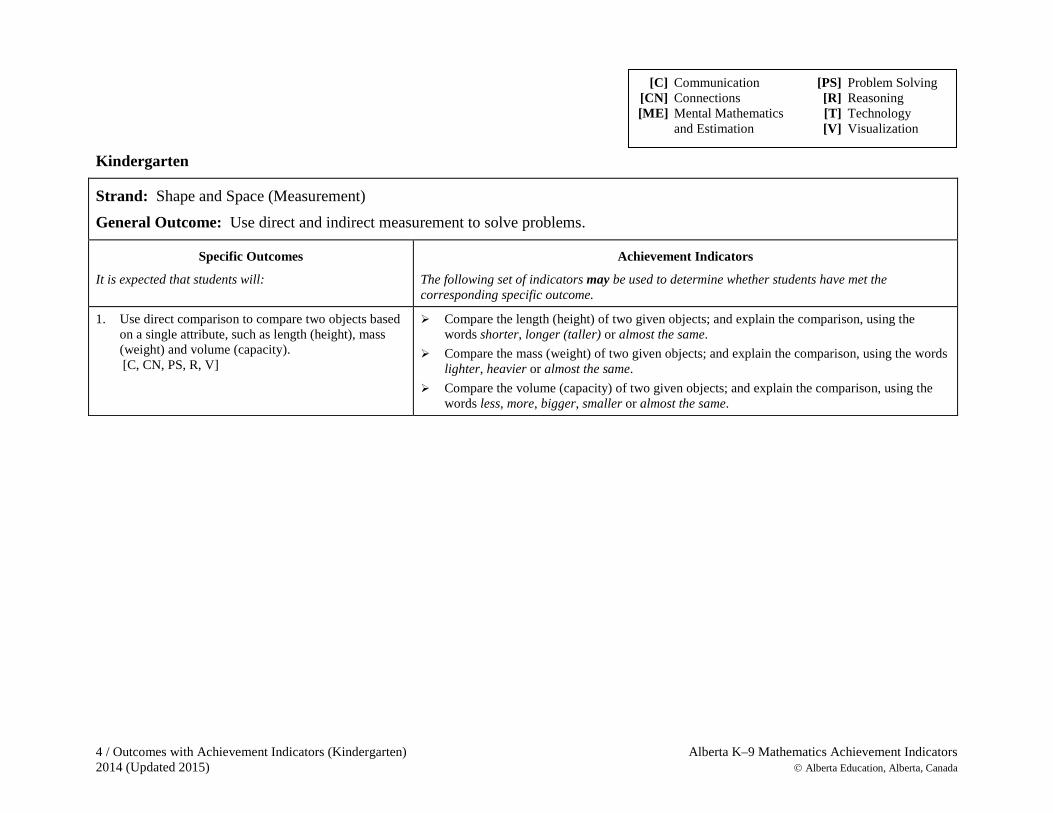
Strand: Shape and Space (Measurement) General Outcome: Use direct and indirect measurement to solve problems.
Specific Outcomes
It is expected that students will:
Achievement Indicators
The following set of indicators may be used to determine whether students have met the corresponding specific outcome.
1. Use direct comparison to compare two objects based on a single attribute, such as length (height), mass (weight) and volume (capacity). [C, CN, PS, R, V]
Compare the length (height) of two given objects; and explain the comparison, using the words shorter, longer (taller) or almost the same.
Compare the mass (weight) of two given objects; and explain the comparison, using the words lighter, heavier or almost the same.
Compare the volume (capacity) of two given objects; and explain the comparison, using the words less, more, bigger, smaller or almost the same.
[C] Communication [PS] Problem Solving [CN] Connections [R] Reasoning [ME] Mental Mathematics [T] Technology and Estimation [V] Visualization
Alberta K–9 Mathematics Achievement Indicators Outcomes with Achievement Indicators (Kindergarten) / 5 Alberta Education, Alberta, Canada 2014 (Updated 2015)
Kindergarten
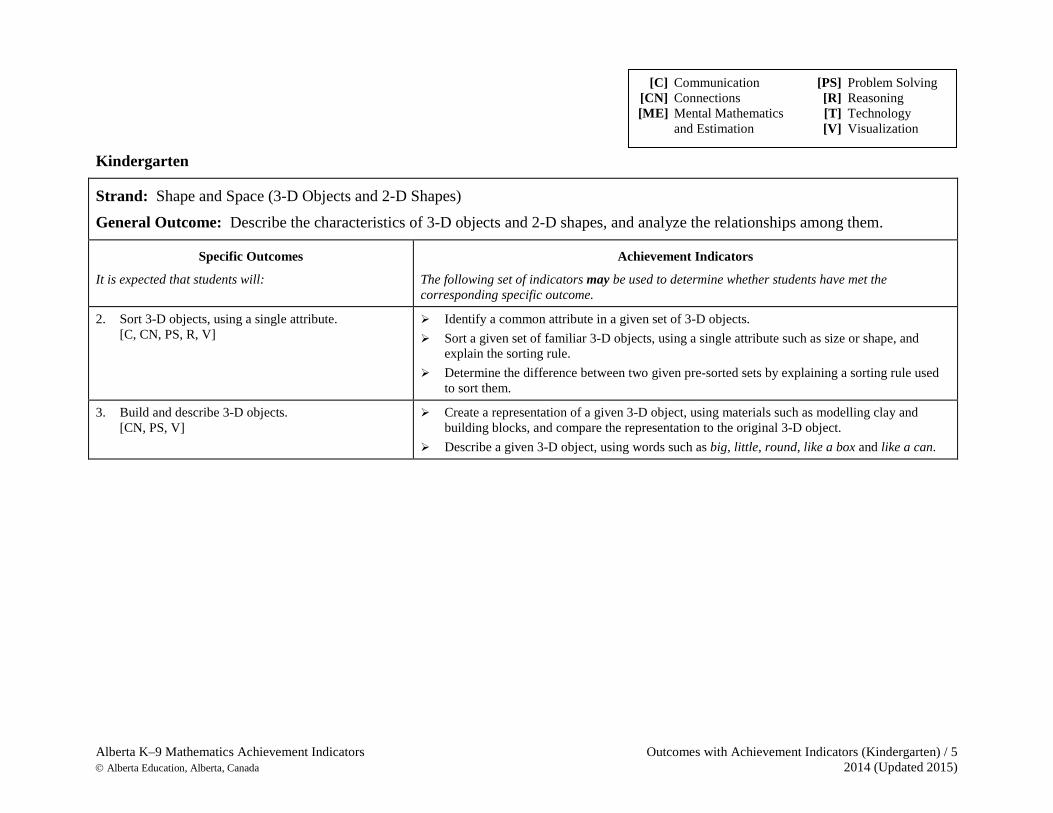
Strand: Shape and Space (3-D Objects and 2-D Shapes) General Outcome: Describe the characteristics of 3-D objects and 2-D shapes, and analyze the relationships among them.
Specific Outcomes
It is expected that students will:
Achievement Indicators
The following set of indicators may be used to determine whether students have met the corresponding specific outcome.
2. Sort 3-D objects, using a single attribute. [C, CN, PS, R, V]
Identify a common attribute in a given set of 3-D objects. Sort a given set of familiar 3-D objects, using a single attribute such as size or shape, and
explain the sorting rule. Determine the difference between two given pre-sorted sets by explaining a sorting rule used
to sort them.
3. Build and describe 3-D objects. [CN, PS, V]
Create a representation of a given 3-D object, using materials such as modelling clay and building blocks, and compare the representation to the original 3-D object.
Describe a given 3-D object, using words such as big, little, round, like a box and like a can.
[C] Communication [PS] Problem Solving [CN] Connections [R] Reasoning [ME] Mental Mathematics [T] Technology and Estimation [V] Visualization
6 / Outcomes with Achievement Indicators (Grade 1) Alberta K–9 Mathematics Achievement Indicators 2014 (Updated 2015) Alberta Education, Alberta, Canada
Grade 1
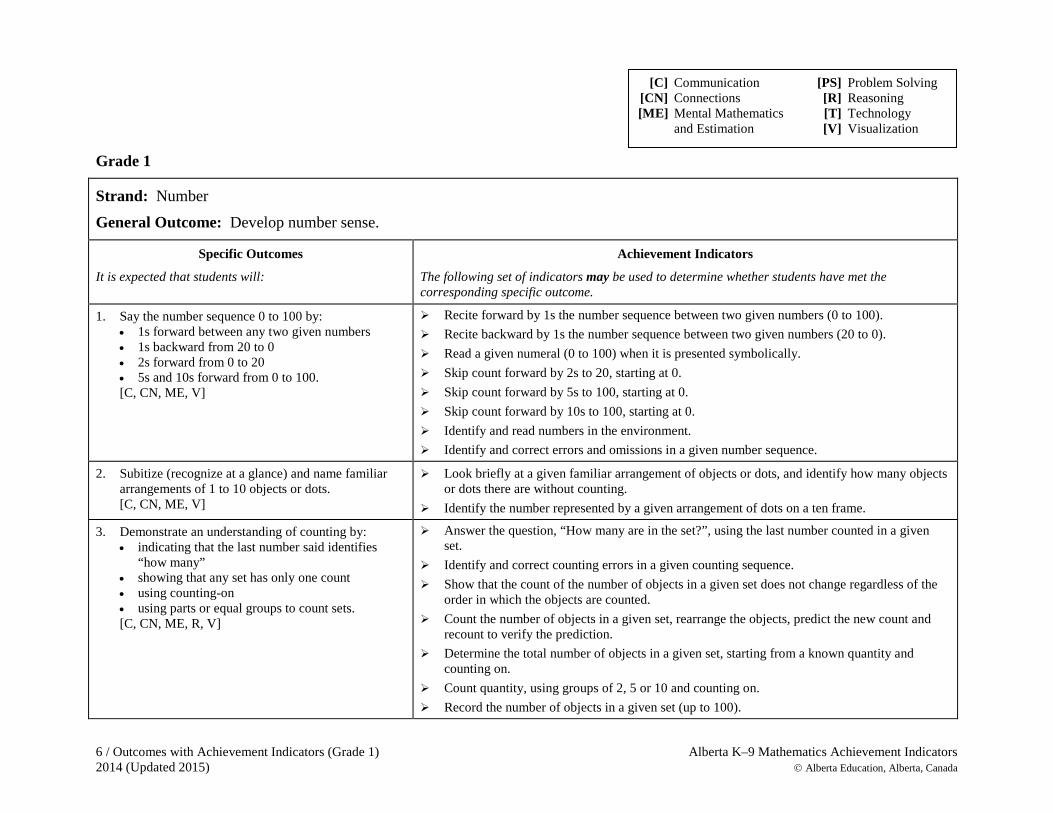
Strand: Number General Outcome: Develop number sense.
Specific Outcomes
It is expected that students will:
Achievement Indicators
The following set of indicators may be used to determine whether students have met the corresponding specific outcome.
1. Say the number sequence 0 to 100 by: • 1s forward between any two given numbers • 1s backward from 20 to 0 • 2s forward from 0 to 20 • 5s and 10s forward from 0 to 100. [C, CN, ME, V]
Recite forward by 1s the number sequence between two given numbers (0 to 100). Recite backward by 1s the number sequence between two given numbers (20 to 0). Read a given numeral (0 to 100) when it is presented symbolically. Skip count forward by 2s to 20, starting at 0. Skip count forward by 5s to 100, starting at 0. Skip count forward by 10s to 100, starting at 0. Identify and read numbers in the environment. Identify and correct errors and omissions in a given number sequence.
2. Subitize (recognize at a glance) and name familiar arrangements of 1 to 10 objects or dots. [C, CN, ME, V]
Look briefly at a given familiar arrangement of objects or dots, and identify how many objects or dots there are without counting.
Identify the number represented by a given arrangement of dots on a ten frame.
3. Demonstrate an understanding of counting by: • indicating that the last number said identifies
“how many” • showing that any set has only one count • using counting-on • using parts or equal groups to count sets. [C, CN, ME, R, V]
Answer the question, “How many are in the set?”, using the last number counted in a given set.
Identify and correct counting errors in a given counting sequence. Show that the count of the number of objects in a given set does not change regardless of the
order in which the objects are counted. Count the number of objects in a given set, rearrange the objects, predict the new count and
recount to verify the prediction. Determine the total number of objects in a given set, starting from a known quantity and
counting on. Count quantity, using groups of 2, 5 or 10 and counting on. Record the number of objects in a given set (up to 100).
[C] Communication [PS] Problem Solving [CN] Connections [R] Reasoning [ME] Mental Mathematics [T] Technology and Estimation [V] Visualization
Alberta K–9 Mathematics Achievement Indicators Outcomes with Achievement Indicators (Grade 1) / 7 Alberta Education, Alberta, Canada 2014 (Updated 2015)
Grade 1
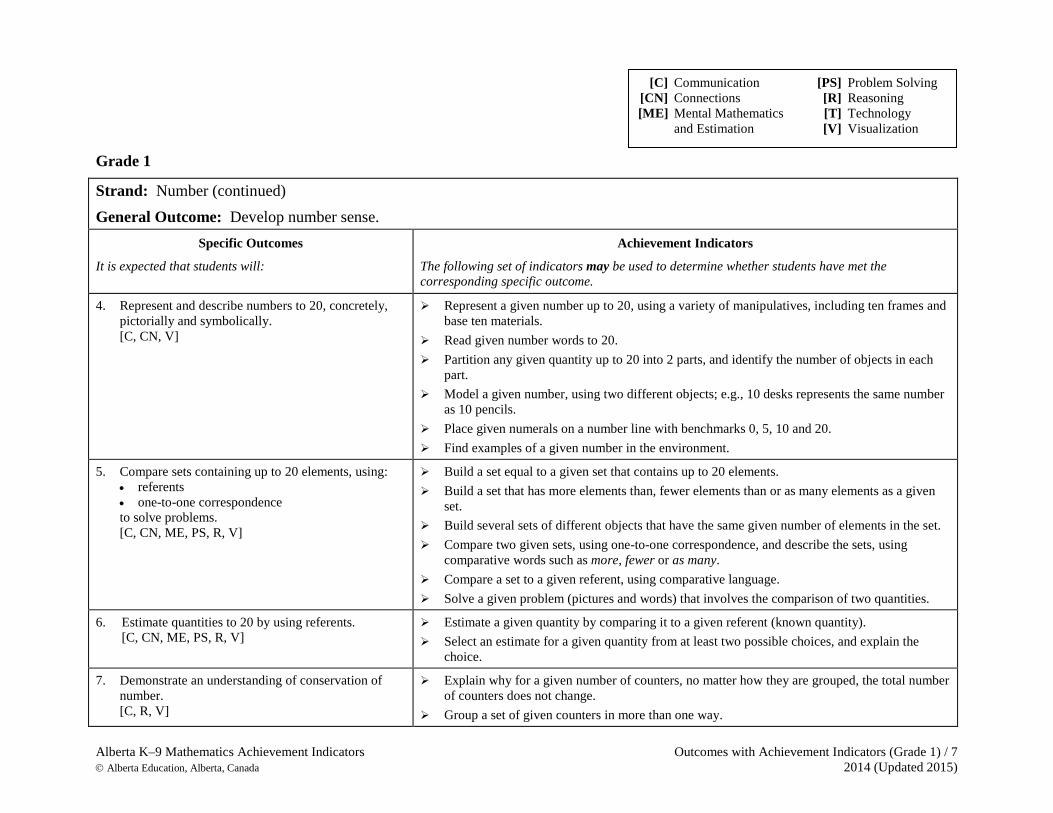
Strand: Number (continued) General Outcome: Develop number sense.
Specific Outcomes
It is expected that students will:
Achievement Indicators
The following set of indicators may be used to determine whether students have met the corresponding specific outcome.
4. Represent and describe numbers to 20, concretely, pictorially and symbolically. [C, CN, V]
Represent a given number up to 20, using a variety of manipulatives, including ten frames and base ten materials.
Read given number words to 20. Partition any given quantity up to 20 into 2 parts, and identify the number of objects in each
part. Model a given number, using two different objects; e.g., 10 desks represents the same number
as 10 pencils. Place given numerals on a number line with benchmarks 0, 5, 10 and 20. Find examples of a given number in the environment.
5. Compare sets containing up to 20 elements, using: • referents • one-to-one correspondence to solve problems. [C, CN, ME, PS, R, V]
Build a set equal to a given set that contains up to 20 elements. Build a set that has more elements than, fewer elements than or as many elements as a given
set. Build several sets of different objects that have the same given number of elements in the set. Compare two given sets, using one-to-one correspondence, and describe the sets, using
comparative words such as more, fewer or as many. Compare a set to a given referent, using comparative language. Solve a given problem (pictures and words) that involves the comparison of two quantities.
6. Estimate quantities to 20 by using referents. [C, CN, ME, PS, R, V]
Estimate a given quantity by comparing it to a given referent (known quantity). Select an estimate for a given quantity from at least two possible choices, and explain the
choice.
7. Demonstrate an understanding of conservation of number. [C, R, V]
Explain why for a given number of counters, no matter how they are grouped, the total number of counters does not change.
Group a set of given counters in more than one way.
[C] Communication [PS] Problem Solving [CN] Connections [R] Reasoning [ME] Mental Mathematics [T] Technology and Estimation [V] Visualization
8 / Outcomes with Achievement Indicators (Grade 1) Alberta K–9 Mathematics Achievement Indicators 2014 (Updated 2015) Alberta Education, Alberta, Canada
Grade 1
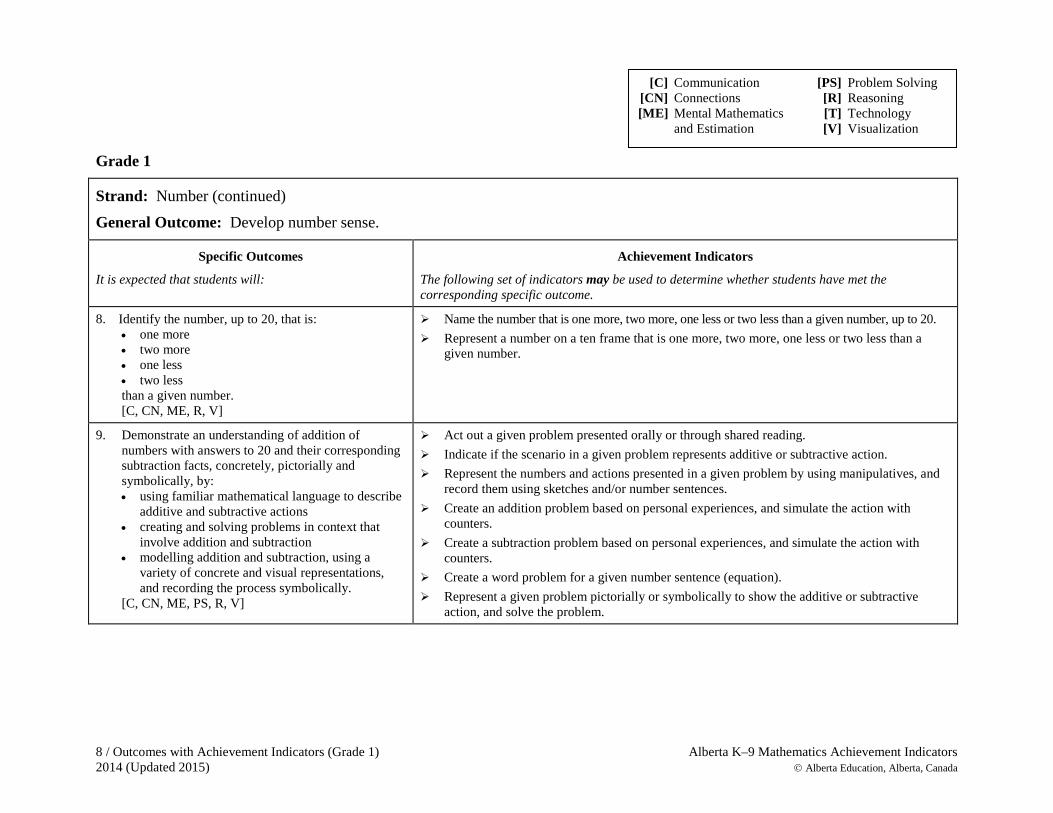
Strand: Number (continued) General Outcome: Develop number sense.
Specific Outcomes
It is expected that students will:
Achievement Indicators
The following set of indicators may be used to determine whether students have met the corresponding specific outcome.
8. Identify the number, up to 20, that is: • one more • two more • one less • two less than a given number. [C, CN, ME, R, V]
Name the number that is one more, two more, one less or two less than a given number, up to 20. Represent a number on a ten frame that is one more, two more, one less or two less than a
given number.
9. Demonstrate an understanding of addition of numbers with answers to 20 and their corresponding subtraction facts, concretely, pictorially and symbolically, by: • using familiar mathematical language to describe
additive and subtractive actions • creating and solving problems in context that
involve addition and subtraction • modelling addition and subtraction, using a
variety of concrete and visual representations, and recording the process symbolically.
[C, CN, ME, PS, R, V]
Act out a given problem presented orally or through shared reading. Indicate if the scenario in a given problem represents additive or subtractive action. Represent the numbers and actions presented in a given problem by using manipulatives, and
record them using sketches and/or number sentences. Create an addition problem based on personal experiences, and simulate the action with
counters. Create a subtraction problem based on personal experiences, and simulate the action with
counters. Create a word problem for a given number sentence (equation). Represent a given problem pictorially or symbolically to show the additive or subtractive
action, and solve the problem.
[C] Communication [PS] Problem Solving [CN] Connections [R] Reasoning [ME] Mental Mathematics [T] Technology and Estimation [V] Visualization
Alberta K–9 Mathematics Achievement Indicators Outcomes with Achievement Indicators (Grade 1) / 9 Alberta Education, Alberta, Canada 2014 (Updated 2015)
Grade 1
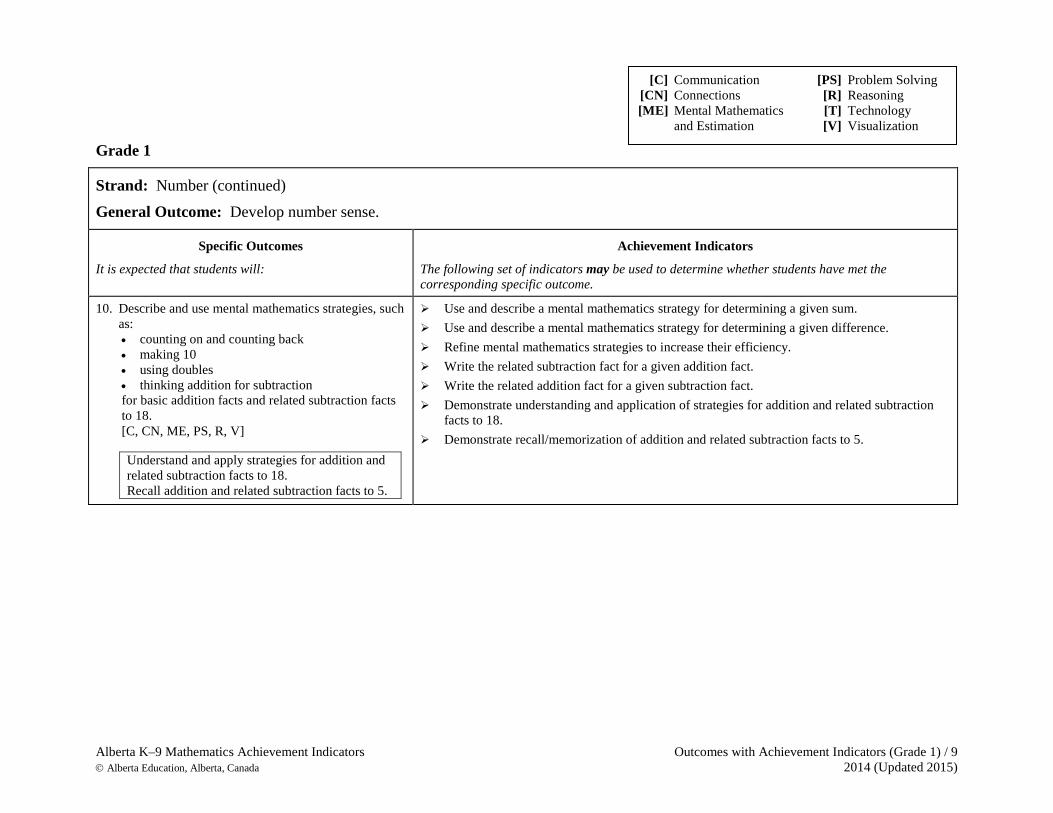
Strand: Number (continued) General Outcome: Develop number sense.
Specific Outcomes
It is expected that students will:
Achievement Indicators
The following set of indicators may be used to determine whether students have met the corresponding specific outcome.
10. Describe and use mental mathematics strategies, such as: • counting on and counting back • making 10 • using doubles • thinking addition for subtraction for basic addition facts and related subtraction facts to 18. [C, CN, ME, PS, R, V]
Understand and apply strategies for addition and related subtraction facts to 18. Recall addition and related subtraction facts to 5.
Use and describe a mental mathematics strategy for determining a given sum. Use and describe a mental mathematics strategy for determining a given difference. Refine mental mathematics strategies to increase their efficiency. Write the related subtraction fact for a given addition fact. Write the related addition fact for a given subtraction fact. Demonstrate understanding and application of strategies for addition and related subtraction
facts to 18. Demonstrate recall/memorization of addition and related subtraction facts to 5.
[C] Communication [PS] Problem Solving [CN] Connections [R] Reasoning [ME] Mental Mathematics [T] Technology and Estimation [V] Visualization

10 / Outcomes with Achievement Indicators (Grade 1) Alberta K–9 Mathematics Achievement Indicators 2014 (Updated 2015) Alberta Education, Alberta, Canada
Grade 1
Strand: Patterns and Relations (Patterns)
General Outcome: Use patterns to describe the world and to solve problems.
Specific Outcomes
It is expected that students will:
Achievement Indicators
The following set of indicators may be used to determine whether students have met the corresponding specific outcome.
1. Demonstrate an understanding of repeating patterns (two to four elements) by: • describing • reproducing • extending • creating patterns using manipulatives, diagrams, sounds and actions. [C, PS, R, V] [ICT: P2–1.1]
Describe a given repeating pattern containing two to four elements in its core. Identify and describe errors in a given repeating pattern. Identify and describe the missing element(s) in a given repeating pattern. Create and describe a repeating pattern, using a variety of manipulatives, diagrams, sounds and
actions. Reproduce and extend a given repeating pattern, using manipulatives, diagrams, sounds and
actions. Identify and describe a repeating pattern in the environment, e.g., in the classroom, outdoors,
using everyday language. Identify repeating events; e.g., days of the week, birthdays, seasons.
2. Translate repeating patterns from one representation to another. [C, CN, R, V]
Represent a given repeating pattern, using another mode; e.g., actions to sound, colour to shape, ABC ABC to bear eagle fish bear eagle fish.
Describe a given repeating pattern, using a letter code; e.g., ABC ABC …
3. Sort objects, using one attribute, and explain the sorting rule. [C, CN, R, V]
Identify a common attribute in a given set of objects. Choose a single attribute to sort a given set of objects, sort the set, and explain the sorting rule. Sort a given set of objects, using a given sorting rule. Determine the difference between two given pre-sorted sets of objects, and explain a possible
sorting rule used to sort them.
[C] Communication [PS] Problem Solving [CN] Connections [R] Reasoning [ME] Mental Mathematics [T] Technology and Estimation [V] Visualization

Alberta K–9 Mathematics Achievement Indicators Outcomes with Achievement Indicators (Grade 1) / 11 Alberta Education, Alberta, Canada 2014 (Updated 2015)
Grade 1
Strand: Patterns and Relations (Variables and Equations)
General Outcome: Represent algebraic expressions in multiple ways.
Specific Outcomes
It is expected that students will:
Achievement Indicators
The following set of indicators may be used to determine whether students have met the corresponding specific outcome.
4. Describe equality as a balance and inequality as an imbalance, concretely and pictorially (0 to 20). [C, CN, R, V]
Construct two equal sets, using the same objects (same shape and mass), and demonstrate their equality of number, using a balance (limited to 20 elements).
Construct two unequal sets, using the same objects (same shape and mass), and demonstrate their inequality of number, using a balance (limited to 20 elements).
Determine if two given concrete sets are equal or unequal, and explain the process used.
5. Record equalities, using the equal symbol. [C, CN, PS, V]
Represent a given equality, using manipulatives or pictures. Represent a given pictorial or concrete equality in symbolic form. Provide examples of equalities where the given sum or difference is on either the left or right
side of the equal symbol (=). Record different representations of the same quantity (0 to 20) as equalities.
[C] Communication [PS] Problem Solving [CN] Connections [R] Reasoning [ME] Mental Mathematics [T] Technology and Estimation [V] Visualization
12 / Outcomes with Achievement Indicators (Grade 1) Alberta K–9 Mathematics Achievement Indicators 2014 (Updated 2015) Alberta Education, Alberta, Canada
Grade 1
Strand: Shape and Space (Measurement) General Outcome: Use direct and indirect measurement to solve problems.
Specific Outcomes
It is expected that students will:
Achievement Indicators
The following set of indicators may be used to determine whether students have met the corresponding specific outcome.
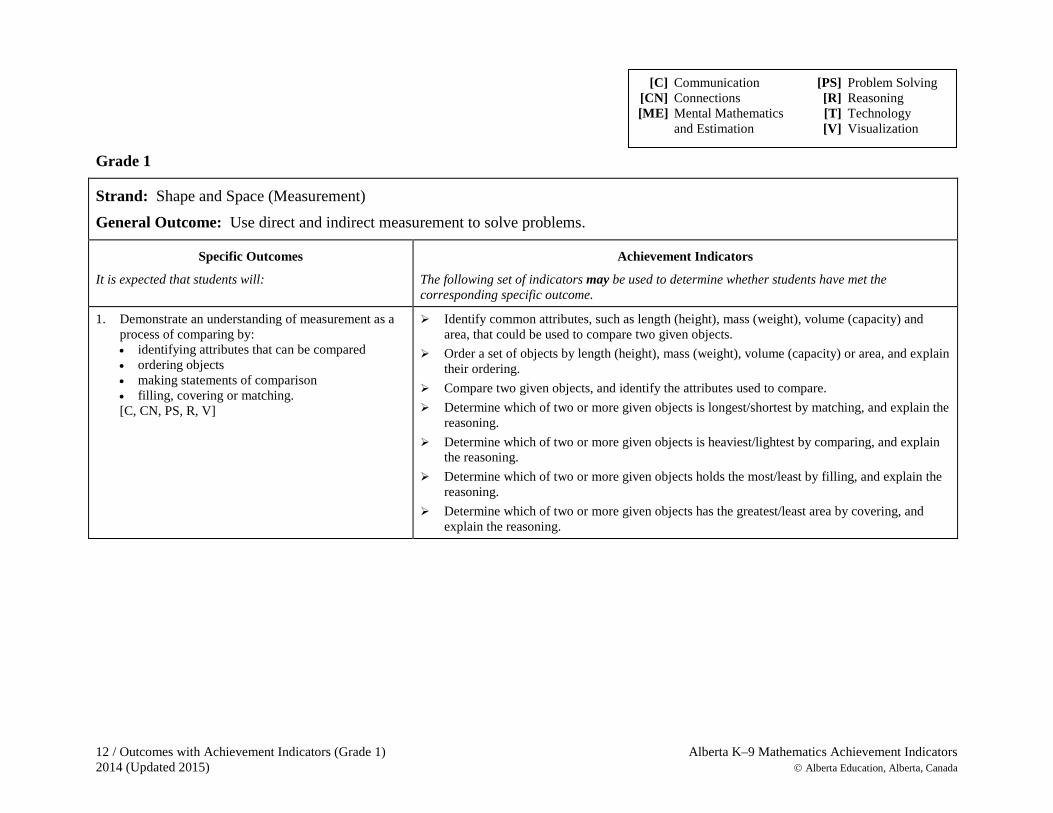
1. Demonstrate an understanding of measurement as a process of comparing by: • identifying attributes that can be compared • ordering objects • making statements of comparison • filling, covering or matching. [C, CN, PS, R, V]
Identify common attributes, such as length (height), mass (weight), volume (capacity) and area, that could be used to compare two given objects.
Order a set of objects by length (height), mass (weight), volume (capacity) or area, and explain their ordering.
Compare two given objects, and identify the attributes used to compare. Determine which of two or more given objects is longest/shortest by matching, and explain the
reasoning. Determine which of two or more given objects is heaviest/lightest by comparing, and explain
the reasoning. Determine which of two or more given objects holds the most/least by filling, and explain the
reasoning. Determine which of two or more given objects has the greatest/least area by covering, and
explain the reasoning.
[C] Communication [PS] Problem Solving [CN] Connections [R] Reasoning [ME] Mental Mathematics [T] Technology and Estimation [V] Visualization
Alberta K–9 Mathematics Achievement Indicators Outcomes with Achievement Indicators (Grade 1) / 13 Alberta Education, Alberta, Canada 2014 (Updated 2015)
Grade 1
Strand: Shape and Space (3-D Objects and 2-D Shapes) General Outcome: Describe the characteristics of 3-D objects and 2-D shapes, and analyze the relationships among them.
Specific Outcomes
It is expected that students will:
Achievement Indicators
The following set of indicators may be used to determine whether students have met the corresponding specific outcome.
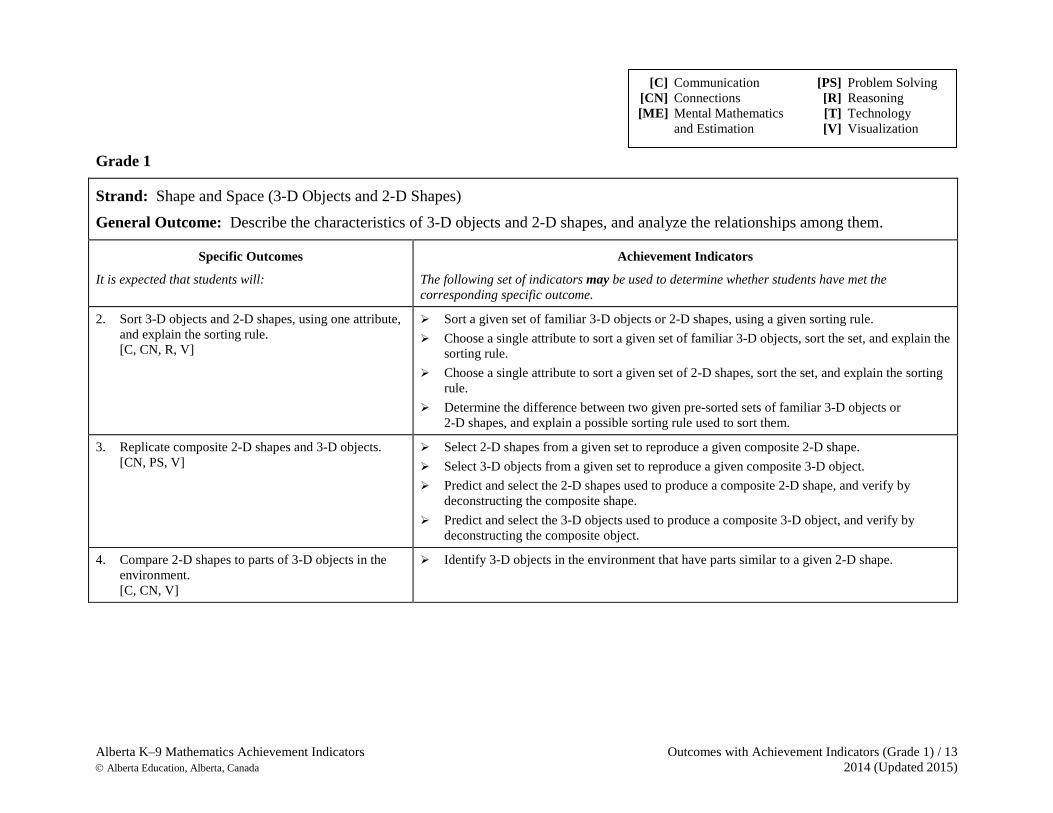
2. Sort 3-D objects and 2-D shapes, using one attribute, and explain the sorting rule. [C, CN, R, V]
Sort a given set of familiar 3-D objects or 2-D shapes, using a given sorting rule. Choose a single attribute to sort a given set of familiar 3-D objects, sort the set, and explain the
sorting rule. Choose a single attribute to sort a given set of 2-D shapes, sort the set, and explain the sorting
rule. Determine the difference between two given pre-sorted sets of familiar 3-D objects or
2-D shapes, and explain a possible sorting rule used to sort them.
3. Replicate composite 2-D shapes and 3-D objects. [CN, PS, V]
Select 2-D shapes from a given set to reproduce a given composite 2-D shape. Select 3-D objects from a given set to reproduce a given composite 3-D object. Predict and select the 2-D shapes used to produce a composite 2-D shape, and verify by
deconstructing the composite shape. Predict and select the 3-D objects used to produce a composite 3-D object, and verify by
deconstructing the composite object.
4. Compare 2-D shapes to parts of 3-D objects in the environment. [C, CN, V]
Identify 3-D objects in the environment that have parts similar to a given 2-D shape.
[C] Communication [PS] Problem Solving [CN] Connections [R] Reasoning [ME] Mental Mathematics [T] Technology and Estimation [V] Visualization
14 / Outcomes with Achievement Indicators (Grade 2) Alberta K–9 Mathematics Achievement Indicators 2014 (Updated 2015) Alberta Education, Alberta, Canada
Grade 2
Strand: Number General Outcome: Develop number sense.
Specific Outcomes
It is expected that students will:
Achievement Indicators The following set of indicators may be used to determine whether students have met the corresponding specific outcome.
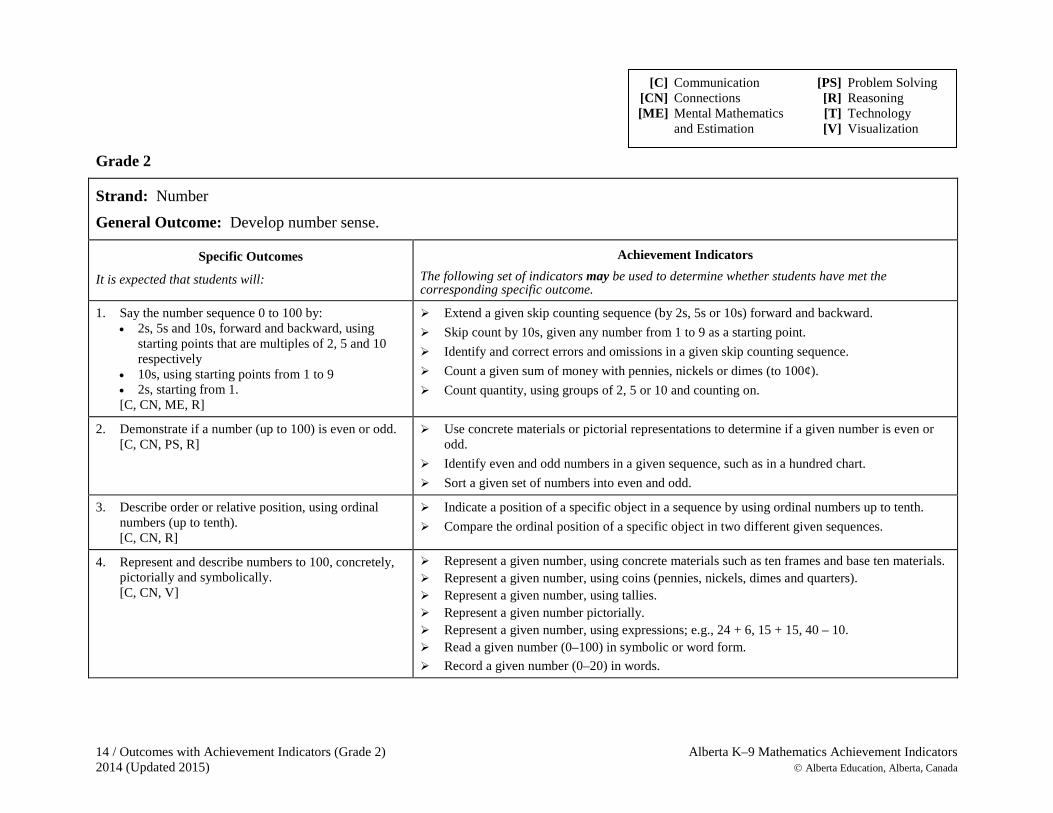
1. Say the number sequence 0 to 100 by: • 2s, 5s and 10s, forward and backward, using
starting points that are multiples of 2, 5 and 10 respectively
• 10s, using starting points from 1 to 9 • 2s, starting from 1. [C, CN, ME, R]
Extend a given skip counting sequence (by 2s, 5s or 10s) forward and backward. Skip count by 10s, given any number from 1 to 9 as a starting point. Identify and correct errors and omissions in a given skip counting sequence. Count a given sum of money with pennies, nickels or dimes (to 100¢). Count quantity, using groups of 2, 5 or 10 and counting on.
2. Demonstrate if a number (up to 100) is even or odd. [C, CN, PS, R]
Use concrete materials or pictorial representations to determine if a given number is even or odd.
Identify even and odd numbers in a given sequence, such as in a hundred chart. Sort a given set of numbers into even and odd.
3. Describe order or relative position, using ordinal numbers (up to tenth). [C, CN, R]
Indicate a position of a specific object in a sequence by using ordinal numbers up to tenth. Compare the ordinal position of a specific object in two different given sequences.
4. Represent and describe numbers to 100, concretely, pictorially and symbolically. [C, CN, V]
Represent a given number, using concrete materials such as ten frames and base ten materials. Represent a given number, using coins (pennies, nickels, dimes and quarters). Represent a given number, using tallies. Represent a given number pictorially. Represent a given number, using expressions; e.g., 24 + 6, 15 + 15, 40 – 10. Read a given number (0–100) in symbolic or word form. Record a given number (0–20) in words.
[C] Communication [PS] Problem Solving [CN] Connections [R] Reasoning [ME] Mental Mathematics [T] Technology and Estimation [V] Visualization
Alberta K–9 Mathematics Achievement Indicators Outcomes with Achievement Indicators (Grade 2) / 15 Alberta Education, Alberta, Canada 2014 (Updated 2015)
Grade 2
Strand: Number (continued) General Outcome: Develop number sense.
Specific Outcomes
It is expected that students will:
Achievement Indicators
The following set of indicators may be used to determine whether students have met the corresponding specific outcome.
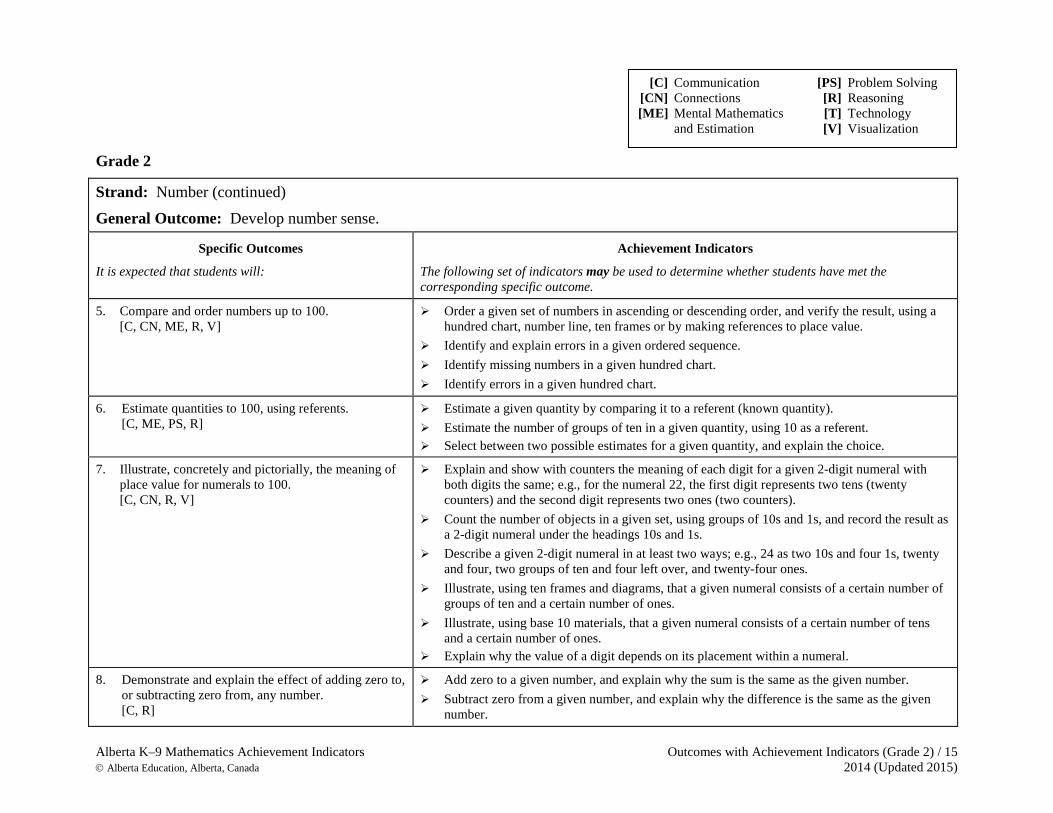
5. Compare and order numbers up to 100. [C, CN, ME, R, V]
Order a given set of numbers in ascending or descending order, and verify the result, using a hundred chart, number line, ten frames or by making references to place value.
Identify and explain errors in a given ordered sequence. Identify missing numbers in a given hundred chart. Identify errors in a given hundred chart.
6. Estimate quantities to 100, using referents. [C, ME, PS, R]
Estimate a given quantity by comparing it to a referent (known quantity). Estimate the number of groups of ten in a given quantity, using 10 as a referent. Select between two possible estimates for a given quantity, and explain the choice.
7. Illustrate, concretely and pictorially, the meaning of place value for numerals to 100. [C, CN, R, V]
Explain and show with counters the meaning of each digit for a given 2-digit numeral with both digits the same; e.g., for the numeral 22, the first digit represents two tens (twenty counters) and the second digit represents two ones (two counters).
Count the number of objects in a given set, using groups of 10s and 1s, and record the result as a 2-digit numeral under the headings 10s and 1s.
Describe a given 2-digit numeral in at least two ways; e.g., 24 as two 10s and four 1s, twenty and four, two groups of ten and four left over, and twenty-four ones.
Illustrate, using ten frames and diagrams, that a given numeral consists of a certain number of groups of ten and a certain number of ones.
Illustrate, using base 10 materials, that a given numeral consists of a certain number of tens and a certain number of ones.
Explain why the value of a digit depends on its placement within a numeral.
8. Demonstrate and explain the effect of adding zero to, or subtracting zero from, any number. [C, R]
Add zero to a given number, and explain why the sum is the same as the given number. Subtract zero from a given number, and explain why the difference is the same as the given
number.
[C] Communication [PS] Problem Solving [CN] Connections [R] Reasoning [ME] Mental Mathematics [T] Technology and Estimation [V] Visualization
16 / Outcomes with Achievement Indicators (Grade 2) Alberta K–9 Mathematics Achievement Indicators 2014 (Updated 2015) Alberta Education, Alberta, Canada
Grade 2
Strand: Number (continued) General Outcome: Develop number sense.
Specific Outcomes
It is expected that students will:
Achievement Indicators
The following set of indicators may be used to determine whether students have met the corresponding specific outcome.
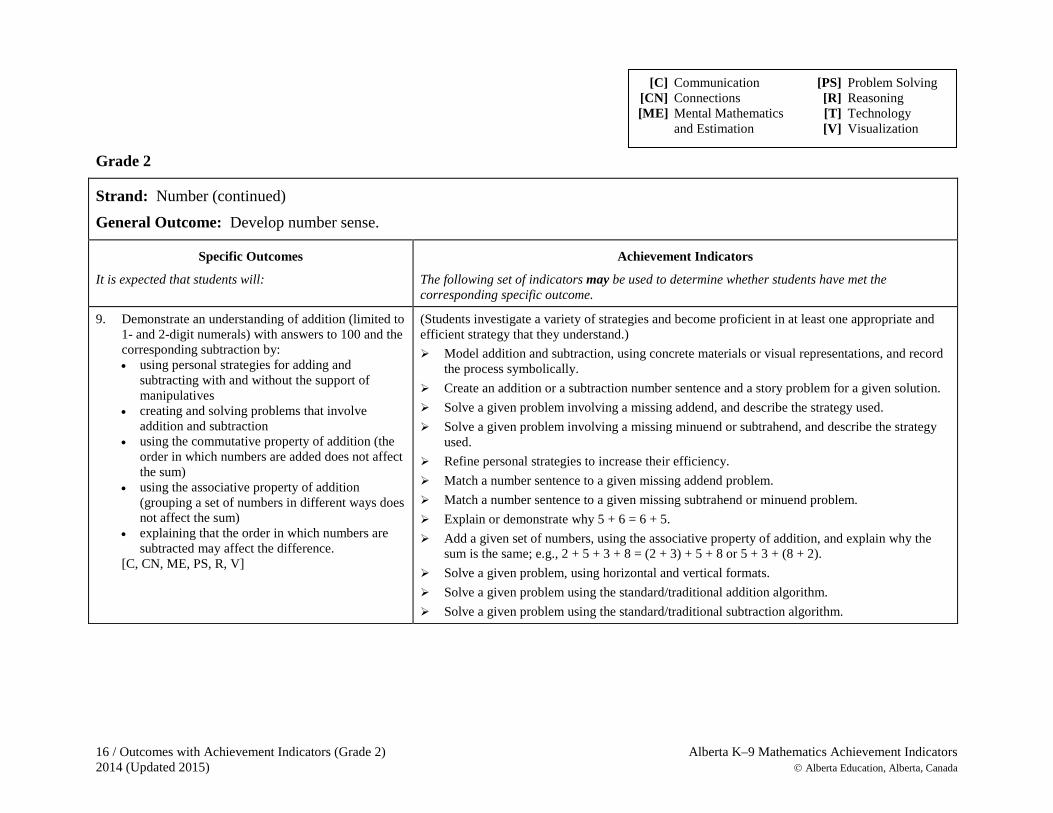
9. Demonstrate an understanding of addition (limited to 1- and 2-digit numerals) with answers to 100 and the corresponding subtraction by: • using personal strategies for adding and
subtracting with and without the support of manipulatives
• creating and solving problems that involve addition and subtraction
• using the commutative property of addition (the order in which numbers are added does not affect the sum)
• using the associative property of addition (grouping a set of numbers in different ways does not affect the sum)
• explaining that the order in which numbers are subtracted may affect the difference.
[C, CN, ME, PS, R, V]
(Students investigate a variety of strategies and become proficient in at least one appropriate and efficient strategy that they understand.) Model addition and subtraction, using concrete materials or visual representations, and record
the process symbolically. Create an addition or a subtraction number sentence and a story problem for a given solution. Solve a given problem involving a missing addend, and describe the strategy used. Solve a given problem involving a missing minuend or subtrahend, and describe the strategy
used. Refine personal strategies to increase their efficiency. Match a number sentence to a given missing addend problem. Match a number sentence to a given missing subtrahend or minuend problem. Explain or demonstrate why 5 + 6 = 6 + 5. Add a given set of numbers, using the associative property of addition, and explain why the
sum is the same; e.g., 2 + 5 + 3 + 8 = (2 + 3) + 5 + 8 or 5 + 3 + (8 + 2). Solve a given problem, using horizontal and vertical formats. Solve a given problem using the standard/traditional addition algorithm. Solve a given problem using the standard/traditional subtraction algorithm.
[C] Communication [PS] Problem Solving [CN] Connections [R] Reasoning [ME] Mental Mathematics [T] Technology and Estimation [V] Visualization
Alberta K–9 Mathematics Achievement Indicators Outcomes with Achievement Indicators (Grade 2) / 17 Alberta Education, Alberta, Canada 2014 (Updated 2015)
Grade 2
Strand: Number (continued) General Outcome: Develop number sense.
Specific Outcomes
It is expected that students will:
Achievement Indicators
The following set of indicators may be used to determine whether students have met the corresponding specific outcome.
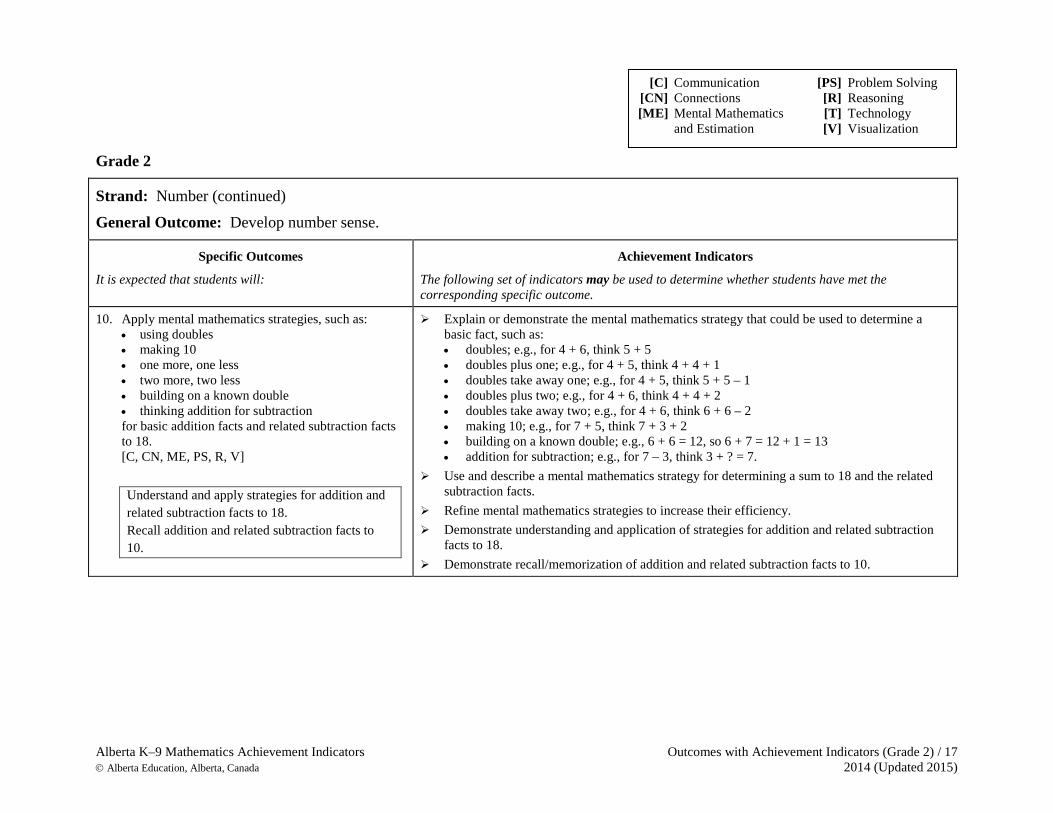
10. Apply mental mathematics strategies, such as: • using doubles • making 10 • one more, one less • two more, two less • building on a known double • thinking addition for subtraction for basic addition facts and related subtraction facts to 18. [C, CN, ME, PS, R, V]
Understand and apply strategies for addition and related subtraction facts to 18. Recall addition and related subtraction facts to 10.
Explain or demonstrate the mental mathematics strategy that could be used to determine a basic fact, such as: • doubles; e.g., for 4 + 6, think 5 + 5 • doubles plus one; e.g., for 4 + 5, think 4 + 4 + 1 • doubles take away one; e.g., for 4 + 5, think 5 + 5 – 1 • doubles plus two; e.g., for 4 + 6, think 4 + 4 + 2 • doubles take away two; e.g., for 4 + 6, think 6 + 6 – 2 • making 10; e.g., for 7 + 5, think 7 + 3 + 2 • building on a known double; e.g., 6 + 6 = 12, so 6 + 7 = 12 + 1 = 13 • addition for subtraction; e.g., for 7 – 3, think 3 + ? = 7.
Use and describe a mental mathematics strategy for determining a sum to 18 and the related subtraction facts.
Refine mental mathematics strategies to increase their efficiency. Demonstrate understanding and application of strategies for addition and related subtraction
facts to 18. Demonstrate recall/memorization of addition and related subtraction facts to 10.
[C] Communication [PS] Problem Solving [CN] Connections [R] Reasoning [ME] Mental Mathematics [T] Technology and Estimation [V] Visualization
18 / Outcomes with Achievement Indicators (Grade 2) Alberta K–9 Mathematics Achievement Indicators 2014 (Updated 2015) Alberta Education, Alberta, Canada
Grade 2
Strand: Patterns and Relations (Patterns) General Outcome: Use patterns to describe the world and to solve problems.
Specific Outcomes
It is expected that students will:
Achievement Indicators The following set of indicators may be used to determine whether students have met the corresponding specific outcome.
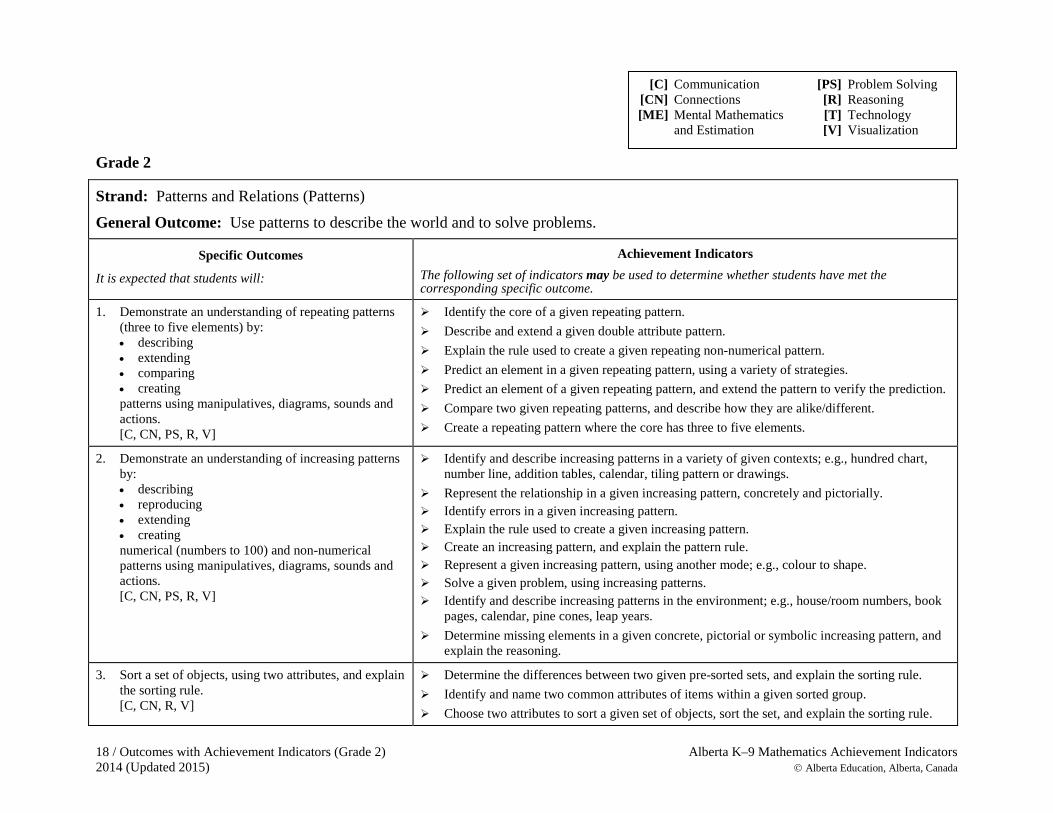
1. Demonstrate an understanding of repeating patterns (three to five elements) by: • describing • extending • comparing • creating patterns using manipulatives, diagrams, sounds and actions. [C, CN, PS, R, V]
Identify the core of a given repeating pattern. Describe and extend a given double attribute pattern. Explain the rule used to create a given repeating non-numerical pattern. Predict an element in a given repeating pattern, using a variety of strategies. Predict an element of a given repeating pattern, and extend the pattern to verify the prediction. Compare two given repeating patterns, and describe how they are alike/different. Create a repeating pattern where the core has three to five elements.
2. Demonstrate an understanding of increasing patterns by: • describing • reproducing • extending • creating numerical (numbers to 100) and non-numerical patterns using manipulatives, diagrams, sounds and actions. [C, CN, PS, R, V]
Identify and describe increasing patterns in a variety of given contexts; e.g., hundred chart, number line, addition tables, calendar, tiling pattern or drawings.
Represent the relationship in a given increasing pattern, concretely and pictorially. Identify errors in a given increasing pattern. Explain the rule used to create a given increasing pattern. Create an increasing pattern, and explain the pattern rule. Represent a given increasing pattern, using another mode; e.g., colour to shape. Solve a given problem, using increasing patterns. Identify and describe increasing patterns in the environment; e.g., house/room numbers, book
pages, calendar, pine cones, leap years. Determine missing elements in a given concrete, pictorial or symbolic increasing pattern, and
explain the reasoning.
3. Sort a set of objects, using two attributes, and explain the sorting rule. [C, CN, R, V]
Determine the differences between two given pre-sorted sets, and explain the sorting rule. Identify and name two common attributes of items within a given sorted group. Choose two attributes to sort a given set of objects, sort the set, and explain the sorting rule.
[C] Communication [PS] Problem Solving [CN] Connections [R] Reasoning [ME] Mental Mathematics [T] Technology and Estimation [V] Visualization
Alberta K–9 Mathematics Achievement Indicators Outcomes with Achievement Indicators (Grade 2) / 19 Alberta Education, Alberta, Canada 2014 (Updated 2015)
Grade 2
Strand: Patterns and Relations (Variables and Equations) General Outcome: Represent algebraic expressions in multiple ways.
Specific Outcomes
It is expected that students will:
Achievement Indicators
The following set of indicators may be used to determine whether students have met the corresponding specific outcome.
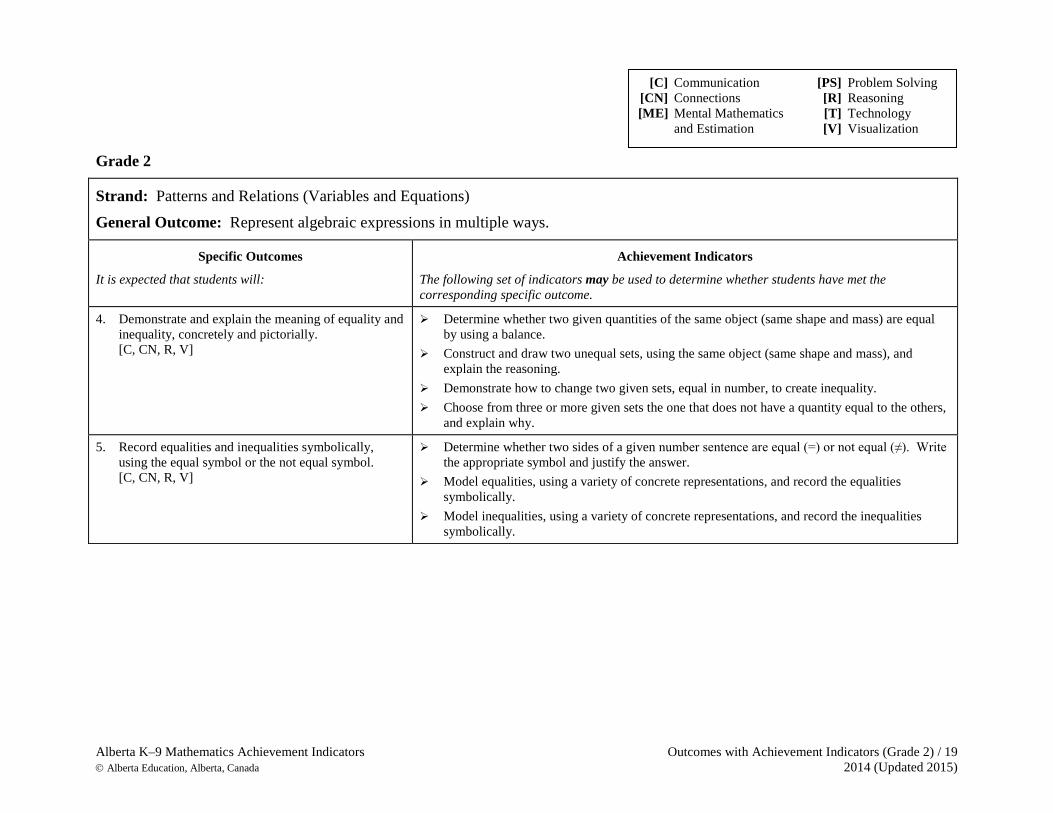
4. Demonstrate and explain the meaning of equality and inequality, concretely and pictorially. [C, CN, R, V]
Determine whether two given quantities of the same object (same shape and mass) are equal by using a balance.
Construct and draw two unequal sets, using the same object (same shape and mass), and explain the reasoning.
Demonstrate how to change two given sets, equal in number, to create inequality. Choose from three or more given sets the one that does not have a quantity equal to the others,
and explain why.
5. Record equalities and inequalities symbolically, using the equal symbol or the not equal symbol. [C, CN, R, V]
Determine whether two sides of a given number sentence are equal (=) or not equal (≠). Write the appropriate symbol and justify the answer.
Model equalities, using a variety of concrete representations, and record the equalities symbolically.
Model inequalities, using a variety of concrete representations, and record the inequalities symbolically.
[C] Communication [PS] Problem Solving [CN] Connections [R] Reasoning [ME] Mental Mathematics [T] Technology and Estimation [V] Visualization

20 / Outcomes with Achievement Indicators (Grade 2) Alberta K–9 Mathematics Achievement Indicators 2014 (Updated 2015) Alberta Education, Alberta, Canada
Grade 2
Strand: Shape and Space (Measurement) General Outcome: Use direct and indirect measurement to solve problems.
Specific Outcomes
It is expected that students will:
Achievement Indicators
The following set of indicators may be used to determine whether students have met the corresponding specific outcome.
1. Relate the number of days to a week and the number of months to a year in a problem-solving context. [C, CN, PS, R]
Read a date on a calendar. Name and order the days of the week. Identify the day of the week and the month of the year for an identified calendar date. Communicate that there are seven days in a week and twelve months in a year. Determine whether a given set of days is more or less than a week. Identify yesterday’s/tomorrow’s date. Identify the month that comes before and the month that comes after a given month. Name and order the months of the year. Solve a given problem involving time that is limited to the number of days in a week and the
number of months in a year.
2. Relate the size of a unit of measure to the number of units (limited to nonstandard units) used to measure length and mass (weight). [C, CN, ME, R, V]
Explain why one of two given nonstandard units may be a better choice for measuring the length of an object.
Explain why one of two given nonstandard units may be a better choice for measuring the mass (weight) of an object.
Select a nonstandard unit for measuring the length or mass (weight) of an object, and explain why it was chosen.
Estimate the number of nonstandard units needed for a given measurement task. Explain why the number of units of a measurement will vary depending upon the unit of
measure used.
3. Compare and order objects by length, height, distance around and mass (weight), using nonstandard units, and make statements of comparison. [C, CN, ME, R, V]
Estimate, measure and record the length, height, distance around or mass (weight) of a given object, using nonstandard units.
Compare and order the measure of two or more objects in ascending or descending order, and explain the method of ordering.
[C] Communication [PS] Problem Solving [CN] Connections [R] Reasoning [ME] Mental Mathematics [T] Technology and Estimation [V] Visualization
Alberta K–9 Mathematics Achievement Indicators Outcomes with Achievement Indicators (Grade 2) / 21 Alberta Education, Alberta, Canada 2014 (Updated 2015)
Grade 2
Strand: Shape and Space (Measurement) (continued) General Outcome: Use direct and indirect measurement to solve problems.
Specific Outcomes
It is expected that students will:
Achievement Indicators
The following set of indicators may be used to determine whether students have met the corresponding specific outcome.
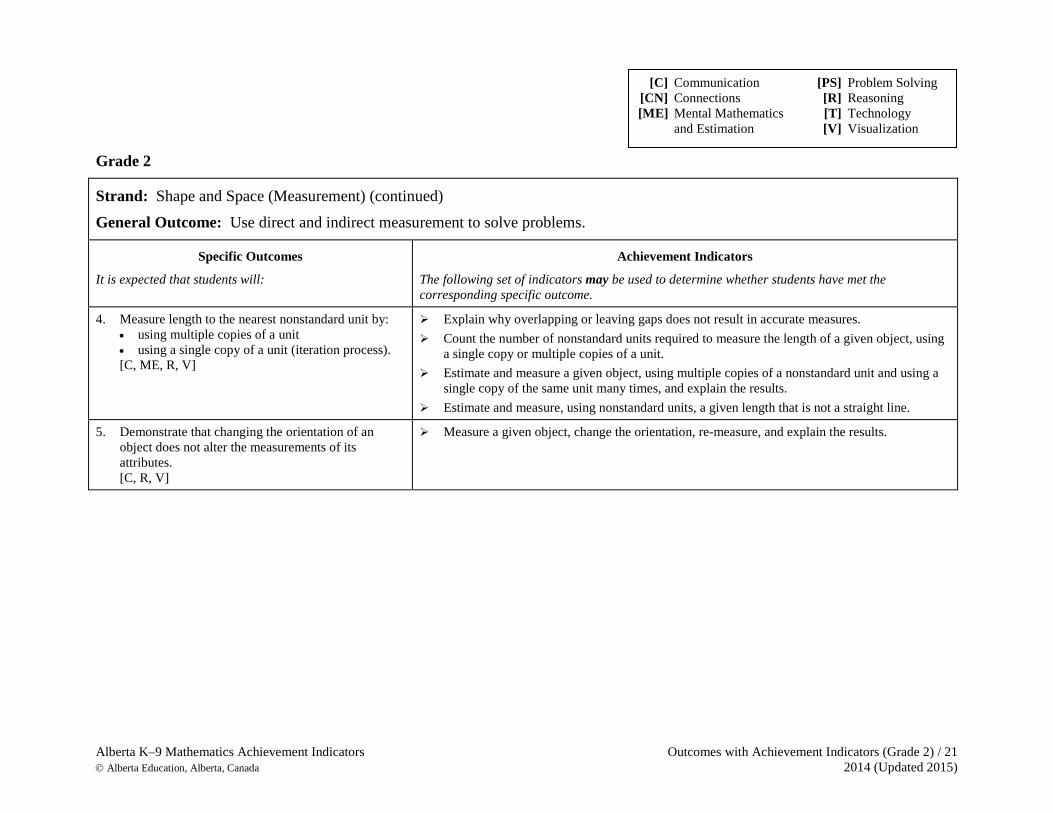
4. Measure length to the nearest nonstandard unit by: • using multiple copies of a unit • using a single copy of a unit (iteration process). [C, ME, R, V]
Explain why overlapping or leaving gaps does not result in accurate measures. Count the number of nonstandard units required to measure the length of a given object, using
a single copy or multiple copies of a unit. Estimate and measure a given object, using multiple copies of a nonstandard unit and using a
single copy of the same unit many times, and explain the results. Estimate and measure, using nonstandard units, a given length that is not a straight line.
5. Demonstrate that changing the orientation of an object does not alter the measurements of its attributes. [C, R, V]
Measure a given object, change the orientation, re-measure, and explain the results.
[C] Communication [PS] Problem Solving [CN] Connections [R] Reasoning [ME] Mental Mathematics [T] Technology and Estimation [V] Visualization
22 / Outcomes with Achievement Indicators (Grade 2) Alberta K–9 Mathematics Achievement Indicators 2014 (Updated 2015) Alberta Education, Alberta, Canada
Grade 2
Strand: Shape and Space (3-D Objects and 2-D Shapes) General Outcome: Describe the characteristics of 3-D objects and 2-D shapes, and analyze the relationships among them.
Specific Outcomes
It is expected that students will:
Achievement Indicators
The following set of indicators may be used to determine whether students have met the corresponding specific outcome.
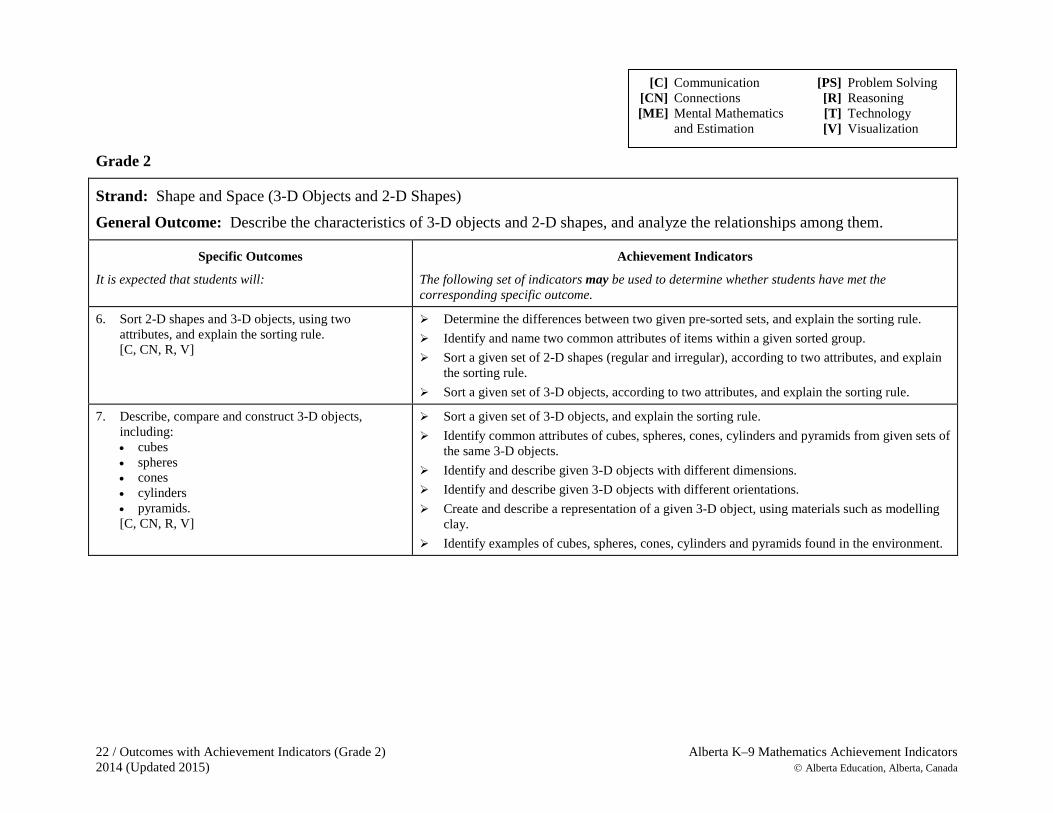
6. Sort 2-D shapes and 3-D objects, using two attributes, and explain the sorting rule. [C, CN, R, V]
Determine the differences between two given pre-sorted sets, and explain the sorting rule. Identify and name two common attributes of items within a given sorted group. Sort a given set of 2-D shapes (regular and irregular), according to two attributes, and explain
the sorting rule. Sort a given set of 3-D objects, according to two attributes, and explain the sorting rule.
7. Describe, compare and construct 3-D objects, including: • cubes • spheres • cones • cylinders • pyramids. [C, CN, R, V]
Sort a given set of 3-D objects, and explain the sorting rule. Identify common attributes of cubes, spheres, cones, cylinders and pyramids from given sets of
the same 3-D objects. Identify and describe given 3-D objects with different dimensions. Identify and describe given 3-D objects with different orientations. Create and describe a representation of a given 3-D object, using materials such as modelling
clay. Identify examples of cubes, spheres, cones, cylinders and pyramids found in the environment.
[C] Communication [PS] Problem Solving [CN] Connections [R] Reasoning [ME] Mental Mathematics [T] Technology and Estimation [V] Visualization
Alberta K–9 Mathematics Achievement Indicators Outcomes with Achievement Indicators (Grade 2) / 23 Alberta Education, Alberta, Canada 2014 (Updated 2015)
Grade 2
Strand: Shape and Space (3-D Objects and 2-D Shapes) (continued) General Outcome: Describe the characteristics of 3-D objects and 2-D shapes, and analyze the relationships among them.
Specific Outcomes
It is expected that students will:
Achievement Indicators
The following set of indicators may be used to determine whether students have met the corresponding specific outcome.
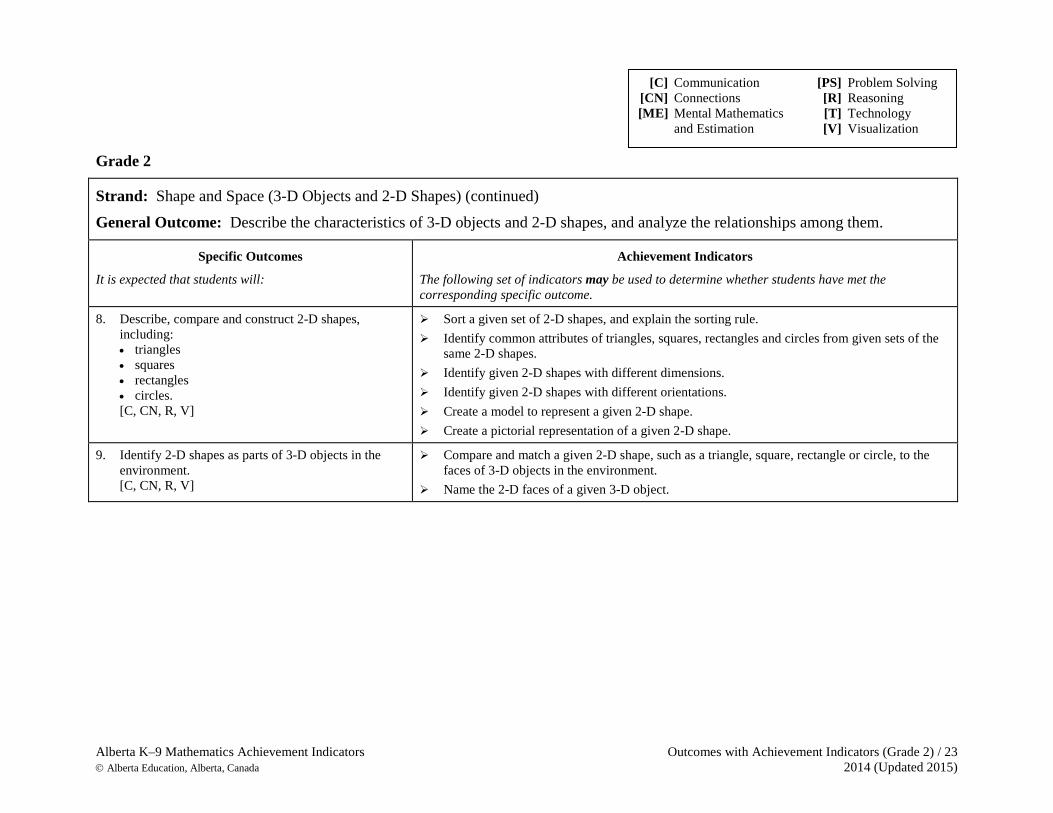
8. Describe, compare and construct 2-D shapes, including: • triangles • squares • rectangles • circles. [C, CN, R, V]
Sort a given set of 2-D shapes, and explain the sorting rule. Identify common attributes of triangles, squares, rectangles and circles from given sets of the
same 2-D shapes. Identify given 2-D shapes with different dimensions. Identify given 2-D shapes with different orientations. Create a model to represent a given 2-D shape. Create a pictorial representation of a given 2-D shape.
9. Identify 2-D shapes as parts of 3-D objects in the environment. [C, CN, R, V]
Compare and match a given 2-D shape, such as a triangle, square, rectangle or circle, to the faces of 3-D objects in the environment.
Name the 2-D faces of a given 3-D object.
[C] Communication [PS] Problem Solving [CN] Connections [R] Reasoning [ME] Mental Mathematics [T] Technology and Estimation [V] Visualization
24 / Outcomes with Achievement Indicators (Grade 2) Alberta K–9 Mathematics Achievement Indicators 2014 (Updated 2015) Alberta Education, Alberta, Canada
Grade 2
Strand: Statistics and Probability (Data Analysis) General Outcome: Collect, display and analyze data to solve problems.
Specific Outcomes
It is expected that students will:
Achievement Indicators
The following set of indicators may be used to determine whether students have met the corresponding specific outcome.
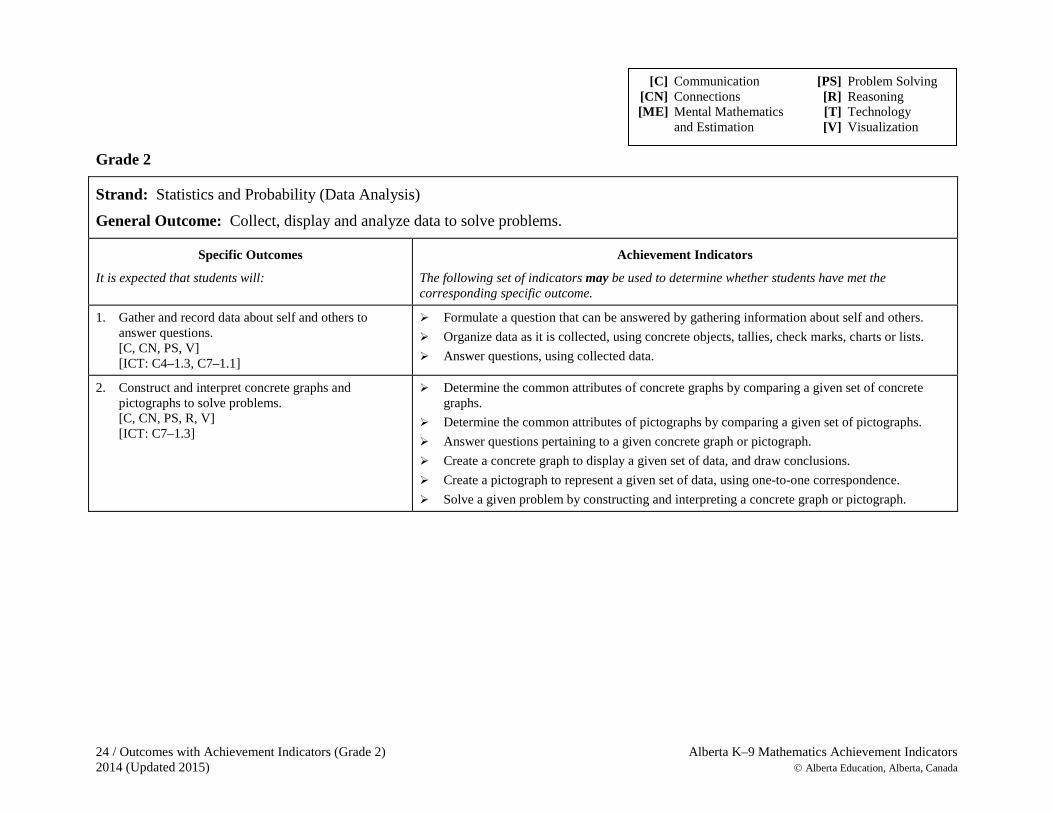
1. Gather and record data about self and others to answer questions. [C, CN, PS, V] [ICT: C4–1.3, C7–1.1]
Formulate a question that can be answered by gathering information about self and others. Organize data as it is collected, using concrete objects, tallies, check marks, charts or lists. Answer questions, using collected data.
2. Construct and interpret concrete graphs and pictographs to solve problems. [C, CN, PS, R, V]
[ICT: C7–1.3]
Determine the common attributes of concrete graphs by comparing a given set of concrete graphs.
Determine the common attributes of pictographs by comparing a given set of pictographs. Answer questions pertaining to a given concrete graph or pictograph. Create a concrete graph to display a given set of data, and draw conclusions. Create a pictograph to represent a given set of data, using one-to-one correspondence. Solve a given problem by constructing and interpreting a concrete graph or pictograph.
[C] Communication [PS] Problem Solving [CN] Connections [R] Reasoning [ME] Mental Mathematics [T] Technology and Estimation [V] Visualization
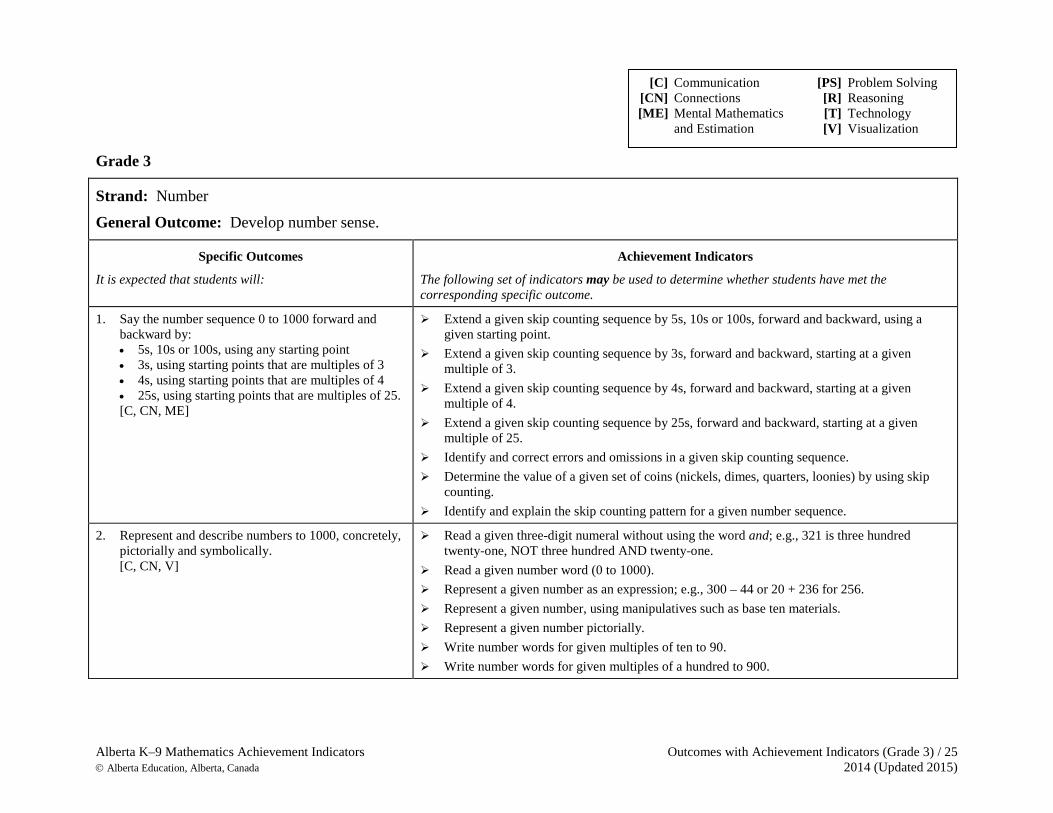
Alberta K–9 Mathematics Achievement Indicators Outcomes with Achievement Indicators (Grade 3) / 25 Alberta Education, Alberta, Canada 2014 (Updated 2015)
Grade 3
Strand: Number General Outcome: Develop number sense.
Specific Outcomes
It is expected that students will:
Achievement Indicators
The following set of indicators may be used to determine whether students have met the corresponding specific outcome.
1. Say the number sequence 0 to 1000 forward and backward by: • 5s, 10s or 100s, using any starting point • 3s, using starting points that are multiples of 3 • 4s, using starting points that are multiples of 4 • 25s, using starting points that are multiples of 25. [C, CN, ME]
Extend a given skip counting sequence by 5s, 10s or 100s, forward and backward, using a given starting point.
Extend a given skip counting sequence by 3s, forward and backward, starting at a given multiple of 3.
Extend a given skip counting sequence by 4s, forward and backward, starting at a given multiple of 4.
Extend a given skip counting sequence by 25s, forward and backward, starting at a given multiple of 25.
Identify and correct errors and omissions in a given skip counting sequence. Determine the value of a given set of coins (nickels, dimes, quarters, loonies) by using skip
counting. Identify and explain the skip counting pattern for a given number sequence.
2. Represent and describe numbers to 1000, concretely, pictorially and symbolically. [C, CN, V]
Read a given three-digit numeral without using the word and; e.g., 321 is three hundred twenty-one, NOT three hundred AND twenty-one.
Read a given number word (0 to 1000). Represent a given number as an expression; e.g., 300 – 44 or 20 + 236 for 256. Represent a given number, using manipulatives such as base ten materials. Represent a given number pictorially. Write number words for given multiples of ten to 90. Write number words for given multiples of a hundred to 900.
[C] Communication [PS] Problem Solving [CN] Connections [R] Reasoning [ME] Mental Mathematics [T] Technology and Estimation [V] Visualization
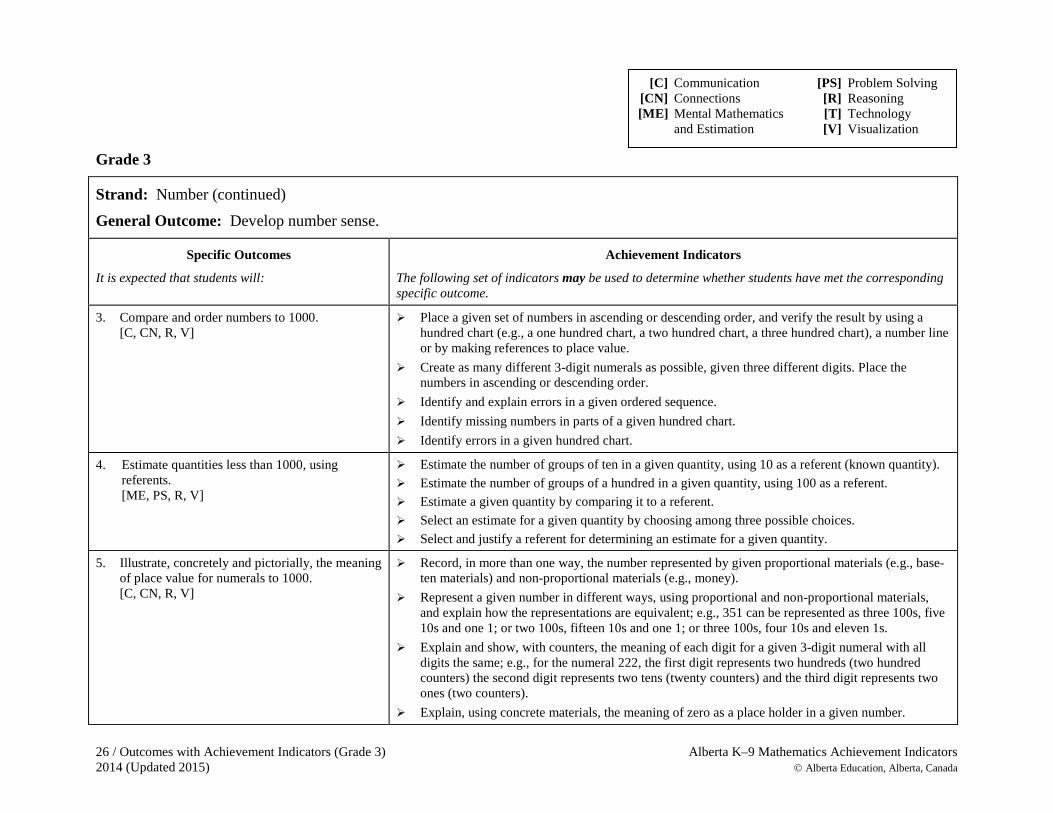
26 / Outcomes with Achievement Indicators (Grade 3) Alberta K–9 Mathematics Achievement Indicators 2014 (Updated 2015) Alberta Education, Alberta, Canada
Grade 3
Strand: Number (continued) General Outcome: Develop number sense.
Specific Outcomes
It is expected that students will:
Achievement Indicators
The following set of indicators may be used to determine whether students have met the corresponding specific outcome.
3. Compare and order numbers to 1000. [C, CN, R, V]
Place a given set of numbers in ascending or descending order, and verify the result by using a hundred chart (e.g., a one hundred chart, a two hundred chart, a three hundred chart), a number line or by making references to place value.
Create as many different 3-digit numerals as possible, given three different digits. Place the numbers in ascending or descending order.
Identify and explain errors in a given ordered sequence. Identify missing numbers in parts of a given hundred chart. Identify errors in a given hundred chart.
4. Estimate quantities less than 1000, using referents. [ME, PS, R, V]
Estimate the number of groups of ten in a given quantity, using 10 as a referent (known quantity). Estimate the number of groups of a hundred in a given quantity, using 100 as a referent. Estimate a given quantity by comparing it to a referent. Select an estimate for a given quantity by choosing among three possible choices. Select and justify a referent for determining an estimate for a given quantity.
5. Illustrate, concretely and pictorially, the meaning of place value for numerals to 1000. [C, CN, R, V]
Record, in more than one way, the number represented by given proportional materials (e.g., base-ten materials) and non-proportional materials (e.g., money).
Represent a given number in different ways, using proportional and non-proportional materials, and explain how the representations are equivalent; e.g., 351 can be represented as three 100s, five 10s and one 1; or two 100s, fifteen 10s and one 1; or three 100s, four 10s and eleven 1s.
Explain and show, with counters, the meaning of each digit for a given 3-digit numeral with all digits the same; e.g., for the numeral 222, the first digit represents two hundreds (two hundred counters) the second digit represents two tens (twenty counters) and the third digit represents two ones (two counters).
Explain, using concrete materials, the meaning of zero as a place holder in a given number.
[C] Communication [PS] Problem Solving [CN] Connections [R] Reasoning [ME] Mental Mathematics [T] Technology and Estimation [V] Visualization

Alberta K–9 Mathematics Achievement Indicators Outcomes with Achievement Indicators (Grade 3) / 27 Alberta Education, Alberta, Canada 2014 (Updated 2015)
Grade 3
Strand: Number (continued) General Outcome: Develop number sense.
Specific Outcomes
It is expected that students will:
Achievement Indicators
The following set of indicators may be used to determine whether students have met the corresponding specific outcome.
6. Describe and apply mental mathematics strategies for adding two 2-digit numerals, such as: • adding from left to right • taking one addend to the nearest multiple of ten
and then compensating • using doubles. [C, CN, ME, PS, R, V]
(Students investigate a variety of strategies and become proficient in at least one appropriate and efficient strategy that they understand.) Add two given 2-digit numerals, using a mental mathematics strategy, and explain or illustrate
the strategy. Explain how to use the “adding from left to right” strategy; e.g., to determine the sum of
23 + 46, think 20 + 40 and 3 + 6. Explain how to use the “taking one addend to the nearest multiple of ten and then
compensating” strategy; e.g., to determine the sum of 28 + 47, think 30 + 47 – 2 or 50 + 28 – 3. Explain how to use the “using doubles” strategy; e.g., to determine the sum of 24 + 26, think
25 + 25; to determine the sum of 25 + 26, think 25 + 25 + 1 or doubles plus 1. Apply a mental mathematics strategy for adding two given 2-digit numerals.
7. Describe and apply mental mathematics strategies for subtracting two 2-digit numerals, such as: • taking the subtrahend to the nearest multiple of
ten and then compensating • thinking of addition • using doubles. [C, CN, ME, PS, R, V]
(Students investigate a variety of strategies and become proficient in at least one appropriate and efficient strategy that they understand.) Subtract two given 2-digit numerals, using a mental mathematics strategy, and explain or model
the strategy used. Explain how to use the “taking the subtrahend to the nearest multiple of ten and then
compensating” strategy; e.g., to determine the difference of 48 – 19, think 48 – 20 + 1. Explain how to use the “adding on” strategy; e.g., to determine the difference of 62 – 45, think
45 + 5, then 50 + 12 and then 5 + 12. Explain how to use the “using doubles” strategy; e.g., to determine the difference of 24 – 12,
think 12 + 12 = 24. Apply a mental mathematics strategy for subtracting two given 2-digit numerals.
[C] Communication [PS] Problem Solving [CN] Connections [R] Reasoning [ME] Mental Mathematics [T] Technology and Estimation [V] Visualization
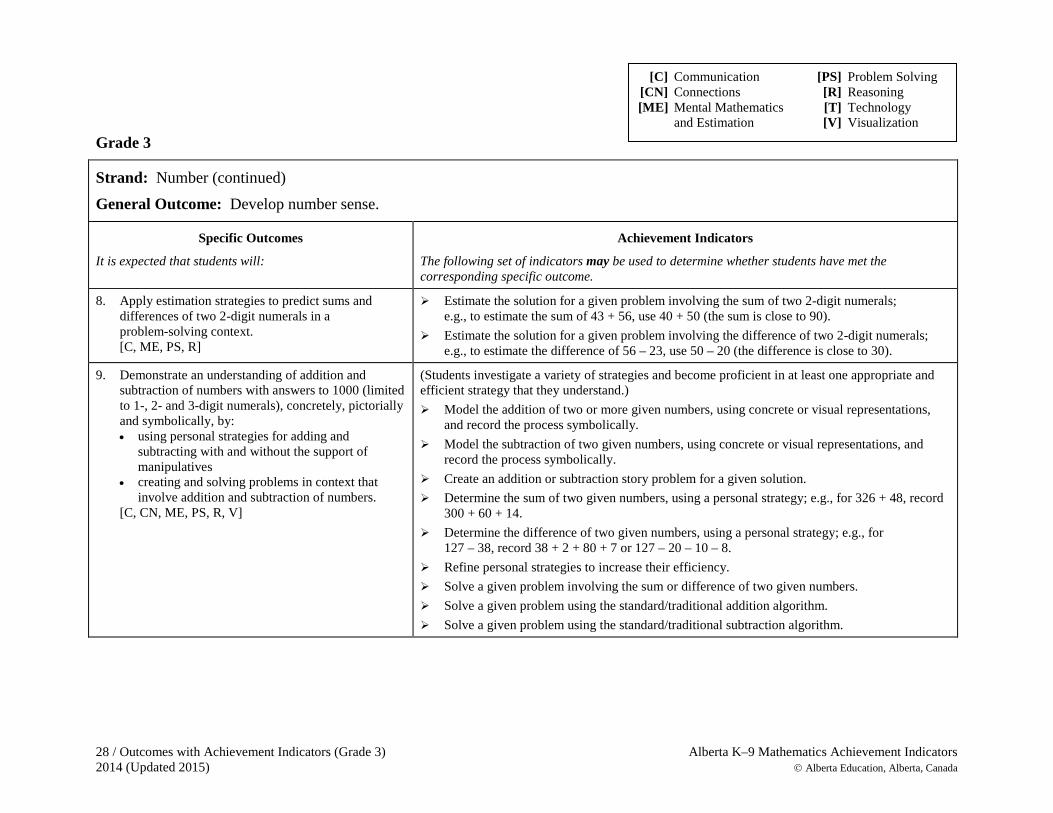
28 / Outcomes with Achievement Indicators (Grade 3) Alberta K–9 Mathematics Achievement Indicators 2014 (Updated 2015) Alberta Education, Alberta, Canada
Grade 3
Strand: Number (continued) General Outcome: Develop number sense.
Specific Outcomes
It is expected that students will:
Achievement Indicators
The following set of indicators may be used to determine whether students have met the corresponding specific outcome.
8. Apply estimation strategies to predict sums and differences of two 2-digit numerals in a problem-solving context. [C, ME, PS, R]
Estimate the solution for a given problem involving the sum of two 2-digit numerals; e.g., to estimate the sum of 43 + 56, use 40 + 50 (the sum is close to 90).
Estimate the solution for a given problem involving the difference of two 2-digit numerals; e.g., to estimate the difference of 56 – 23, use 50 – 20 (the difference is close to 30).
9. Demonstrate an understanding of addition and subtraction of numbers with answers to 1000 (limited to 1-, 2- and 3-digit numerals), concretely, pictorially and symbolically, by: • using personal strategies for adding and
subtracting with and without the support of manipulatives
• creating and solving problems in context that involve addition and subtraction of numbers.
[C, CN, ME, PS, R, V]
(Students investigate a variety of strategies and become proficient in at least one appropriate and efficient strategy that they understand.) Model the addition of two or more given numbers, using concrete or visual representations,
and record the process symbolically. Model the subtraction of two given numbers, using concrete or visual representations, and
record the process symbolically. Create an addition or subtraction story problem for a given solution. Determine the sum of two given numbers, using a personal strategy; e.g., for 326 + 48, record
300 + 60 + 14. Determine the difference of two given numbers, using a personal strategy; e.g., for
127 – 38, record 38 + 2 + 80 + 7 or 127 – 20 – 10 – 8. Refine personal strategies to increase their efficiency. Solve a given problem involving the sum or difference of two given numbers. Solve a given problem using the standard/traditional addition algorithm. Solve a given problem using the standard/traditional subtraction algorithm.
[C] Communication [PS] Problem Solving [CN] Connections [R] Reasoning [ME] Mental Mathematics [T] Technology and Estimation [V] Visualization
Alberta K–9 Mathematics Achievement Indicators Outcomes with Achievement Indicators (Grade 3) / 29 Alberta Education, Alberta, Canada 2014 (Updated 2015)
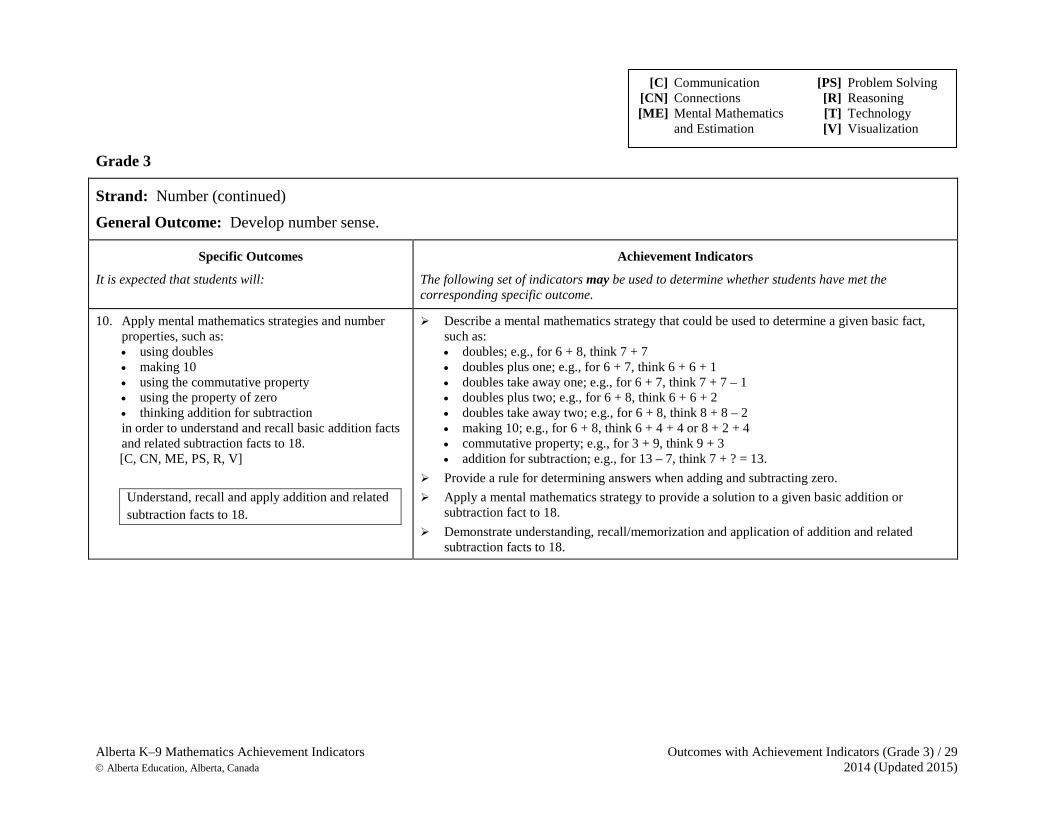
Grade 3
Strand: Number (continued) General Outcome: Develop number sense.
Specific Outcomes
It is expected that students will:
Achievement Indicators
The following set of indicators may be used to determine whether students have met the corresponding specific outcome.
10. Apply mental mathematics strategies and number properties, such as: • using doubles • making 10 • using the commutative property • using the property of zero • thinking addition for subtraction in order to understand and recall basic addition facts and related subtraction facts to 18. [C, CN, ME, PS, R, V]
Understand, recall and apply addition and related subtraction facts to 18.
Describe a mental mathematics strategy that could be used to determine a given basic fact, such as: • doubles; e.g., for 6 + 8, think 7 + 7 • doubles plus one; e.g., for 6 + 7, think 6 + 6 + 1 • doubles take away one; e.g., for 6 + 7, think 7 + 7 – 1 • doubles plus two; e.g., for 6 + 8, think 6 + 6 + 2 • doubles take away two; e.g., for 6 + 8, think 8 + 8 – 2 • making 10; e.g., for 6 + 8, think 6 + 4 + 4 or 8 + 2 + 4 • commutative property; e.g., for 3 + 9, think 9 + 3 • addition for subtraction; e.g., for 13 – 7, think 7 + ? = 13.
Provide a rule for determining answers when adding and subtracting zero. Apply a mental mathematics strategy to provide a solution to a given basic addition or
subtraction fact to 18. Demonstrate understanding, recall/memorization and application of addition and related
subtraction facts to 18.
[C] Communication [PS] Problem Solving [CN] Connections [R] Reasoning [ME] Mental Mathematics [T] Technology and Estimation [V] Visualization

30 / Outcomes with Achievement Indicators (Grade 3) Alberta K–9 Mathematics Achievement Indicators 2014 (Updated 2015) Alberta Education, Alberta, Canada
Grade 3
Strand: Number (continued) General Outcome: Develop number sense.
Specific Outcomes
It is expected that students will:
Achievement Indicators
The following set of indicators may be used to determine whether students have met the corresponding specific outcome.
11. Demonstrate an understanding of multiplication to 5 × 5 by: • representing and explaining multiplication using
equal grouping and arrays • creating and solving problems in context that
involve multiplication • modelling multiplication using concrete and
visual representations, and recording the process symbolically
• relating multiplication to repeated addition • relating multiplication to division. [C, CN, PS, R]
Understand and recall multiplication facts to 5 × 5.
Identify events from experience that can be described as multiplication. Represent a given story problem, using manipulatives or diagrams, and record the problem in a
number sentence. Represent a given multiplication expression as repeated addition. Represent a given repeated addition as multiplication. Create and illustrate a story problem for a given number sentence; e.g., 2 × 3 = 6. Represent, concretely or pictorially, equal groups for a given number sentence. Represent a given multiplication expression, using an array. Create an array to model the commutative property of multiplication. Relate multiplication to division by using arrays and writing related number sentences. Solve a given multiplication problem. Demonstrate understanding and recall/memorization of multiplication facts to 5 × 5.
[C] Communication [PS] Problem Solving [CN] Connections [R] Reasoning [ME] Mental Mathematics [T] Technology and Estimation [V] Visualization
Alberta K–9 Mathematics Achievement Indicators Outcomes with Achievement Indicators (Grade 3) / 31 Alberta Education, Alberta, Canada 2014 (Updated 2015)
Grade 3
Strand: Number (continued) General Outcome: Develop number sense.
Specific Outcomes
It is expected that students will:
Achievement Indicators
The following set of indicators may be used to determine whether students have met the corresponding specific outcome.
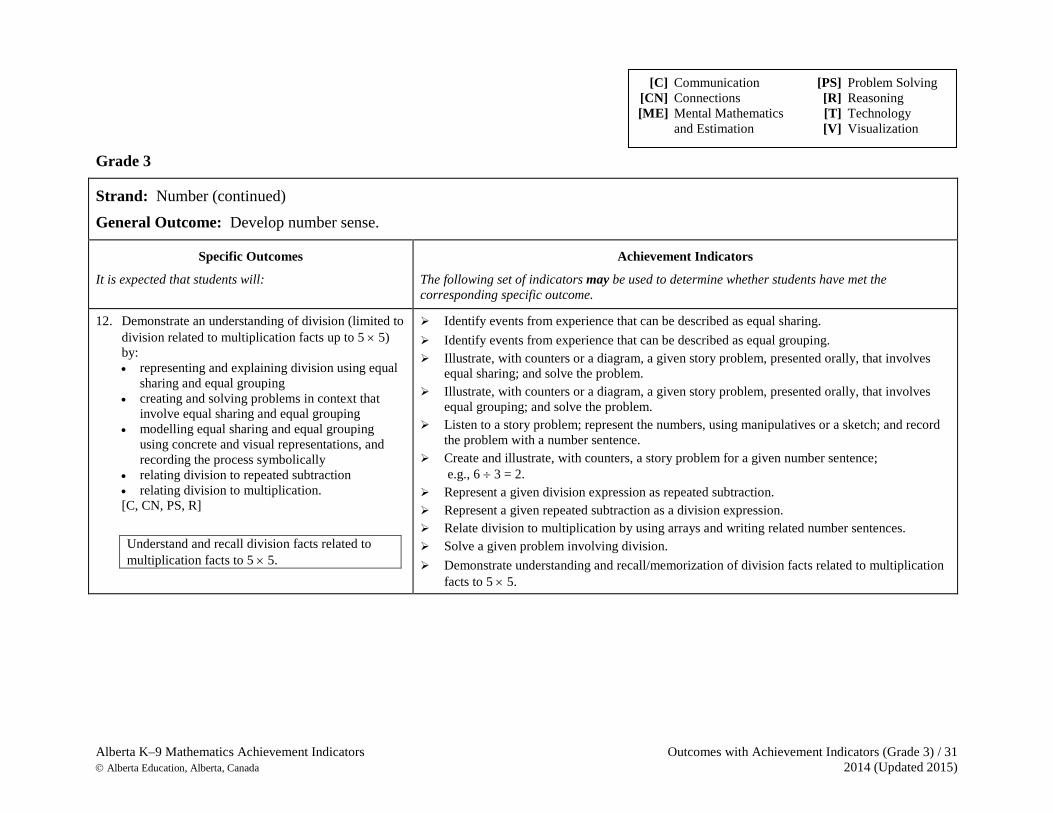
12. Demonstrate an understanding of division (limited to division related to multiplication facts up to 5 × 5) by: • representing and explaining division using equal
sharing and equal grouping • creating and solving problems in context that
involve equal sharing and equal grouping • modelling equal sharing and equal grouping
using concrete and visual representations, and recording the process symbolically
• relating division to repeated subtraction • relating division to multiplication. [C, CN, PS, R]
Understand and recall division facts related to multiplication facts to 5 × 5.
Identify events from experience that can be described as equal sharing. Identify events from experience that can be described as equal grouping. Illustrate, with counters or a diagram, a given story problem, presented orally, that involves
equal sharing; and solve the problem. Illustrate, with counters or a diagram, a given story problem, presented orally, that involves
equal grouping; and solve the problem. Listen to a story problem; represent the numbers, using manipulatives or a sketch; and record
the problem with a number sentence. Create and illustrate, with counters, a story problem for a given number sentence;
e.g., 6 ÷ 3 = 2. Represent a given division expression as repeated subtraction. Represent a given repeated subtraction as a division expression. Relate division to multiplication by using arrays and writing related number sentences. Solve a given problem involving division. Demonstrate understanding and recall/memorization of division facts related to multiplication
facts to 5 × 5.
[C] Communication [PS] Problem Solving [CN] Connections [R] Reasoning [ME] Mental Mathematics [T] Technology and Estimation [V] Visualization
32 / Outcomes with Achievement Indicators (Grade 3) Alberta K–9 Mathematics Achievement Indicators 2014 (Updated 2015) Alberta Education, Alberta, Canada
Grade 3
Strand: Number (continued) General Outcome: Develop number sense.
Specific Outcomes
It is expected that students will:
Achievement Indicators
The following set of indicators may be used to determine whether students have met the corresponding specific outcome.
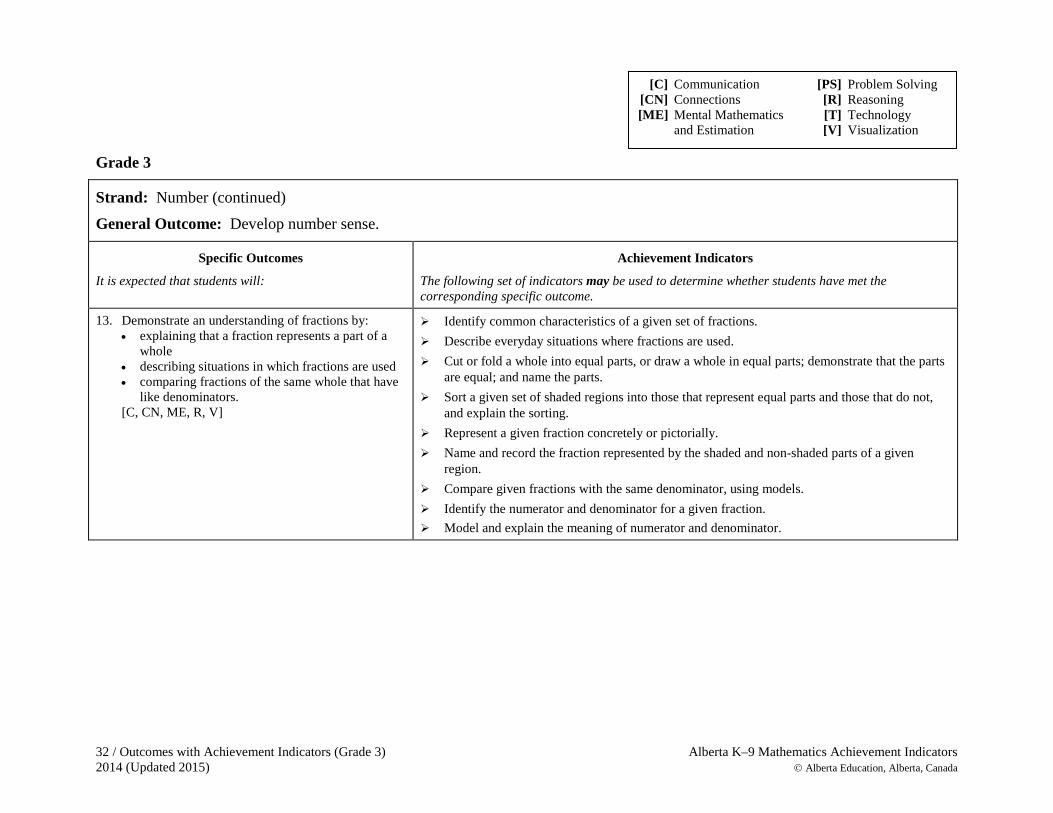
13. Demonstrate an understanding of fractions by: • explaining that a fraction represents a part of a
whole • describing situations in which fractions are used • comparing fractions of the same whole that have
like denominators. [C, CN, ME, R, V]
Identify common characteristics of a given set of fractions. Describe everyday situations where fractions are used. Cut or fold a whole into equal parts, or draw a whole in equal parts; demonstrate that the parts
are equal; and name the parts. Sort a given set of shaded regions into those that represent equal parts and those that do not,
and explain the sorting. Represent a given fraction concretely or pictorially. Name and record the fraction represented by the shaded and non-shaded parts of a given
region. Compare given fractions with the same denominator, using models. Identify the numerator and denominator for a given fraction. Model and explain the meaning of numerator and denominator.
[C] Communication [PS] Problem Solving [CN] Connections [R] Reasoning [ME] Mental Mathematics [T] Technology and Estimation [V] Visualization
Alberta K–9 Mathematics Achievement Indicators Outcomes with Achievement Indicators (Grade 3) / 33 Alberta Education, Alberta, Canada 2014 (Updated 2015)
Grade 3
Strand: Patterns and Relations (Patterns)
General Outcome: Use patterns to describe the world and to solve problems.
Specific Outcomes
It is expected that students will:
Achievement Indicators
The following set of indicators may be used to determine whether students have met the corresponding specific outcome.
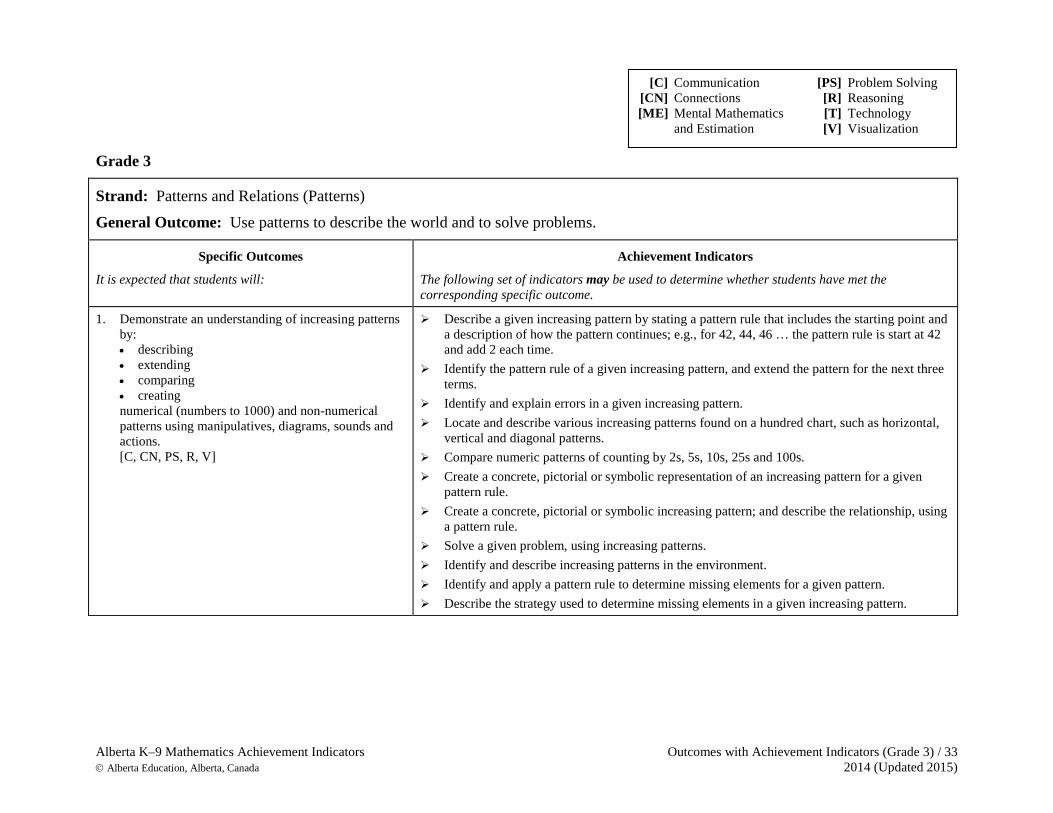
1. Demonstrate an understanding of increasing patterns by: • describing • extending • comparing • creating numerical (numbers to 1000) and non-numerical patterns using manipulatives, diagrams, sounds and actions. [C, CN, PS, R, V]
Describe a given increasing pattern by stating a pattern rule that includes the starting point and a description of how the pattern continues; e.g., for 42, 44, 46 … the pattern rule is start at 42 and add 2 each time.
Identify the pattern rule of a given increasing pattern, and extend the pattern for the next three terms.
Identify and explain errors in a given increasing pattern. Locate and describe various increasing patterns found on a hundred chart, such as horizontal,
vertical and diagonal patterns. Compare numeric patterns of counting by 2s, 5s, 10s, 25s and 100s. Create a concrete, pictorial or symbolic representation of an increasing pattern for a given
pattern rule. Create a concrete, pictorial or symbolic increasing pattern; and describe the relationship, using
a pattern rule. Solve a given problem, using increasing patterns. Identify and describe increasing patterns in the environment. Identify and apply a pattern rule to determine missing elements for a given pattern. Describe the strategy used to determine missing elements in a given increasing pattern.
[C] Communication [PS] Problem Solving [CN] Connections [R] Reasoning [ME] Mental Mathematics [T] Technology and Estimation [V] Visualization
34 / Outcomes with Achievement Indicators (Grade 3) Alberta K–9 Mathematics Achievement Indicators 2014 (Updated 2015) Alberta Education, Alberta, Canada
Grade 3
Strand: Patterns and Relations (Patterns) (continued)
General Outcome: Use patterns to describe the world and to solve problems.
Specific Outcomes
It is expected that students will:
Achievement Indicators
The following set of indicators may be used to determine whether students have met the corresponding specific outcome.
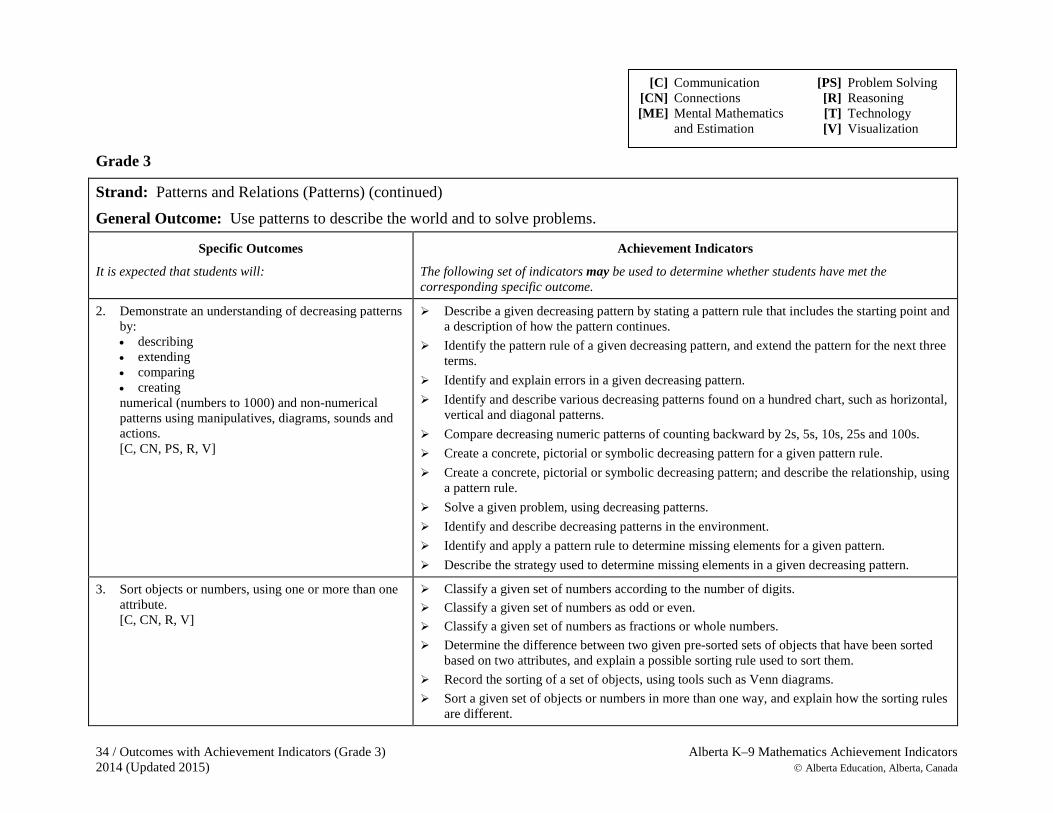
2. Demonstrate an understanding of decreasing patterns by: • describing • extending • comparing • creating numerical (numbers to 1000) and non-numerical patterns using manipulatives, diagrams, sounds and actions. [C, CN, PS, R, V]
Describe a given decreasing pattern by stating a pattern rule that includes the starting point and a description of how the pattern continues.
Identify the pattern rule of a given decreasing pattern, and extend the pattern for the next three terms.
Identify and explain errors in a given decreasing pattern. Identify and describe various decreasing patterns found on a hundred chart, such as horizontal,
vertical and diagonal patterns. Compare decreasing numeric patterns of counting backward by 2s, 5s, 10s, 25s and 100s. Create a concrete, pictorial or symbolic decreasing pattern for a given pattern rule. Create a concrete, pictorial or symbolic decreasing pattern; and describe the relationship, using
a pattern rule. Solve a given problem, using decreasing patterns. Identify and describe decreasing patterns in the environment. Identify and apply a pattern rule to determine missing elements for a given pattern. Describe the strategy used to determine missing elements in a given decreasing pattern.
3. Sort objects or numbers, using one or more than one attribute. [C, CN, R, V]
Classify a given set of numbers according to the number of digits. Classify a given set of numbers as odd or even. Classify a given set of numbers as fractions or whole numbers. Determine the difference between two given pre-sorted sets of objects that have been sorted
based on two attributes, and explain a possible sorting rule used to sort them. Record the sorting of a set of objects, using tools such as Venn diagrams. Sort a given set of objects or numbers in more than one way, and explain how the sorting rules
are different.
[C] Communication [PS] Problem Solving [CN] Connections [R] Reasoning [ME] Mental Mathematics [T] Technology and Estimation [V] Visualization
Alberta K–9 Mathematics Achievement Indicators Outcomes with Achievement Indicators (Grade 3) / 35 Alberta Education, Alberta, Canada 2014 (Updated 2015)
Grade 3
Strand: Patterns and Relations (Variables and Equations)
General Outcome: Represent algebraic expressions in multiple ways.
Specific Outcomes
It is expected that students will:
Achievement Indicators
The following set of indicators may be used to determine whether students have met the corresponding specific outcome.
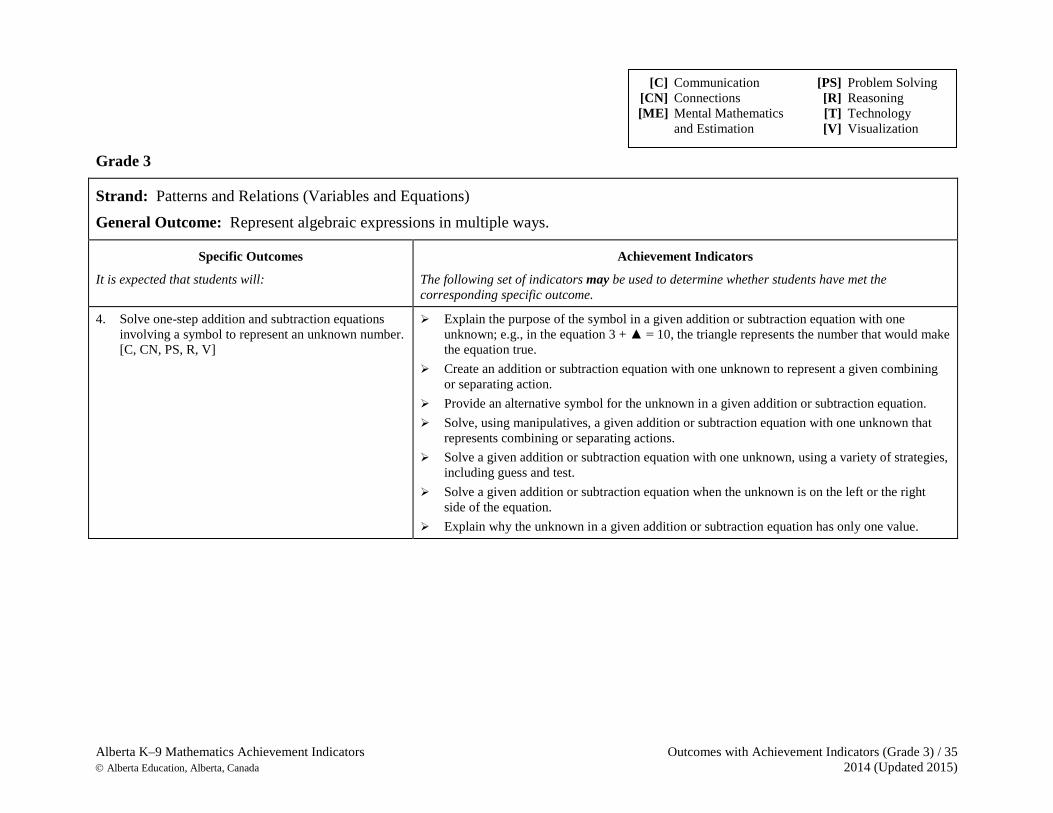
4. Solve one-step addition and subtraction equations involving a symbol to represent an unknown number. [C, CN, PS, R, V]
Explain the purpose of the symbol in a given addition or subtraction equation with one unknown; e.g., in the equation 3 + ▲ = 10, the triangle represents the number that would make the equation true.
Create an addition or subtraction equation with one unknown to represent a given combining or separating action.
Provide an alternative symbol for the unknown in a given addition or subtraction equation. Solve, using manipulatives, a given addition or subtraction equation with one unknown that
represents combining or separating actions. Solve a given addition or subtraction equation with one unknown, using a variety of strategies,
including guess and test. Solve a given addition or subtraction equation when the unknown is on the left or the right
side of the equation. Explain why the unknown in a given addition or subtraction equation has only one value.
[C] Communication [PS] Problem Solving [CN] Connections [R] Reasoning [ME] Mental Mathematics [T] Technology and Estimation [V] Visualization
36 / Outcomes with Achievement Indicators (Grade 3) Alberta K–9 Mathematics Achievement Indicators 2014 (Updated 2015) Alberta Education, Alberta, Canada
Grade 3
Strand: Shape and Space (Measurement) General Outcome: Use direct and indirect measurement to solve problems.
Specific Outcomes
It is expected that students will:
Achievement Indicators
The following set of indicators may be used to determine whether students have met the corresponding specific outcome.
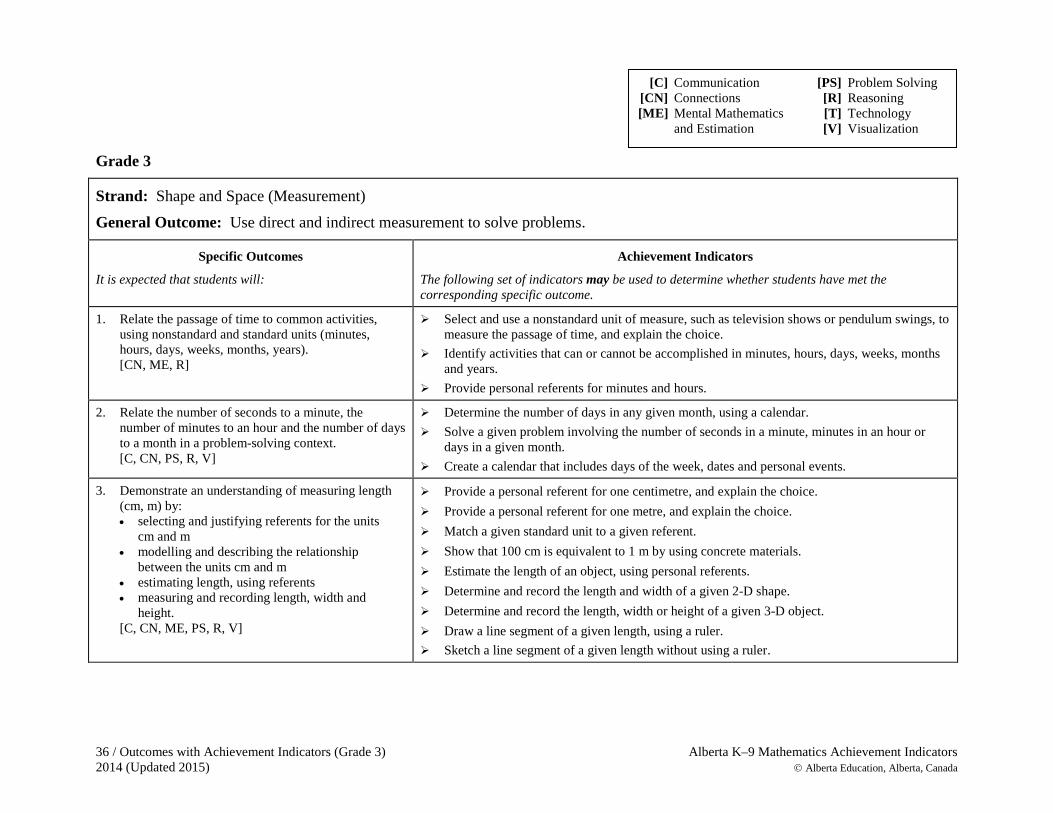
1. Relate the passage of time to common activities, using nonstandard and standard units (minutes, hours, days, weeks, months, years). [CN, ME, R]
Select and use a nonstandard unit of measure, such as television shows or pendulum swings, to measure the passage of time, and explain the choice.
Identify activities that can or cannot be accomplished in minutes, hours, days, weeks, months and years.
Provide personal referents for minutes and hours.
2. Relate the number of seconds to a minute, the number of minutes to an hour and the number of days to a month in a problem-solving context. [C, CN, PS, R, V]
Determine the number of days in any given month, using a calendar. Solve a given problem involving the number of seconds in a minute, minutes in an hour or
days in a given month. Create a calendar that includes days of the week, dates and personal events.
3. Demonstrate an understanding of measuring length (cm, m) by: • selecting and justifying referents for the units
cm and m • modelling and describing the relationship
between the units cm and m • estimating length, using referents • measuring and recording length, width and
height. [C, CN, ME, PS, R, V]
Provide a personal referent for one centimetre, and explain the choice. Provide a personal referent for one metre, and explain the choice. Match a given standard unit to a given referent. Show that 100 cm is equivalent to 1 m by using concrete materials. Estimate the length of an object, using personal referents. Determine and record the length and width of a given 2-D shape. Determine and record the length, width or height of a given 3-D object. Draw a line segment of a given length, using a ruler. Sketch a line segment of a given length without using a ruler.
[C] Communication [PS] Problem Solving [CN] Connections [R] Reasoning [ME] Mental Mathematics [T] Technology and Estimation [V] Visualization
Alberta K–9 Mathematics Achievement Indicators Outcomes with Achievement Indicators (Grade 3) / 37 Alberta Education, Alberta, Canada 2014 (Updated 2015)
Grade 3
Strand: Shape and Space (Measurement) (continued) General Outcome: Use direct and indirect measurement to solve problems.
Specific Outcomes
It is expected that students will:
Achievement Indicators
The following set of indicators may be used to determine whether students have met the corresponding specific outcome.
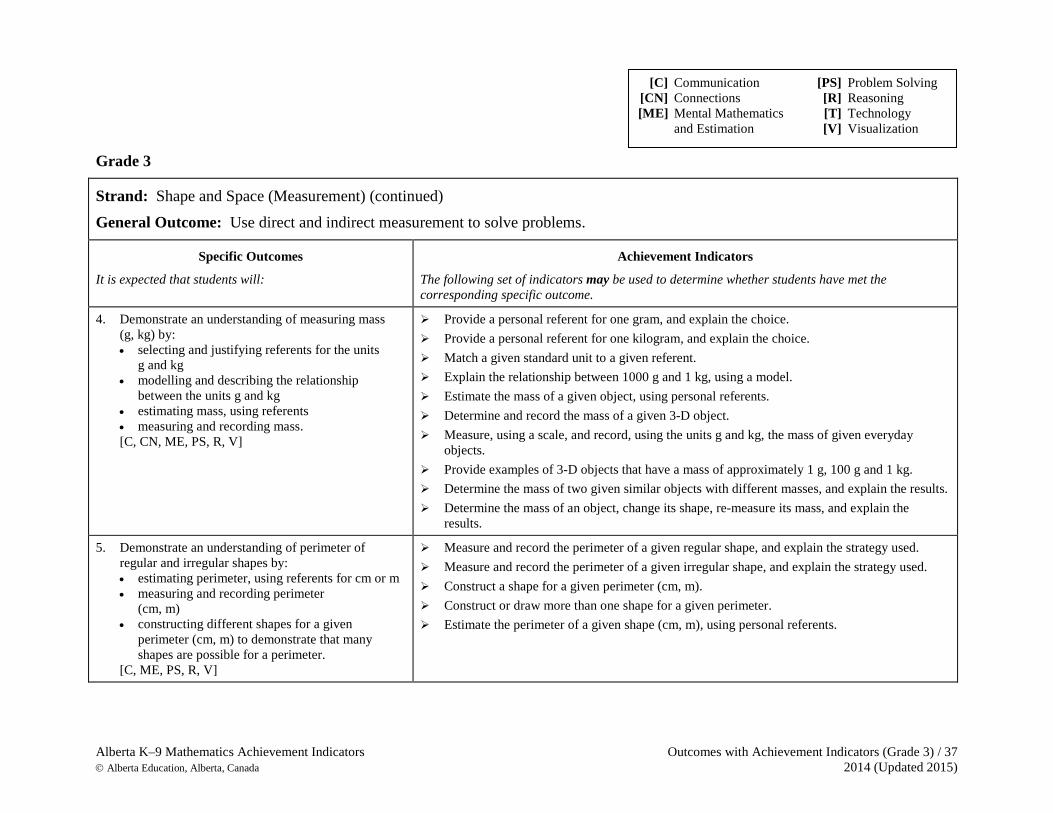
4. Demonstrate an understanding of measuring mass (g, kg) by: • selecting and justifying referents for the units
g and kg • modelling and describing the relationship
between the units g and kg • estimating mass, using referents • measuring and recording mass. [C, CN, ME, PS, R, V]
Provide a personal referent for one gram, and explain the choice. Provide a personal referent for one kilogram, and explain the choice. Match a given standard unit to a given referent. Explain the relationship between 1000 g and 1 kg, using a model. Estimate the mass of a given object, using personal referents. Determine and record the mass of a given 3-D object. Measure, using a scale, and record, using the units g and kg, the mass of given everyday
objects. Provide examples of 3-D objects that have a mass of approximately 1 g, 100 g and 1 kg. Determine the mass of two given similar objects with different masses, and explain the results. Determine the mass of an object, change its shape, re-measure its mass, and explain the
results.
5. Demonstrate an understanding of perimeter of regular and irregular shapes by: • estimating perimeter, using referents for cm or m • measuring and recording perimeter
(cm, m) • constructing different shapes for a given
perimeter (cm, m) to demonstrate that many shapes are possible for a perimeter.
[C, ME, PS, R, V]
Measure and record the perimeter of a given regular shape, and explain the strategy used. Measure and record the perimeter of a given irregular shape, and explain the strategy used. Construct a shape for a given perimeter (cm, m). Construct or draw more than one shape for a given perimeter. Estimate the perimeter of a given shape (cm, m), using personal referents.
[C] Communication [PS] Problem Solving [CN] Connections [R] Reasoning [ME] Mental Mathematics [T] Technology and Estimation [V] Visualization
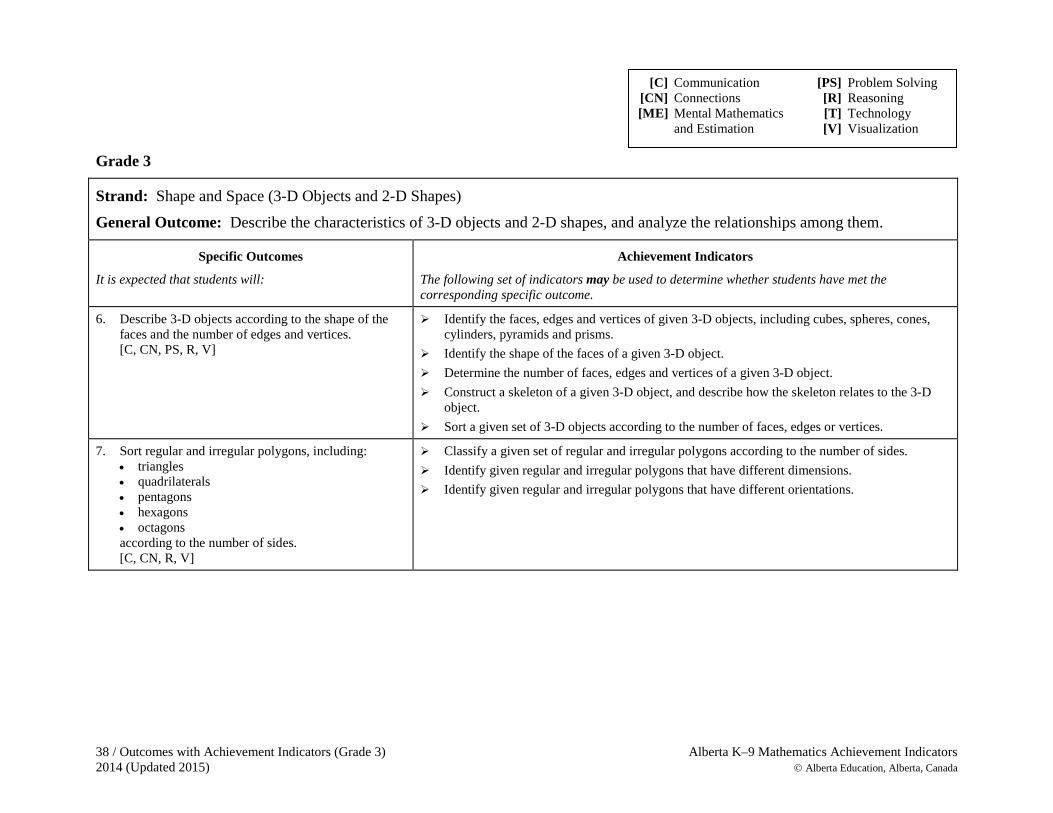
38 / Outcomes with Achievement Indicators (Grade 3) Alberta K–9 Mathematics Achievement Indicators 2014 (Updated 2015) Alberta Education, Alberta, Canada
Grade 3
Strand: Shape and Space (3-D Objects and 2-D Shapes) General Outcome: Describe the characteristics of 3-D objects and 2-D shapes, and analyze the relationships among them.
Specific Outcomes
It is expected that students will:
Achievement Indicators
The following set of indicators may be used to determine whether students have met the corresponding specific outcome.
6. Describe 3-D objects according to the shape of the faces and the number of edges and vertices. [C, CN, PS, R, V]
Identify the faces, edges and vertices of given 3-D objects, including cubes, spheres, cones, cylinders, pyramids and prisms.
Identify the shape of the faces of a given 3-D object. Determine the number of faces, edges and vertices of a given 3-D object. Construct a skeleton of a given 3-D object, and describe how the skeleton relates to the 3-D
object. Sort a given set of 3-D objects according to the number of faces, edges or vertices.
7. Sort regular and irregular polygons, including: • triangles • quadrilaterals • pentagons • hexagons • octagons according to the number of sides. [C, CN, R, V]
Classify a given set of regular and irregular polygons according to the number of sides. Identify given regular and irregular polygons that have different dimensions. Identify given regular and irregular polygons that have different orientations.
[C] Communication [PS] Problem Solving [CN] Connections [R] Reasoning [ME] Mental Mathematics [T] Technology and Estimation [V] Visualization
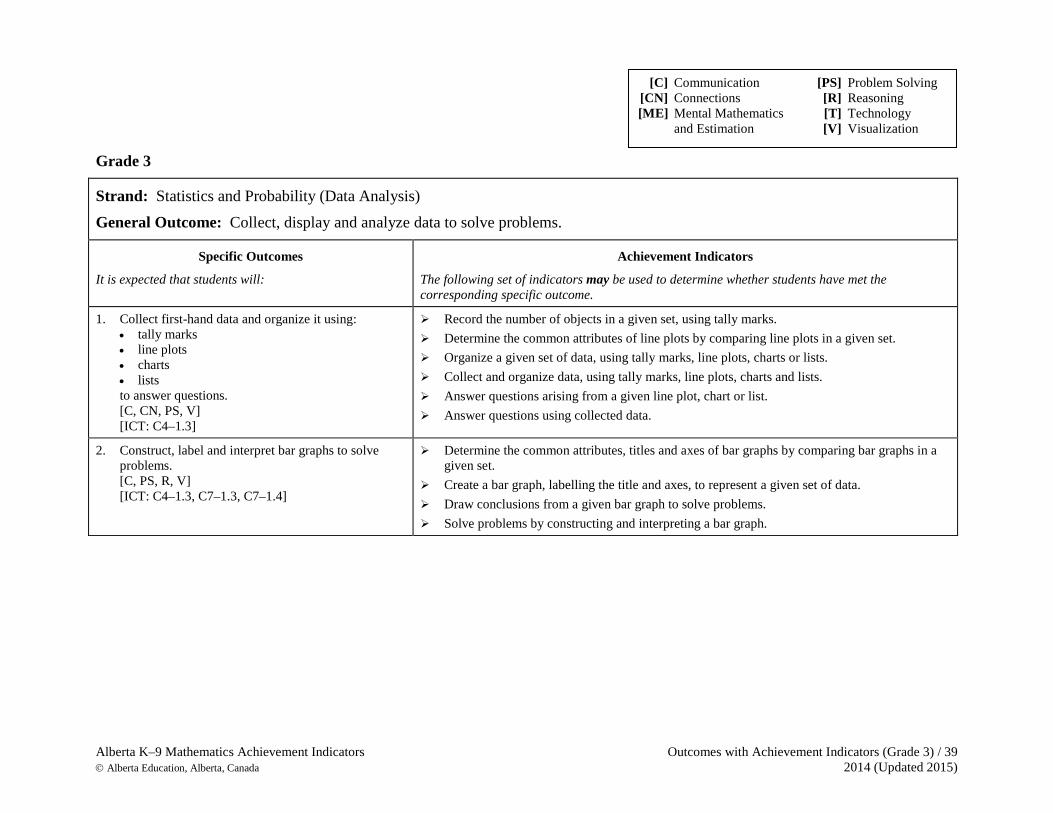
Alberta K–9 Mathematics Achievement Indicators Outcomes with Achievement Indicators (Grade 3) / 39 Alberta Education, Alberta, Canada 2014 (Updated 2015)
Grade 3
Strand: Statistics and Probability (Data Analysis) General Outcome: Collect, display and analyze data to solve problems.
Specific Outcomes
It is expected that students will:
Achievement Indicators
The following set of indicators may be used to determine whether students have met the corresponding specific outcome.
1. Collect first-hand data and organize it using: • tally marks • line plots • charts • lists to answer questions. [C, CN, PS, V] [ICT: C4–1.3]
Record the number of objects in a given set, using tally marks. Determine the common attributes of line plots by comparing line plots in a given set. Organize a given set of data, using tally marks, line plots, charts or lists. Collect and organize data, using tally marks, line plots, charts and lists. Answer questions arising from a given line plot, chart or list. Answer questions using collected data.
2. Construct, label and interpret bar graphs to solve problems. [C, PS, R, V] [ICT: C4–1.3, C7–1.3, C7–1.4]
Determine the common attributes, titles and axes of bar graphs by comparing bar graphs in a given set.
Create a bar graph, labelling the title and axes, to represent a given set of data. Draw conclusions from a given bar graph to solve problems. Solve problems by constructing and interpreting a bar graph.
[C] Communication [PS] Problem Solving [CN] Connections [R] Reasoning [ME] Mental Mathematics [T] Technology and Estimation [V] Visualization
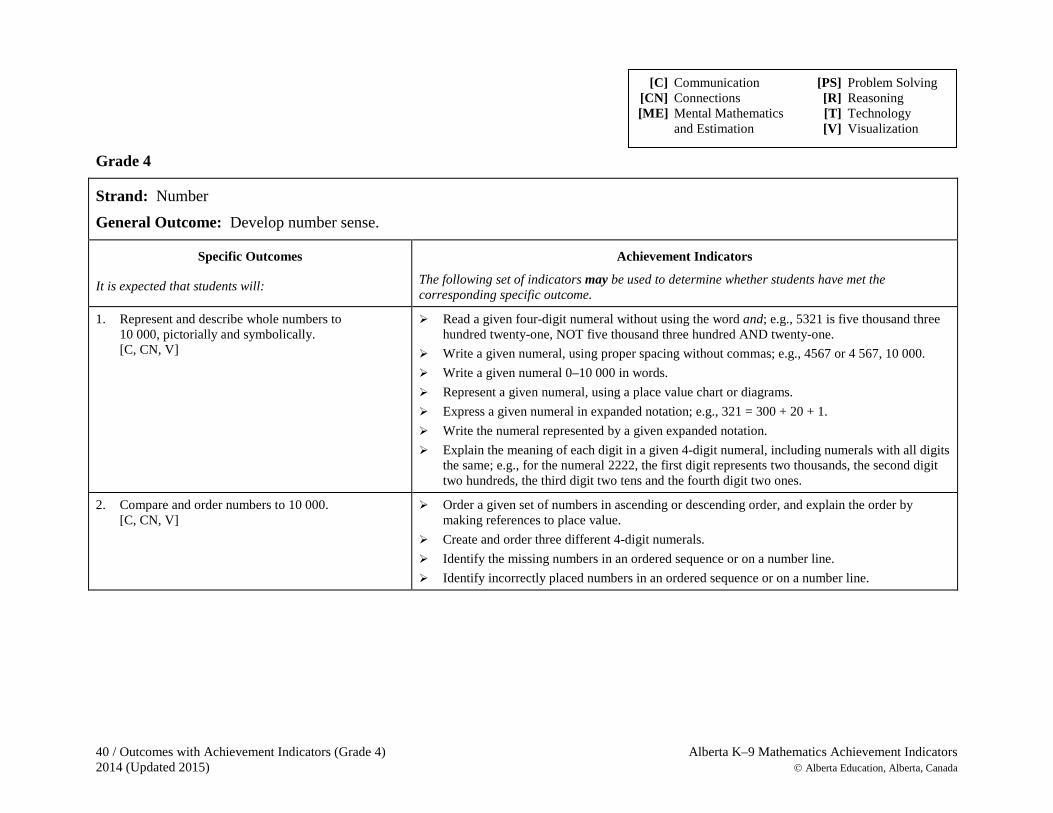
40 / Outcomes with Achievement Indicators (Grade 4) Alberta K–9 Mathematics Achievement Indicators 2014 (Updated 2015) Alberta Education, Alberta, Canada
Grade 4
Strand: Number General Outcome: Develop number sense.
Specific Outcomes It is expected that students will:
Achievement Indicators
The following set of indicators may be used to determine whether students have met the corresponding specific outcome.
1. Represent and describe whole numbers to 10 000, pictorially and symbolically. [C, CN, V]
Read a given four-digit numeral without using the word and; e.g., 5321 is five thousand three hundred twenty-one, NOT five thousand three hundred AND twenty-one.
Write a given numeral, using proper spacing without commas; e.g., 4567 or 4 567, 10 000. Write a given numeral 0–10 000 in words. Represent a given numeral, using a place value chart or diagrams. Express a given numeral in expanded notation; e.g., 321 = 300 + 20 + 1. Write the numeral represented by a given expanded notation. Explain the meaning of each digit in a given 4-digit numeral, including numerals with all digits
the same; e.g., for the numeral 2222, the first digit represents two thousands, the second digit two hundreds, the third digit two tens and the fourth digit two ones.
2. Compare and order numbers to 10 000. [C, CN, V]
Order a given set of numbers in ascending or descending order, and explain the order by making references to place value.
Create and order three different 4-digit numerals. Identify the missing numbers in an ordered sequence or on a number line. Identify incorrectly placed numbers in an ordered sequence or on a number line.
[C] Communication [PS] Problem Solving [CN] Connections [R] Reasoning [ME] Mental Mathematics [T] Technology and Estimation [V] Visualization

Alberta K–9 Mathematics Achievement Indicators Outcomes with Achievement Indicators (Grade 4) / 41 Alberta Education, Alberta, Canada 2014 (Updated 2015)
Grade 4
Strand: Number (continued) General Outcome: Develop number sense.
Specific Outcomes
It is expected that students will:
Achievement Indicators
The following set of indicators may be used to determine whether students have met the corresponding specific outcome.
3. Demonstrate an understanding of addition of numbers with answers to 10 000 and their corresponding subtractions (limited to 3- and 4-digit numerals) by: • using personal strategies for adding and
subtracting • estimating sums and differences • solving problems involving addition and
subtraction. [C, CN, ME, PS, R]
(Students investigate a variety of strategies and become proficient in at least one appropriate and efficient strategy that they understand.) Explain how to keep track of digits that have the same place value when adding numbers,
limited to 3- and 4-digit numerals. Explain how to keep track of digits that have the same place value when subtracting numbers,
limited to 3- and 4-digit numerals. Describe a situation in which an estimate rather than an exact answer is sufficient. Estimate sums and differences, using different strategies; e.g., front-end estimation and
compensation. Refine personal strategies to increase their efficiency. Solve problems that involve addition and subtraction of more than 2 numbers. Solve a given problem using the standard/traditional addition algorithm. Solve a given problem using the standard/traditional subtraction algorithm.
4. Apply the properties of 0 and 1 for multiplication and the property of 1 for division. [C, CN, R]
Determine the answer to a given question involving the multiplication of a number by 1, and explain the answer.
Determine the answer to a given question involving the multiplication of a number by 0, and explain the answer.
Determine the answer to a given question involving the division of a number by 1, and explain the answer.
[C] Communication [PS] Problem Solving [CN] Connections [R] Reasoning [ME] Mental Mathematics [T] Technology and Estimation [V] Visualization
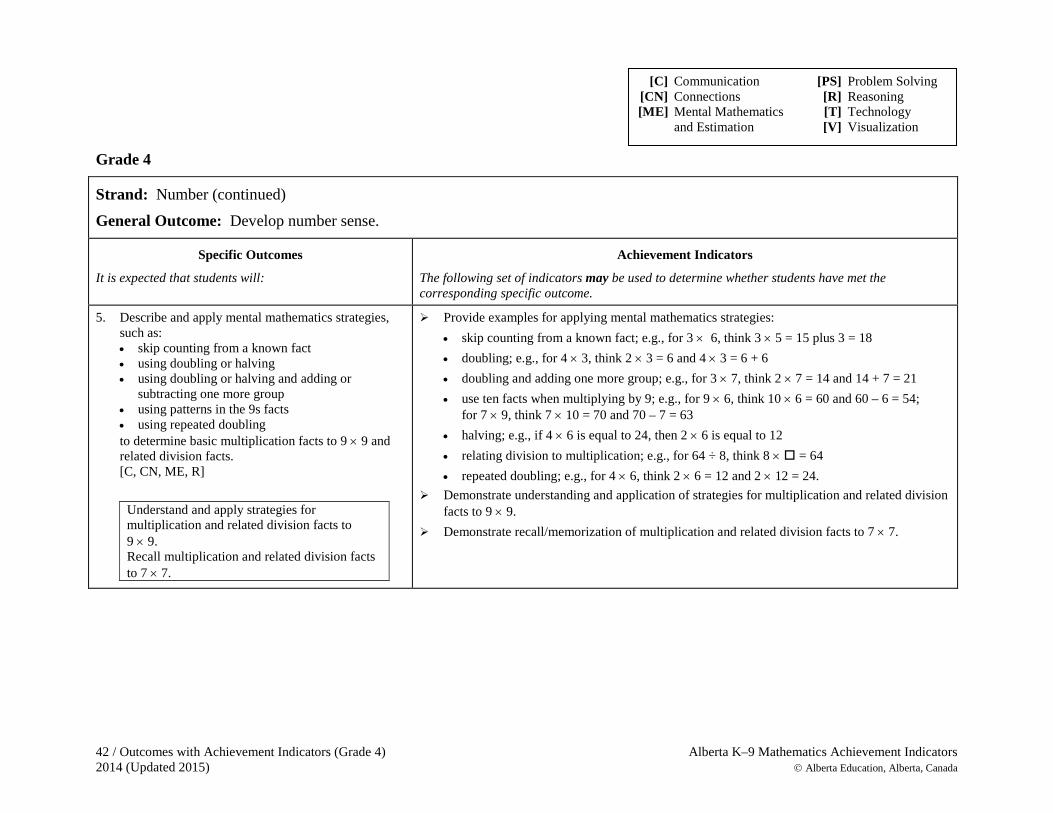
42 / Outcomes with Achievement Indicators (Grade 4) Alberta K–9 Mathematics Achievement Indicators 2014 (Updated 2015) Alberta Education, Alberta, Canada
Grade 4
Strand: Number (continued) General Outcome: Develop number sense.
Specific Outcomes
It is expected that students will:
Achievement Indicators
The following set of indicators may be used to determine whether students have met the corresponding specific outcome.
5. Describe and apply mental mathematics strategies, such as: • skip counting from a known fact • using doubling or halving • using doubling or halving and adding or
subtracting one more group • using patterns in the 9s facts • using repeated doubling to determine basic multiplication facts to 9 × 9 and related division facts. [C, CN, ME, R]
Understand and apply strategies for multiplication and related division facts to 9 × 9. Recall multiplication and related division facts to 7 × 7.
Provide examples for applying mental mathematics strategies: • skip counting from a known fact; e.g., for 3 × 6, think 3 × 5 = 15 plus 3 = 18 • doubling; e.g., for 4 × 3, think 2 × 3 = 6 and 4 × 3 = 6 + 6 • doubling and adding one more group; e.g., for 3 × 7, think 2 × 7 = 14 and 14 + 7 = 21 • use ten facts when multiplying by 9; e.g., for 9 × 6, think 10 × 6 = 60 and 60 – 6 = 54;
for 7 × 9, think 7 × 10 = 70 and 70 – 7 = 63 • halving; e.g., if 4 × 6 is equal to 24, then 2 × 6 is equal to 12 • relating division to multiplication; e.g., for 64 ÷ 8, think 8 × = 64 • repeated doubling; e.g., for 4 × 6, think 2 × 6 = 12 and 2 × 12 = 24.
Demonstrate understanding and application of strategies for multiplication and related division facts to 9 × 9.
Demonstrate recall/memorization of multiplication and related division facts to 7 × 7.
[C] Communication [PS] Problem Solving [CN] Connections [R] Reasoning [ME] Mental Mathematics [T] Technology and Estimation [V] Visualization
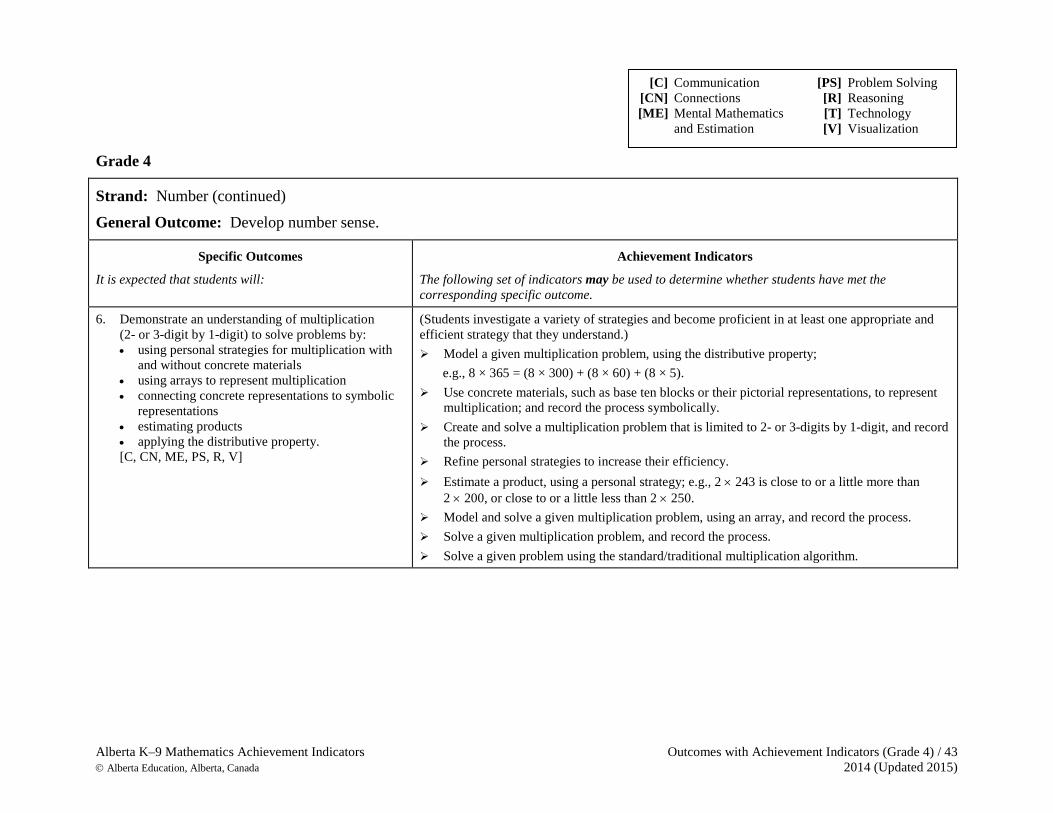
Alberta K–9 Mathematics Achievement Indicators Outcomes with Achievement Indicators (Grade 4) / 43 Alberta Education, Alberta, Canada 2014 (Updated 2015)
Grade 4
Strand: Number (continued) General Outcome: Develop number sense.
Specific Outcomes
It is expected that students will:
Achievement Indicators
The following set of indicators may be used to determine whether students have met the corresponding specific outcome.
6. Demonstrate an understanding of multiplication (2- or 3-digit by 1-digit) to solve problems by: • using personal strategies for multiplication with
and without concrete materials • using arrays to represent multiplication • connecting concrete representations to symbolic
representations • estimating products • applying the distributive property. [C, CN, ME, PS, R, V]
(Students investigate a variety of strategies and become proficient in at least one appropriate and efficient strategy that they understand.) Model a given multiplication problem, using the distributive property; e.g., 8 × 365 = (8 × 300) + (8 × 60) + (8 × 5). Use concrete materials, such as base ten blocks or their pictorial representations, to represent
multiplication; and record the process symbolically. Create and solve a multiplication problem that is limited to 2- or 3-digits by 1-digit, and record
the process. Refine personal strategies to increase their efficiency. Estimate a product, using a personal strategy; e.g., 2 × 243 is close to or a little more than
2 × 200, or close to or a little less than 2 × 250. Model and solve a given multiplication problem, using an array, and record the process. Solve a given multiplication problem, and record the process. Solve a given problem using the standard/traditional multiplication algorithm.
[C] Communication [PS] Problem Solving [CN] Connections [R] Reasoning [ME] Mental Mathematics [T] Technology and Estimation [V] Visualization
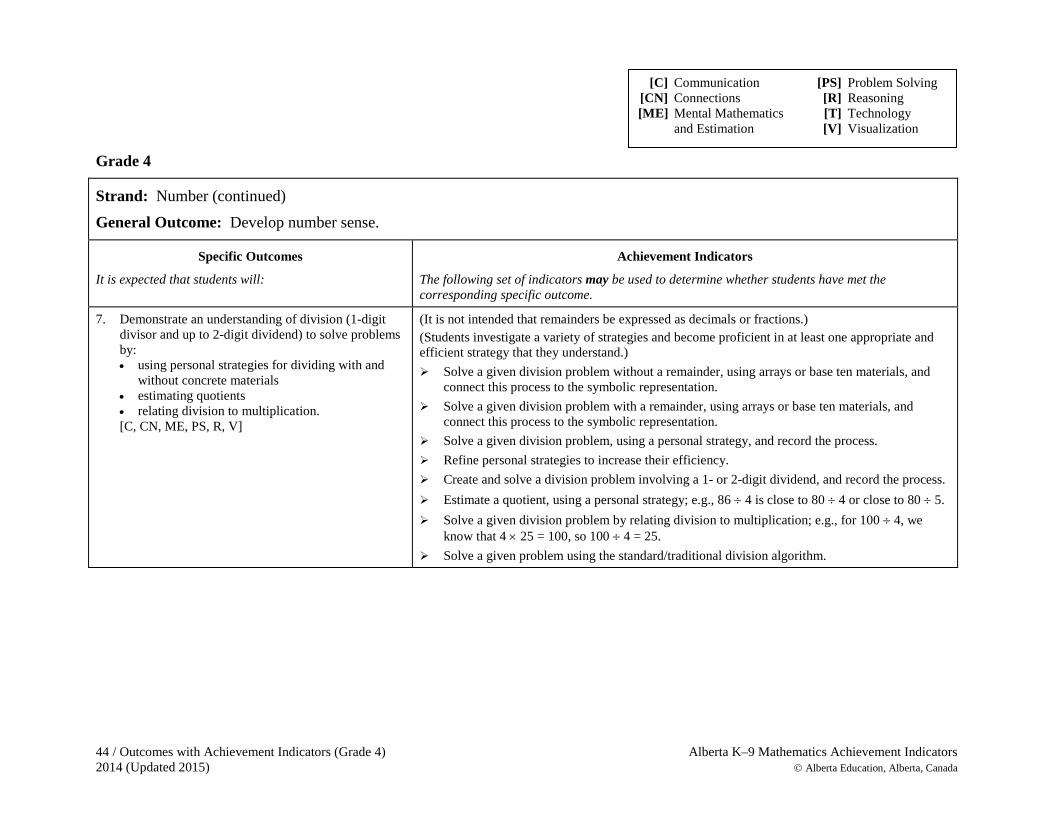
44 / Outcomes with Achievement Indicators (Grade 4) Alberta K–9 Mathematics Achievement Indicators 2014 (Updated 2015) Alberta Education, Alberta, Canada
Grade 4
Strand: Number (continued) General Outcome: Develop number sense.
Specific Outcomes
It is expected that students will:
Achievement Indicators
The following set of indicators may be used to determine whether students have met the corresponding specific outcome.
7. Demonstrate an understanding of division (1-digit divisor and up to 2-digit dividend) to solve problems by: • using personal strategies for dividing with and
without concrete materials • estimating quotients • relating division to multiplication. [C, CN, ME, PS, R, V]
(It is not intended that remainders be expressed as decimals or fractions.) (Students investigate a variety of strategies and become proficient in at least one appropriate and efficient strategy that they understand.) Solve a given division problem without a remainder, using arrays or base ten materials, and
connect this process to the symbolic representation. Solve a given division problem with a remainder, using arrays or base ten materials, and
connect this process to the symbolic representation. Solve a given division problem, using a personal strategy, and record the process. Refine personal strategies to increase their efficiency. Create and solve a division problem involving a 1- or 2-digit dividend, and record the process. Estimate a quotient, using a personal strategy; e.g., 86 ÷ 4 is close to 80 ÷ 4 or close to 80 ÷ 5. Solve a given division problem by relating division to multiplication; e.g., for 100 ÷ 4, we
know that 4 × 25 = 100, so 100 ÷ 4 = 25. Solve a given problem using the standard/traditional division algorithm.
[C] Communication [PS] Problem Solving [CN] Connections [R] Reasoning [ME] Mental Mathematics [T] Technology and Estimation [V] Visualization
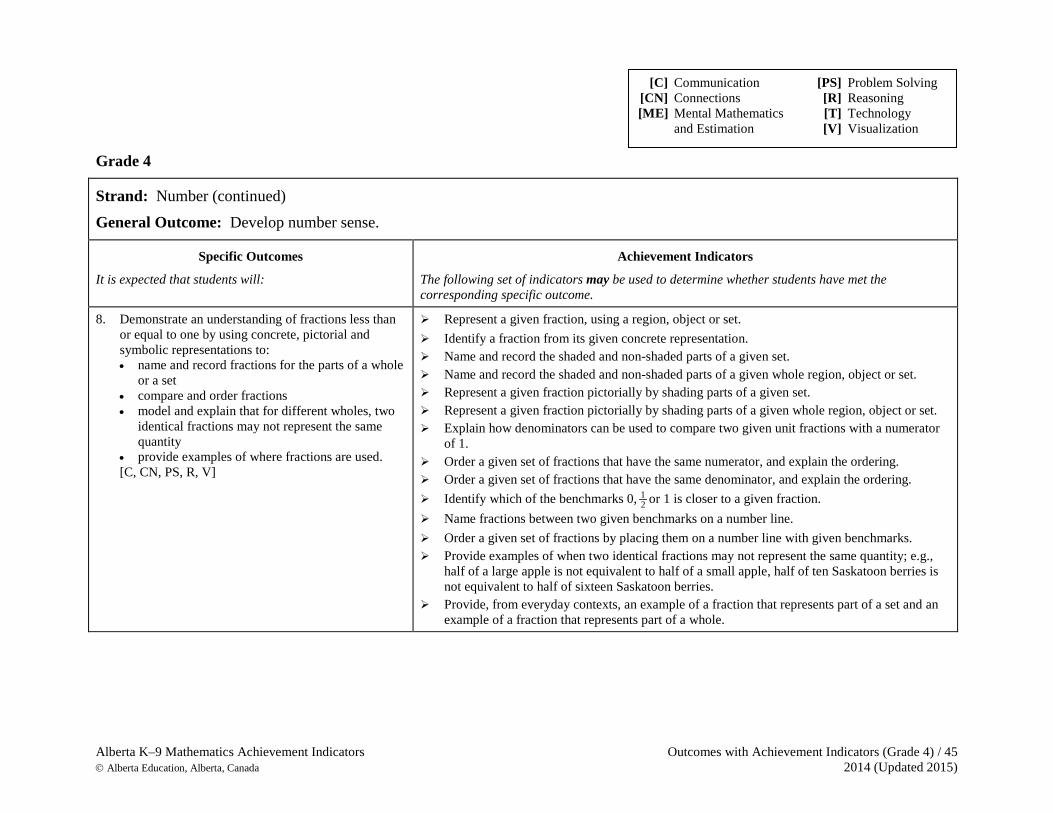
Alberta K–9 Mathematics Achievement Indicators Outcomes with Achievement Indicators (Grade 4) / 45 Alberta Education, Alberta, Canada 2014 (Updated 2015)
Grade 4
Strand: Number (continued) General Outcome: Develop number sense.
Specific Outcomes
It is expected that students will:
Achievement Indicators
The following set of indicators may be used to determine whether students have met the corresponding specific outcome.
8. Demonstrate an understanding of fractions less than or equal to one by using concrete, pictorial and symbolic representations to: • name and record fractions for the parts of a whole
or a set • compare and order fractions • model and explain that for different wholes, two
identical fractions may not represent the same quantity
• provide examples of where fractions are used. [C, CN, PS, R, V]
Represent a given fraction, using a region, object or set. Identify a fraction from its given concrete representation. Name and record the shaded and non-shaded parts of a given set. Name and record the shaded and non-shaded parts of a given whole region, object or set. Represent a given fraction pictorially by shading parts of a given set. Represent a given fraction pictorially by shading parts of a given whole region, object or set. Explain how denominators can be used to compare two given unit fractions with a numerator
of 1. Order a given set of fractions that have the same numerator, and explain the ordering. Order a given set of fractions that have the same denominator, and explain the ordering. Identify which of the benchmarks 0, 1
2 or 1 is closer to a given fraction. Name fractions between two given benchmarks on a number line. Order a given set of fractions by placing them on a number line with given benchmarks. Provide examples of when two identical fractions may not represent the same quantity; e.g.,
half of a large apple is not equivalent to half of a small apple, half of ten Saskatoon berries is not equivalent to half of sixteen Saskatoon berries.
Provide, from everyday contexts, an example of a fraction that represents part of a set and an example of a fraction that represents part of a whole.
[C] Communication [PS] Problem Solving [CN] Connections [R] Reasoning [ME] Mental Mathematics [T] Technology and Estimation [V] Visualization
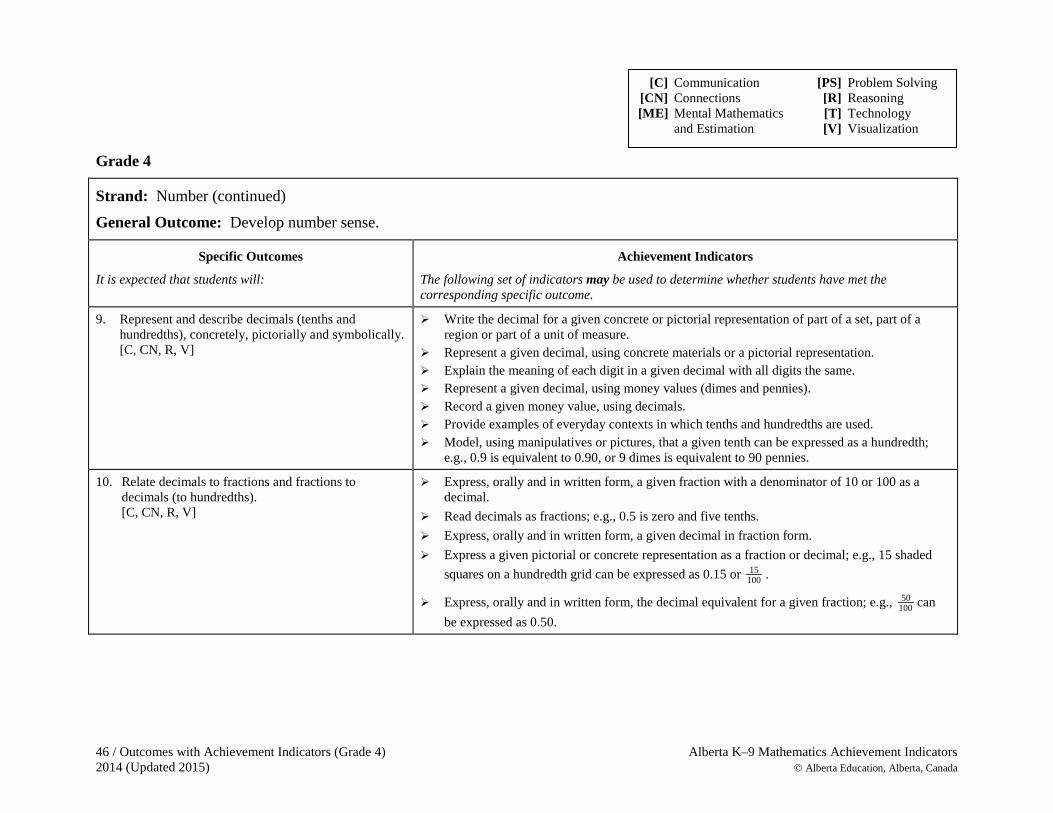
46 / Outcomes with Achievement Indicators (Grade 4) Alberta K–9 Mathematics Achievement Indicators 2014 (Updated 2015) Alberta Education, Alberta, Canada
Grade 4
Strand: Number (continued) General Outcome: Develop number sense.
Specific Outcomes
It is expected that students will:
Achievement Indicators
The following set of indicators may be used to determine whether students have met the corresponding specific outcome.
9. Represent and describe decimals (tenths and hundredths), concretely, pictorially and symbolically. [C, CN, R, V]
Write the decimal for a given concrete or pictorial representation of part of a set, part of a region or part of a unit of measure.
Represent a given decimal, using concrete materials or a pictorial representation. Explain the meaning of each digit in a given decimal with all digits the same. Represent a given decimal, using money values (dimes and pennies). Record a given money value, using decimals. Provide examples of everyday contexts in which tenths and hundredths are used. Model, using manipulatives or pictures, that a given tenth can be expressed as a hundredth;
e.g., 0.9 is equivalent to 0.90, or 9 dimes is equivalent to 90 pennies.
10. Relate decimals to fractions and fractions to decimals (to hundredths). [C, CN, R, V]
Express, orally and in written form, a given fraction with a denominator of 10 or 100 as a decimal.
Read decimals as fractions; e.g., 0.5 is zero and five tenths. Express, orally and in written form, a given decimal in fraction form. Express a given pictorial or concrete representation as a fraction or decimal; e.g., 15 shaded
squares on a hundredth grid can be expressed as 0.15 or 15100 .
Express, orally and in written form, the decimal equivalent for a given fraction; e.g., 50100 can
be expressed as 0.50.
[C] Communication [PS] Problem Solving [CN] Connections [R] Reasoning [ME] Mental Mathematics [T] Technology and Estimation [V] Visualization
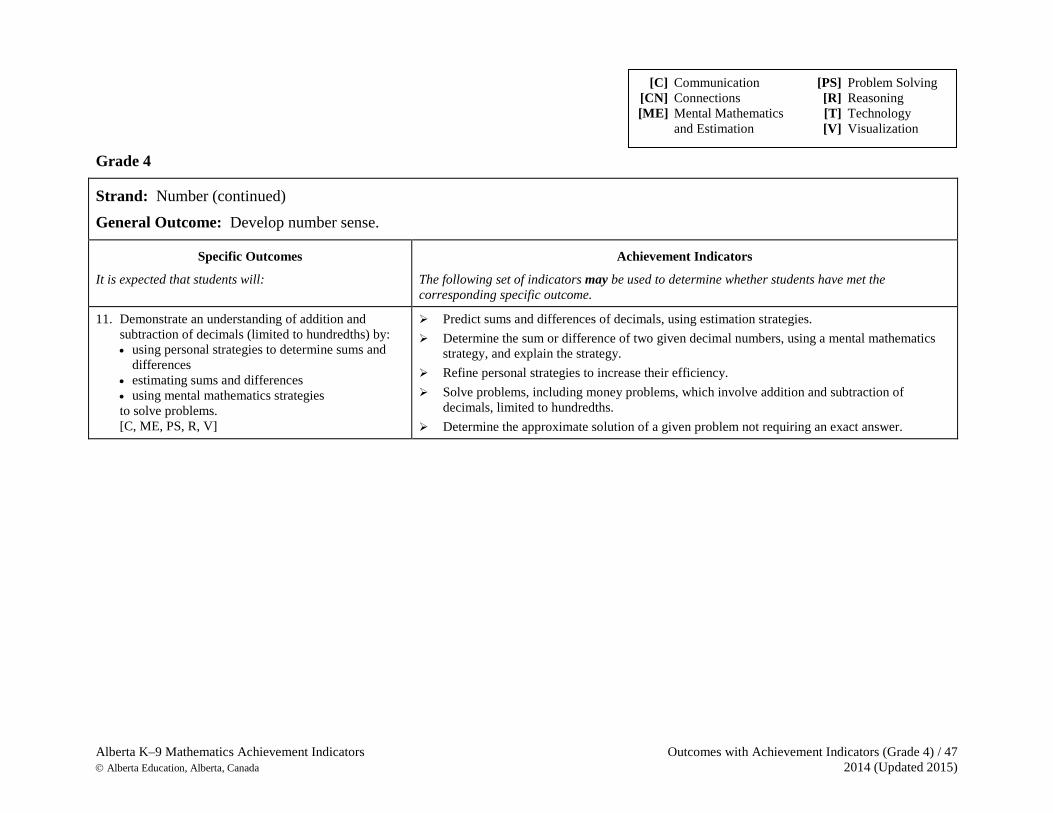
Alberta K–9 Mathematics Achievement Indicators Outcomes with Achievement Indicators (Grade 4) / 47 Alberta Education, Alberta, Canada 2014 (Updated 2015)
Grade 4
Strand: Number (continued) General Outcome: Develop number sense.
Specific Outcomes
It is expected that students will:
Achievement Indicators
The following set of indicators may be used to determine whether students have met the corresponding specific outcome.
11. Demonstrate an understanding of addition and subtraction of decimals (limited to hundredths) by: • using personal strategies to determine sums and
differences • estimating sums and differences • using mental mathematics strategies
to solve problems. [C, ME, PS, R, V]
Predict sums and differences of decimals, using estimation strategies. Determine the sum or difference of two given decimal numbers, using a mental mathematics
strategy, and explain the strategy. Refine personal strategies to increase their efficiency. Solve problems, including money problems, which involve addition and subtraction of
decimals, limited to hundredths. Determine the approximate solution of a given problem not requiring an exact answer.
[C] Communication [PS] Problem Solving [CN] Connections [R] Reasoning [ME] Mental Mathematics [T] Technology and Estimation [V] Visualization
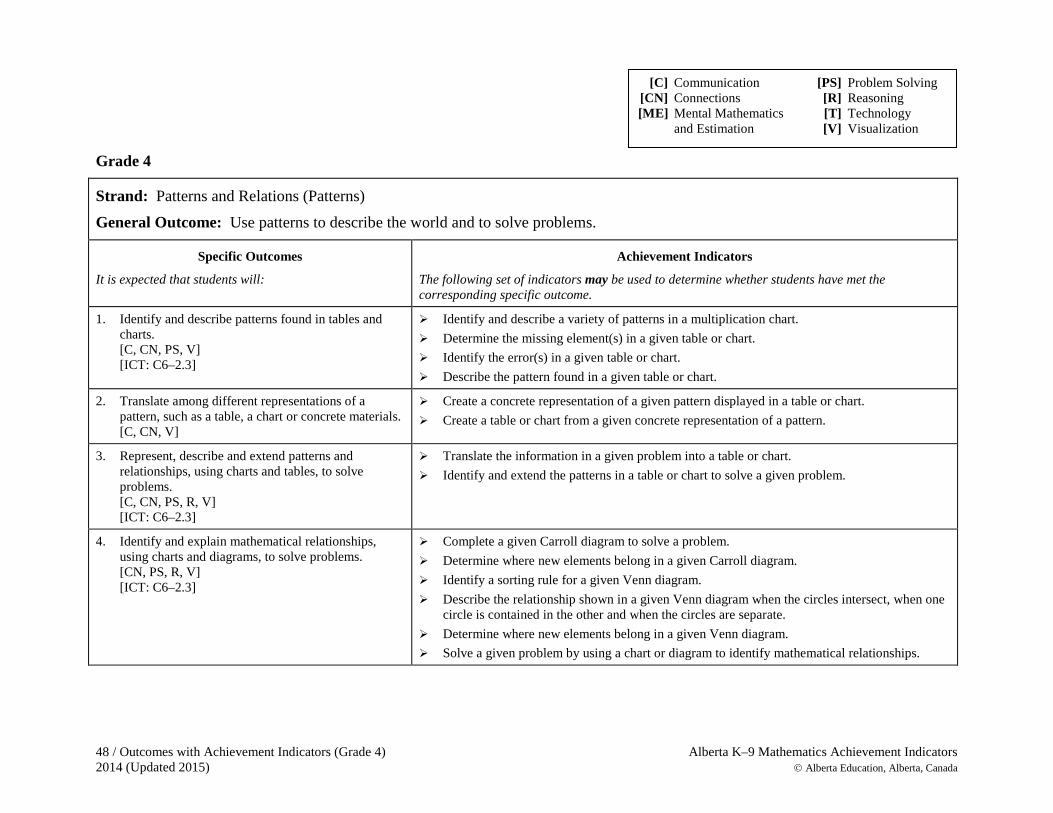
48 / Outcomes with Achievement Indicators (Grade 4) Alberta K–9 Mathematics Achievement Indicators 2014 (Updated 2015) Alberta Education, Alberta, Canada
Grade 4
Strand: Patterns and Relations (Patterns) General Outcome: Use patterns to describe the world and to solve problems.
Specific Outcomes
It is expected that students will:
Achievement Indicators
The following set of indicators may be used to determine whether students have met the corresponding specific outcome.
1. Identify and describe patterns found in tables and charts. [C, CN, PS, V] [ICT: C6–2.3]
Identify and describe a variety of patterns in a multiplication chart. Determine the missing element(s) in a given table or chart. Identify the error(s) in a given table or chart. Describe the pattern found in a given table or chart.
2. Translate among different representations of a pattern, such as a table, a chart or concrete materials. [C, CN, V]
Create a concrete representation of a given pattern displayed in a table or chart. Create a table or chart from a given concrete representation of a pattern.
3. Represent, describe and extend patterns and relationships, using charts and tables, to solve problems.
[C, CN, PS, R, V] [ICT: C6–2.3]
Translate the information in a given problem into a table or chart. Identify and extend the patterns in a table or chart to solve a given problem.
4. Identify and explain mathematical relationships, using charts and diagrams, to solve problems. [CN, PS, R, V] [ICT: C6–2.3]
Complete a given Carroll diagram to solve a problem. Determine where new elements belong in a given Carroll diagram. Identify a sorting rule for a given Venn diagram. Describe the relationship shown in a given Venn diagram when the circles intersect, when one
circle is contained in the other and when the circles are separate. Determine where new elements belong in a given Venn diagram. Solve a given problem by using a chart or diagram to identify mathematical relationships.
[C] Communication [PS] Problem Solving [CN] Connections [R] Reasoning [ME] Mental Mathematics [T] Technology and Estimation [V] Visualization
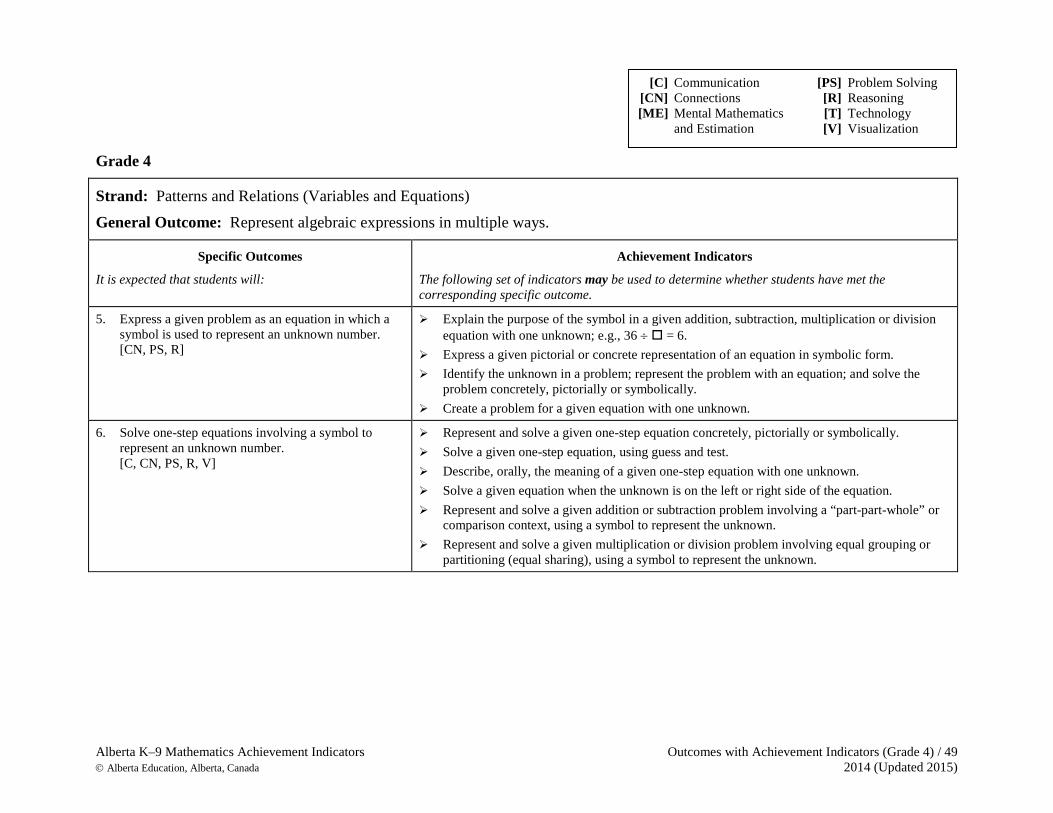
Alberta K–9 Mathematics Achievement Indicators Outcomes with Achievement Indicators (Grade 4) / 49 Alberta Education, Alberta, Canada 2014 (Updated 2015)
Grade 4
Strand: Patterns and Relations (Variables and Equations) General Outcome: Represent algebraic expressions in multiple ways.
Specific Outcomes
It is expected that students will:
Achievement Indicators
The following set of indicators may be used to determine whether students have met the corresponding specific outcome.
5. Express a given problem as an equation in which a symbol is used to represent an unknown number. [CN, PS, R]
Explain the purpose of the symbol in a given addition, subtraction, multiplication or division equation with one unknown; e.g., 36 ÷ = 6.
Express a given pictorial or concrete representation of an equation in symbolic form. Identify the unknown in a problem; represent the problem with an equation; and solve the
problem concretely, pictorially or symbolically. Create a problem for a given equation with one unknown.
6. Solve one-step equations involving a symbol to represent an unknown number. [C, CN, PS, R, V]
Represent and solve a given one-step equation concretely, pictorially or symbolically. Solve a given one-step equation, using guess and test. Describe, orally, the meaning of a given one-step equation with one unknown. Solve a given equation when the unknown is on the left or right side of the equation. Represent and solve a given addition or subtraction problem involving a “part-part-whole” or
comparison context, using a symbol to represent the unknown. Represent and solve a given multiplication or division problem involving equal grouping or
partitioning (equal sharing), using a symbol to represent the unknown.
[C] Communication [PS] Problem Solving [CN] Connections [R] Reasoning [ME] Mental Mathematics [T] Technology and Estimation [V] Visualization
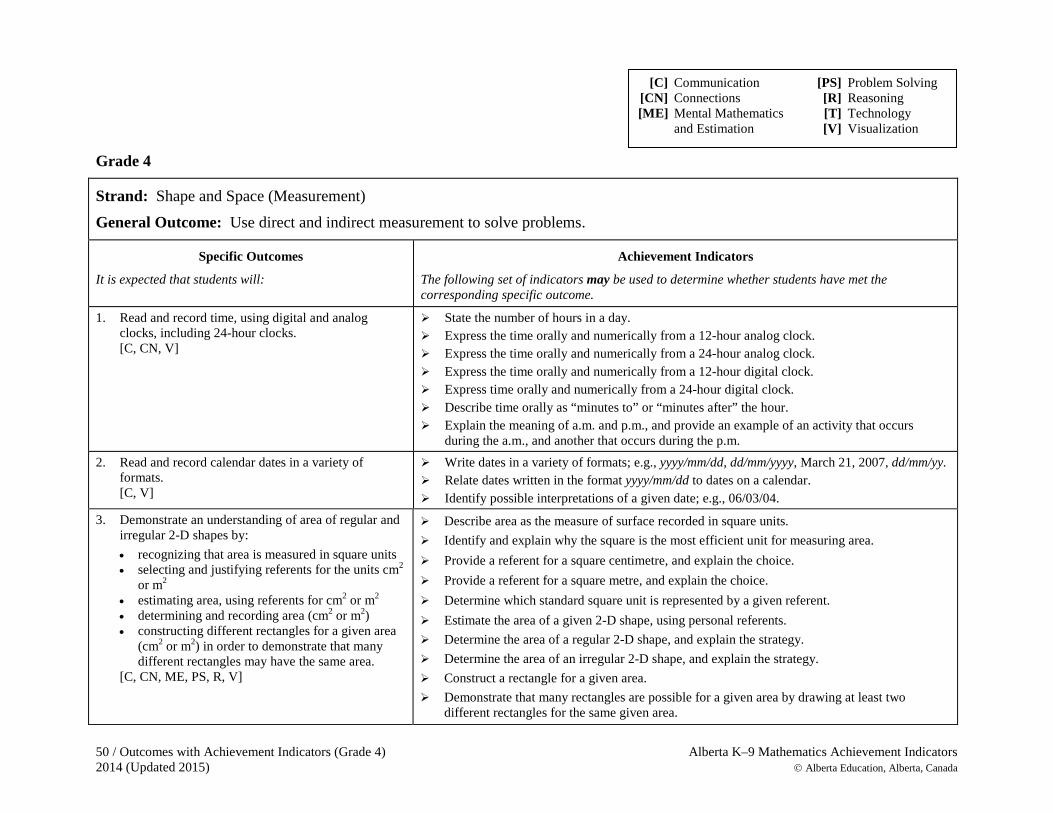
50 / Outcomes with Achievement Indicators (Grade 4) Alberta K–9 Mathematics Achievement Indicators 2014 (Updated 2015) Alberta Education, Alberta, Canada
Grade 4
Strand: Shape and Space (Measurement) General Outcome: Use direct and indirect measurement to solve problems.
Specific Outcomes
It is expected that students will:
Achievement Indicators
The following set of indicators may be used to determine whether students have met the corresponding specific outcome.
1. Read and record time, using digital and analog clocks, including 24-hour clocks. [C, CN, V]
State the number of hours in a day. Express the time orally and numerically from a 12-hour analog clock. Express the time orally and numerically from a 24-hour analog clock. Express the time orally and numerically from a 12-hour digital clock. Express time orally and numerically from a 24-hour digital clock. Describe time orally as “minutes to” or “minutes after” the hour. Explain the meaning of a.m. and p.m., and provide an example of an activity that occurs
during the a.m., and another that occurs during the p.m. 2. Read and record calendar dates in a variety of
formats. [C, V]
Write dates in a variety of formats; e.g., yyyy/mm/dd, dd/mm/yyyy, March 21, 2007, dd/mm/yy. Relate dates written in the format yyyy/mm/dd to dates on a calendar. Identify possible interpretations of a given date; e.g., 06/03/04.
3. Demonstrate an understanding of area of regular and irregular 2-D shapes by: • recognizing that area is measured in square units • selecting and justifying referents for the units cm2
or m2 • estimating area, using referents for cm2 or m2 • determining and recording area (cm2 or m2) • constructing different rectangles for a given area
(cm2 or m2) in order to demonstrate that many different rectangles may have the same area.
[C, CN, ME, PS, R, V]
Describe area as the measure of surface recorded in square units. Identify and explain why the square is the most efficient unit for measuring area. Provide a referent for a square centimetre, and explain the choice. Provide a referent for a square metre, and explain the choice. Determine which standard square unit is represented by a given referent. Estimate the area of a given 2-D shape, using personal referents. Determine the area of a regular 2-D shape, and explain the strategy. Determine the area of an irregular 2-D shape, and explain the strategy. Construct a rectangle for a given area. Demonstrate that many rectangles are possible for a given area by drawing at least two
different rectangles for the same given area.
[C] Communication [PS] Problem Solving [CN] Connections [R] Reasoning [ME] Mental Mathematics [T] Technology and Estimation [V] Visualization
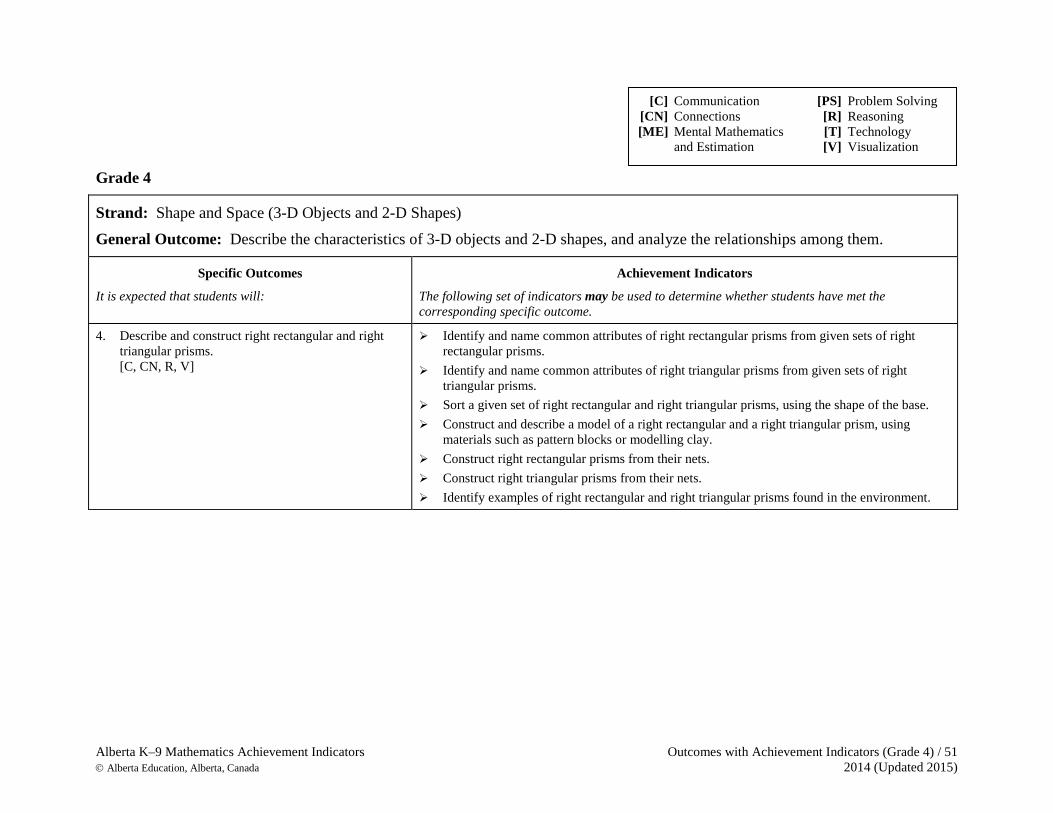
Alberta K–9 Mathematics Achievement Indicators Outcomes with Achievement Indicators (Grade 4) / 51 Alberta Education, Alberta, Canada 2014 (Updated 2015)
Grade 4
Strand: Shape and Space (3-D Objects and 2-D Shapes) General Outcome: Describe the characteristics of 3-D objects and 2-D shapes, and analyze the relationships among them.
Specific Outcomes
It is expected that students will:
Achievement Indicators
The following set of indicators may be used to determine whether students have met the corresponding specific outcome.
4. Describe and construct right rectangular and right triangular prisms. [C, CN, R, V]
Identify and name common attributes of right rectangular prisms from given sets of right rectangular prisms.
Identify and name common attributes of right triangular prisms from given sets of right triangular prisms.
Sort a given set of right rectangular and right triangular prisms, using the shape of the base. Construct and describe a model of a right rectangular and a right triangular prism, using
materials such as pattern blocks or modelling clay. Construct right rectangular prisms from their nets. Construct right triangular prisms from their nets. Identify examples of right rectangular and right triangular prisms found in the environment.
[C] Communication [PS] Problem Solving [CN] Connections [R] Reasoning [ME] Mental Mathematics [T] Technology and Estimation [V] Visualization
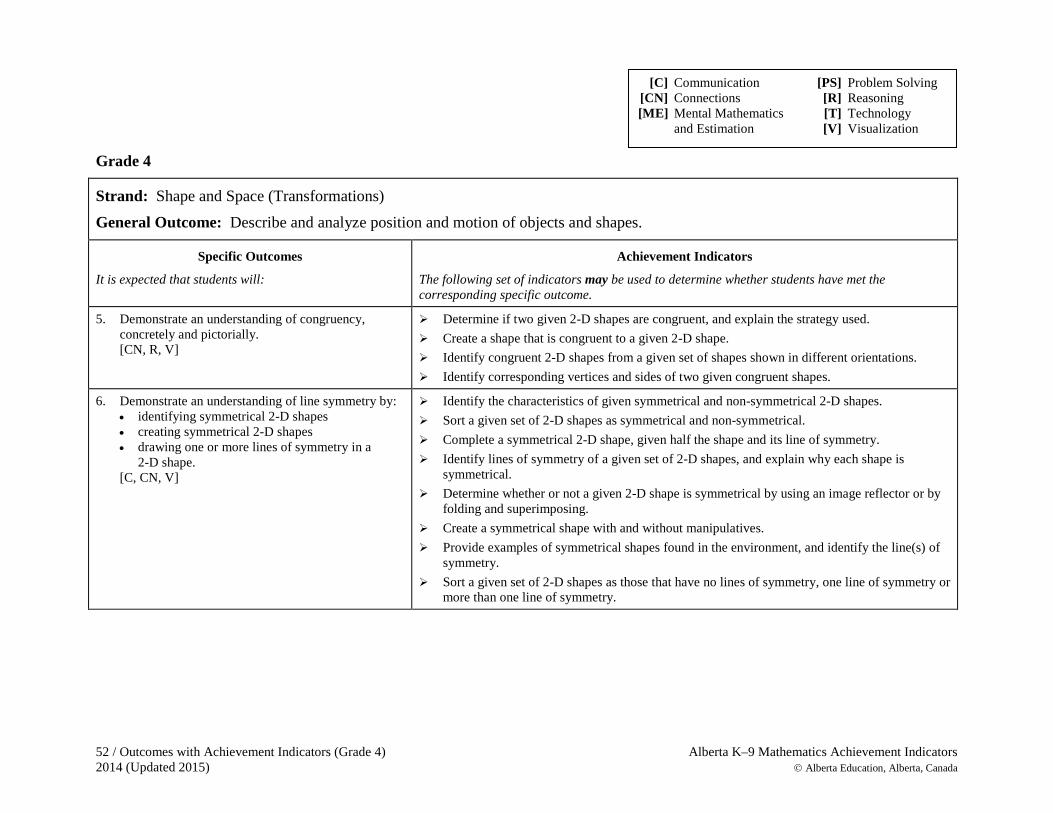
52 / Outcomes with Achievement Indicators (Grade 4) Alberta K–9 Mathematics Achievement Indicators 2014 (Updated 2015) Alberta Education, Alberta, Canada
Grade 4
Strand: Shape and Space (Transformations) General Outcome: Describe and analyze position and motion of objects and shapes.
Specific Outcomes
It is expected that students will:
Achievement Indicators
The following set of indicators may be used to determine whether students have met the corresponding specific outcome.
5. Demonstrate an understanding of congruency, concretely and pictorially. [CN, R, V]
Determine if two given 2-D shapes are congruent, and explain the strategy used. Create a shape that is congruent to a given 2-D shape. Identify congruent 2-D shapes from a given set of shapes shown in different orientations. Identify corresponding vertices and sides of two given congruent shapes.
6. Demonstrate an understanding of line symmetry by: • identifying symmetrical 2-D shapes • creating symmetrical 2-D shapes • drawing one or more lines of symmetry in a
2-D shape. [C, CN, V]
Identify the characteristics of given symmetrical and non-symmetrical 2-D shapes. Sort a given set of 2-D shapes as symmetrical and non-symmetrical. Complete a symmetrical 2-D shape, given half the shape and its line of symmetry. Identify lines of symmetry of a given set of 2-D shapes, and explain why each shape is
symmetrical. Determine whether or not a given 2-D shape is symmetrical by using an image reflector or by
folding and superimposing. Create a symmetrical shape with and without manipulatives. Provide examples of symmetrical shapes found in the environment, and identify the line(s) of
symmetry. Sort a given set of 2-D shapes as those that have no lines of symmetry, one line of symmetry or
more than one line of symmetry.
[C] Communication [PS] Problem Solving [CN] Connections [R] Reasoning [ME] Mental Mathematics [T] Technology and Estimation [V] Visualization
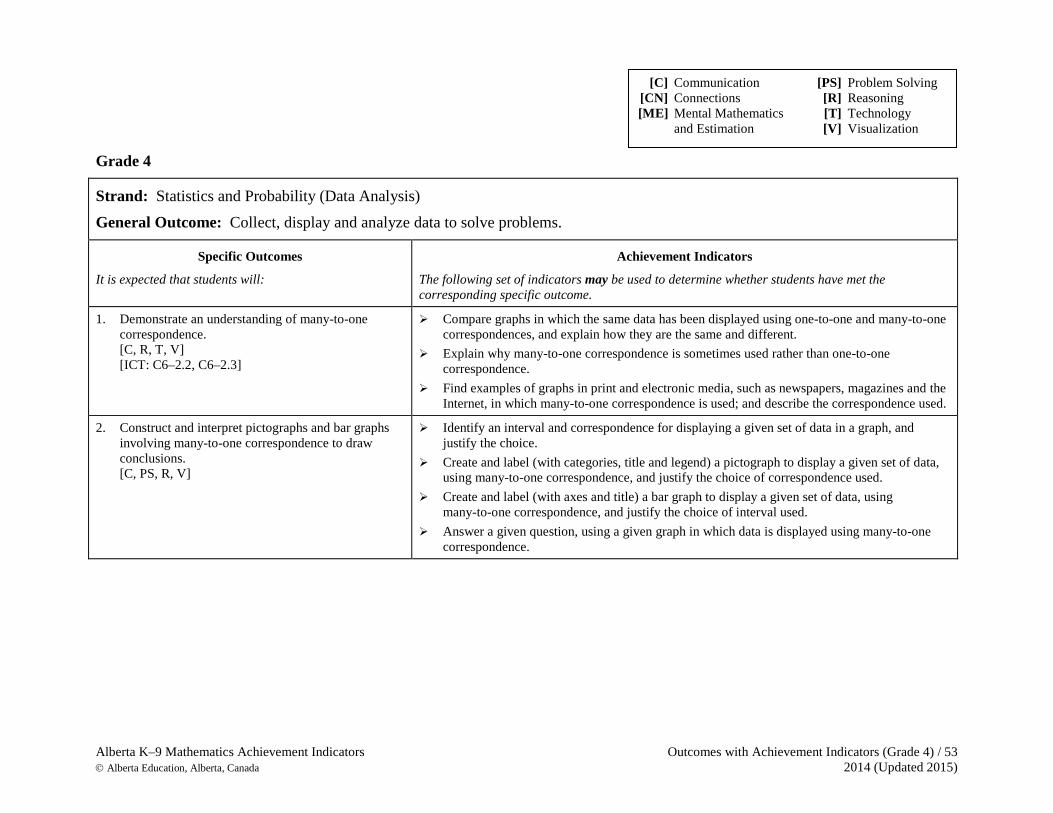
Alberta K–9 Mathematics Achievement Indicators Outcomes with Achievement Indicators (Grade 4) / 53 Alberta Education, Alberta, Canada 2014 (Updated 2015)
Grade 4
Strand: Statistics and Probability (Data Analysis) General Outcome: Collect, display and analyze data to solve problems.
Specific Outcomes
It is expected that students will:
Achievement Indicators
The following set of indicators may be used to determine whether students have met the corresponding specific outcome.
1. Demonstrate an understanding of many-to-one correspondence. [C, R, T, V] [ICT: C6–2.2, C6–2.3]
Compare graphs in which the same data has been displayed using one-to-one and many-to-one correspondences, and explain how they are the same and different.
Explain why many-to-one correspondence is sometimes used rather than one-to-one correspondence.
Find examples of graphs in print and electronic media, such as newspapers, magazines and the Internet, in which many-to-one correspondence is used; and describe the correspondence used.
2. Construct and interpret pictographs and bar graphs involving many-to-one correspondence to draw conclusions. [C, PS, R, V]
Identify an interval and correspondence for displaying a given set of data in a graph, and justify the choice.
Create and label (with categories, title and legend) a pictograph to display a given set of data, using many-to-one correspondence, and justify the choice of correspondence used.
Create and label (with axes and title) a bar graph to display a given set of data, using many-to-one correspondence, and justify the choice of interval used.
Answer a given question, using a given graph in which data is displayed using many-to-one correspondence.
[C] Communication [PS] Problem Solving [CN] Connections [R] Reasoning [ME] Mental Mathematics [T] Technology and Estimation [V] Visualization

54 / Outcomes with Achievement Indicators (Grade 5) Alberta K–9 Mathematics Achievement Indicators 2014 (Updated 2015) Alberta Education, Alberta, Canada
Grade 5
Strand: Number General Outcome: Develop number sense.
Specific Outcomes
It is expected that students will:
Achievement Indicators
The following set of indicators may be used to determine whether students have met the corresponding specific outcome.
1. Represent and describe whole numbers to 1 000 000. [C, CN, V, T] [ICT: C6–2.2]
Write a given numeral, using proper spacing without commas; e.g., 934 567. Describe the pattern of adjacent place positions moving from right to left. Describe the meaning of each digit in a given numeral. Provide examples of large numbers used in print or electronic media. Express a given numeral in expanded notation; e.g., 45 321 = (4 × 10 000) + (5 × 1000) +
(3 × 100) + (2 × 10) + (1 × 1) or 40 000 + 5000 + 300 + 20 + 1. Write the numeral represented by a given expanded notation.
2. Use estimation strategies, such as: • front-end rounding • compensation • compatible numbers in problem-solving contexts. [C, CN, ME, PS, R, V]
Provide a context for when estimation is used to: • make predictions • check the reasonableness of an answer • determine approximate answers.
Describe contexts in which overestimating is important. Determine the approximate solution to a given problem not requiring an exact answer. Estimate a sum or product, using compatible numbers. Estimate the solution to a given problem, using compensation, and explain the reason for
compensation. Select and use an estimation strategy for a given problem. Apply front-end rounding to estimate:
• sums; e.g., 253 + 615 is more than 200 + 600 = 800 • differences; e.g., 974 – 250 is close to 900 – 200 = 700 • products; e.g., the product of 23 × 24 is greater than 20 × 20 (400) and less than
25 × 25 (625) • quotients; e.g., the quotient of 831 ÷ 4 is greater than 800 ÷ 4 (200).
[C] Communication [PS] Problem Solving [CN] Connections [R] Reasoning [ME] Mental Mathematics [T] Technology and Estimation [V] Visualization
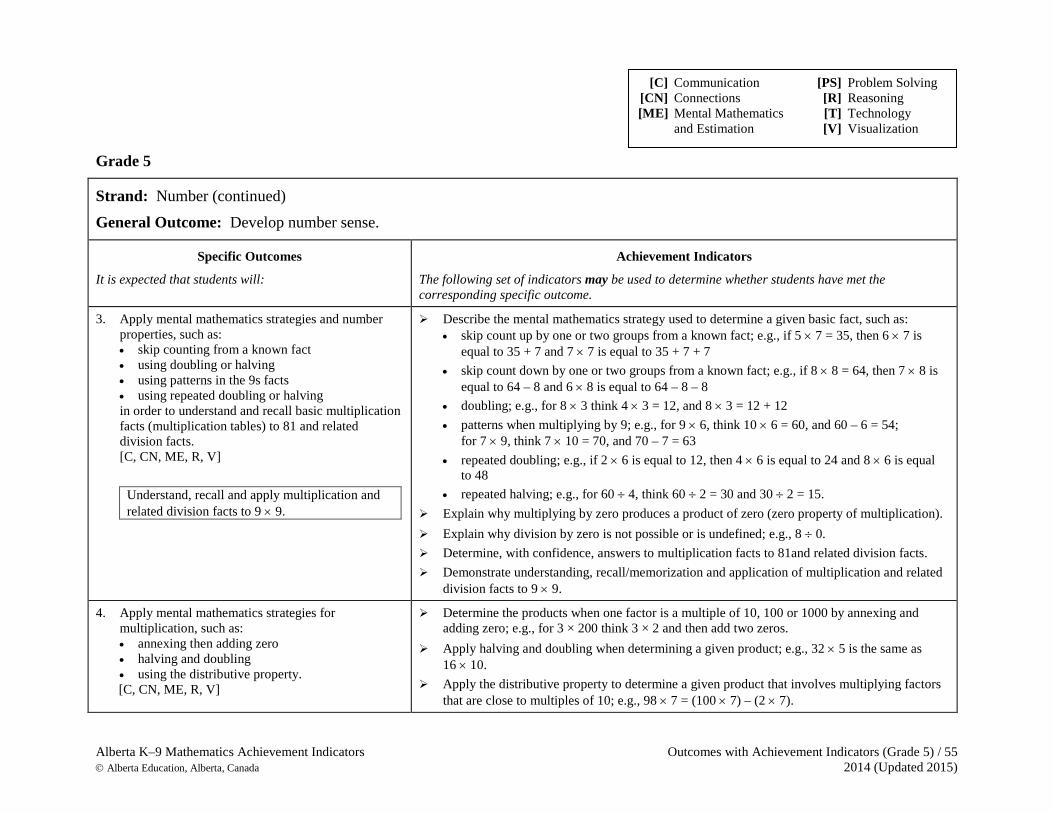
Alberta K–9 Mathematics Achievement Indicators Outcomes with Achievement Indicators (Grade 5) / 55 Alberta Education, Alberta, Canada 2014 (Updated 2015)
Grade 5
Strand: Number (continued) General Outcome: Develop number sense.
Specific Outcomes
It is expected that students will:
Achievement Indicators
The following set of indicators may be used to determine whether students have met the corresponding specific outcome.
3. Apply mental mathematics strategies and number properties, such as: • skip counting from a known fact • using doubling or halving • using patterns in the 9s facts • using repeated doubling or halving in order to understand and recall basic multiplication facts (multiplication tables) to 81 and related division facts. [C, CN, ME, R, V]
Understand, recall and apply multiplication and related division facts to 9 × 9.
Describe the mental mathematics strategy used to determine a given basic fact, such as: • skip count up by one or two groups from a known fact; e.g., if 5 × 7 = 35, then 6 × 7 is
equal to 35 + 7 and 7 × 7 is equal to 35 + 7 + 7 • skip count down by one or two groups from a known fact; e.g., if 8 × 8 = 64, then 7 × 8 is
equal to 64 – 8 and 6 × 8 is equal to 64 – 8 – 8 • doubling; e.g., for 8 × 3 think 4 × 3 = 12, and 8 × 3 = 12 + 12 • patterns when multiplying by 9; e.g., for 9 × 6, think 10 × 6 = 60, and 60 – 6 = 54;
for 7 × 9, think 7 × 10 = 70, and 70 – 7 = 63 • repeated doubling; e.g., if 2 × 6 is equal to 12, then 4 × 6 is equal to 24 and 8 × 6 is equal
to 48 • repeated halving; e.g., for 60 ÷ 4, think 60 ÷ 2 = 30 and 30 ÷ 2 = 15.
Explain why multiplying by zero produces a product of zero (zero property of multiplication). Explain why division by zero is not possible or is undefined; e.g., 8 ÷ 0. Determine, with confidence, answers to multiplication facts to 81and related division facts. Demonstrate understanding, recall/memorization and application of multiplication and related
division facts to 9 × 9.
4. Apply mental mathematics strategies for multiplication, such as: • annexing then adding zero • halving and doubling • using the distributive property. [C, CN, ME, R, V]
Determine the products when one factor is a multiple of 10, 100 or 1000 by annexing and adding zero; e.g., for 3 × 200 think 3 × 2 and then add two zeros.
Apply halving and doubling when determining a given product; e.g., 32 × 5 is the same as 16 × 10.
Apply the distributive property to determine a given product that involves multiplying factors that are close to multiples of 10; e.g., 98 × 7 = (100 × 7) – (2 × 7).
[C] Communication [PS] Problem Solving [CN] Connections [R] Reasoning [ME] Mental Mathematics [T] Technology and Estimation [V] Visualization
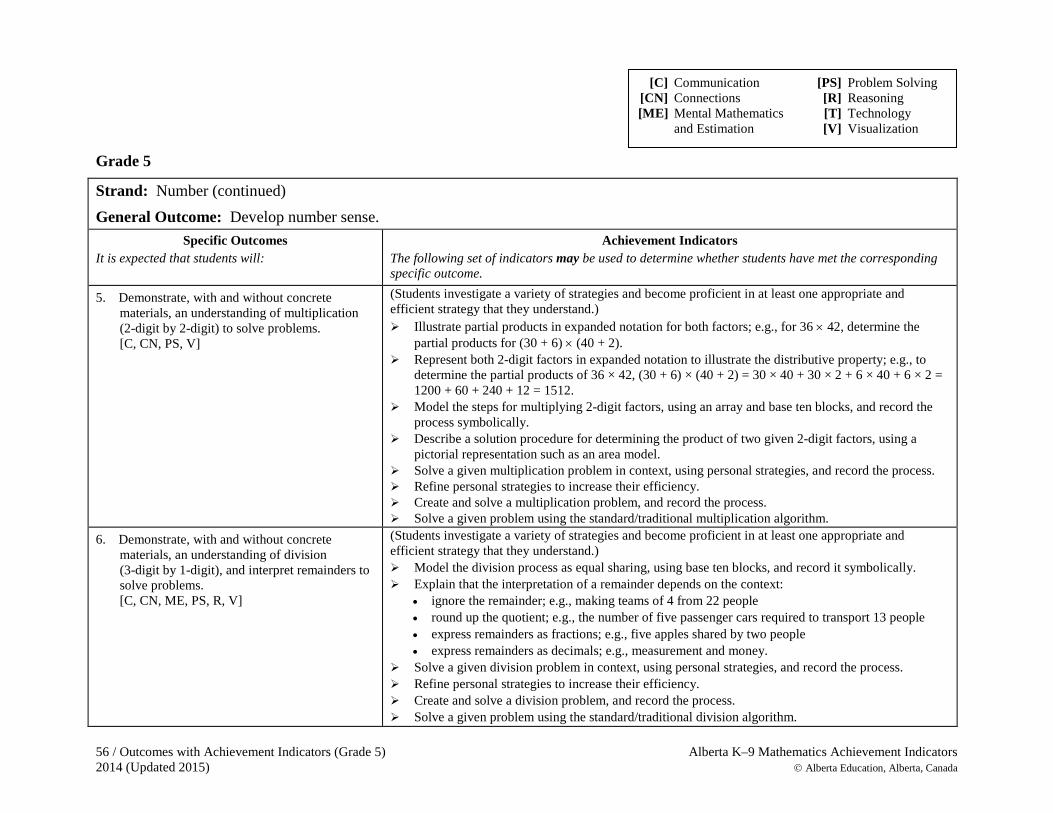
56 / Outcomes with Achievement Indicators (Grade 5) Alberta K–9 Mathematics Achievement Indicators 2014 (Updated 2015) Alberta Education, Alberta, Canada
Grade 5
Strand: Number (continued) General Outcome: Develop number sense.
Specific Outcomes It is expected that students will:
Achievement Indicators The following set of indicators may be used to determine whether students have met the corresponding specific outcome.
5. Demonstrate, with and without concrete materials, an understanding of multiplication (2-digit by 2-digit) to solve problems. [C, CN, PS, V]
(Students investigate a variety of strategies and become proficient in at least one appropriate and efficient strategy that they understand.) Illustrate partial products in expanded notation for both factors; e.g., for 36 × 42, determine the
partial products for (30 + 6) × (40 + 2). Represent both 2-digit factors in expanded notation to illustrate the distributive property; e.g., to
determine the partial products of 36 × 42, (30 + 6) × (40 + 2) = 30 × 40 + 30 × 2 + 6 × 40 + 6 × 2 = 1200 + 60 + 240 + 12 = 1512.
Model the steps for multiplying 2-digit factors, using an array and base ten blocks, and record the process symbolically.
Describe a solution procedure for determining the product of two given 2-digit factors, using a pictorial representation such as an area model.
Solve a given multiplication problem in context, using personal strategies, and record the process. Refine personal strategies to increase their efficiency. Create and solve a multiplication problem, and record the process. Solve a given problem using the standard/traditional multiplication algorithm.
6. Demonstrate, with and without concrete materials, an understanding of division (3-digit by 1-digit), and interpret remainders to solve problems. [C, CN, ME, PS, R, V]
(Students investigate a variety of strategies and become proficient in at least one appropriate and efficient strategy that they understand.) Model the division process as equal sharing, using base ten blocks, and record it symbolically. Explain that the interpretation of a remainder depends on the context:
• ignore the remainder; e.g., making teams of 4 from 22 people • round up the quotient; e.g., the number of five passenger cars required to transport 13 people • express remainders as fractions; e.g., five apples shared by two people • express remainders as decimals; e.g., measurement and money.
Solve a given division problem in context, using personal strategies, and record the process. Refine personal strategies to increase their efficiency. Create and solve a division problem, and record the process. Solve a given problem using the standard/traditional division algorithm.
[C] Communication [PS] Problem Solving [CN] Connections [R] Reasoning [ME] Mental Mathematics [T] Technology and Estimation [V] Visualization
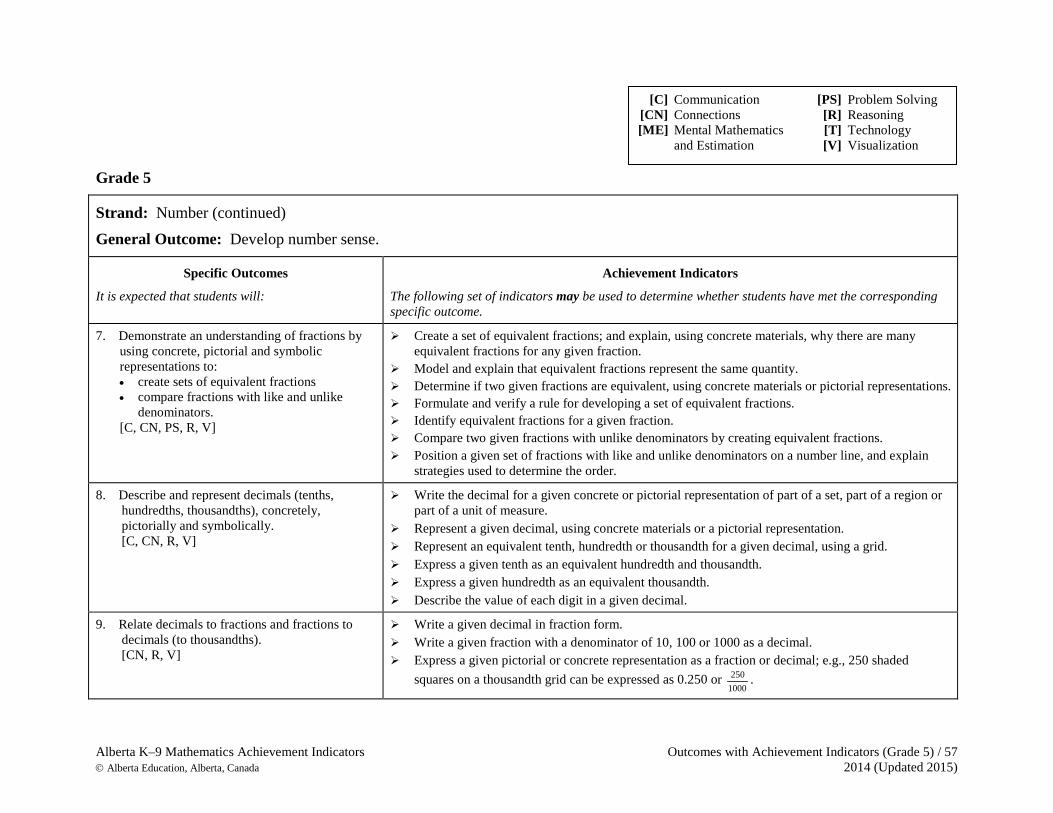
Alberta K–9 Mathematics Achievement Indicators Outcomes with Achievement Indicators (Grade 5) / 57 Alberta Education, Alberta, Canada 2014 (Updated 2015)
Grade 5
Strand: Number (continued) General Outcome: Develop number sense.
Specific Outcomes
It is expected that students will:
Achievement Indicators
The following set of indicators may be used to determine whether students have met the corresponding specific outcome.
7. Demonstrate an understanding of fractions by using concrete, pictorial and symbolic representations to: • create sets of equivalent fractions • compare fractions with like and unlike
denominators. [C, CN, PS, R, V]
Create a set of equivalent fractions; and explain, using concrete materials, why there are many equivalent fractions for any given fraction.
Model and explain that equivalent fractions represent the same quantity. Determine if two given fractions are equivalent, using concrete materials or pictorial representations. Formulate and verify a rule for developing a set of equivalent fractions. Identify equivalent fractions for a given fraction. Compare two given fractions with unlike denominators by creating equivalent fractions. Position a given set of fractions with like and unlike denominators on a number line, and explain
strategies used to determine the order.
8. Describe and represent decimals (tenths, hundredths, thousandths), concretely, pictorially and symbolically. [C, CN, R, V]
Write the decimal for a given concrete or pictorial representation of part of a set, part of a region or part of a unit of measure.
Represent a given decimal, using concrete materials or a pictorial representation. Represent an equivalent tenth, hundredth or thousandth for a given decimal, using a grid. Express a given tenth as an equivalent hundredth and thousandth. Express a given hundredth as an equivalent thousandth. Describe the value of each digit in a given decimal.
9. Relate decimals to fractions and fractions to decimals (to thousandths). [CN, R, V]
Write a given decimal in fraction form. Write a given fraction with a denominator of 10, 100 or 1000 as a decimal. Express a given pictorial or concrete representation as a fraction or decimal; e.g., 250 shaded
squares on a thousandth grid can be expressed as 0.250 or 1000250 .
[C] Communication [PS] Problem Solving [CN] Connections [R] Reasoning [ME] Mental Mathematics [T] Technology and Estimation [V] Visualization
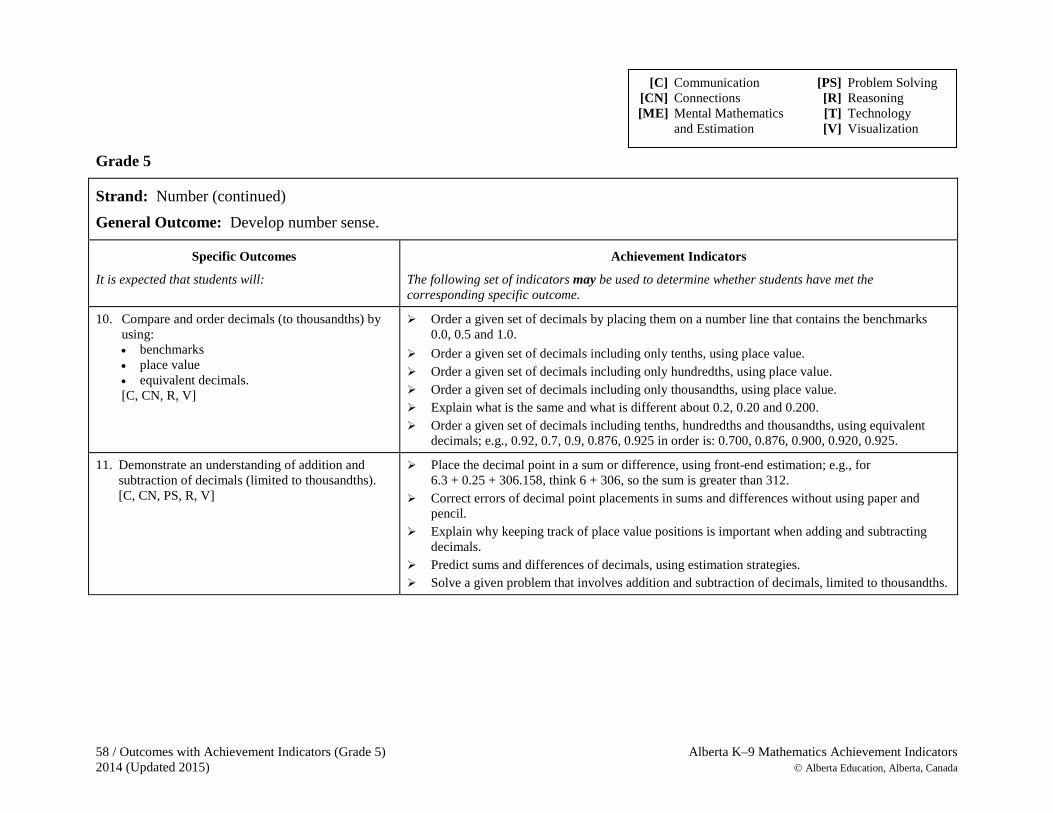
58 / Outcomes with Achievement Indicators (Grade 5) Alberta K–9 Mathematics Achievement Indicators 2014 (Updated 2015) Alberta Education, Alberta, Canada
Grade 5
Strand: Number (continued) General Outcome: Develop number sense.
Specific Outcomes
It is expected that students will:
Achievement Indicators
The following set of indicators may be used to determine whether students have met the corresponding specific outcome.
10. Compare and order decimals (to thousandths) by using: • benchmarks • place value • equivalent decimals. [C, CN, R, V]
Order a given set of decimals by placing them on a number line that contains the benchmarks 0.0, 0.5 and 1.0.
Order a given set of decimals including only tenths, using place value. Order a given set of decimals including only hundredths, using place value. Order a given set of decimals including only thousandths, using place value. Explain what is the same and what is different about 0.2, 0.20 and 0.200. Order a given set of decimals including tenths, hundredths and thousandths, using equivalent
decimals; e.g., 0.92, 0.7, 0.9, 0.876, 0.925 in order is: 0.700, 0.876, 0.900, 0.920, 0.925.
11. Demonstrate an understanding of addition and subtraction of decimals (limited to thousandths). [C, CN, PS, R, V]
Place the decimal point in a sum or difference, using front-end estimation; e.g., for 6.3 + 0.25 + 306.158, think 6 + 306, so the sum is greater than 312.
Correct errors of decimal point placements in sums and differences without using paper and pencil.
Explain why keeping track of place value positions is important when adding and subtracting decimals.
Predict sums and differences of decimals, using estimation strategies. Solve a given problem that involves addition and subtraction of decimals, limited to thousandths.
[C] Communication [PS] Problem Solving [CN] Connections [R] Reasoning [ME] Mental Mathematics [T] Technology and Estimation [V] Visualization
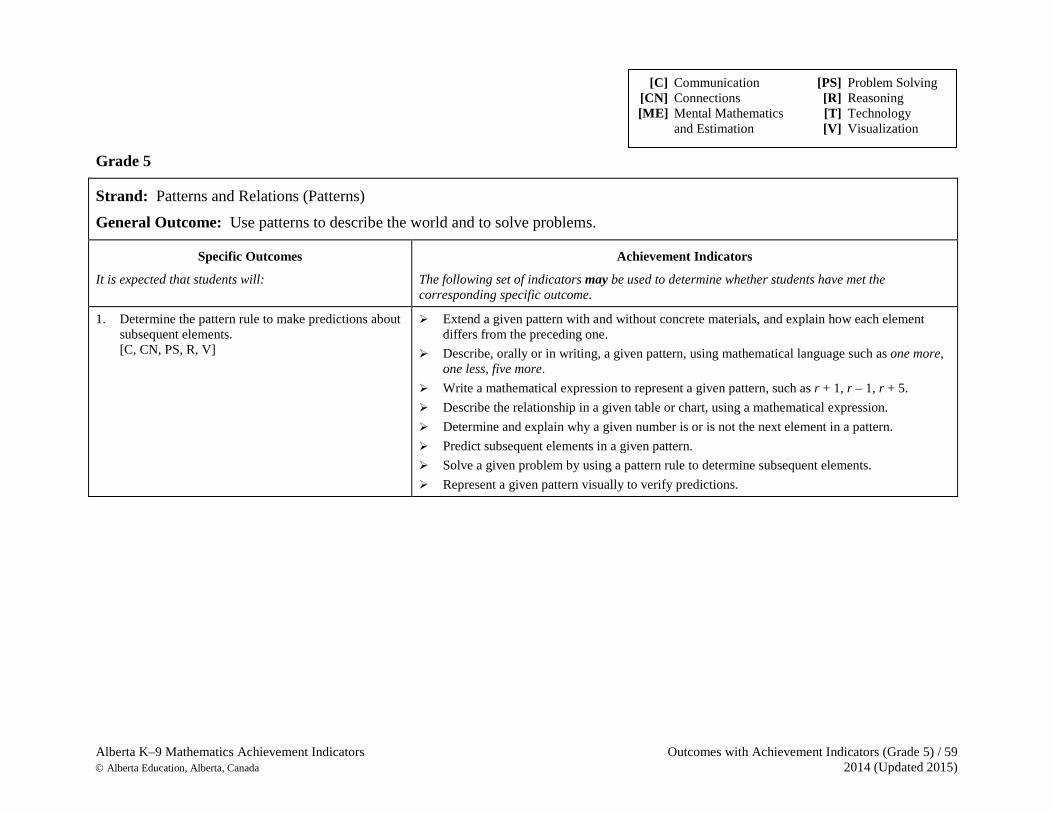
Alberta K–9 Mathematics Achievement Indicators Outcomes with Achievement Indicators (Grade 5) / 59 Alberta Education, Alberta, Canada 2014 (Updated 2015)
Grade 5
Strand: Patterns and Relations (Patterns) General Outcome: Use patterns to describe the world and to solve problems.
Specific Outcomes
It is expected that students will:
Achievement Indicators
The following set of indicators may be used to determine whether students have met the corresponding specific outcome.
1. Determine the pattern rule to make predictions about subsequent elements. [C, CN, PS, R, V]
Extend a given pattern with and without concrete materials, and explain how each element differs from the preceding one.
Describe, orally or in writing, a given pattern, using mathematical language such as one more, one less, five more.
Write a mathematical expression to represent a given pattern, such as r + 1, r – 1, r + 5. Describe the relationship in a given table or chart, using a mathematical expression. Determine and explain why a given number is or is not the next element in a pattern. Predict subsequent elements in a given pattern. Solve a given problem by using a pattern rule to determine subsequent elements. Represent a given pattern visually to verify predictions.
[C] Communication [PS] Problem Solving [CN] Connections [R] Reasoning [ME] Mental Mathematics [T] Technology and Estimation [V] Visualization
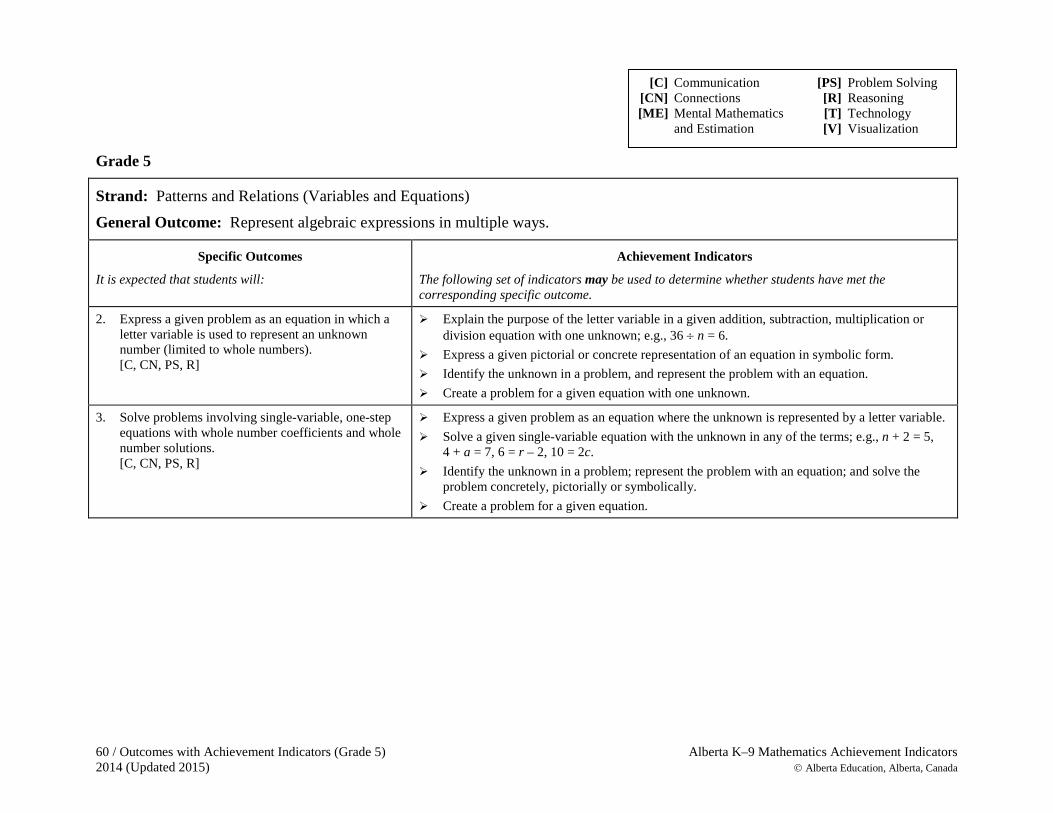
60 / Outcomes with Achievement Indicators (Grade 5) Alberta K–9 Mathematics Achievement Indicators 2014 (Updated 2015) Alberta Education, Alberta, Canada
Grade 5
Strand: Patterns and Relations (Variables and Equations) General Outcome: Represent algebraic expressions in multiple ways.
Specific Outcomes
It is expected that students will:
Achievement Indicators
The following set of indicators may be used to determine whether students have met the corresponding specific outcome.
2. Express a given problem as an equation in which a letter variable is used to represent an unknown number (limited to whole numbers). [C, CN, PS, R]
Explain the purpose of the letter variable in a given addition, subtraction, multiplication or division equation with one unknown; e.g., 36 ÷ n = 6.
Express a given pictorial or concrete representation of an equation in symbolic form. Identify the unknown in a problem, and represent the problem with an equation. Create a problem for a given equation with one unknown.
3. Solve problems involving single-variable, one-step equations with whole number coefficients and whole number solutions. [C, CN, PS, R]
Express a given problem as an equation where the unknown is represented by a letter variable. Solve a given single-variable equation with the unknown in any of the terms; e.g., n + 2 = 5,
4 + a = 7, 6 = r – 2, 10 = 2c. Identify the unknown in a problem; represent the problem with an equation; and solve the
problem concretely, pictorially or symbolically. Create a problem for a given equation.
[C] Communication [PS] Problem Solving [CN] Connections [R] Reasoning [ME] Mental Mathematics [T] Technology and Estimation [V] Visualization
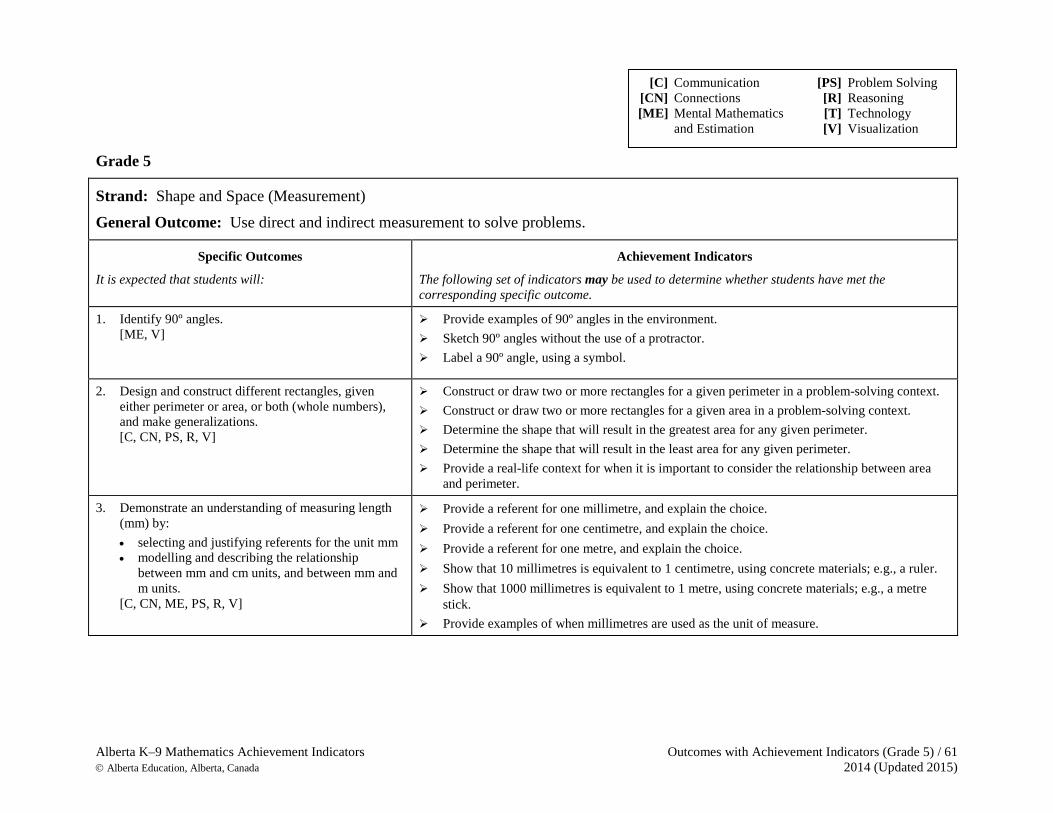
Alberta K–9 Mathematics Achievement Indicators Outcomes with Achievement Indicators (Grade 5) / 61 Alberta Education, Alberta, Canada 2014 (Updated 2015)
Grade 5
Strand: Shape and Space (Measurement) General Outcome: Use direct and indirect measurement to solve problems.
Specific Outcomes
It is expected that students will:
Achievement Indicators
The following set of indicators may be used to determine whether students have met the corresponding specific outcome.
1. Identify 90º angles. [ME, V]
Provide examples of 90º angles in the environment. Sketch 90º angles without the use of a protractor. Label a 90º angle, using a symbol.
2. Design and construct different rectangles, given either perimeter or area, or both (whole numbers), and make generalizations. [C, CN, PS, R, V]
Construct or draw two or more rectangles for a given perimeter in a problem-solving context. Construct or draw two or more rectangles for a given area in a problem-solving context. Determine the shape that will result in the greatest area for any given perimeter. Determine the shape that will result in the least area for any given perimeter. Provide a real-life context for when it is important to consider the relationship between area
and perimeter.
3. Demonstrate an understanding of measuring length (mm) by: • selecting and justifying referents for the unit mm • modelling and describing the relationship
between mm and cm units, and between mm and m units.
[C, CN, ME, PS, R, V]
Provide a referent for one millimetre, and explain the choice. Provide a referent for one centimetre, and explain the choice. Provide a referent for one metre, and explain the choice. Show that 10 millimetres is equivalent to 1 centimetre, using concrete materials; e.g., a ruler. Show that 1000 millimetres is equivalent to 1 metre, using concrete materials; e.g., a metre
stick. Provide examples of when millimetres are used as the unit of measure.
[C] Communication [PS] Problem Solving [CN] Connections [R] Reasoning [ME] Mental Mathematics [T] Technology and Estimation [V] Visualization
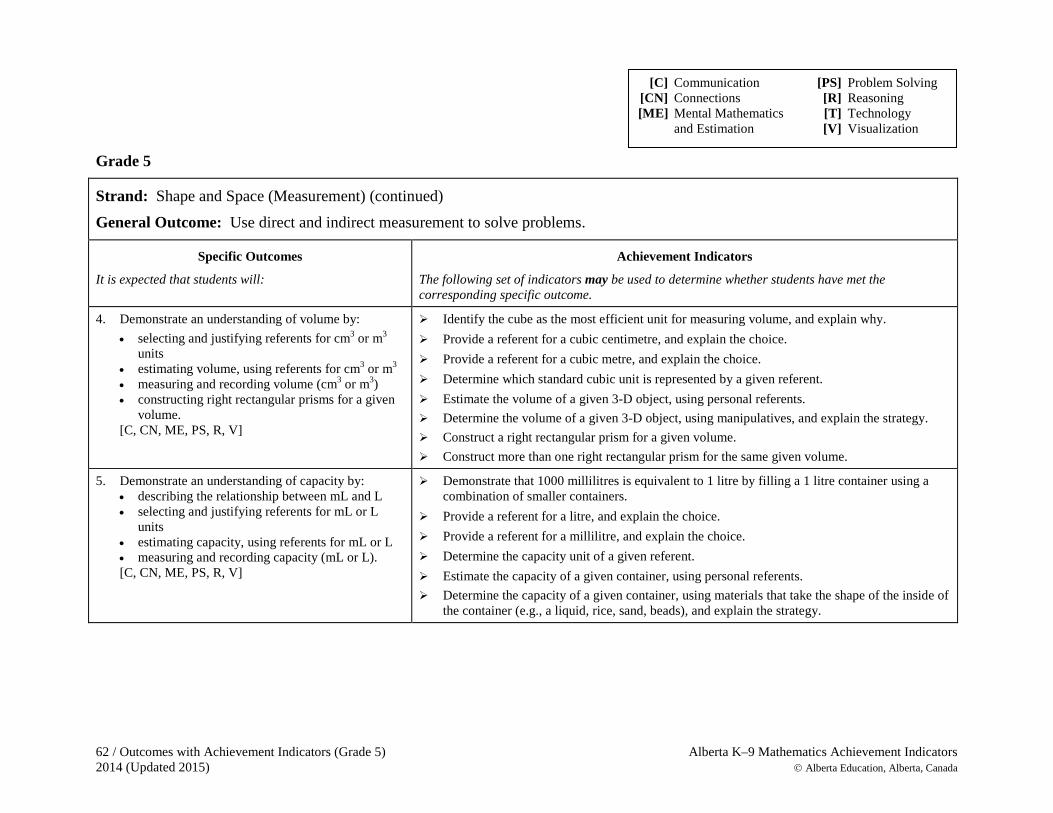
62 / Outcomes with Achievement Indicators (Grade 5) Alberta K–9 Mathematics Achievement Indicators 2014 (Updated 2015) Alberta Education, Alberta, Canada
Grade 5
Strand: Shape and Space (Measurement) (continued) General Outcome: Use direct and indirect measurement to solve problems.
Specific Outcomes
It is expected that students will:
Achievement Indicators
The following set of indicators may be used to determine whether students have met the corresponding specific outcome.
4. Demonstrate an understanding of volume by: • selecting and justifying referents for cm3 or m3
units • estimating volume, using referents for cm3 or m3 • measuring and recording volume (cm3 or m3) • constructing right rectangular prisms for a given
volume. [C, CN, ME, PS, R, V]
Identify the cube as the most efficient unit for measuring volume, and explain why. Provide a referent for a cubic centimetre, and explain the choice. Provide a referent for a cubic metre, and explain the choice. Determine which standard cubic unit is represented by a given referent. Estimate the volume of a given 3-D object, using personal referents. Determine the volume of a given 3-D object, using manipulatives, and explain the strategy. Construct a right rectangular prism for a given volume. Construct more than one right rectangular prism for the same given volume.
5. Demonstrate an understanding of capacity by: • describing the relationship between mL and L • selecting and justifying referents for mL or L
units • estimating capacity, using referents for mL or L • measuring and recording capacity (mL or L). [C, CN, ME, PS, R, V]
Demonstrate that 1000 millilitres is equivalent to 1 litre by filling a 1 litre container using a combination of smaller containers.
Provide a referent for a litre, and explain the choice. Provide a referent for a millilitre, and explain the choice. Determine the capacity unit of a given referent. Estimate the capacity of a given container, using personal referents. Determine the capacity of a given container, using materials that take the shape of the inside of
the container (e.g., a liquid, rice, sand, beads), and explain the strategy.
[C] Communication [PS] Problem Solving [CN] Connections [R] Reasoning [ME] Mental Mathematics [T] Technology and Estimation [V] Visualization
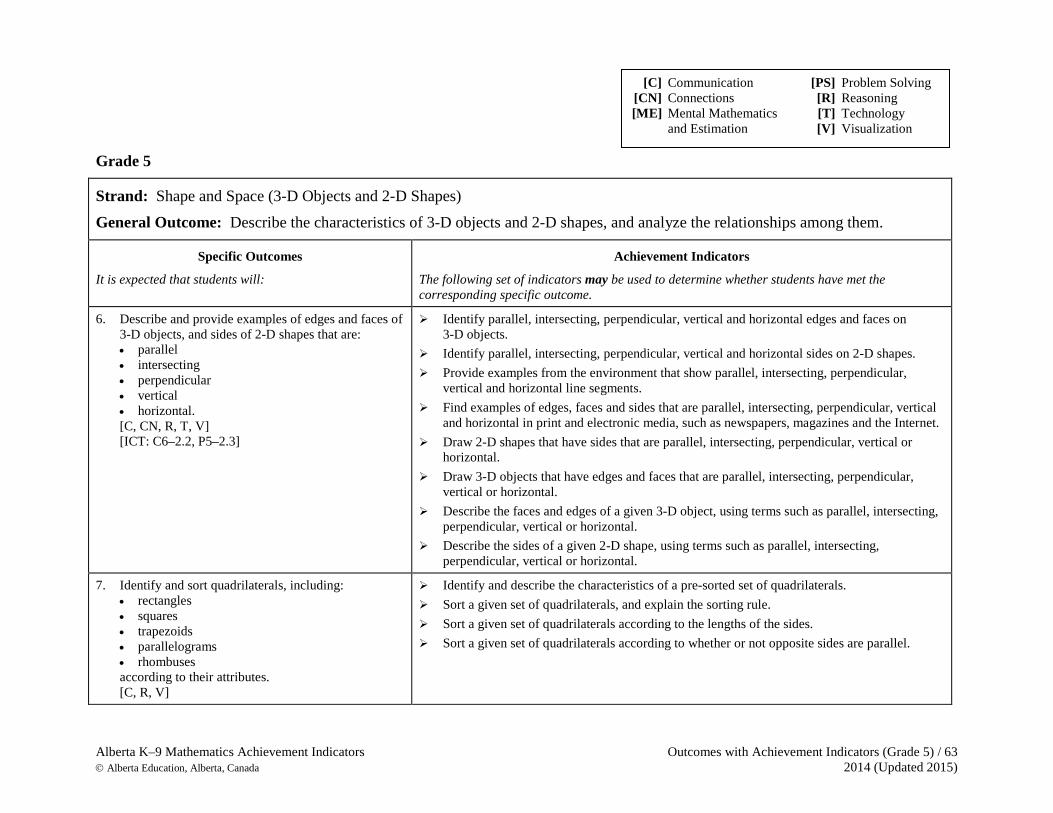
Alberta K–9 Mathematics Achievement Indicators Outcomes with Achievement Indicators (Grade 5) / 63 Alberta Education, Alberta, Canada 2014 (Updated 2015)
Grade 5
Strand: Shape and Space (3-D Objects and 2-D Shapes) General Outcome: Describe the characteristics of 3-D objects and 2-D shapes, and analyze the relationships among them.
Specific Outcomes
It is expected that students will:
Achievement Indicators
The following set of indicators may be used to determine whether students have met the corresponding specific outcome.
6. Describe and provide examples of edges and faces of 3-D objects, and sides of 2-D shapes that are: • parallel • intersecting • perpendicular • vertical • horizontal. [C, CN, R, T, V] [ICT: C6–2.2, P5–2.3]
Identify parallel, intersecting, perpendicular, vertical and horizontal edges and faces on 3-D objects.
Identify parallel, intersecting, perpendicular, vertical and horizontal sides on 2-D shapes. Provide examples from the environment that show parallel, intersecting, perpendicular,
vertical and horizontal line segments. Find examples of edges, faces and sides that are parallel, intersecting, perpendicular, vertical
and horizontal in print and electronic media, such as newspapers, magazines and the Internet. Draw 2-D shapes that have sides that are parallel, intersecting, perpendicular, vertical or
horizontal. Draw 3-D objects that have edges and faces that are parallel, intersecting, perpendicular,
vertical or horizontal. Describe the faces and edges of a given 3-D object, using terms such as parallel, intersecting,
perpendicular, vertical or horizontal. Describe the sides of a given 2-D shape, using terms such as parallel, intersecting,
perpendicular, vertical or horizontal.
7. Identify and sort quadrilaterals, including: • rectangles • squares • trapezoids • parallelograms • rhombuses according to their attributes. [C, R, V]
Identify and describe the characteristics of a pre-sorted set of quadrilaterals. Sort a given set of quadrilaterals, and explain the sorting rule. Sort a given set of quadrilaterals according to the lengths of the sides. Sort a given set of quadrilaterals according to whether or not opposite sides are parallel.
[C] Communication [PS] Problem Solving [CN] Connections [R] Reasoning [ME] Mental Mathematics [T] Technology and Estimation [V] Visualization
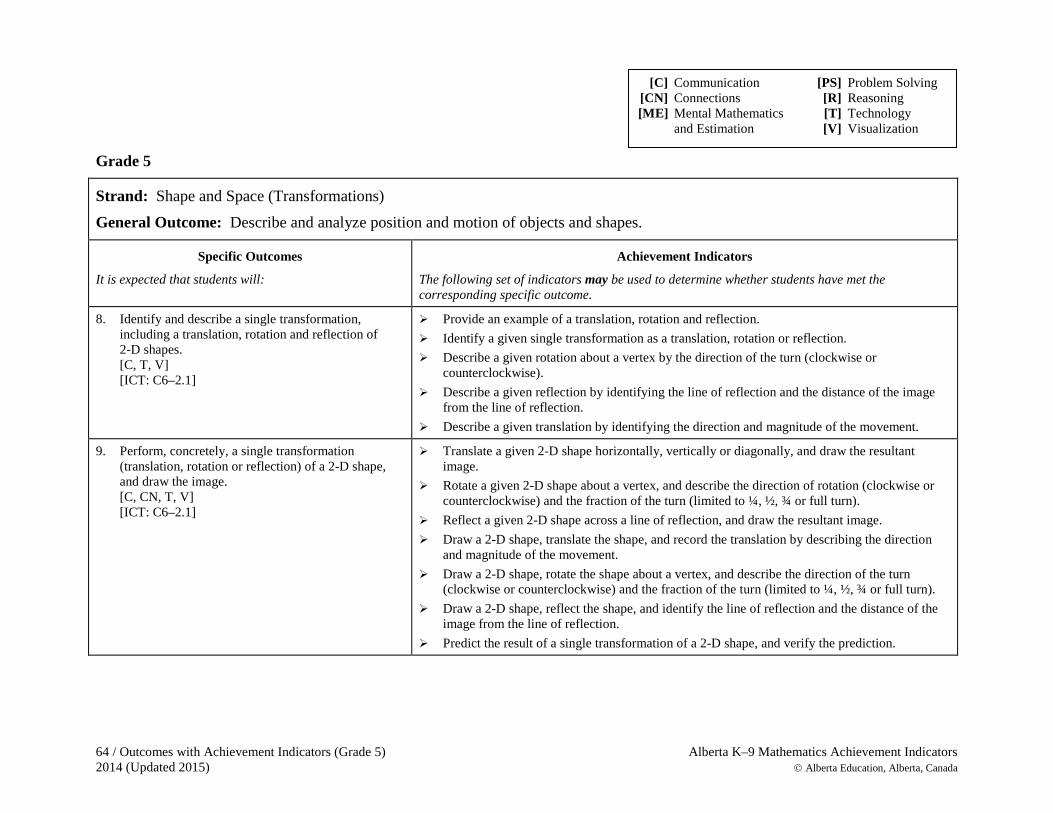
64 / Outcomes with Achievement Indicators (Grade 5) Alberta K–9 Mathematics Achievement Indicators 2014 (Updated 2015) Alberta Education, Alberta, Canada
Grade 5
Strand: Shape and Space (Transformations) General Outcome: Describe and analyze position and motion of objects and shapes.
Specific Outcomes
It is expected that students will:
Achievement Indicators
The following set of indicators may be used to determine whether students have met the corresponding specific outcome.
8. Identify and describe a single transformation, including a translation, rotation and reflection of 2-D shapes. [C, T, V] [ICT: C6–2.1]
Provide an example of a translation, rotation and reflection. Identify a given single transformation as a translation, rotation or reflection. Describe a given rotation about a vertex by the direction of the turn (clockwise or
counterclockwise). Describe a given reflection by identifying the line of reflection and the distance of the image
from the line of reflection. Describe a given translation by identifying the direction and magnitude of the movement.
9. Perform, concretely, a single transformation (translation, rotation or reflection) of a 2-D shape, and draw the image. [C, CN, T, V]
[ICT: C6–2.1]
Translate a given 2-D shape horizontally, vertically or diagonally, and draw the resultant image.
Rotate a given 2-D shape about a vertex, and describe the direction of rotation (clockwise or counterclockwise) and the fraction of the turn (limited to ¼, ½, ¾ or full turn).
Reflect a given 2-D shape across a line of reflection, and draw the resultant image. Draw a 2-D shape, translate the shape, and record the translation by describing the direction
and magnitude of the movement. Draw a 2-D shape, rotate the shape about a vertex, and describe the direction of the turn
(clockwise or counterclockwise) and the fraction of the turn (limited to ¼, ½, ¾ or full turn). Draw a 2-D shape, reflect the shape, and identify the line of reflection and the distance of the
image from the line of reflection. Predict the result of a single transformation of a 2-D shape, and verify the prediction.
[C] Communication [PS] Problem Solving [CN] Connections [R] Reasoning [ME] Mental Mathematics [T] Technology and Estimation [V] Visualization
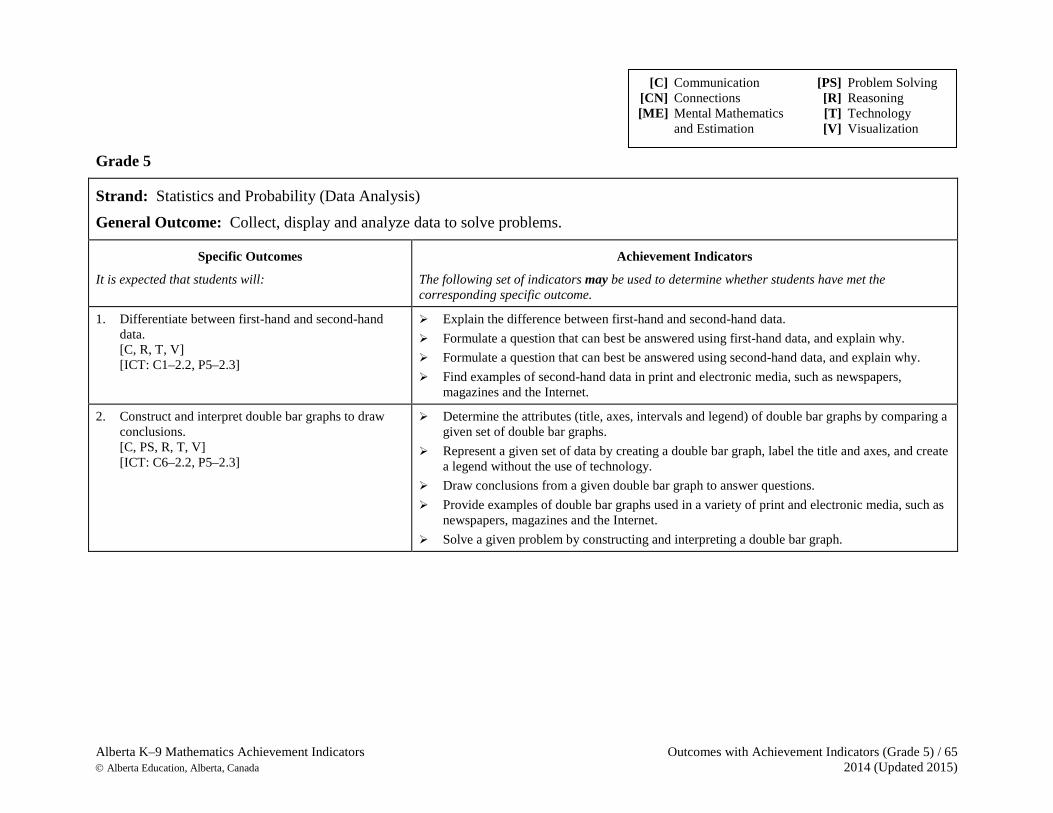
Alberta K–9 Mathematics Achievement Indicators Outcomes with Achievement Indicators (Grade 5) / 65 Alberta Education, Alberta, Canada 2014 (Updated 2015)
Grade 5
Strand: Statistics and Probability (Data Analysis) General Outcome: Collect, display and analyze data to solve problems.
Specific Outcomes
It is expected that students will:
Achievement Indicators
The following set of indicators may be used to determine whether students have met the corresponding specific outcome.
1. Differentiate between first-hand and second-hand data. [C, R, T, V] [ICT: C1–2.2, P5–2.3]
Explain the difference between first-hand and second-hand data. Formulate a question that can best be answered using first-hand data, and explain why. Formulate a question that can best be answered using second-hand data, and explain why. Find examples of second-hand data in print and electronic media, such as newspapers,
magazines and the Internet.
2. Construct and interpret double bar graphs to draw conclusions. [C, PS, R, T, V] [ICT: C6–2.2, P5–2.3]
Determine the attributes (title, axes, intervals and legend) of double bar graphs by comparing a given set of double bar graphs.
Represent a given set of data by creating a double bar graph, label the title and axes, and create a legend without the use of technology.
Draw conclusions from a given double bar graph to answer questions. Provide examples of double bar graphs used in a variety of print and electronic media, such as
newspapers, magazines and the Internet. Solve a given problem by constructing and interpreting a double bar graph.
[C] Communication [PS] Problem Solving [CN] Connections [R] Reasoning [ME] Mental Mathematics [T] Technology and Estimation [V] Visualization
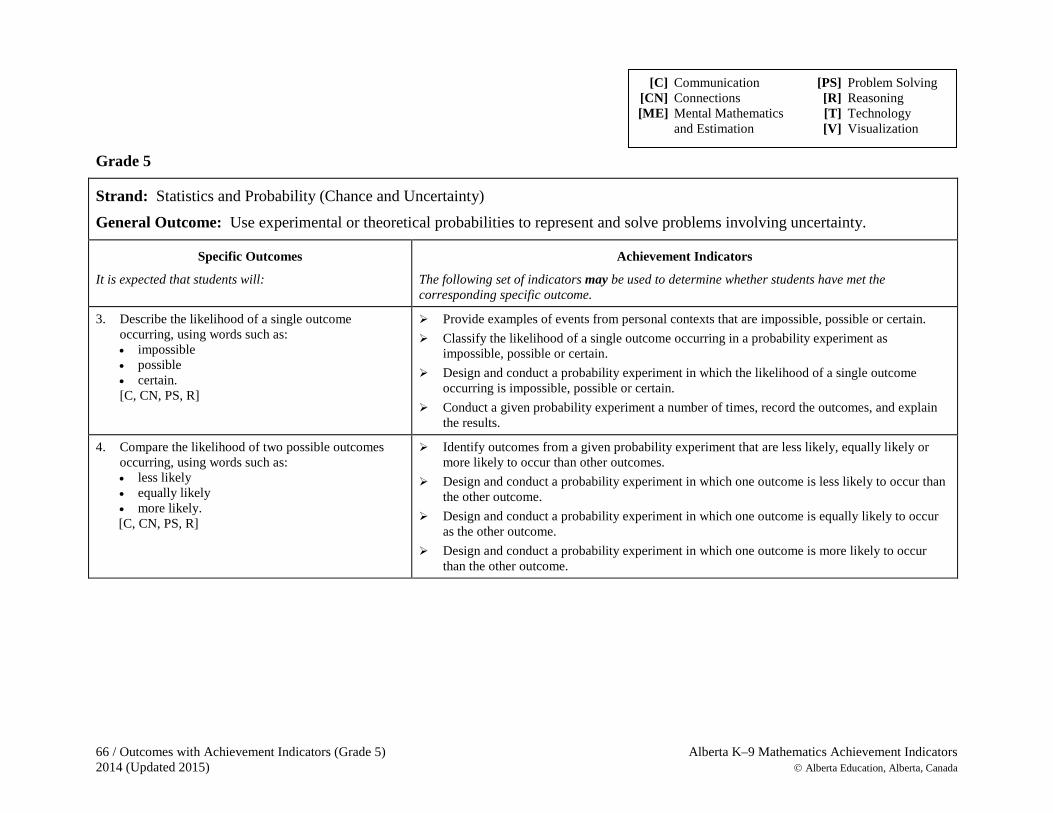
66 / Outcomes with Achievement Indicators (Grade 5) Alberta K–9 Mathematics Achievement Indicators 2014 (Updated 2015) Alberta Education, Alberta, Canada
Grade 5
Strand: Statistics and Probability (Chance and Uncertainty) General Outcome: Use experimental or theoretical probabilities to represent and solve problems involving uncertainty.
Specific Outcomes
It is expected that students will:
Achievement Indicators
The following set of indicators may be used to determine whether students have met the corresponding specific outcome.
3. Describe the likelihood of a single outcome occurring, using words such as: • impossible • possible • certain. [C, CN, PS, R]
Provide examples of events from personal contexts that are impossible, possible or certain. Classify the likelihood of a single outcome occurring in a probability experiment as
impossible, possible or certain. Design and conduct a probability experiment in which the likelihood of a single outcome
occurring is impossible, possible or certain. Conduct a given probability experiment a number of times, record the outcomes, and explain
the results.
4. Compare the likelihood of two possible outcomes occurring, using words such as: • less likely • equally likely • more likely. [C, CN, PS, R]
Identify outcomes from a given probability experiment that are less likely, equally likely or more likely to occur than other outcomes.
Design and conduct a probability experiment in which one outcome is less likely to occur than the other outcome.
Design and conduct a probability experiment in which one outcome is equally likely to occur as the other outcome.
Design and conduct a probability experiment in which one outcome is more likely to occur than the other outcome.
[C] Communication [PS] Problem Solving [CN] Connections [R] Reasoning [ME] Mental Mathematics [T] Technology and Estimation [V] Visualization
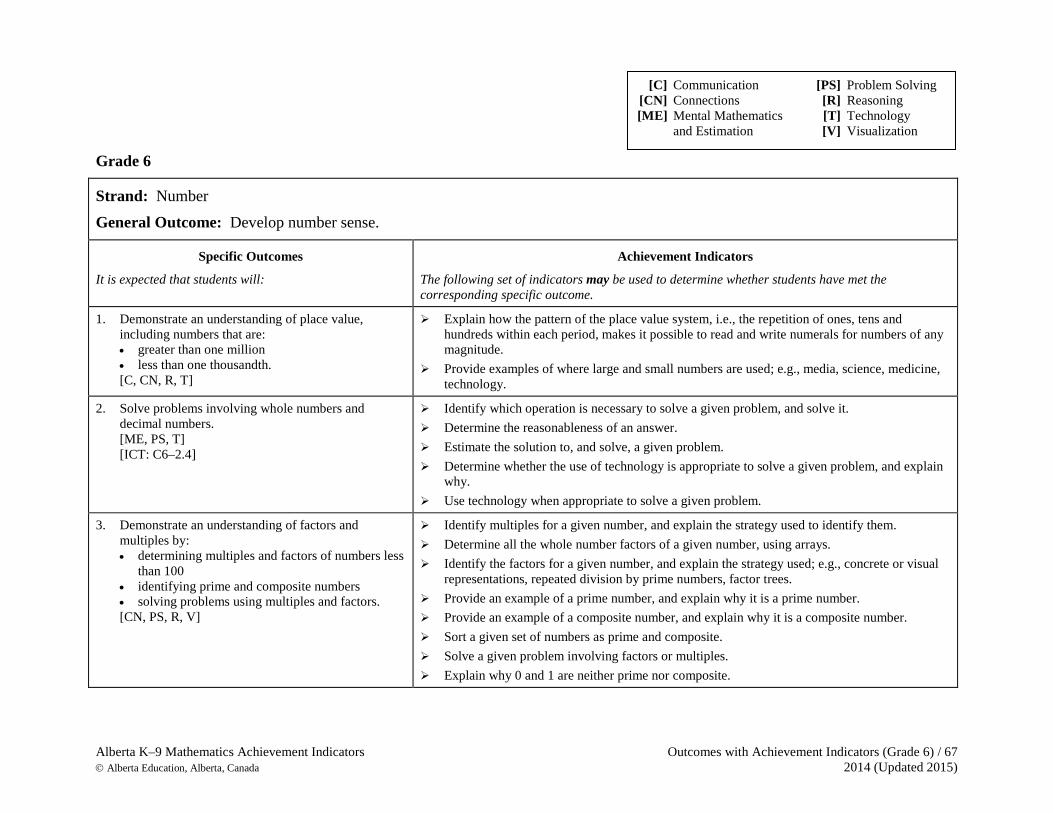
Alberta K–9 Mathematics Achievement Indicators Outcomes with Achievement Indicators (Grade 6) / 67 Alberta Education, Alberta, Canada 2014 (Updated 2015)
Grade 6
Strand: Number General Outcome: Develop number sense.
Specific Outcomes
It is expected that students will:
Achievement Indicators
The following set of indicators may be used to determine whether students have met the corresponding specific outcome.
1. Demonstrate an understanding of place value, including numbers that are: • greater than one million • less than one thousandth. [C, CN, R, T]
Explain how the pattern of the place value system, i.e., the repetition of ones, tens and hundreds within each period, makes it possible to read and write numerals for numbers of any magnitude.
Provide examples of where large and small numbers are used; e.g., media, science, medicine, technology.
2. Solve problems involving whole numbers and decimal numbers. [ME, PS, T] [ICT: C6–2.4]
Identify which operation is necessary to solve a given problem, and solve it. Determine the reasonableness of an answer. Estimate the solution to, and solve, a given problem. Determine whether the use of technology is appropriate to solve a given problem, and explain
why. Use technology when appropriate to solve a given problem.
3. Demonstrate an understanding of factors and multiples by: • determining multiples and factors of numbers less
than 100 • identifying prime and composite numbers • solving problems using multiples and factors. [CN, PS, R, V]
Identify multiples for a given number, and explain the strategy used to identify them. Determine all the whole number factors of a given number, using arrays. Identify the factors for a given number, and explain the strategy used; e.g., concrete or visual
representations, repeated division by prime numbers, factor trees. Provide an example of a prime number, and explain why it is a prime number. Provide an example of a composite number, and explain why it is a composite number. Sort a given set of numbers as prime and composite. Solve a given problem involving factors or multiples. Explain why 0 and 1 are neither prime nor composite.
[C] Communication [PS] Problem Solving [CN] Connections [R] Reasoning [ME] Mental Mathematics [T] Technology and Estimation [V] Visualization
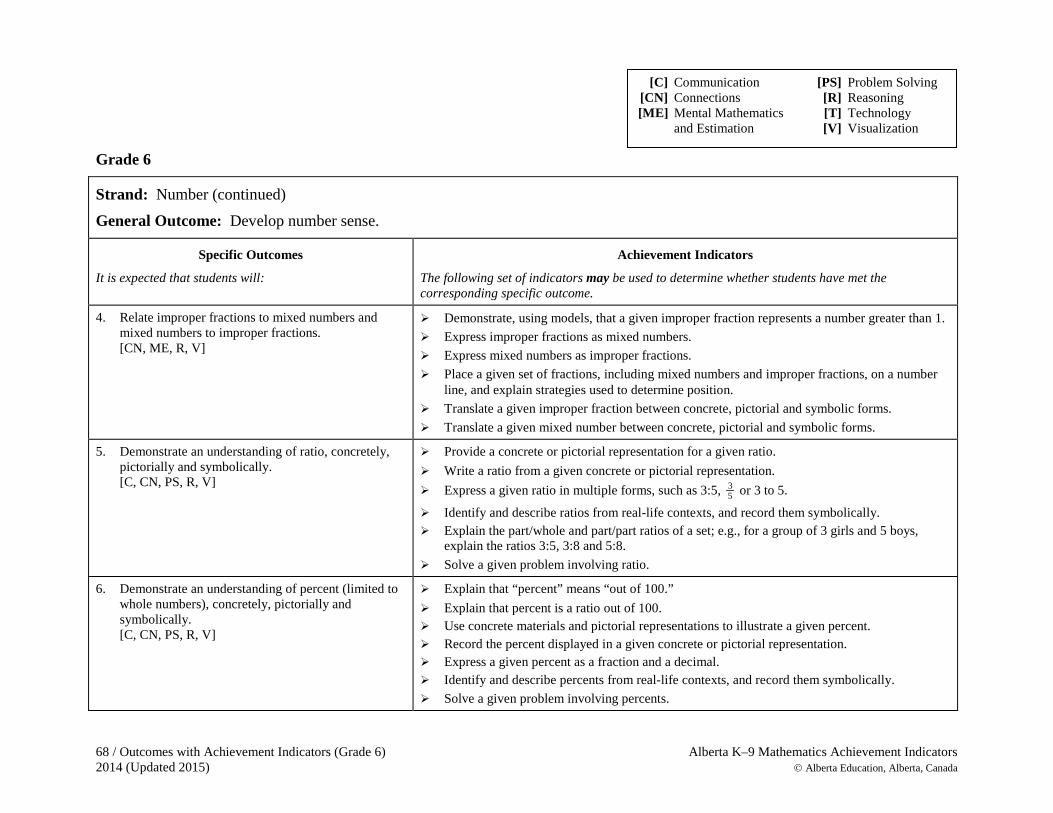
68 / Outcomes with Achievement Indicators (Grade 6) Alberta K–9 Mathematics Achievement Indicators 2014 (Updated 2015) Alberta Education, Alberta, Canada
Grade 6
Strand: Number (continued) General Outcome: Develop number sense.
Specific Outcomes
It is expected that students will:
Achievement Indicators
The following set of indicators may be used to determine whether students have met the corresponding specific outcome.
4. Relate improper fractions to mixed numbers and mixed numbers to improper fractions. [CN, ME, R, V]
Demonstrate, using models, that a given improper fraction represents a number greater than 1. Express improper fractions as mixed numbers. Express mixed numbers as improper fractions. Place a given set of fractions, including mixed numbers and improper fractions, on a number
line, and explain strategies used to determine position. Translate a given improper fraction between concrete, pictorial and symbolic forms. Translate a given mixed number between concrete, pictorial and symbolic forms.
5. Demonstrate an understanding of ratio, concretely, pictorially and symbolically. [C, CN, PS, R, V]
Provide a concrete or pictorial representation for a given ratio. Write a ratio from a given concrete or pictorial representation. Express a given ratio in multiple forms, such as 3:5, 3
5 or 3 to 5.
Identify and describe ratios from real-life contexts, and record them symbolically. Explain the part/whole and part/part ratios of a set; e.g., for a group of 3 girls and 5 boys,
explain the ratios 3:5, 3:8 and 5:8. Solve a given problem involving ratio.
6. Demonstrate an understanding of percent (limited to whole numbers), concretely, pictorially and symbolically. [C, CN, PS, R, V]
Explain that “percent” means “out of 100.” Explain that percent is a ratio out of 100. Use concrete materials and pictorial representations to illustrate a given percent. Record the percent displayed in a given concrete or pictorial representation. Express a given percent as a fraction and a decimal. Identify and describe percents from real-life contexts, and record them symbolically. Solve a given problem involving percents.
[C] Communication [PS] Problem Solving [CN] Connections [R] Reasoning [ME] Mental Mathematics [T] Technology and Estimation [V] Visualization

Alberta K–9 Mathematics Achievement Indicators Outcomes with Achievement Indicators (Grade 6) / 69 Alberta Education, Alberta, Canada 2014 (Updated 2015)
Grade 6
Strand: Number (continued) General Outcome: Develop number sense.
Specific Outcomes
It is expected that students will:
Achievement Indicators
The following set of indicators may be used to determine whether students have met the corresponding specific outcome.
7. Demonstrate an understanding of integers, concretely, pictorially and symbolically. [C, CN, R, V]
Extend a given number line by adding numbers less than zero, and explain the pattern on each side of zero.
Place given integers on a number line, and explain how integers are ordered. Describe contexts in which integers are used; e.g., on a thermometer. Compare two integers; represent their relationship using the symbols <, > and =; and verify the
relationship, using a number line. Order given integers in ascending or descending order.
8. Demonstrate an understanding of multiplication and division of decimals (1-digit whole number multipliers and 1-digit natural number divisors). [C, CN, ME, PS, R, V]
Place the decimal point in a product, using front-end estimation; e.g., for 15.205 m × 4, think 15 m × 4, so the product is greater than 60 m.
Place the decimal point in a quotient, using front-end estimation; e.g., for $26.83 ÷ 4, think $24 ÷ 4, so the quotient is greater than $6.
Correct errors of decimal point placement in a given product or quotient without using paper and pencil.
Predict products and quotients of decimals, using estimation strategies. Solve a given problem that involves multiplication and division of decimals using multipliers
from 0 to 9 and divisors from 1 to 9.
9. Explain and apply the order of operations, excluding exponents, with and without technology (limited to whole numbers). [C, CN, ME, PS, T]
[ICT: C6–2.4, C6–2.7]
Explain, using examples, why there is a need to have a standardized order of operations. Apply the order of operations to solve multistep problems with and without technology;
e.g., a computer, a calculator.
[C] Communication [PS] Problem Solving [CN] Connections [R] Reasoning [ME] Mental Mathematics [T] Technology and Estimation [V] Visualization
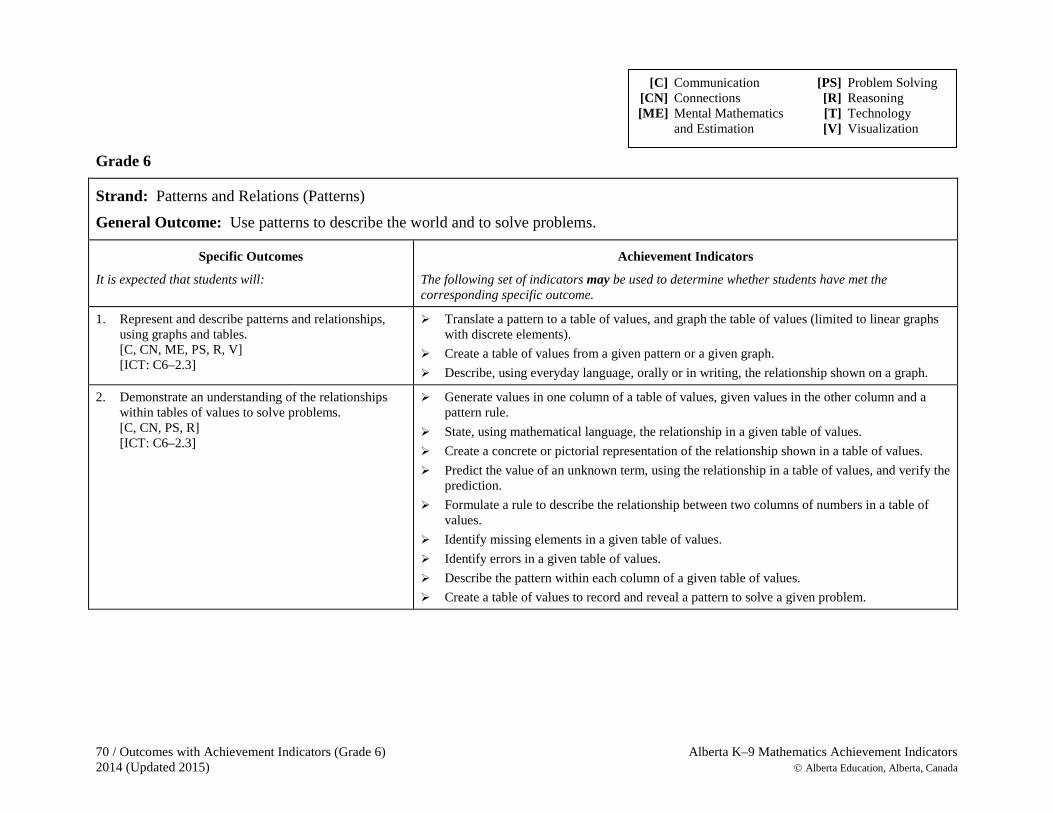
70 / Outcomes with Achievement Indicators (Grade 6) Alberta K–9 Mathematics Achievement Indicators 2014 (Updated 2015) Alberta Education, Alberta, Canada
Grade 6
Strand: Patterns and Relations (Patterns) General Outcome: Use patterns to describe the world and to solve problems.
Specific Outcomes
It is expected that students will:
Achievement Indicators
The following set of indicators may be used to determine whether students have met the corresponding specific outcome.
1. Represent and describe patterns and relationships, using graphs and tables. [C, CN, ME, PS, R, V] [ICT: C6–2.3]
Translate a pattern to a table of values, and graph the table of values (limited to linear graphs with discrete elements).
Create a table of values from a given pattern or a given graph. Describe, using everyday language, orally or in writing, the relationship shown on a graph.
2. Demonstrate an understanding of the relationships within tables of values to solve problems. [C, CN, PS, R] [ICT: C6–2.3]
Generate values in one column of a table of values, given values in the other column and a pattern rule.
State, using mathematical language, the relationship in a given table of values. Create a concrete or pictorial representation of the relationship shown in a table of values. Predict the value of an unknown term, using the relationship in a table of values, and verify the
prediction. Formulate a rule to describe the relationship between two columns of numbers in a table of
values. Identify missing elements in a given table of values. Identify errors in a given table of values. Describe the pattern within each column of a given table of values. Create a table of values to record and reveal a pattern to solve a given problem.
[C] Communication [PS] Problem Solving [CN] Connections [R] Reasoning [ME] Mental Mathematics [T] Technology and Estimation [V] Visualization
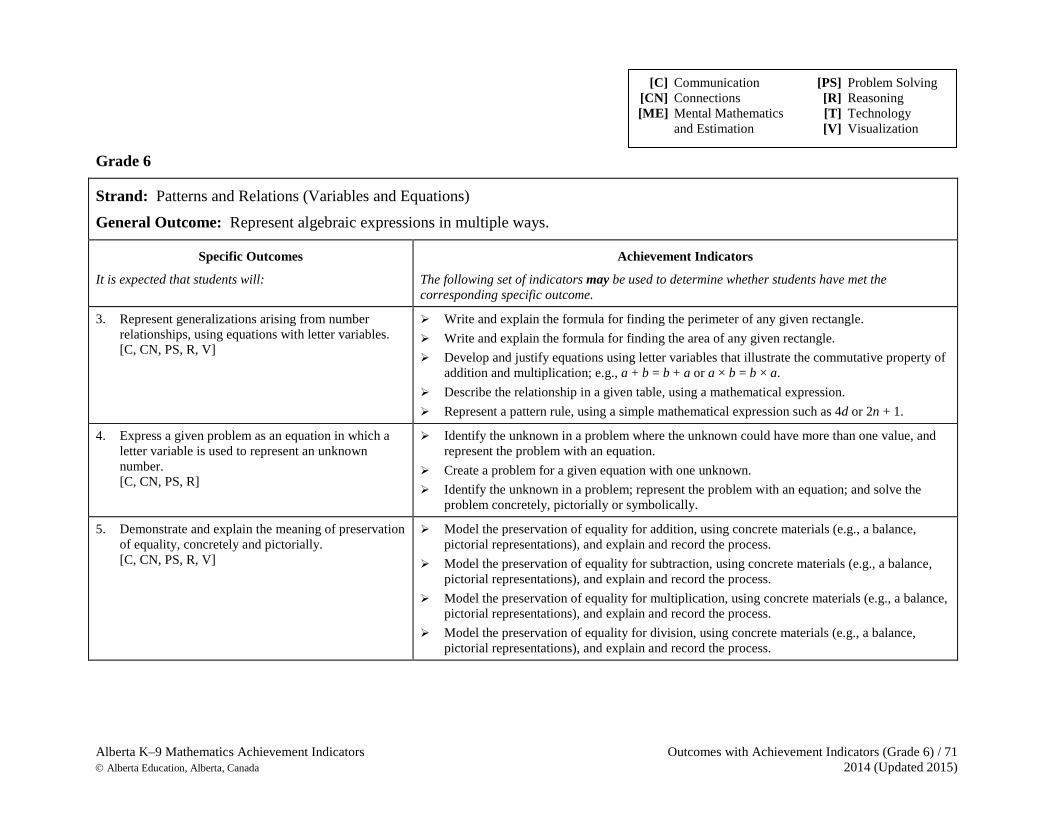
Alberta K–9 Mathematics Achievement Indicators Outcomes with Achievement Indicators (Grade 6) / 71 Alberta Education, Alberta, Canada 2014 (Updated 2015)
Grade 6
Strand: Patterns and Relations (Variables and Equations) General Outcome: Represent algebraic expressions in multiple ways.
Specific Outcomes
It is expected that students will:
Achievement Indicators
The following set of indicators may be used to determine whether students have met the corresponding specific outcome.
3. Represent generalizations arising from number relationships, using equations with letter variables. [C, CN, PS, R, V]
Write and explain the formula for finding the perimeter of any given rectangle. Write and explain the formula for finding the area of any given rectangle. Develop and justify equations using letter variables that illustrate the commutative property of
addition and multiplication; e.g., a + b = b + a or a × b = b × a. Describe the relationship in a given table, using a mathematical expression. Represent a pattern rule, using a simple mathematical expression such as 4d or 2n + 1.
4. Express a given problem as an equation in which a letter variable is used to represent an unknown number. [C, CN, PS, R]
Identify the unknown in a problem where the unknown could have more than one value, and represent the problem with an equation.
Create a problem for a given equation with one unknown. Identify the unknown in a problem; represent the problem with an equation; and solve the
problem concretely, pictorially or symbolically.
5. Demonstrate and explain the meaning of preservation of equality, concretely and pictorially. [C, CN, PS, R, V]
Model the preservation of equality for addition, using concrete materials (e.g., a balance, pictorial representations), and explain and record the process.
Model the preservation of equality for subtraction, using concrete materials (e.g., a balance, pictorial representations), and explain and record the process.
Model the preservation of equality for multiplication, using concrete materials (e.g., a balance, pictorial representations), and explain and record the process.
Model the preservation of equality for division, using concrete materials (e.g., a balance, pictorial representations), and explain and record the process.
[C] Communication [PS] Problem Solving [CN] Connections [R] Reasoning [ME] Mental Mathematics [T] Technology and Estimation [V] Visualization
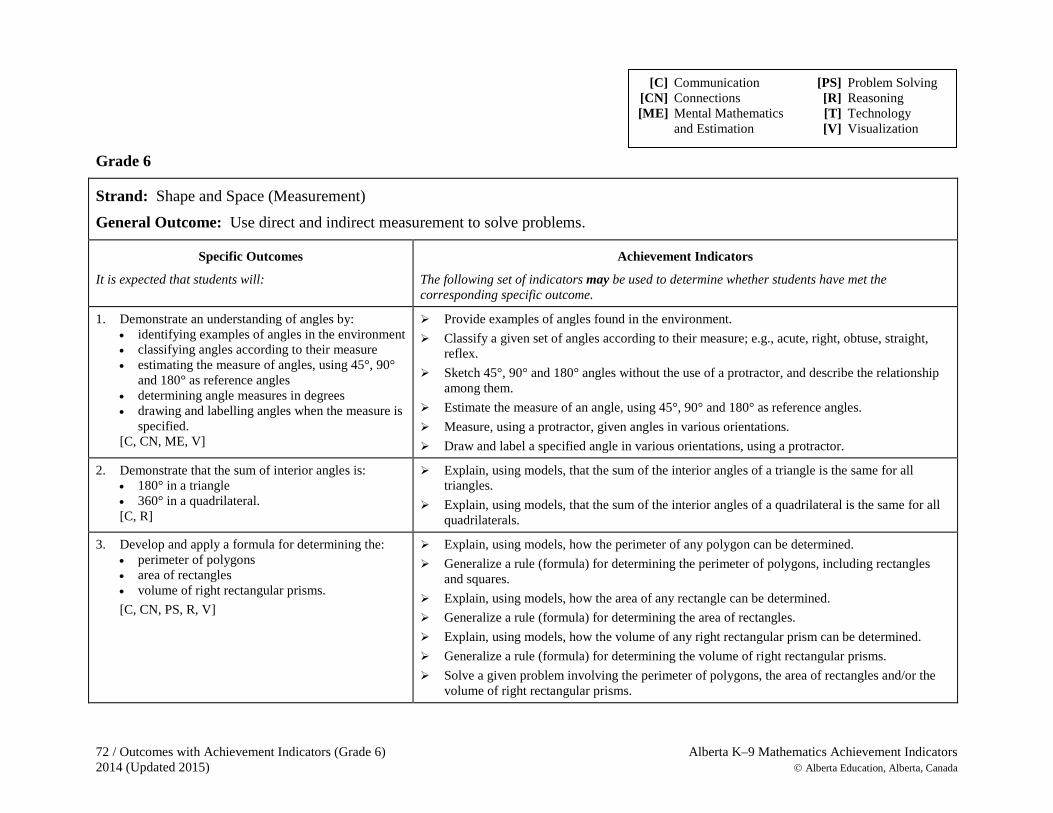
72 / Outcomes with Achievement Indicators (Grade 6) Alberta K–9 Mathematics Achievement Indicators 2014 (Updated 2015) Alberta Education, Alberta, Canada
Grade 6
Strand: Shape and Space (Measurement) General Outcome: Use direct and indirect measurement to solve problems.
Specific Outcomes
It is expected that students will:
Achievement Indicators
The following set of indicators may be used to determine whether students have met the corresponding specific outcome.
1. Demonstrate an understanding of angles by: • identifying examples of angles in the environment • classifying angles according to their measure • estimating the measure of angles, using 45°, 90°
and 180° as reference angles • determining angle measures in degrees • drawing and labelling angles when the measure is
specified. [C, CN, ME, V]
Provide examples of angles found in the environment. Classify a given set of angles according to their measure; e.g., acute, right, obtuse, straight,
reflex. Sketch 45°, 90° and 180° angles without the use of a protractor, and describe the relationship
among them. Estimate the measure of an angle, using 45°, 90° and 180° as reference angles. Measure, using a protractor, given angles in various orientations. Draw and label a specified angle in various orientations, using a protractor.
2. Demonstrate that the sum of interior angles is: • 180° in a triangle • 360° in a quadrilateral. [C, R]
Explain, using models, that the sum of the interior angles of a triangle is the same for all triangles.
Explain, using models, that the sum of the interior angles of a quadrilateral is the same for all quadrilaterals.
3. Develop and apply a formula for determining the: • perimeter of polygons • area of rectangles • volume of right rectangular prisms.
[C, CN, PS, R, V]
Explain, using models, how the perimeter of any polygon can be determined. Generalize a rule (formula) for determining the perimeter of polygons, including rectangles
and squares. Explain, using models, how the area of any rectangle can be determined. Generalize a rule (formula) for determining the area of rectangles. Explain, using models, how the volume of any right rectangular prism can be determined. Generalize a rule (formula) for determining the volume of right rectangular prisms. Solve a given problem involving the perimeter of polygons, the area of rectangles and/or the
volume of right rectangular prisms.
[C] Communication [PS] Problem Solving [CN] Connections [R] Reasoning [ME] Mental Mathematics [T] Technology and Estimation [V] Visualization
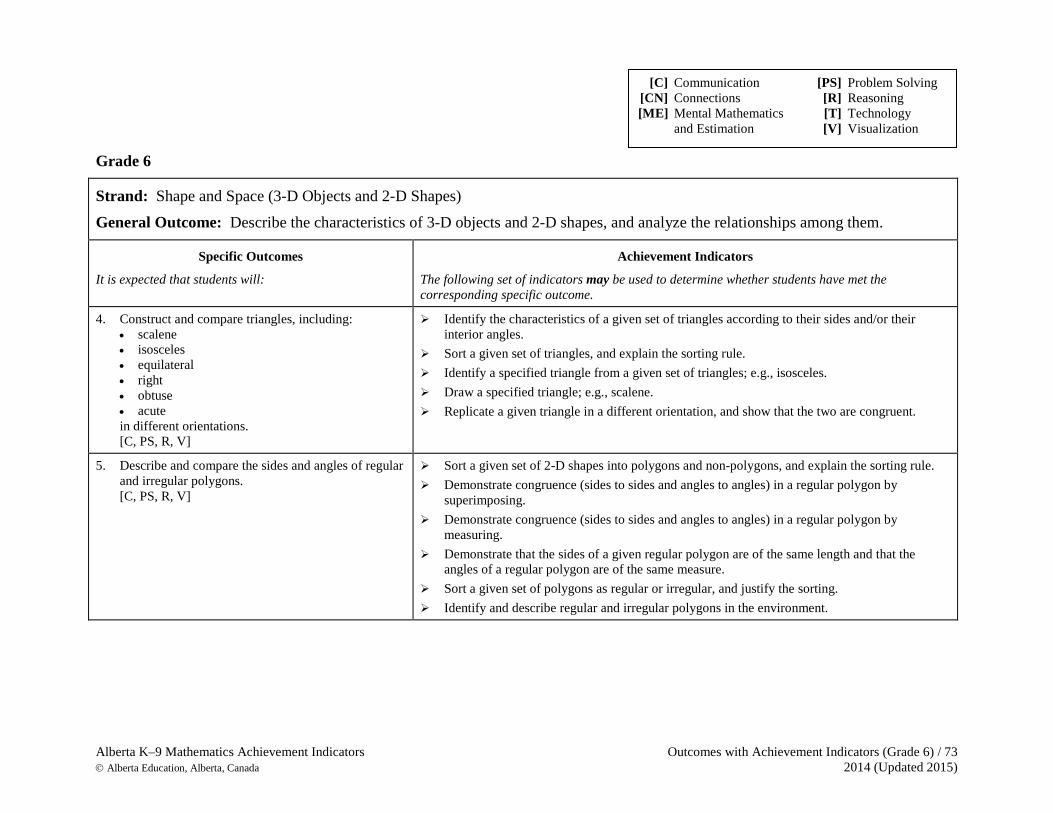
Alberta K–9 Mathematics Achievement Indicators Outcomes with Achievement Indicators (Grade 6) / 73 Alberta Education, Alberta, Canada 2014 (Updated 2015)
Grade 6
Strand: Shape and Space (3-D Objects and 2-D Shapes) General Outcome: Describe the characteristics of 3-D objects and 2-D shapes, and analyze the relationships among them.
Specific Outcomes
It is expected that students will:
Achievement Indicators
The following set of indicators may be used to determine whether students have met the corresponding specific outcome.
4. Construct and compare triangles, including: • scalene • isosceles • equilateral • right • obtuse • acute in different orientations. [C, PS, R, V]
Identify the characteristics of a given set of triangles according to their sides and/or their interior angles.
Sort a given set of triangles, and explain the sorting rule. Identify a specified triangle from a given set of triangles; e.g., isosceles. Draw a specified triangle; e.g., scalene. Replicate a given triangle in a different orientation, and show that the two are congruent.
5. Describe and compare the sides and angles of regular and irregular polygons. [C, PS, R, V]
Sort a given set of 2-D shapes into polygons and non-polygons, and explain the sorting rule. Demonstrate congruence (sides to sides and angles to angles) in a regular polygon by
superimposing. Demonstrate congruence (sides to sides and angles to angles) in a regular polygon by
measuring. Demonstrate that the sides of a given regular polygon are of the same length and that the
angles of a regular polygon are of the same measure. Sort a given set of polygons as regular or irregular, and justify the sorting. Identify and describe regular and irregular polygons in the environment.
[C] Communication [PS] Problem Solving [CN] Connections [R] Reasoning [ME] Mental Mathematics [T] Technology and Estimation [V] Visualization
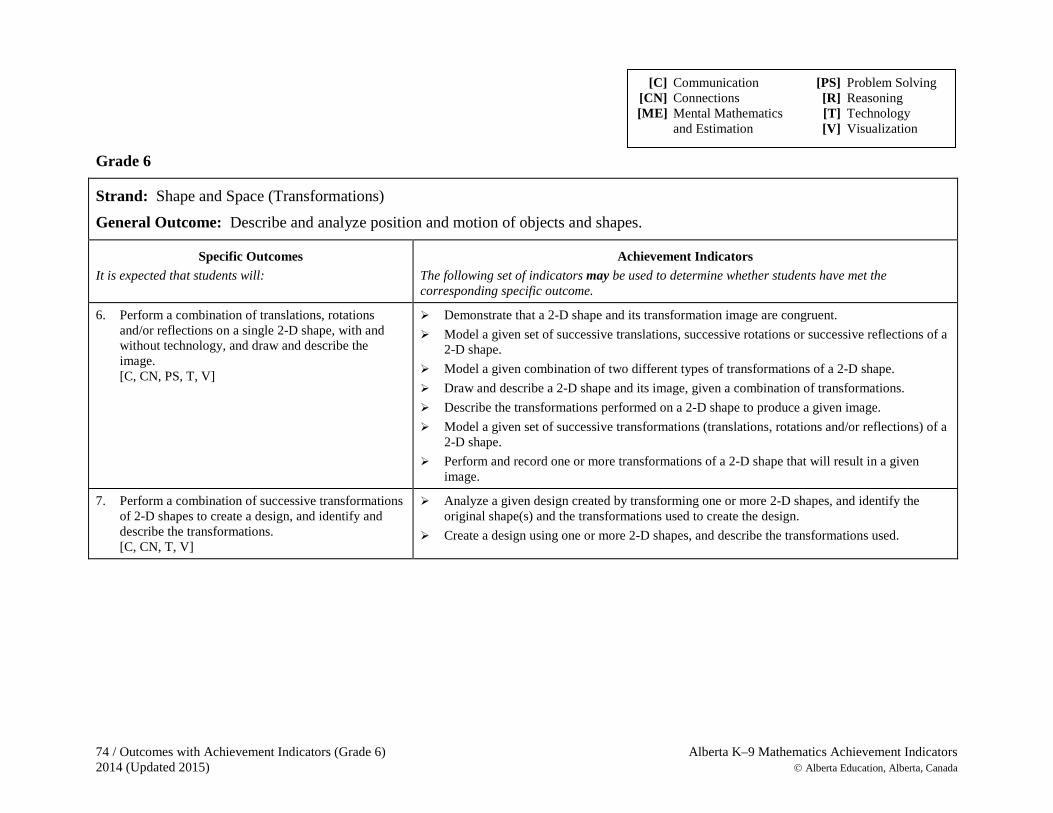
74 / Outcomes with Achievement Indicators (Grade 6) Alberta K–9 Mathematics Achievement Indicators 2014 (Updated 2015) Alberta Education, Alberta, Canada
Grade 6
Strand: Shape and Space (Transformations)
General Outcome: Describe and analyze position and motion of objects and shapes.
Specific Outcomes It is expected that students will:
Achievement Indicators The following set of indicators may be used to determine whether students have met the corresponding specific outcome.
6. Perform a combination of translations, rotations and/or reflections on a single 2-D shape, with and without technology, and draw and describe the image. [C, CN, PS, T, V]
Demonstrate that a 2-D shape and its transformation image are congruent. Model a given set of successive translations, successive rotations or successive reflections of a
2-D shape. Model a given combination of two different types of transformations of a 2-D shape. Draw and describe a 2-D shape and its image, given a combination of transformations. Describe the transformations performed on a 2-D shape to produce a given image. Model a given set of successive transformations (translations, rotations and/or reflections) of a
2-D shape. Perform and record one or more transformations of a 2-D shape that will result in a given
image.
7. Perform a combination of successive transformations of 2-D shapes to create a design, and identify and describe the transformations. [C, CN, T, V]
Analyze a given design created by transforming one or more 2-D shapes, and identify the original shape(s) and the transformations used to create the design.
Create a design using one or more 2-D shapes, and describe the transformations used.
[C] Communication [PS] Problem Solving [CN] Connections [R] Reasoning [ME] Mental Mathematics [T] Technology and Estimation [V] Visualization
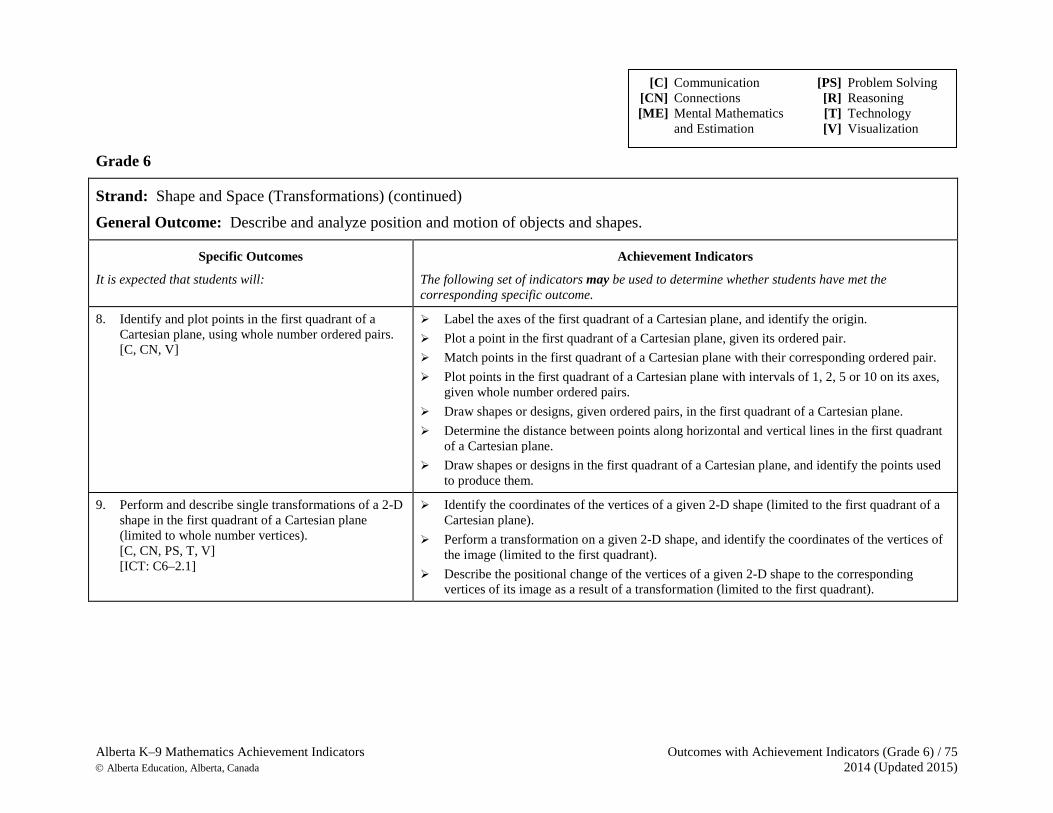
Alberta K–9 Mathematics Achievement Indicators Outcomes with Achievement Indicators (Grade 6) / 75 Alberta Education, Alberta, Canada 2014 (Updated 2015)
Grade 6
Strand: Shape and Space (Transformations) (continued)
General Outcome: Describe and analyze position and motion of objects and shapes.
Specific Outcomes
It is expected that students will:
Achievement Indicators
The following set of indicators may be used to determine whether students have met the corresponding specific outcome.
8. Identify and plot points in the first quadrant of a Cartesian plane, using whole number ordered pairs. [C, CN, V]
Label the axes of the first quadrant of a Cartesian plane, and identify the origin. Plot a point in the first quadrant of a Cartesian plane, given its ordered pair. Match points in the first quadrant of a Cartesian plane with their corresponding ordered pair. Plot points in the first quadrant of a Cartesian plane with intervals of 1, 2, 5 or 10 on its axes,
given whole number ordered pairs. Draw shapes or designs, given ordered pairs, in the first quadrant of a Cartesian plane. Determine the distance between points along horizontal and vertical lines in the first quadrant
of a Cartesian plane. Draw shapes or designs in the first quadrant of a Cartesian plane, and identify the points used
to produce them.
9. Perform and describe single transformations of a 2-D shape in the first quadrant of a Cartesian plane (limited to whole number vertices). [C, CN, PS, T, V] [ICT: C6–2.1]
Identify the coordinates of the vertices of a given 2-D shape (limited to the first quadrant of a Cartesian plane).
Perform a transformation on a given 2-D shape, and identify the coordinates of the vertices of the image (limited to the first quadrant).
Describe the positional change of the vertices of a given 2-D shape to the corresponding vertices of its image as a result of a transformation (limited to the first quadrant).
[C] Communication [PS] Problem Solving [CN] Connections [R] Reasoning [ME] Mental Mathematics [T] Technology and Estimation [V] Visualization
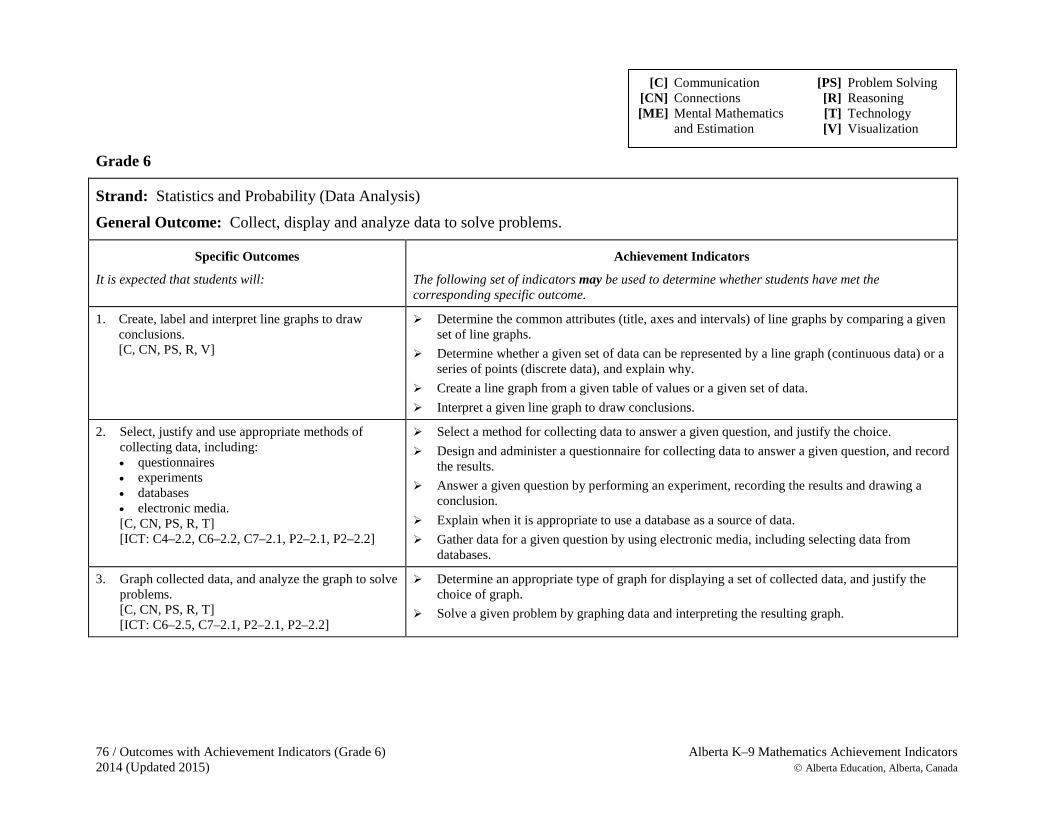
76 / Outcomes with Achievement Indicators (Grade 6) Alberta K–9 Mathematics Achievement Indicators 2014 (Updated 2015) Alberta Education, Alberta, Canada
Grade 6
Strand: Statistics and Probability (Data Analysis) General Outcome: Collect, display and analyze data to solve problems.
Specific Outcomes
It is expected that students will:
Achievement Indicators
The following set of indicators may be used to determine whether students have met the corresponding specific outcome.
1. Create, label and interpret line graphs to draw conclusions. [C, CN, PS, R, V]
Determine the common attributes (title, axes and intervals) of line graphs by comparing a given set of line graphs.
Determine whether a given set of data can be represented by a line graph (continuous data) or a series of points (discrete data), and explain why.
Create a line graph from a given table of values or a given set of data. Interpret a given line graph to draw conclusions.
2. Select, justify and use appropriate methods of collecting data, including: • questionnaires • experiments • databases • electronic media. [C, CN, PS, R, T] [ICT: C4–2.2, C6–2.2, C7–2.1, P2–2.1, P2–2.2]
Select a method for collecting data to answer a given question, and justify the choice. Design and administer a questionnaire for collecting data to answer a given question, and record
the results. Answer a given question by performing an experiment, recording the results and drawing a
conclusion. Explain when it is appropriate to use a database as a source of data. Gather data for a given question by using electronic media, including selecting data from
databases.
3. Graph collected data, and analyze the graph to solve problems. [C, CN, PS, R, T] [ICT: C6–2.5, C7–2.1, P2–2.1, P2–2.2]
Determine an appropriate type of graph for displaying a set of collected data, and justify the choice of graph.
Solve a given problem by graphing data and interpreting the resulting graph.
[C] Communication [PS] Problem Solving [CN] Connections [R] Reasoning [ME] Mental Mathematics [T] Technology and Estimation [V] Visualization
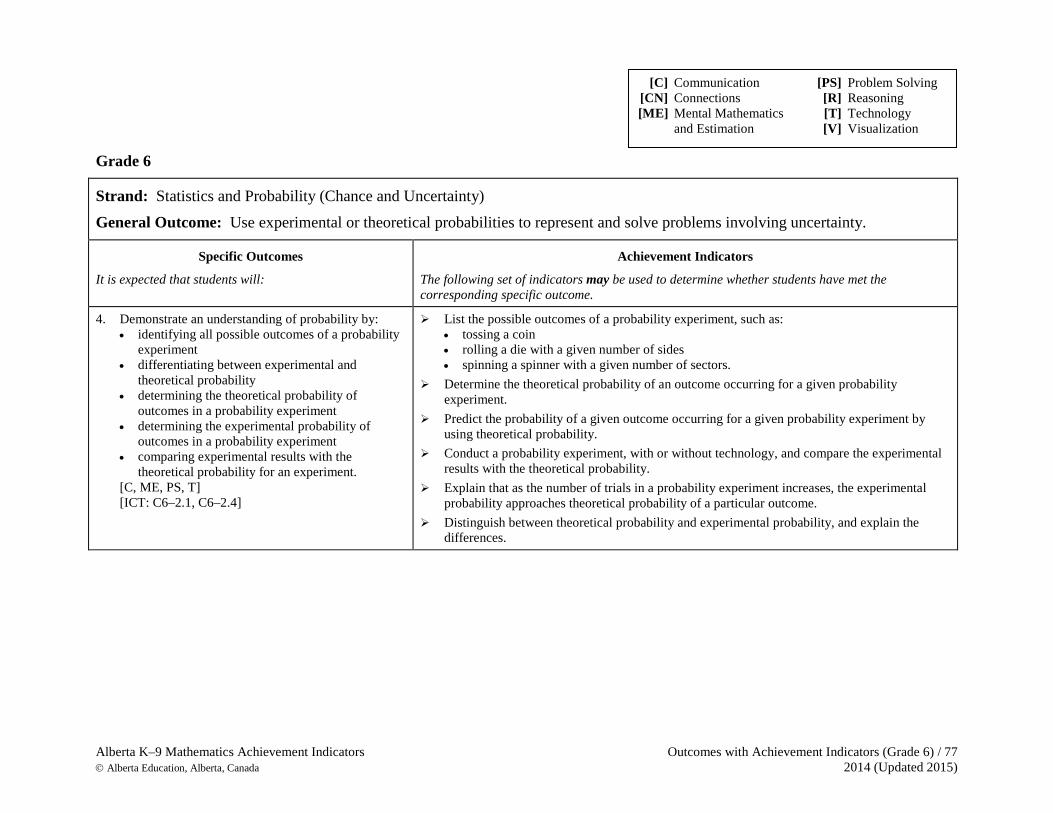
Alberta K–9 Mathematics Achievement Indicators Outcomes with Achievement Indicators (Grade 6) / 77 Alberta Education, Alberta, Canada 2014 (Updated 2015)
Grade 6
Strand: Statistics and Probability (Chance and Uncertainty) General Outcome: Use experimental or theoretical probabilities to represent and solve problems involving uncertainty.
Specific Outcomes
It is expected that students will:
Achievement Indicators
The following set of indicators may be used to determine whether students have met the corresponding specific outcome.
4. Demonstrate an understanding of probability by: • identifying all possible outcomes of a probability
experiment • differentiating between experimental and
theoretical probability • determining the theoretical probability of
outcomes in a probability experiment • determining the experimental probability of
outcomes in a probability experiment • comparing experimental results with the
theoretical probability for an experiment. [C, ME, PS, T] [ICT: C6–2.1, C6–2.4]
List the possible outcomes of a probability experiment, such as: • tossing a coin • rolling a die with a given number of sides • spinning a spinner with a given number of sectors.
Determine the theoretical probability of an outcome occurring for a given probability experiment.
Predict the probability of a given outcome occurring for a given probability experiment by using theoretical probability.
Conduct a probability experiment, with or without technology, and compare the experimental results with the theoretical probability.
Explain that as the number of trials in a probability experiment increases, the experimental probability approaches theoretical probability of a particular outcome.
Distinguish between theoretical probability and experimental probability, and explain the differences.
[C] Communication [PS] Problem Solving [CN] Connections [R] Reasoning [ME] Mental Mathematics [T] Technology and Estimation [V] Visualization
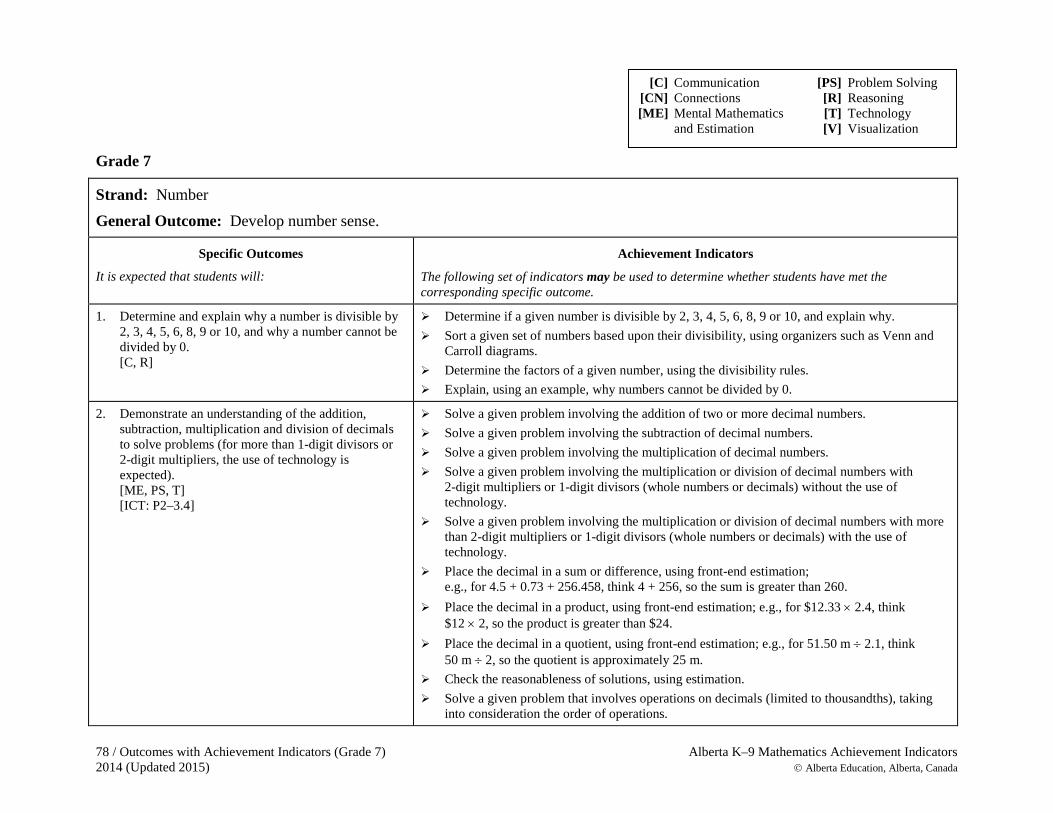
78 / Outcomes with Achievement Indicators (Grade 7) Alberta K–9 Mathematics Achievement Indicators 2014 (Updated 2015) Alberta Education, Alberta, Canada
Grade 7
Strand: Number General Outcome: Develop number sense.
Specific Outcomes
It is expected that students will:
Achievement Indicators
The following set of indicators may be used to determine whether students have met the corresponding specific outcome.
1. Determine and explain why a number is divisible by 2, 3, 4, 5, 6, 8, 9 or 10, and why a number cannot be divided by 0. [C, R]
Determine if a given number is divisible by 2, 3, 4, 5, 6, 8, 9 or 10, and explain why. Sort a given set of numbers based upon their divisibility, using organizers such as Venn and
Carroll diagrams. Determine the factors of a given number, using the divisibility rules. Explain, using an example, why numbers cannot be divided by 0.
2. Demonstrate an understanding of the addition, subtraction, multiplication and division of decimals to solve problems (for more than 1-digit divisors or 2-digit multipliers, the use of technology is expected). [ME, PS, T] [ICT: P2–3.4]
Solve a given problem involving the addition of two or more decimal numbers. Solve a given problem involving the subtraction of decimal numbers. Solve a given problem involving the multiplication of decimal numbers. Solve a given problem involving the multiplication or division of decimal numbers with
2-digit multipliers or 1-digit divisors (whole numbers or decimals) without the use of technology.
Solve a given problem involving the multiplication or division of decimal numbers with more than 2-digit multipliers or 1-digit divisors (whole numbers or decimals) with the use of technology.
Place the decimal in a sum or difference, using front-end estimation; e.g., for 4.5 + 0.73 + 256.458, think 4 + 256, so the sum is greater than 260.
Place the decimal in a product, using front-end estimation; e.g., for $12.33 × 2.4, think $12 × 2, so the product is greater than $24.
Place the decimal in a quotient, using front-end estimation; e.g., for 51.50 m ÷ 2.1, think 50 m ÷ 2, so the quotient is approximately 25 m.
Check the reasonableness of solutions, using estimation. Solve a given problem that involves operations on decimals (limited to thousandths), taking
into consideration the order of operations.
[C] Communication [PS] Problem Solving [CN] Connections [R] Reasoning [ME] Mental Mathematics [T] Technology and Estimation [V] Visualization
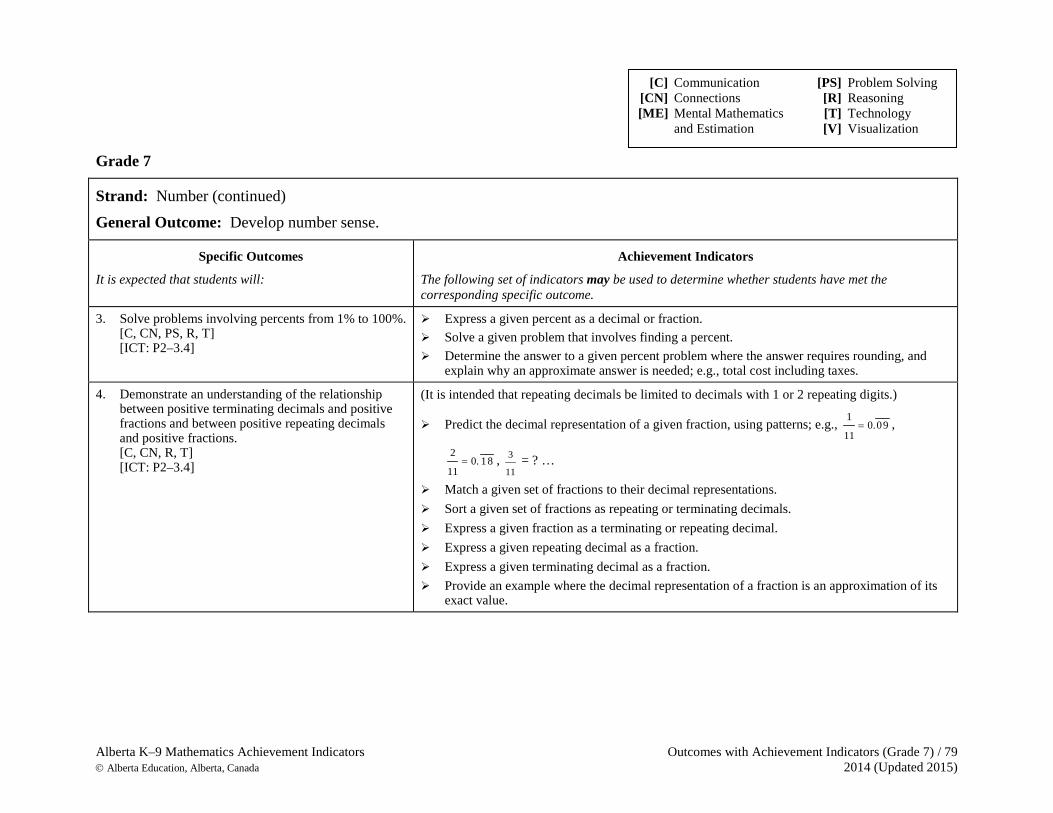
Alberta K–9 Mathematics Achievement Indicators Outcomes with Achievement Indicators (Grade 7) / 79 Alberta Education, Alberta, Canada 2014 (Updated 2015)
Grade 7
Strand: Number (continued) General Outcome: Develop number sense.
Specific Outcomes
It is expected that students will:
Achievement Indicators
The following set of indicators may be used to determine whether students have met the corresponding specific outcome.
3. Solve problems involving percents from 1% to 100%. [C, CN, PS, R, T] [ICT: P2–3.4]
Express a given percent as a decimal or fraction. Solve a given problem that involves finding a percent. Determine the answer to a given percent problem where the answer requires rounding, and
explain why an approximate answer is needed; e.g., total cost including taxes.
4. Demonstrate an understanding of the relationship between positive terminating decimals and positive fractions and between positive repeating decimals and positive fractions. [C, CN, R, T] [ICT: P2–3.4]
(It is intended that repeating decimals be limited to decimals with 1 or 2 repeating digits.)
Predict the decimal representation of a given fraction, using patterns; e.g., 10.09
11= ,
20. 18
11= , 3
11 = ? …
Match a given set of fractions to their decimal representations. Sort a given set of fractions as repeating or terminating decimals. Express a given fraction as a terminating or repeating decimal. Express a given repeating decimal as a fraction. Express a given terminating decimal as a fraction. Provide an example where the decimal representation of a fraction is an approximation of its
exact value.
[C] Communication [PS] Problem Solving [CN] Connections [R] Reasoning [ME] Mental Mathematics [T] Technology and Estimation [V] Visualization
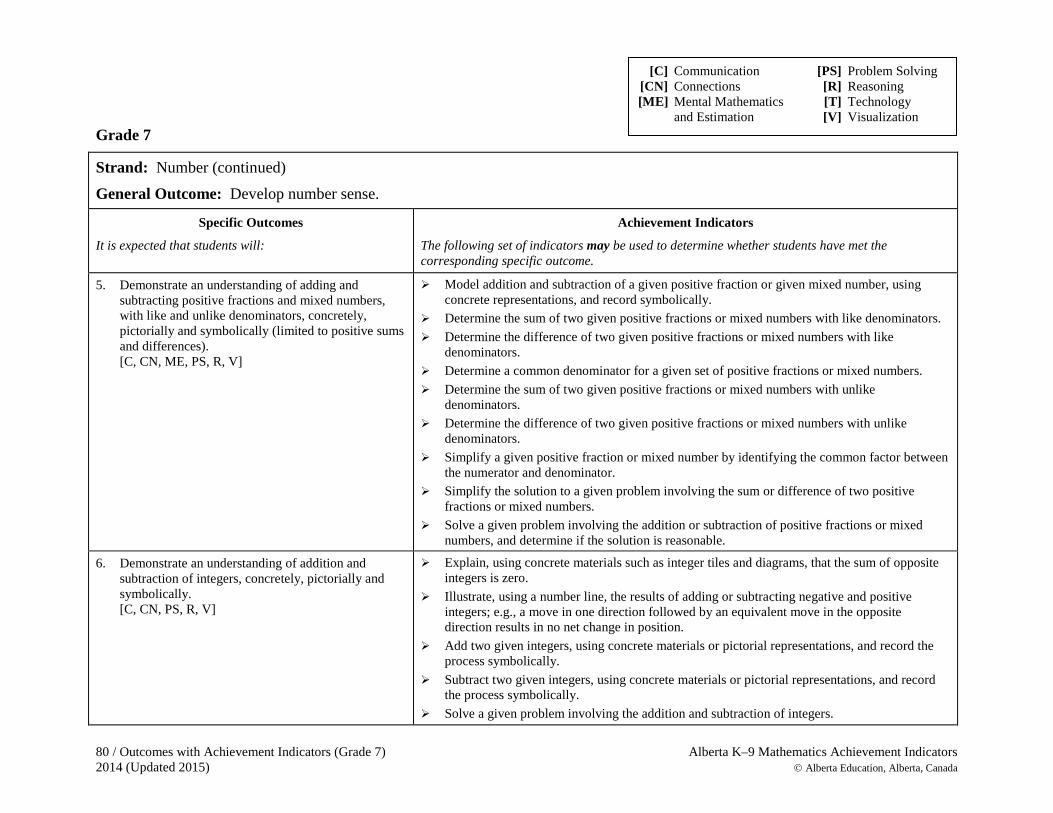
80 / Outcomes with Achievement Indicators (Grade 7) Alberta K–9 Mathematics Achievement Indicators 2014 (Updated 2015) Alberta Education, Alberta, Canada
Grade 7
Strand: Number (continued) General Outcome: Develop number sense.
Specific Outcomes
It is expected that students will:
Achievement Indicators
The following set of indicators may be used to determine whether students have met the corresponding specific outcome.
5. Demonstrate an understanding of adding and subtracting positive fractions and mixed numbers, with like and unlike denominators, concretely, pictorially and symbolically (limited to positive sums and differences). [C, CN, ME, PS, R, V]
Model addition and subtraction of a given positive fraction or given mixed number, using concrete representations, and record symbolically.
Determine the sum of two given positive fractions or mixed numbers with like denominators. Determine the difference of two given positive fractions or mixed numbers with like
denominators. Determine a common denominator for a given set of positive fractions or mixed numbers. Determine the sum of two given positive fractions or mixed numbers with unlike
denominators. Determine the difference of two given positive fractions or mixed numbers with unlike
denominators. Simplify a given positive fraction or mixed number by identifying the common factor between
the numerator and denominator. Simplify the solution to a given problem involving the sum or difference of two positive
fractions or mixed numbers. Solve a given problem involving the addition or subtraction of positive fractions or mixed
numbers, and determine if the solution is reasonable.
6. Demonstrate an understanding of addition and subtraction of integers, concretely, pictorially and symbolically. [C, CN, PS, R, V]
Explain, using concrete materials such as integer tiles and diagrams, that the sum of opposite integers is zero.
Illustrate, using a number line, the results of adding or subtracting negative and positive integers; e.g., a move in one direction followed by an equivalent move in the opposite direction results in no net change in position.
Add two given integers, using concrete materials or pictorial representations, and record the process symbolically.
Subtract two given integers, using concrete materials or pictorial representations, and record the process symbolically.
Solve a given problem involving the addition and subtraction of integers.
[C] Communication [PS] Problem Solving [CN] Connections [R] Reasoning [ME] Mental Mathematics [T] Technology and Estimation [V] Visualization
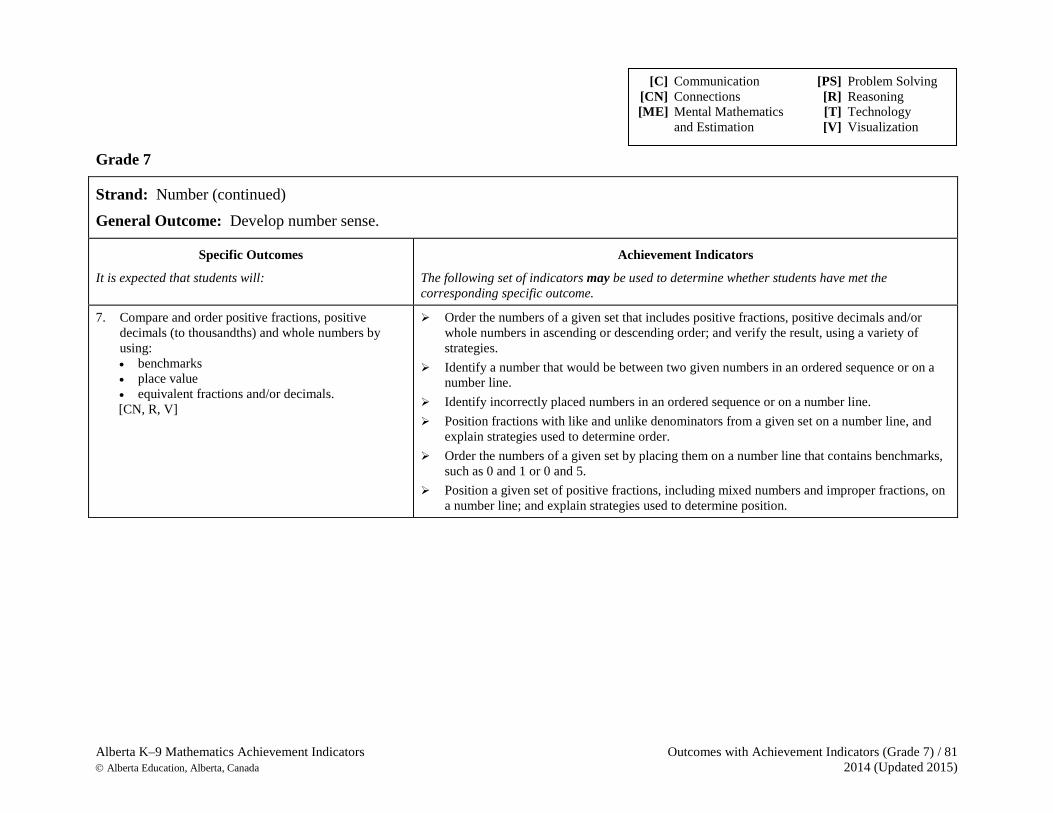
Alberta K–9 Mathematics Achievement Indicators Outcomes with Achievement Indicators (Grade 7) / 81 Alberta Education, Alberta, Canada 2014 (Updated 2015)
Grade 7
Strand: Number (continued) General Outcome: Develop number sense.
Specific Outcomes
It is expected that students will:
Achievement Indicators
The following set of indicators may be used to determine whether students have met the corresponding specific outcome.
7. Compare and order positive fractions, positive decimals (to thousandths) and whole numbers by using: • benchmarks • place value • equivalent fractions and/or decimals. [CN, R, V]
Order the numbers of a given set that includes positive fractions, positive decimals and/or whole numbers in ascending or descending order; and verify the result, using a variety of strategies.
Identify a number that would be between two given numbers in an ordered sequence or on a number line.
Identify incorrectly placed numbers in an ordered sequence or on a number line. Position fractions with like and unlike denominators from a given set on a number line, and
explain strategies used to determine order. Order the numbers of a given set by placing them on a number line that contains benchmarks,
such as 0 and 1 or 0 and 5. Position a given set of positive fractions, including mixed numbers and improper fractions, on
a number line; and explain strategies used to determine position.
[C] Communication [PS] Problem Solving [CN] Connections [R] Reasoning [ME] Mental Mathematics [T] Technology and Estimation [V] Visualization

82 / Outcomes with Achievement Indicators (Grade 7) Alberta K–9 Mathematics Achievement Indicators 2014 (Updated 2015) Alberta Education, Alberta, Canada
Grade 7
Strand: Patterns and Relations (Patterns) General Outcome: Use patterns to describe the world and to solve problems.
Specific Outcomes It is expected that students will:
Achievement Indicators The following set of indicators may be used to determine whether students have met the corresponding specific outcome.
1. Demonstrate an understanding of oral and written patterns and their equivalent linear relations. [C, CN, R]
Formulate a linear relation to represent the relationship in a given oral or written pattern. Provide a context for a given linear relation that represents a pattern. Represent a pattern in the environment, using a linear relation.
2. Create a table of values from a linear relation, graph the table of values, and analyze the graph to draw conclusions and solve problems. [C, CN, PS, R, V] [ICT: C7–3.1]
Create a table of values for a given linear relation by substituting values for the variable. Create a table of values, using a linear relation, and graph the table of values (limited to
discrete elements). Sketch the graph from a table of values created for a given linear relation, and describe the
patterns found in the graph to draw conclusions; e.g., graph the relationship between n and 2n + 3.
Describe, using everyday language in spoken or written form, the relationship shown on a graph to solve problems.
Match a set of linear relations to a set of graphs.
[C] Communication [PS] Problem Solving [CN] Connections [R] Reasoning [ME] Mental Mathematics [T] Technology and Estimation [V] Visualization

Alberta K–9 Mathematics Achievement Indicators Outcomes with Achievement Indicators (Grade 7) / 83 Alberta Education, Alberta, Canada 2014 (Updated 2015)
Grade 7
Strand: Patterns and Relations (Variables and Equations) General Outcome: Represent algebraic expressions in multiple ways.
Specific Outcomes
It is expected that students will:
Achievement Indicators
The following set of indicators may be used to determine whether students have met the corresponding specific outcome.
3. Demonstrate an understanding of preservation of equality by: • modelling preservation of equality, concretely,
pictorially and symbolically • applying preservation of equality to solve
equations. [C, CN, PS, R, V]
Model the preservation of equality for each of the four operations, using concrete materials or pictorial representations; explain the process orally; and record the process symbolically.
Write equivalent forms of a given equation by applying the preservation of equality, and verify, using concrete materials; e.g., 3b = 12 is the same as 3b + 5 = 12 + 5 or 2r = 7 is the same as 3(2r) = 3(7).
Solve a given problem by applying preservation of equality.
4. Explain the difference between an expression and an equation. [C, CN]
Identify and provide an example of a constant term, numerical coefficient and variable in an expression and an equation.
Explain what a variable is and how it is used in a given expression. Provide an example of an expression and an equation, and explain how they are similar and
different.
5. Evaluate an expression, given the value of the variable(s). [CN, R]
Substitute a value for an unknown in a given expression, and evaluate the expression.
6. Model and solve, concretely, pictorially and symbolically, problems that can be represented by one-step linear equations of the form x + a = b, where a and b are integers. [CN, PS, R, V]
Represent a given problem with a linear equation; and solve the equation, using concrete models, e.g., counters, integer tiles.
Draw a visual representation of the steps required to solve a given linear equation. Solve a given problem, using a linear equation. Verify the solution to a given linear equation, using concrete materials and diagrams. Substitute a possible solution for the variable in a given linear equation into the original linear
equation to verify the equality.
[C] Communication [PS] Problem Solving [CN] Connections [R] Reasoning [ME] Mental Mathematics [T] Technology and Estimation [V] Visualization
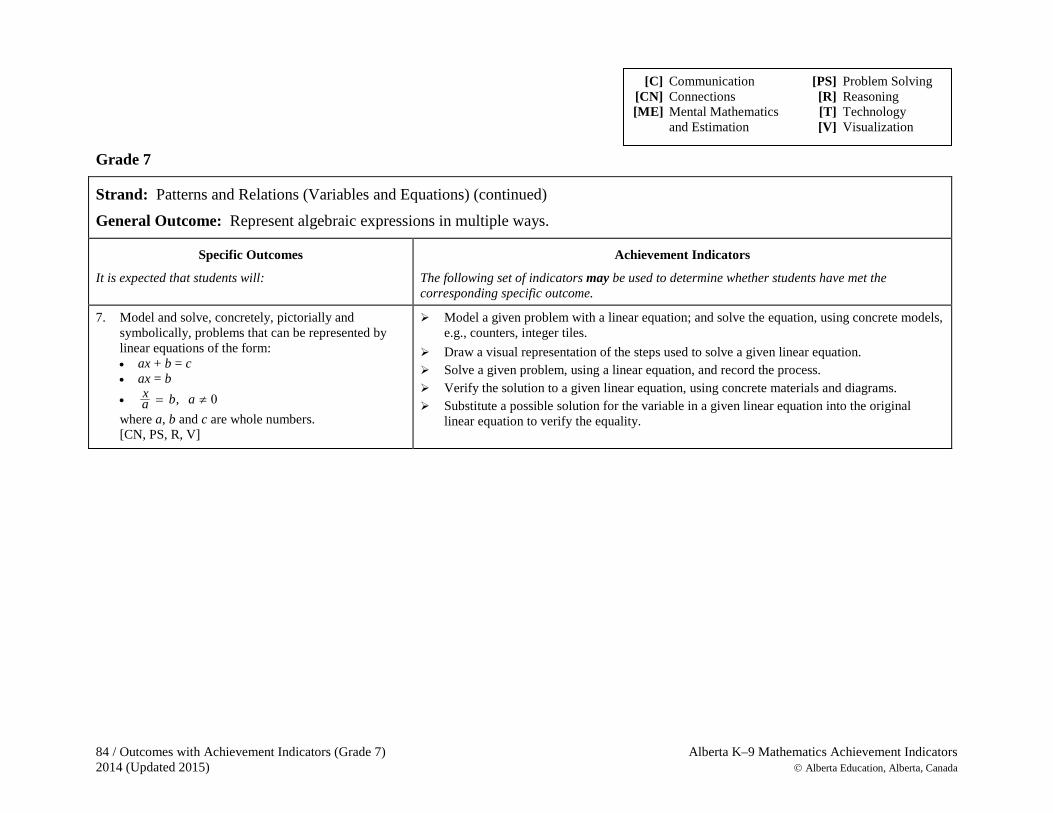
84 / Outcomes with Achievement Indicators (Grade 7) Alberta K–9 Mathematics Achievement Indicators 2014 (Updated 2015) Alberta Education, Alberta, Canada
Grade 7
Strand: Patterns and Relations (Variables and Equations) (continued) General Outcome: Represent algebraic expressions in multiple ways.
Specific Outcomes
It is expected that students will:
Achievement Indicators
The following set of indicators may be used to determine whether students have met the corresponding specific outcome.
7. Model and solve, concretely, pictorially and symbolically, problems that can be represented by linear equations of the form: • ax + b = c • ax = b • ,x b aa = ≠ 0 where a, b and c are whole numbers. [CN, PS, R, V]
Model a given problem with a linear equation; and solve the equation, using concrete models, e.g., counters, integer tiles.
Draw a visual representation of the steps used to solve a given linear equation. Solve a given problem, using a linear equation, and record the process. Verify the solution to a given linear equation, using concrete materials and diagrams. Substitute a possible solution for the variable in a given linear equation into the original
linear equation to verify the equality.
[C] Communication [PS] Problem Solving [CN] Connections [R] Reasoning [ME] Mental Mathematics [T] Technology and Estimation [V] Visualization
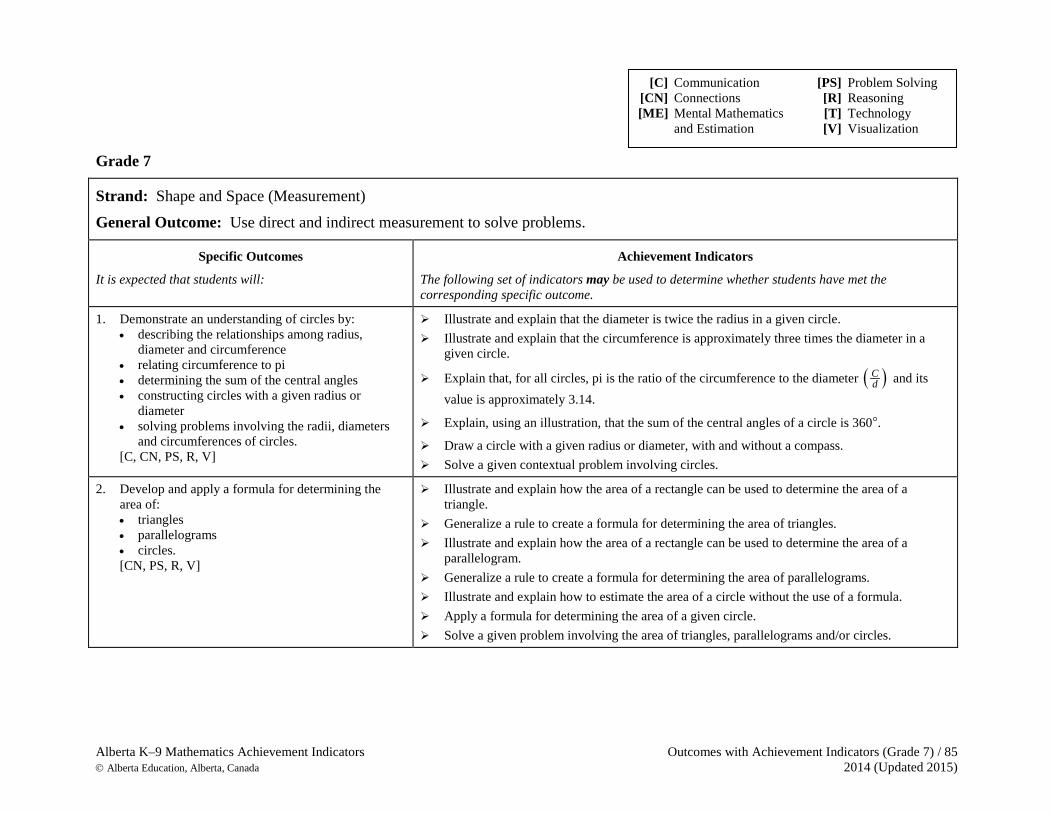
Alberta K–9 Mathematics Achievement Indicators Outcomes with Achievement Indicators (Grade 7) / 85 Alberta Education, Alberta, Canada 2014 (Updated 2015)
Grade 7
Strand: Shape and Space (Measurement) General Outcome: Use direct and indirect measurement to solve problems.
Specific Outcomes
It is expected that students will:
Achievement Indicators
The following set of indicators may be used to determine whether students have met the corresponding specific outcome.
1. Demonstrate an understanding of circles by: • describing the relationships among radius,
diameter and circumference • relating circumference to pi • determining the sum of the central angles • constructing circles with a given radius or
diameter • solving problems involving the radii, diameters
and circumferences of circles. [C, CN, PS, R, V]
Illustrate and explain that the diameter is twice the radius in a given circle. Illustrate and explain that the circumference is approximately three times the diameter in a
given circle.
Explain that, for all circles, pi is the ratio of the circumference to the diameter ( )Cd and its
value is approximately 3.14.
Explain, using an illustration, that the sum of the central angles of a circle is 360°.
Draw a circle with a given radius or diameter, with and without a compass. Solve a given contextual problem involving circles.
2. Develop and apply a formula for determining the area of: • triangles • parallelograms • circles. [CN, PS, R, V]
Illustrate and explain how the area of a rectangle can be used to determine the area of a triangle.
Generalize a rule to create a formula for determining the area of triangles. Illustrate and explain how the area of a rectangle can be used to determine the area of a
parallelogram. Generalize a rule to create a formula for determining the area of parallelograms. Illustrate and explain how to estimate the area of a circle without the use of a formula. Apply a formula for determining the area of a given circle. Solve a given problem involving the area of triangles, parallelograms and/or circles.
[C] Communication [PS] Problem Solving [CN] Connections [R] Reasoning [ME] Mental Mathematics [T] Technology and Estimation [V] Visualization
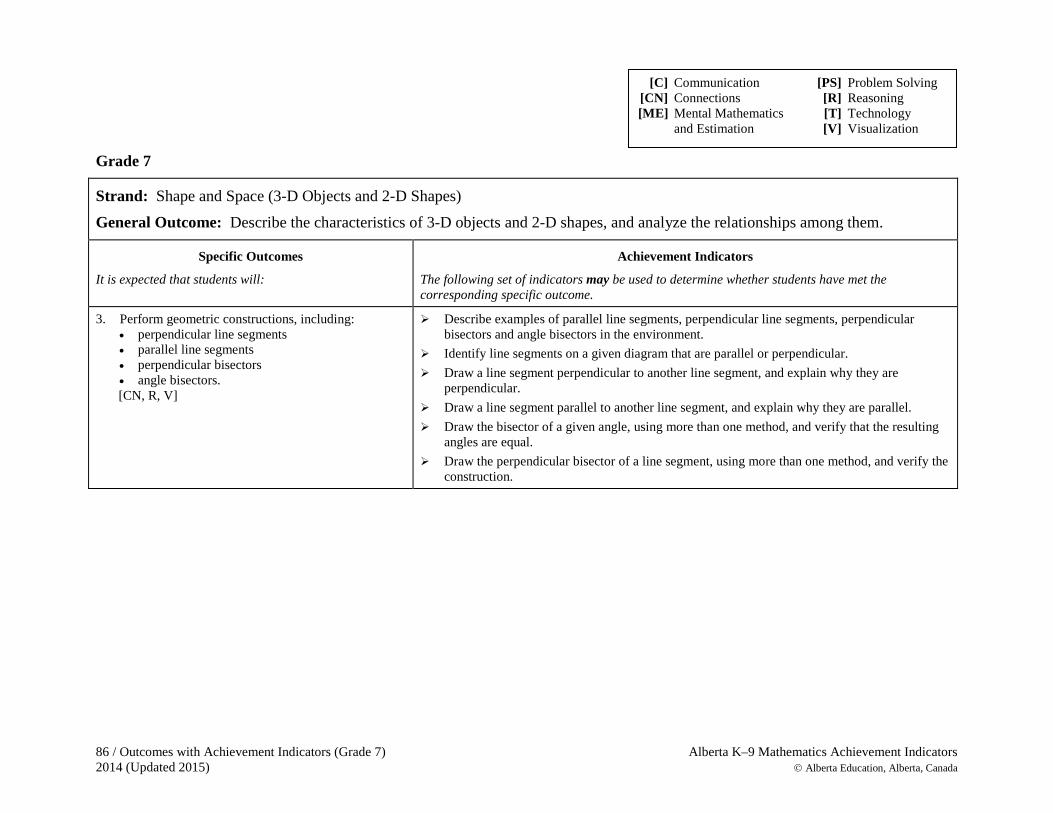
86 / Outcomes with Achievement Indicators (Grade 7) Alberta K–9 Mathematics Achievement Indicators 2014 (Updated 2015) Alberta Education, Alberta, Canada
Grade 7
Strand: Shape and Space (3-D Objects and 2-D Shapes) General Outcome: Describe the characteristics of 3-D objects and 2-D shapes, and analyze the relationships among them.
Specific Outcomes
It is expected that students will:
Achievement Indicators
The following set of indicators may be used to determine whether students have met the corresponding specific outcome.
3. Perform geometric constructions, including: • perpendicular line segments • parallel line segments • perpendicular bisectors • angle bisectors. [CN, R, V]
Describe examples of parallel line segments, perpendicular line segments, perpendicular bisectors and angle bisectors in the environment.
Identify line segments on a given diagram that are parallel or perpendicular. Draw a line segment perpendicular to another line segment, and explain why they are
perpendicular. Draw a line segment parallel to another line segment, and explain why they are parallel. Draw the bisector of a given angle, using more than one method, and verify that the resulting
angles are equal. Draw the perpendicular bisector of a line segment, using more than one method, and verify the
construction.
[C] Communication [PS] Problem Solving [CN] Connections [R] Reasoning [ME] Mental Mathematics [T] Technology and Estimation [V] Visualization
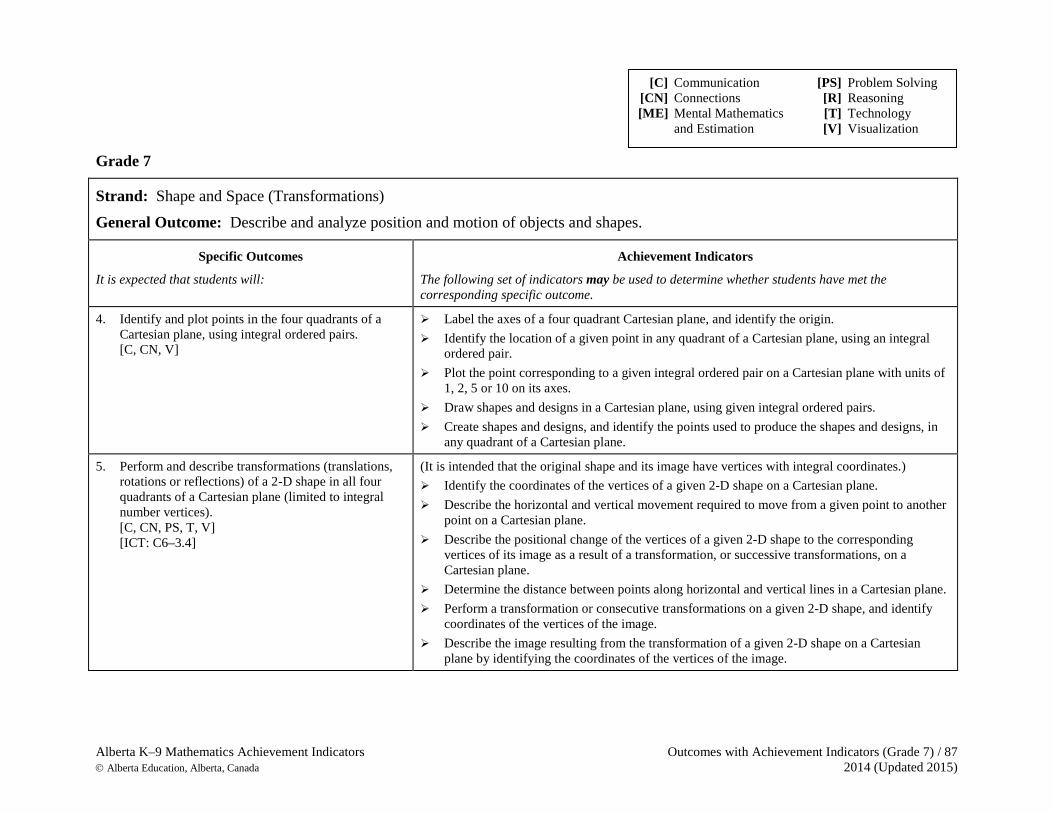
Alberta K–9 Mathematics Achievement Indicators Outcomes with Achievement Indicators (Grade 7) / 87 Alberta Education, Alberta, Canada 2014 (Updated 2015)
Grade 7
Strand: Shape and Space (Transformations)
General Outcome: Describe and analyze position and motion of objects and shapes.
Specific Outcomes
It is expected that students will:
Achievement Indicators
The following set of indicators may be used to determine whether students have met the corresponding specific outcome.
4. Identify and plot points in the four quadrants of a Cartesian plane, using integral ordered pairs. [C, CN, V]
Label the axes of a four quadrant Cartesian plane, and identify the origin. Identify the location of a given point in any quadrant of a Cartesian plane, using an integral
ordered pair. Plot the point corresponding to a given integral ordered pair on a Cartesian plane with units of
1, 2, 5 or 10 on its axes. Draw shapes and designs in a Cartesian plane, using given integral ordered pairs. Create shapes and designs, and identify the points used to produce the shapes and designs, in
any quadrant of a Cartesian plane.
5. Perform and describe transformations (translations, rotations or reflections) of a 2-D shape in all four quadrants of a Cartesian plane (limited to integral number vertices). [C, CN, PS, T, V] [ICT: C6–3.4]
(It is intended that the original shape and its image have vertices with integral coordinates.) Identify the coordinates of the vertices of a given 2-D shape on a Cartesian plane. Describe the horizontal and vertical movement required to move from a given point to another
point on a Cartesian plane. Describe the positional change of the vertices of a given 2-D shape to the corresponding
vertices of its image as a result of a transformation, or successive transformations, on a Cartesian plane.
Determine the distance between points along horizontal and vertical lines in a Cartesian plane. Perform a transformation or consecutive transformations on a given 2-D shape, and identify
coordinates of the vertices of the image. Describe the image resulting from the transformation of a given 2-D shape on a Cartesian
plane by identifying the coordinates of the vertices of the image.
[C] Communication [PS] Problem Solving [CN] Connections [R] Reasoning [ME] Mental Mathematics [T] Technology and Estimation [V] Visualization
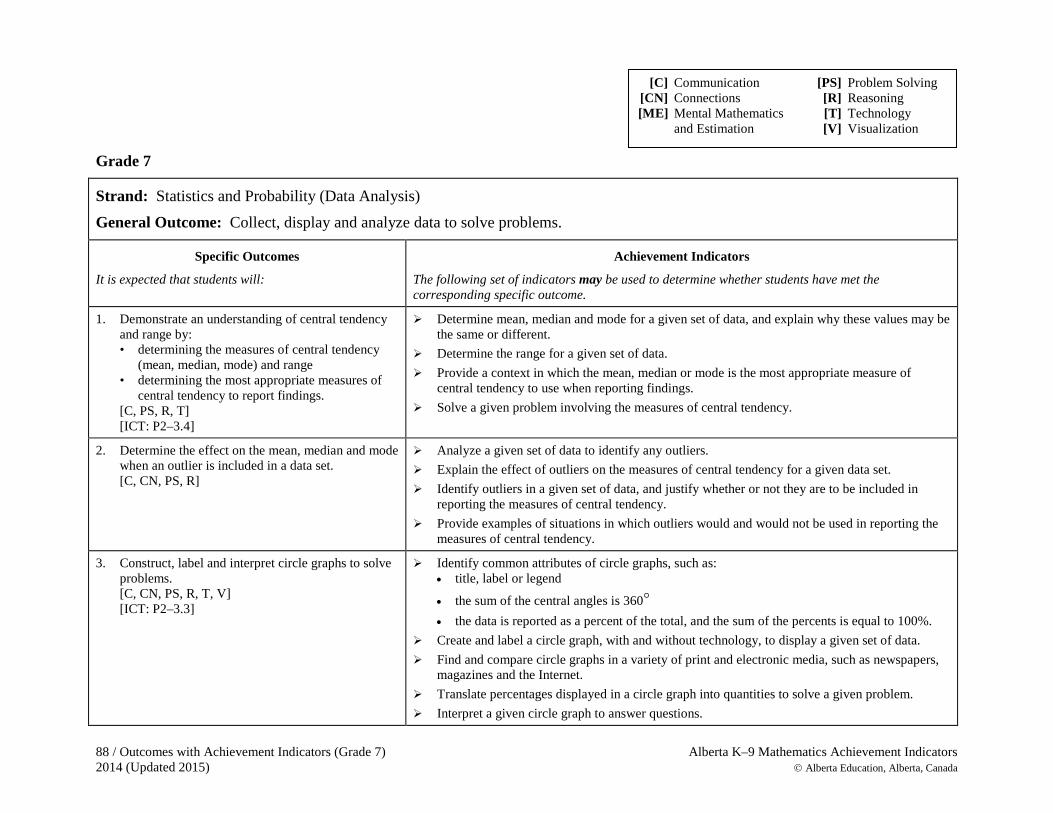
88 / Outcomes with Achievement Indicators (Grade 7) Alberta K–9 Mathematics Achievement Indicators 2014 (Updated 2015) Alberta Education, Alberta, Canada
Grade 7
Strand: Statistics and Probability (Data Analysis) General Outcome: Collect, display and analyze data to solve problems.
Specific Outcomes
It is expected that students will:
Achievement Indicators
The following set of indicators may be used to determine whether students have met the corresponding specific outcome.
1. Demonstrate an understanding of central tendency and range by: • determining the measures of central tendency
(mean, median, mode) and range • determining the most appropriate measures of
central tendency to report findings. [C, PS, R, T] [ICT: P2–3.4]
Determine mean, median and mode for a given set of data, and explain why these values may be the same or different.
Determine the range for a given set of data. Provide a context in which the mean, median or mode is the most appropriate measure of
central tendency to use when reporting findings. Solve a given problem involving the measures of central tendency.
2. Determine the effect on the mean, median and mode when an outlier is included in a data set. [C, CN, PS, R]
Analyze a given set of data to identify any outliers. Explain the effect of outliers on the measures of central tendency for a given data set. Identify outliers in a given set of data, and justify whether or not they are to be included in
reporting the measures of central tendency. Provide examples of situations in which outliers would and would not be used in reporting the
measures of central tendency.
3. Construct, label and interpret circle graphs to solve problems. [C, CN, PS, R, T, V] [ICT: P2–3.3]
Identify common attributes of circle graphs, such as: • title, label or legend
• the sum of the central angles is 360° • the data is reported as a percent of the total, and the sum of the percents is equal to 100%.
Create and label a circle graph, with and without technology, to display a given set of data. Find and compare circle graphs in a variety of print and electronic media, such as newspapers,
magazines and the Internet. Translate percentages displayed in a circle graph into quantities to solve a given problem. Interpret a given circle graph to answer questions.
[C] Communication [PS] Problem Solving [CN] Connections [R] Reasoning [ME] Mental Mathematics [T] Technology and Estimation [V] Visualization
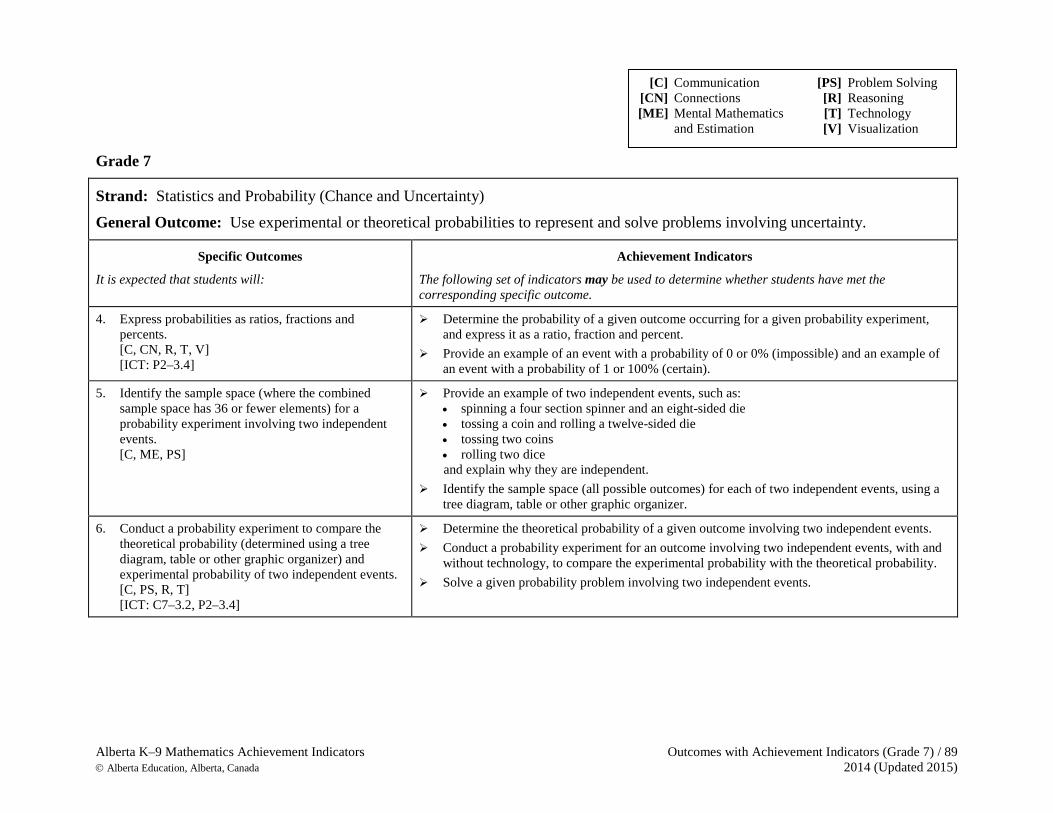
Alberta K–9 Mathematics Achievement Indicators Outcomes with Achievement Indicators (Grade 7) / 89 Alberta Education, Alberta, Canada 2014 (Updated 2015)
Grade 7
Strand: Statistics and Probability (Chance and Uncertainty) General Outcome: Use experimental or theoretical probabilities to represent and solve problems involving uncertainty.
Specific Outcomes
It is expected that students will:
Achievement Indicators
The following set of indicators may be used to determine whether students have met the corresponding specific outcome.
4. Express probabilities as ratios, fractions and percents. [C, CN, R, T, V] [ICT: P2–3.4]
Determine the probability of a given outcome occurring for a given probability experiment, and express it as a ratio, fraction and percent.
Provide an example of an event with a probability of 0 or 0% (impossible) and an example of an event with a probability of 1 or 100% (certain).
5. Identify the sample space (where the combined sample space has 36 or fewer elements) for a probability experiment involving two independent events. [C, ME, PS]
Provide an example of two independent events, such as: • spinning a four section spinner and an eight-sided die • tossing a coin and rolling a twelve-sided die • tossing two coins • rolling two dice and explain why they are independent.
Identify the sample space (all possible outcomes) for each of two independent events, using a tree diagram, table or other graphic organizer.
6. Conduct a probability experiment to compare the theoretical probability (determined using a tree diagram, table or other graphic organizer) and experimental probability of two independent events. [C, PS, R, T] [ICT: C7–3.2, P2–3.4]
Determine the theoretical probability of a given outcome involving two independent events. Conduct a probability experiment for an outcome involving two independent events, with and
without technology, to compare the experimental probability with the theoretical probability. Solve a given probability problem involving two independent events.
[C] Communication [PS] Problem Solving [CN] Connections [R] Reasoning [ME] Mental Mathematics [T] Technology and Estimation [V] Visualization

90 / Outcomes with Achievement Indicators (Grade 8) Alberta K–9 Mathematics Achievement Indicators 2014 (Updated 2015) Alberta Education, Alberta, Canada
Grade 8
Strand: Number General Outcome: Develop number sense.
Specific Outcomes
It is expected that students will:
Achievement Indicators
The following set of indicators may be used to determine whether students have met the corresponding specific outcome.
1. Demonstrate an understanding of perfect squares and square roots, concretely, pictorially and symbolically (limited to whole numbers). [C, CN, R, V]
Represent a given perfect square as a square region, using materials such as grid paper or square shapes.
Determine the factors of a given perfect square, and explain why one of the factors is the square root and the others are not.
Determine whether or not a given number is a perfect square, using materials and strategies such as square shapes, grid paper or prime factorization, and explain the reasoning.
Determine the square root of a given perfect square, and record it symbolically. Determine the square of a given number.
2. Determine the approximate square root of numbers that are not perfect squares (limited to whole numbers). [C, CN, ME, R, T] [ICT: P2–3.4]
Estimate the square root of a given number that is not a perfect square, using the roots of perfect squares as benchmarks.
Approximate the square root of a given number that is not a perfect square, using technology; e.g., a calculator, a computer.
Explain why the square root of a number shown on a calculator may be an approximation. Identify a number with a square root that is between two given numbers.
[C] Communication [PS] Problem Solving [CN] Connections [R] Reasoning [ME] Mental Mathematics [T] Technology and Estimation [V] Visualization
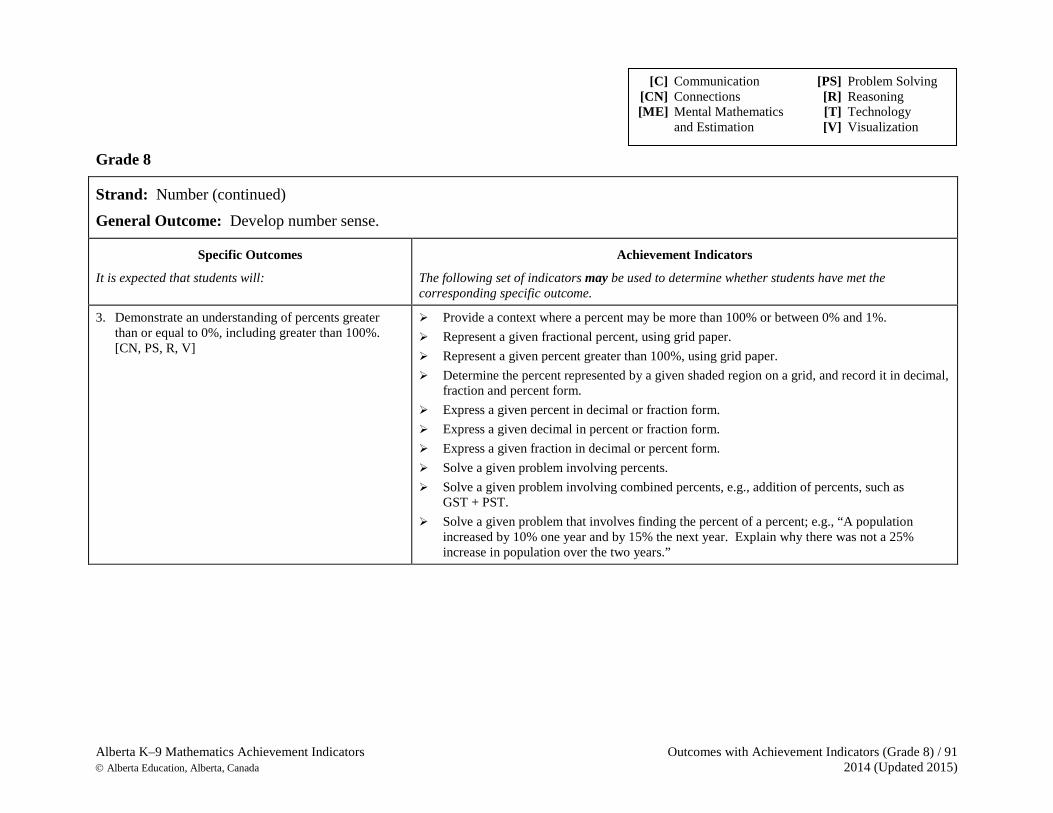
Alberta K–9 Mathematics Achievement Indicators Outcomes with Achievement Indicators (Grade 8) / 91 Alberta Education, Alberta, Canada 2014 (Updated 2015)
Grade 8
Strand: Number (continued) General Outcome: Develop number sense.
Specific Outcomes
It is expected that students will:
Achievement Indicators
The following set of indicators may be used to determine whether students have met the corresponding specific outcome.
3. Demonstrate an understanding of percents greater than or equal to 0%, including greater than 100%. [CN, PS, R, V]
Provide a context where a percent may be more than 100% or between 0% and 1%. Represent a given fractional percent, using grid paper. Represent a given percent greater than 100%, using grid paper. Determine the percent represented by a given shaded region on a grid, and record it in decimal,
fraction and percent form. Express a given percent in decimal or fraction form. Express a given decimal in percent or fraction form. Express a given fraction in decimal or percent form. Solve a given problem involving percents. Solve a given problem involving combined percents, e.g., addition of percents, such as
GST + PST. Solve a given problem that involves finding the percent of a percent; e.g., “A population
increased by 10% one year and by 15% the next year. Explain why there was not a 25% increase in population over the two years.”
[C] Communication [PS] Problem Solving [CN] Connections [R] Reasoning [ME] Mental Mathematics [T] Technology and Estimation [V] Visualization
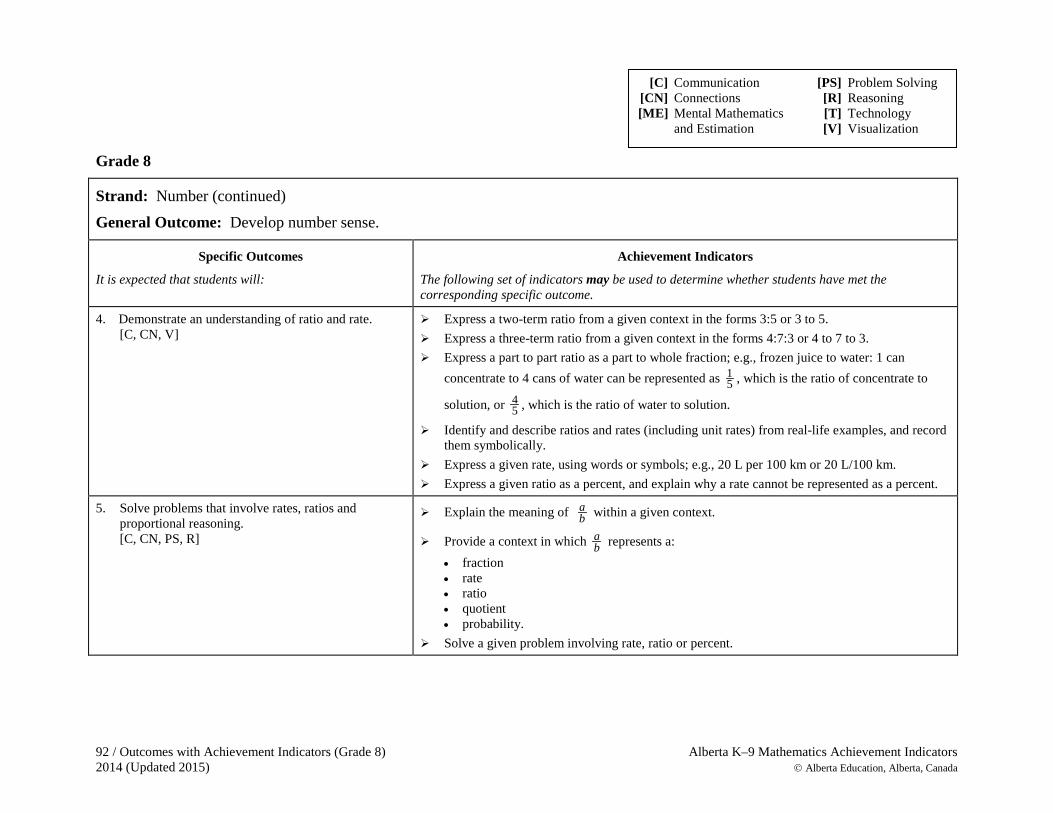
92 / Outcomes with Achievement Indicators (Grade 8) Alberta K–9 Mathematics Achievement Indicators 2014 (Updated 2015) Alberta Education, Alberta, Canada
Grade 8
Strand: Number (continued) General Outcome: Develop number sense.
Specific Outcomes
It is expected that students will:
Achievement Indicators
The following set of indicators may be used to determine whether students have met the corresponding specific outcome.
4. Demonstrate an understanding of ratio and rate. [C, CN, V]
Express a two-term ratio from a given context in the forms 3:5 or 3 to 5. Express a three-term ratio from a given context in the forms 4:7:3 or 4 to 7 to 3. Express a part to part ratio as a part to whole fraction; e.g., frozen juice to water: 1 can
concentrate to 4 cans of water can be represented as 15 , which is the ratio of concentrate to
solution, or 45 , which is the ratio of water to solution.
Identify and describe ratios and rates (including unit rates) from real-life examples, and record them symbolically.
Express a given rate, using words or symbols; e.g., 20 L per 100 km or 20 L/100 km. Express a given ratio as a percent, and explain why a rate cannot be represented as a percent.
5. Solve problems that involve rates, ratios and proportional reasoning. [C, CN, PS, R]
Explain the meaning of ab within a given context.
Provide a context in which ab represents a:
• fraction • rate • ratio • quotient • probability.
Solve a given problem involving rate, ratio or percent.
[C] Communication [PS] Problem Solving [CN] Connections [R] Reasoning [ME] Mental Mathematics [T] Technology and Estimation [V] Visualization
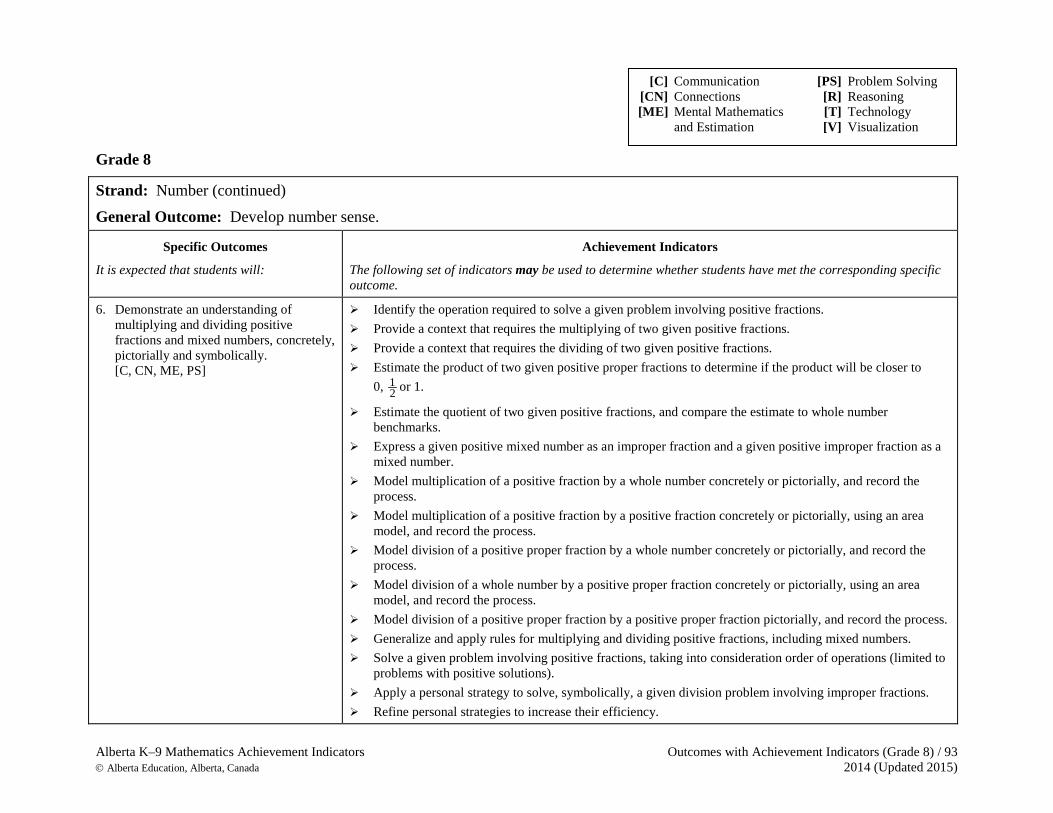
Alberta K–9 Mathematics Achievement Indicators Outcomes with Achievement Indicators (Grade 8) / 93 Alberta Education, Alberta, Canada 2014 (Updated 2015)
Grade 8
Strand: Number (continued) General Outcome: Develop number sense.
Specific Outcomes
It is expected that students will:
Achievement Indicators
The following set of indicators may be used to determine whether students have met the corresponding specific outcome.
6. Demonstrate an understanding of multiplying and dividing positive fractions and mixed numbers, concretely, pictorially and symbolically. [C, CN, ME, PS]
Identify the operation required to solve a given problem involving positive fractions. Provide a context that requires the multiplying of two given positive fractions. Provide a context that requires the dividing of two given positive fractions. Estimate the product of two given positive proper fractions to determine if the product will be closer to
0, 12 or 1.
Estimate the quotient of two given positive fractions, and compare the estimate to whole number benchmarks.
Express a given positive mixed number as an improper fraction and a given positive improper fraction as a mixed number.
Model multiplication of a positive fraction by a whole number concretely or pictorially, and record the process.
Model multiplication of a positive fraction by a positive fraction concretely or pictorially, using an area model, and record the process.
Model division of a positive proper fraction by a whole number concretely or pictorially, and record the process.
Model division of a whole number by a positive proper fraction concretely or pictorially, using an area model, and record the process.
Model division of a positive proper fraction by a positive proper fraction pictorially, and record the process. Generalize and apply rules for multiplying and dividing positive fractions, including mixed numbers. Solve a given problem involving positive fractions, taking into consideration order of operations (limited to
problems with positive solutions). Apply a personal strategy to solve, symbolically, a given division problem involving improper fractions. Refine personal strategies to increase their efficiency.
[C] Communication [PS] Problem Solving [CN] Connections [R] Reasoning [ME] Mental Mathematics [T] Technology and Estimation [V] Visualization
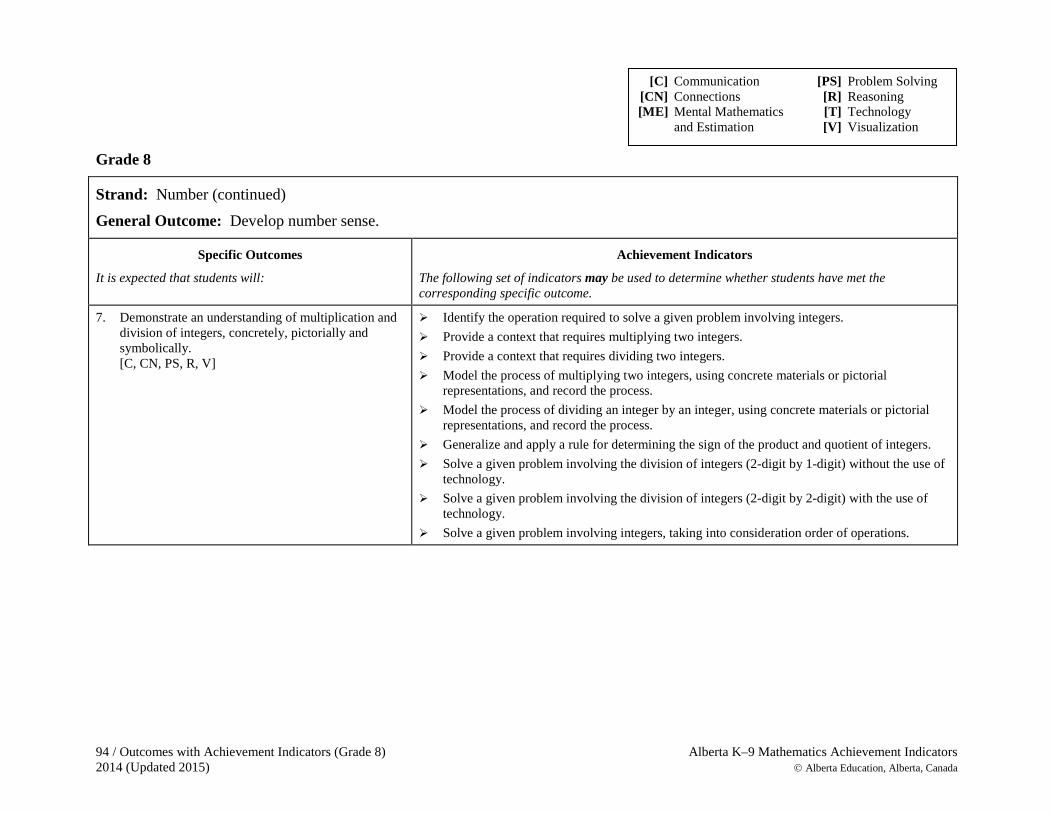
94 / Outcomes with Achievement Indicators (Grade 8) Alberta K–9 Mathematics Achievement Indicators 2014 (Updated 2015) Alberta Education, Alberta, Canada
Grade 8
Strand: Number (continued) General Outcome: Develop number sense.
Specific Outcomes
It is expected that students will:
Achievement Indicators
The following set of indicators may be used to determine whether students have met the corresponding specific outcome.
7. Demonstrate an understanding of multiplication and division of integers, concretely, pictorially and symbolically. [C, CN, PS, R, V]
Identify the operation required to solve a given problem involving integers. Provide a context that requires multiplying two integers. Provide a context that requires dividing two integers. Model the process of multiplying two integers, using concrete materials or pictorial
representations, and record the process. Model the process of dividing an integer by an integer, using concrete materials or pictorial
representations, and record the process. Generalize and apply a rule for determining the sign of the product and quotient of integers. Solve a given problem involving the division of integers (2-digit by 1-digit) without the use of
technology. Solve a given problem involving the division of integers (2-digit by 2-digit) with the use of
technology. Solve a given problem involving integers, taking into consideration order of operations.
[C] Communication [PS] Problem Solving [CN] Connections [R] Reasoning [ME] Mental Mathematics [T] Technology and Estimation [V] Visualization
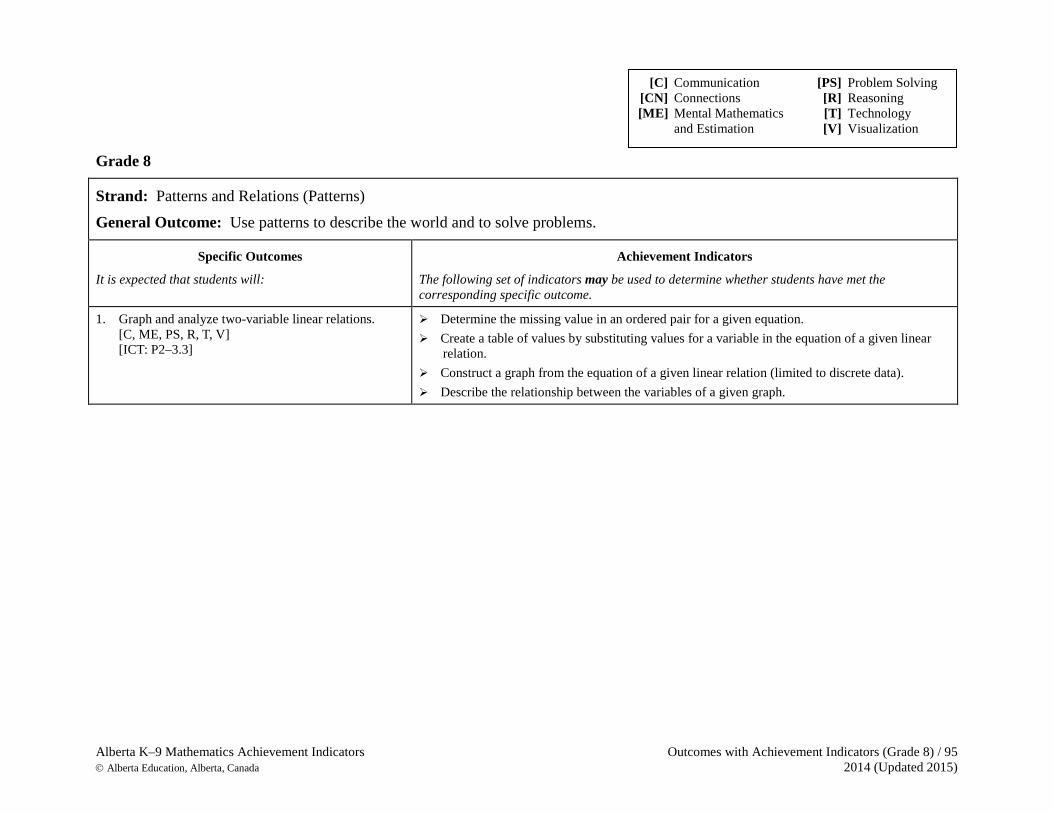
Alberta K–9 Mathematics Achievement Indicators Outcomes with Achievement Indicators (Grade 8) / 95 Alberta Education, Alberta, Canada 2014 (Updated 2015)
Grade 8
Strand: Patterns and Relations (Patterns) General Outcome: Use patterns to describe the world and to solve problems.
Specific Outcomes
It is expected that students will:
Achievement Indicators
The following set of indicators may be used to determine whether students have met the corresponding specific outcome.
1. Graph and analyze two-variable linear relations. [C, ME, PS, R, T, V] [ICT: P2–3.3]
Determine the missing value in an ordered pair for a given equation. Create a table of values by substituting values for a variable in the equation of a given linear
relation. Construct a graph from the equation of a given linear relation (limited to discrete data). Describe the relationship between the variables of a given graph.
[C] Communication [PS] Problem Solving [CN] Connections [R] Reasoning [ME] Mental Mathematics [T] Technology and Estimation [V] Visualization
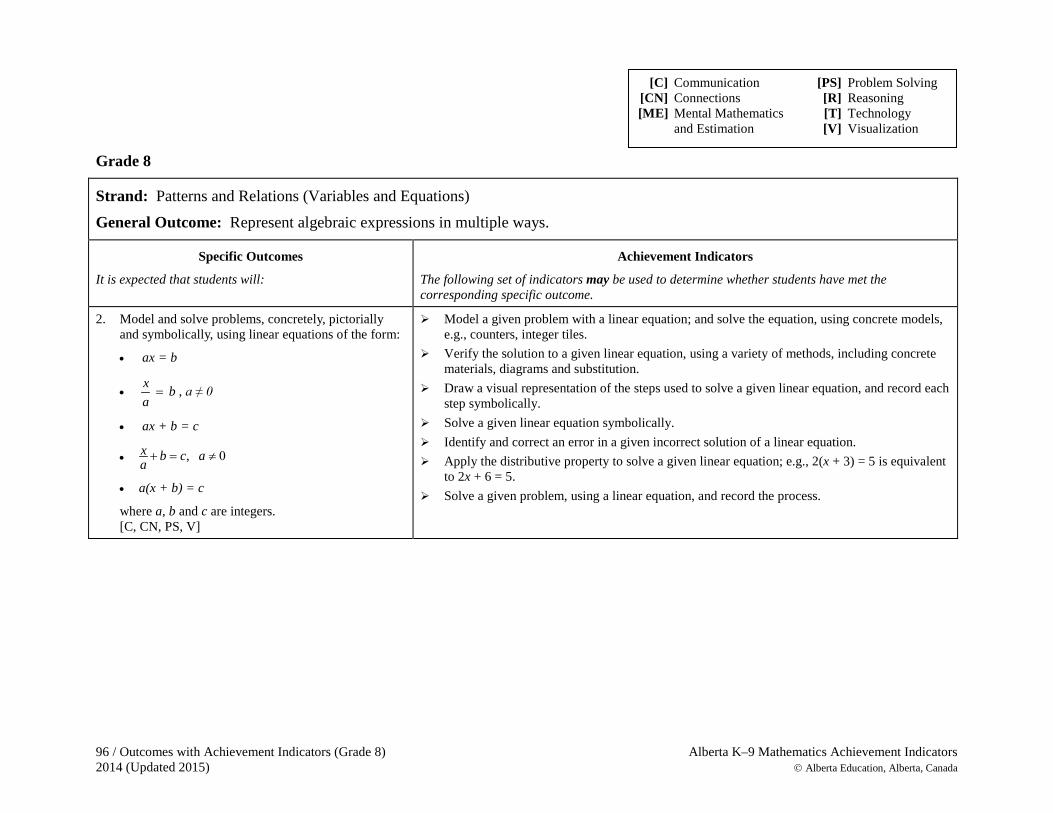
96 / Outcomes with Achievement Indicators (Grade 8) Alberta K–9 Mathematics Achievement Indicators 2014 (Updated 2015) Alberta Education, Alberta, Canada
Grade 8
Strand: Patterns and Relations (Variables and Equations) General Outcome: Represent algebraic expressions in multiple ways.
Specific Outcomes
It is expected that students will:
Achievement Indicators
The following set of indicators may be used to determine whether students have met the corresponding specific outcome.
2. Model and solve problems, concretely, pictorially and symbolically, using linear equations of the form:
• ax = b
• x ba
= , a ≠ 0
• ax + b = c
• ,x b c aa
+ = ≠ 0
• a(x + b) = c
where a, b and c are integers. [C, CN, PS, V]
Model a given problem with a linear equation; and solve the equation, using concrete models, e.g., counters, integer tiles.
Verify the solution to a given linear equation, using a variety of methods, including concrete materials, diagrams and substitution.
Draw a visual representation of the steps used to solve a given linear equation, and record each step symbolically.
Solve a given linear equation symbolically. Identify and correct an error in a given incorrect solution of a linear equation. Apply the distributive property to solve a given linear equation; e.g., 2(x + 3) = 5 is equivalent
to 2x + 6 = 5. Solve a given problem, using a linear equation, and record the process.
[C] Communication [PS] Problem Solving [CN] Connections [R] Reasoning [ME] Mental Mathematics [T] Technology and Estimation [V] Visualization
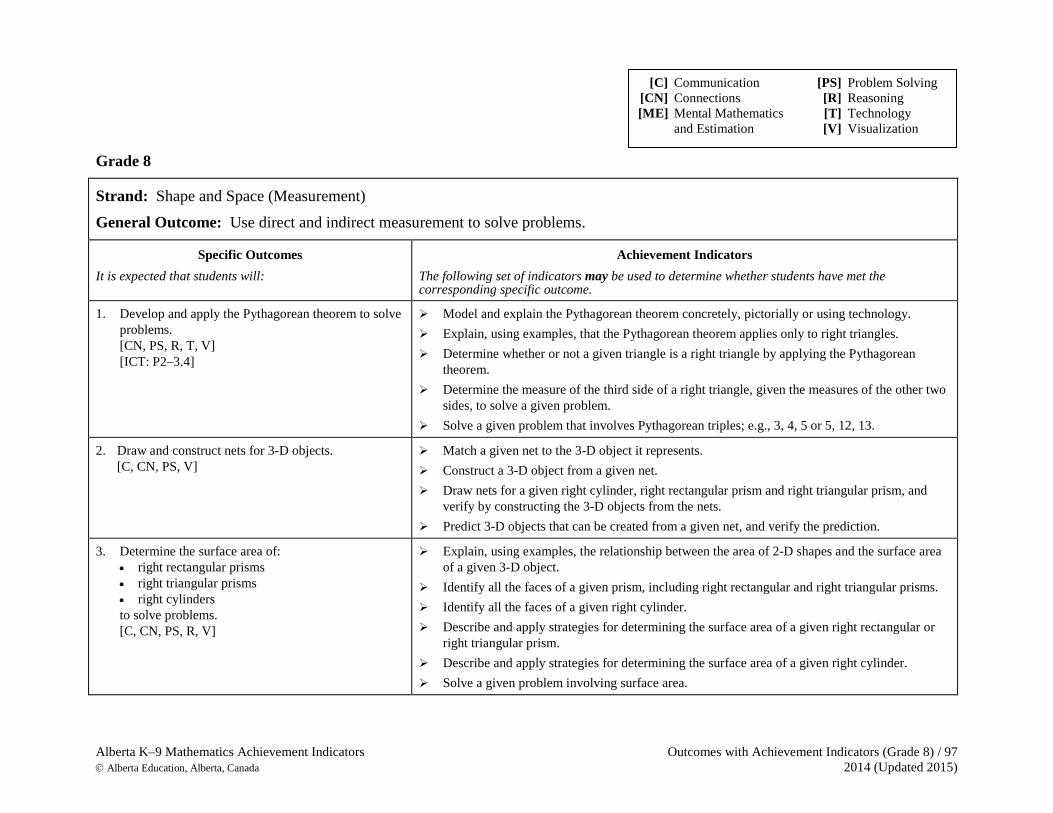
Alberta K–9 Mathematics Achievement Indicators Outcomes with Achievement Indicators (Grade 8) / 97 Alberta Education, Alberta, Canada 2014 (Updated 2015)
Grade 8
Strand: Shape and Space (Measurement) General Outcome: Use direct and indirect measurement to solve problems.
Specific Outcomes It is expected that students will:
Achievement Indicators The following set of indicators may be used to determine whether students have met the corresponding specific outcome.
1. Develop and apply the Pythagorean theorem to solve problems. [CN, PS, R, T, V] [ICT: P2–3.4]
Model and explain the Pythagorean theorem concretely, pictorially or using technology. Explain, using examples, that the Pythagorean theorem applies only to right triangles. Determine whether or not a given triangle is a right triangle by applying the Pythagorean
theorem. Determine the measure of the third side of a right triangle, given the measures of the other two
sides, to solve a given problem. Solve a given problem that involves Pythagorean triples; e.g., 3, 4, 5 or 5, 12, 13.
2. Draw and construct nets for 3-D objects. [C, CN, PS, V]
Match a given net to the 3-D object it represents. Construct a 3-D object from a given net. Draw nets for a given right cylinder, right rectangular prism and right triangular prism, and
verify by constructing the 3-D objects from the nets. Predict 3-D objects that can be created from a given net, and verify the prediction.
3. Determine the surface area of: • right rectangular prisms • right triangular prisms • right cylinders to solve problems. [C, CN, PS, R, V]
Explain, using examples, the relationship between the area of 2-D shapes and the surface area of a given 3-D object.
Identify all the faces of a given prism, including right rectangular and right triangular prisms. Identify all the faces of a given right cylinder. Describe and apply strategies for determining the surface area of a given right rectangular or
right triangular prism. Describe and apply strategies for determining the surface area of a given right cylinder. Solve a given problem involving surface area.
[C] Communication [PS] Problem Solving [CN] Connections [R] Reasoning [ME] Mental Mathematics [T] Technology and Estimation [V] Visualization
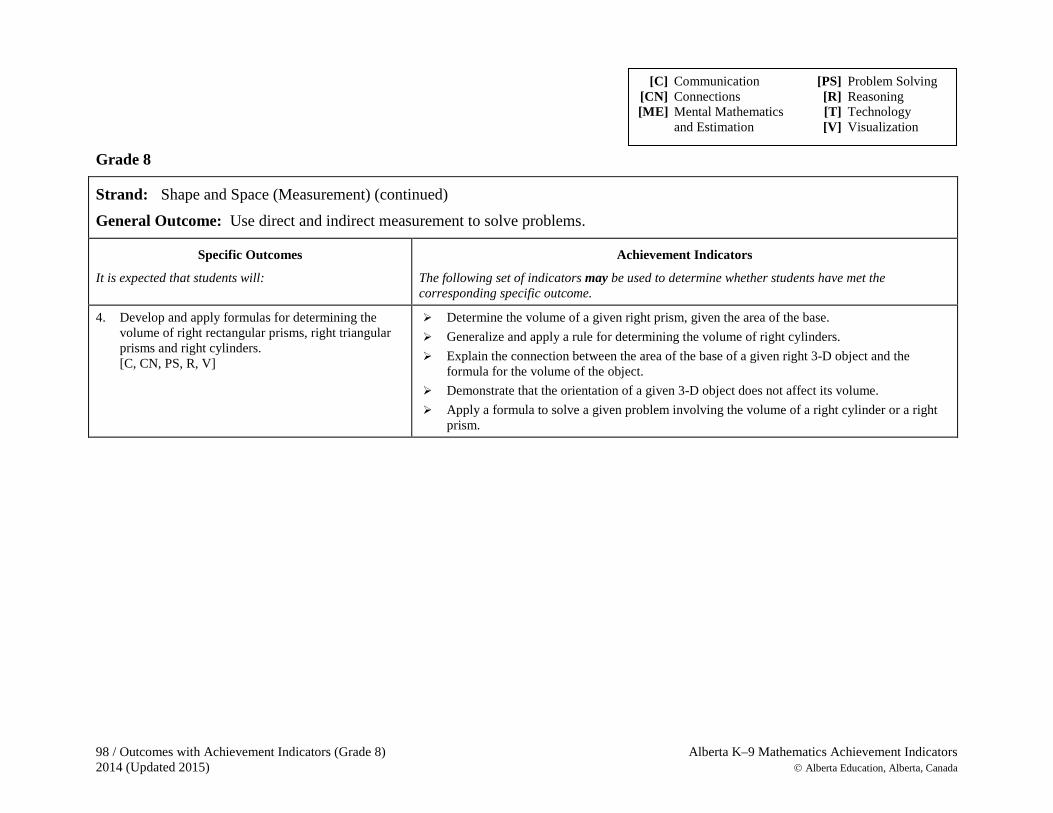
98 / Outcomes with Achievement Indicators (Grade 8) Alberta K–9 Mathematics Achievement Indicators 2014 (Updated 2015) Alberta Education, Alberta, Canada
Grade 8
Strand: Shape and Space (Measurement) (continued) General Outcome: Use direct and indirect measurement to solve problems.
Specific Outcomes
It is expected that students will:
Achievement Indicators
The following set of indicators may be used to determine whether students have met the corresponding specific outcome.
4. Develop and apply formulas for determining the volume of right rectangular prisms, right triangular prisms and right cylinders.
[C, CN, PS, R, V]
Determine the volume of a given right prism, given the area of the base. Generalize and apply a rule for determining the volume of right cylinders. Explain the connection between the area of the base of a given right 3-D object and the
formula for the volume of the object. Demonstrate that the orientation of a given 3-D object does not affect its volume. Apply a formula to solve a given problem involving the volume of a right cylinder or a right
prism.
[C] Communication [PS] Problem Solving [CN] Connections [R] Reasoning [ME] Mental Mathematics [T] Technology and Estimation [V] Visualization
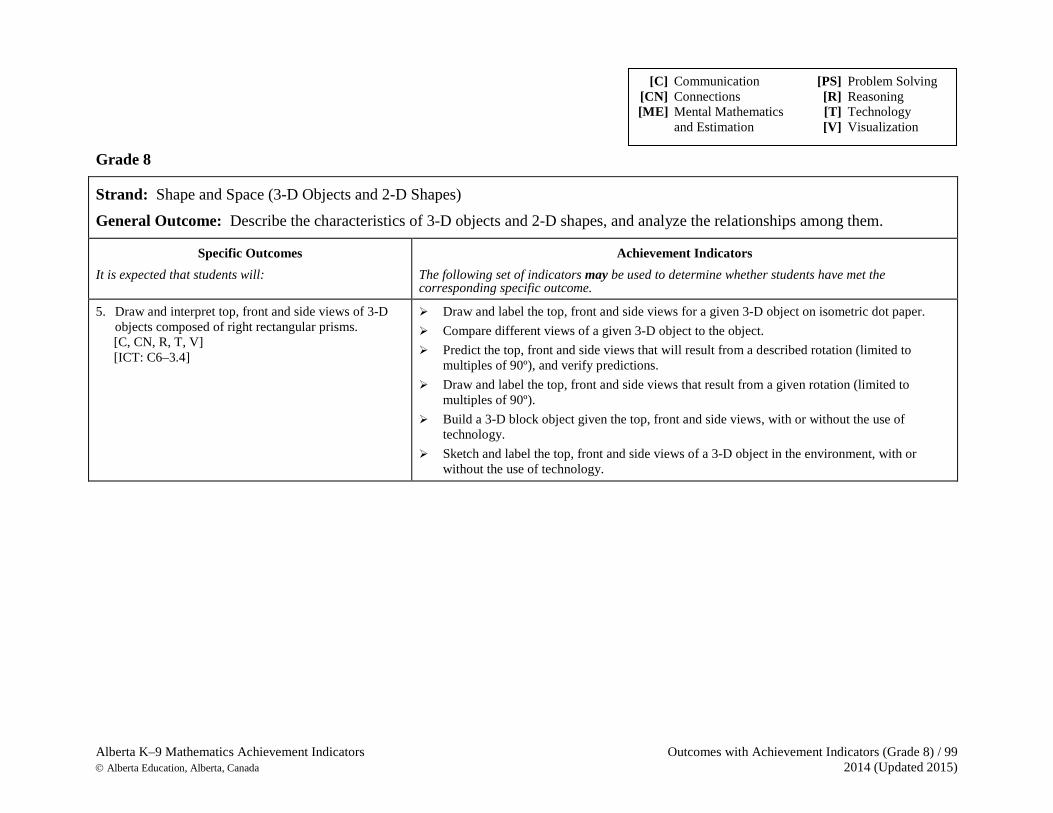
Alberta K–9 Mathematics Achievement Indicators Outcomes with Achievement Indicators (Grade 8) / 99 Alberta Education, Alberta, Canada 2014 (Updated 2015)
Grade 8
Strand: Shape and Space (3-D Objects and 2-D Shapes)
General Outcome: Describe the characteristics of 3-D objects and 2-D shapes, and analyze the relationships among them.
Specific Outcomes It is expected that students will:
Achievement Indicators The following set of indicators may be used to determine whether students have met the corresponding specific outcome.
5. Draw and interpret top, front and side views of 3-D objects composed of right rectangular prisms. [C, CN, R, T, V] [ICT: C6–3.4]
Draw and label the top, front and side views for a given 3-D object on isometric dot paper. Compare different views of a given 3-D object to the object. Predict the top, front and side views that will result from a described rotation (limited to
multiples of 90º), and verify predictions. Draw and label the top, front and side views that result from a given rotation (limited to
multiples of 90º). Build a 3-D block object given the top, front and side views, with or without the use of
technology. Sketch and label the top, front and side views of a 3-D object in the environment, with or
without the use of technology.
[C] Communication [PS] Problem Solving [CN] Connections [R] Reasoning [ME] Mental Mathematics [T] Technology and Estimation [V] Visualization
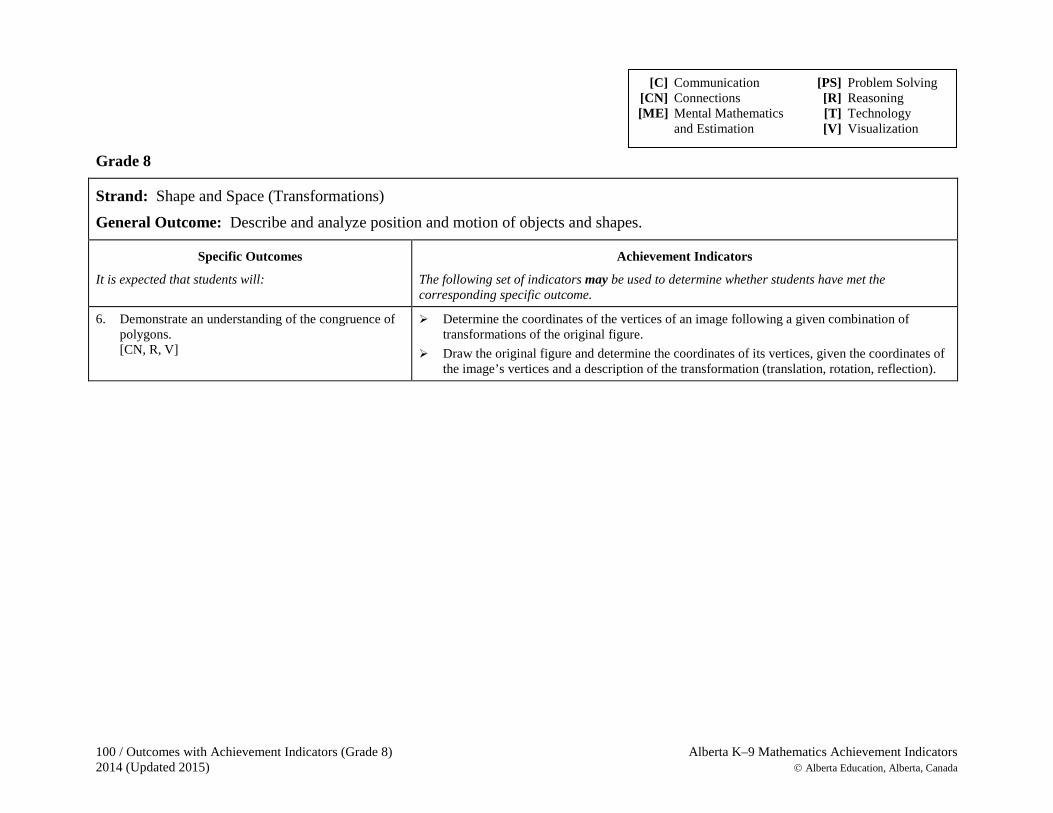
100 / Outcomes with Achievement Indicators (Grade 8) Alberta K–9 Mathematics Achievement Indicators 2014 (Updated 2015) Alberta Education, Alberta, Canada
Grade 8
Strand: Shape and Space (Transformations)
General Outcome: Describe and analyze position and motion of objects and shapes.
Specific Outcomes
It is expected that students will:
Achievement Indicators
The following set of indicators may be used to determine whether students have met the corresponding specific outcome.
6. Demonstrate an understanding of the congruence of polygons. [CN, R, V]
Determine the coordinates of the vertices of an image following a given combination of transformations of the original figure.
Draw the original figure and determine the coordinates of its vertices, given the coordinates of the image’s vertices and a description of the transformation (translation, rotation, reflection).
[C] Communication [PS] Problem Solving [CN] Connections [R] Reasoning [ME] Mental Mathematics [T] Technology and Estimation [V] Visualization
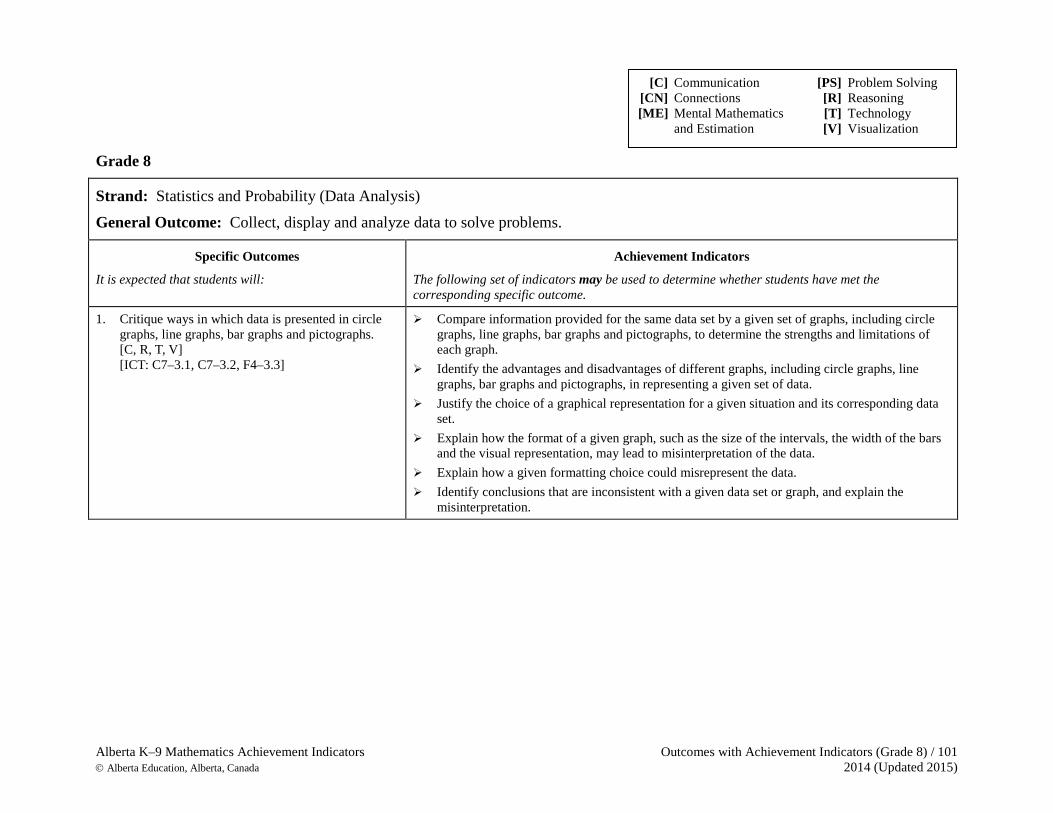
Alberta K–9 Mathematics Achievement Indicators Outcomes with Achievement Indicators (Grade 8) / 101 Alberta Education, Alberta, Canada 2014 (Updated 2015)
Grade 8
Strand: Statistics and Probability (Data Analysis) General Outcome: Collect, display and analyze data to solve problems.
Specific Outcomes
It is expected that students will:
Achievement Indicators
The following set of indicators may be used to determine whether students have met the corresponding specific outcome.
1. Critique ways in which data is presented in circle graphs, line graphs, bar graphs and pictographs. [C, R, T, V] [ICT: C7–3.1, C7–3.2, F4–3.3]
Compare information provided for the same data set by a given set of graphs, including circle graphs, line graphs, bar graphs and pictographs, to determine the strengths and limitations of each graph.
Identify the advantages and disadvantages of different graphs, including circle graphs, line graphs, bar graphs and pictographs, in representing a given set of data.
Justify the choice of a graphical representation for a given situation and its corresponding data set.
Explain how the format of a given graph, such as the size of the intervals, the width of the bars and the visual representation, may lead to misinterpretation of the data.
Explain how a given formatting choice could misrepresent the data. Identify conclusions that are inconsistent with a given data set or graph, and explain the
misinterpretation.
[C] Communication [PS] Problem Solving [CN] Connections [R] Reasoning [ME] Mental Mathematics [T] Technology and Estimation [V] Visualization
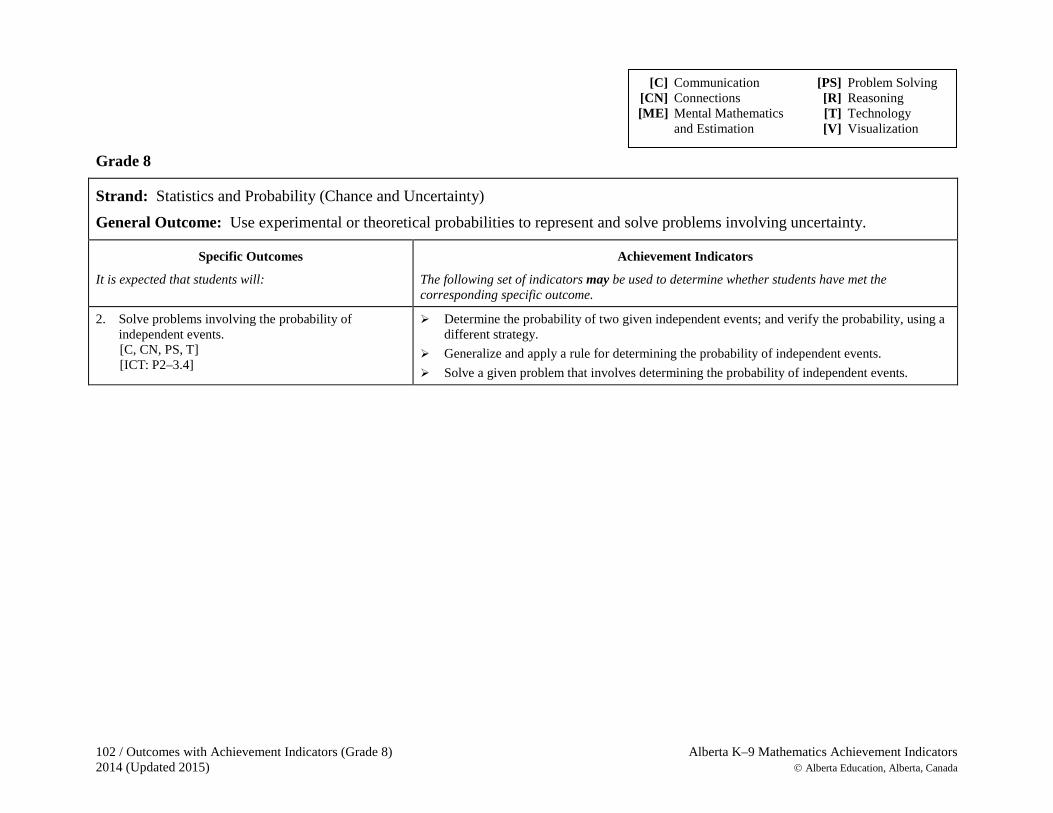
102 / Outcomes with Achievement Indicators (Grade 8) Alberta K–9 Mathematics Achievement Indicators 2014 (Updated 2015) Alberta Education, Alberta, Canada
Grade 8
Strand: Statistics and Probability (Chance and Uncertainty) General Outcome: Use experimental or theoretical probabilities to represent and solve problems involving uncertainty.
Specific Outcomes
It is expected that students will:
Achievement Indicators
The following set of indicators may be used to determine whether students have met the corresponding specific outcome.
2. Solve problems involving the probability of independent events. [C, CN, PS, T] [ICT: P2–3.4]
Determine the probability of two given independent events; and verify the probability, using a different strategy.
Generalize and apply a rule for determining the probability of independent events. Solve a given problem that involves determining the probability of independent events.
[C] Communication [PS] Problem Solving [CN] Connections [R] Reasoning [ME] Mental Mathematics [T] Technology and Estimation [V] Visualization
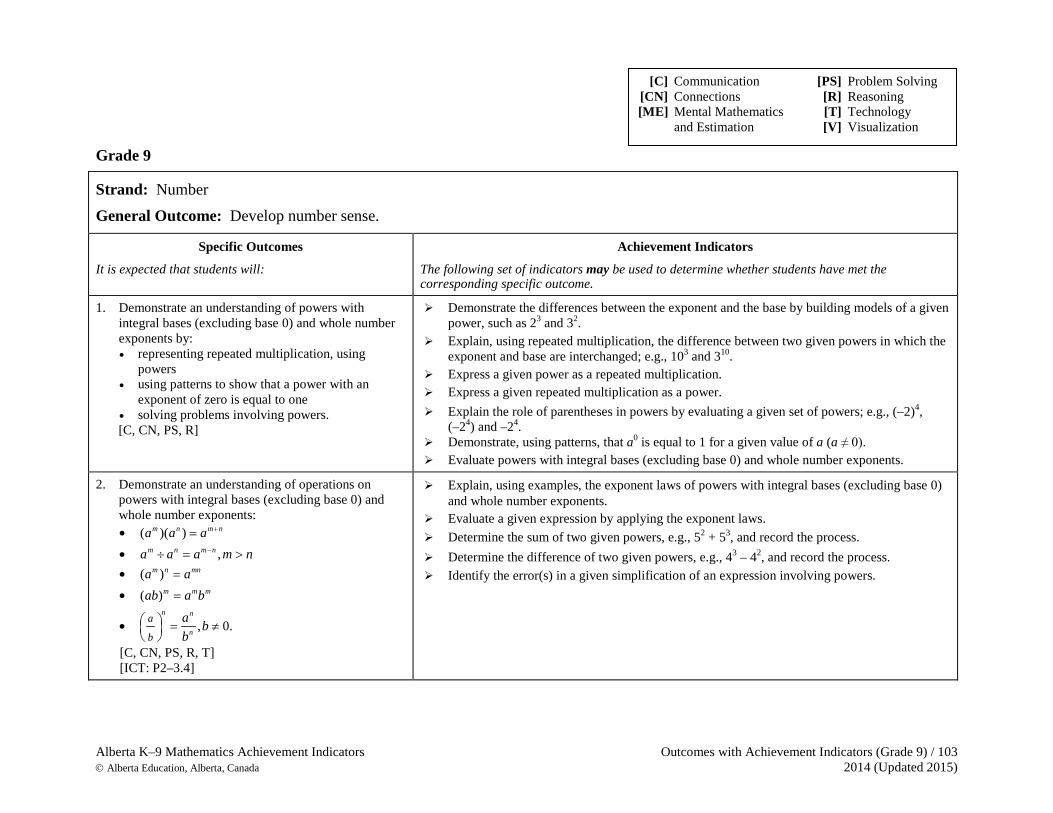
Alberta K–9 Mathematics Achievement Indicators Outcomes with Achievement Indicators (Grade 9) / 103 Alberta Education, Alberta, Canada 2014 (Updated 2015)
Grade 9
Strand: Number General Outcome: Develop number sense.
Specific Outcomes
It is expected that students will:
Achievement Indicators
The following set of indicators may be used to determine whether students have met the corresponding specific outcome.
1. Demonstrate an understanding of powers with integral bases (excluding base 0) and whole number exponents by: • representing repeated multiplication, using
powers • using patterns to show that a power with an
exponent of zero is equal to one • solving problems involving powers.
[C, CN, PS, R]
Demonstrate the differences between the exponent and the base by building models of a given power, such as 23 and 32.
Explain, using repeated multiplication, the difference between two given powers in which the exponent and base are interchanged; e.g., 103 and 310.
Express a given power as a repeated multiplication. Express a given repeated multiplication as a power. Explain the role of parentheses in powers by evaluating a given set of powers; e.g., (–2)4,
(–24) and –24. Demonstrate, using patterns, that a0 is equal to 1 for a given value of a (a ≠ 0). Evaluate powers with integral bases (excluding base 0) and whole number exponents.
2. Demonstrate an understanding of operations on powers with integral bases (excluding base 0) and whole number exponents: • ( )( )m n m na a a += • ,m n m na a a m n−÷ = > • ( )m n mna a= • ( )m m mab a b=
• , 0.n n
n
a
b
a bb
= ≠
[C, CN, PS, R, T] [ICT: P2–3.4]
Explain, using examples, the exponent laws of powers with integral bases (excluding base 0) and whole number exponents.
Evaluate a given expression by applying the exponent laws. Determine the sum of two given powers, e.g., 52 + 53, and record the process. Determine the difference of two given powers, e.g., 43 – 42, and record the process. Identify the error(s) in a given simplification of an expression involving powers.
[C] Communication [PS] Problem Solving [CN] Connections [R] Reasoning [ME] Mental Mathematics [T] Technology and Estimation [V] Visualization
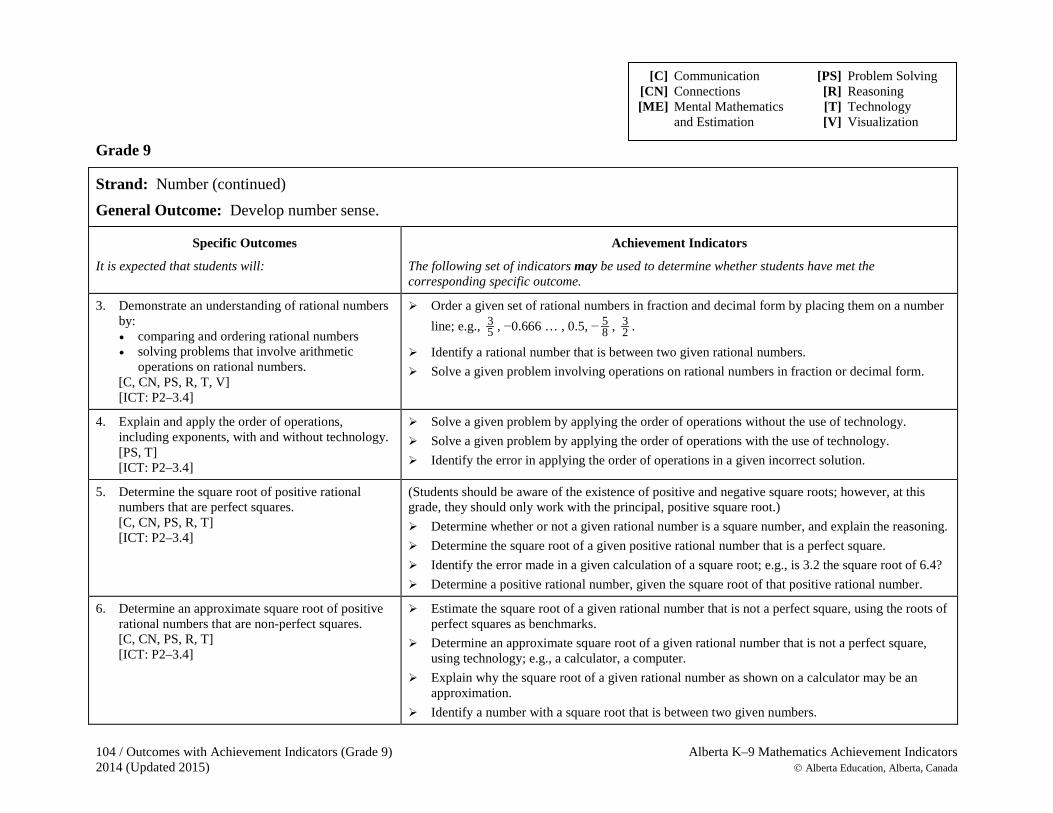
104 / Outcomes with Achievement Indicators (Grade 9) Alberta K–9 Mathematics Achievement Indicators 2014 (Updated 2015) Alberta Education, Alberta, Canada
Grade 9
Strand: Number (continued) General Outcome: Develop number sense.
Specific Outcomes
It is expected that students will:
Achievement Indicators
The following set of indicators may be used to determine whether students have met the corresponding specific outcome.
3. Demonstrate an understanding of rational numbers by: • comparing and ordering rational numbers • solving problems that involve arithmetic
operations on rational numbers. [C, CN, PS, R, T, V]
[ICT: P2–3.4]
Order a given set of rational numbers in fraction and decimal form by placing them on a number line; e.g., 3
5 , −0.666 … , 0.5, − 58 , 3
2 .
Identify a rational number that is between two given rational numbers. Solve a given problem involving operations on rational numbers in fraction or decimal form.
4. Explain and apply the order of operations, including exponents, with and without technology. [PS, T] [ICT: P2–3.4]
Solve a given problem by applying the order of operations without the use of technology. Solve a given problem by applying the order of operations with the use of technology. Identify the error in applying the order of operations in a given incorrect solution.
5. Determine the square root of positive rational numbers that are perfect squares.
[C, CN, PS, R, T] [ICT: P2–3.4]
(Students should be aware of the existence of positive and negative square roots; however, at this grade, they should only work with the principal, positive square root.) Determine whether or not a given rational number is a square number, and explain the reasoning. Determine the square root of a given positive rational number that is a perfect square. Identify the error made in a given calculation of a square root; e.g., is 3.2 the square root of 6.4? Determine a positive rational number, given the square root of that positive rational number.
6. Determine an approximate square root of positive rational numbers that are non-perfect squares.
[C, CN, PS, R, T] [ICT: P2–3.4]
Estimate the square root of a given rational number that is not a perfect square, using the roots of perfect squares as benchmarks.
Determine an approximate square root of a given rational number that is not a perfect square, using technology; e.g., a calculator, a computer.
Explain why the square root of a given rational number as shown on a calculator may be an approximation.
Identify a number with a square root that is between two given numbers.
[C] Communication [PS] Problem Solving [CN] Connections [R] Reasoning [ME] Mental Mathematics [T] Technology and Estimation [V] Visualization
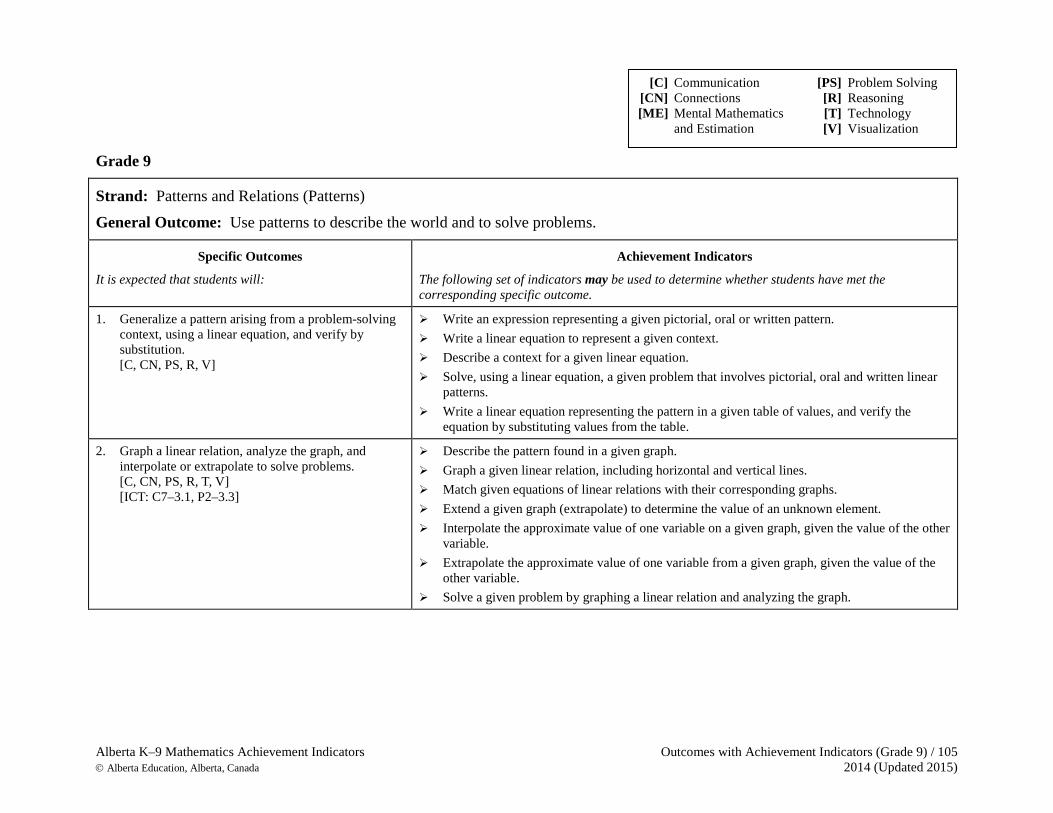
Alberta K–9 Mathematics Achievement Indicators Outcomes with Achievement Indicators (Grade 9) / 105 Alberta Education, Alberta, Canada 2014 (Updated 2015)
Grade 9
Strand: Patterns and Relations (Patterns) General Outcome: Use patterns to describe the world and to solve problems.
Specific Outcomes
It is expected that students will:
Achievement Indicators
The following set of indicators may be used to determine whether students have met the corresponding specific outcome.
1. Generalize a pattern arising from a problem-solving context, using a linear equation, and verify by substitution. [C, CN, PS, R, V]
Write an expression representing a given pictorial, oral or written pattern. Write a linear equation to represent a given context. Describe a context for a given linear equation. Solve, using a linear equation, a given problem that involves pictorial, oral and written linear
patterns. Write a linear equation representing the pattern in a given table of values, and verify the
equation by substituting values from the table.
2. Graph a linear relation, analyze the graph, and interpolate or extrapolate to solve problems. [C, CN, PS, R, T, V] [ICT: C7–3.1, P2–3.3]
Describe the pattern found in a given graph. Graph a given linear relation, including horizontal and vertical lines. Match given equations of linear relations with their corresponding graphs. Extend a given graph (extrapolate) to determine the value of an unknown element. Interpolate the approximate value of one variable on a given graph, given the value of the other
variable. Extrapolate the approximate value of one variable from a given graph, given the value of the
other variable. Solve a given problem by graphing a linear relation and analyzing the graph.
[C] Communication [PS] Problem Solving [CN] Connections [R] Reasoning [ME] Mental Mathematics [T] Technology and Estimation [V] Visualization
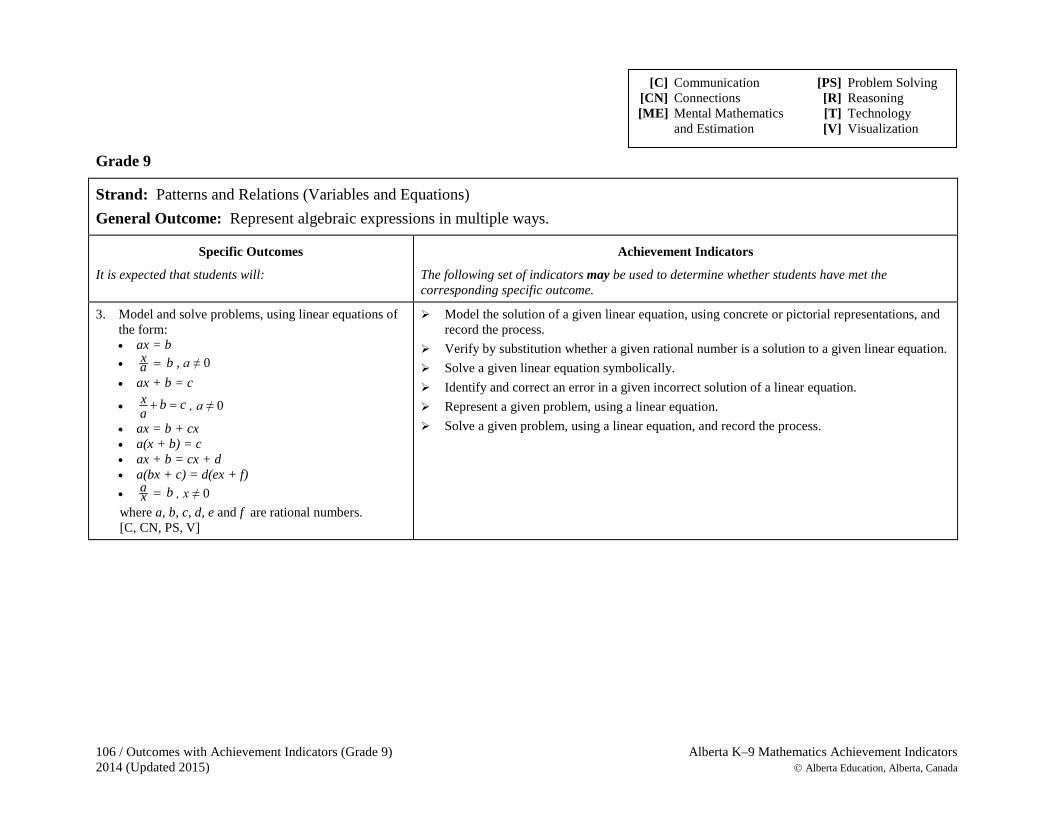
106 / Outcomes with Achievement Indicators (Grade 9) Alberta K–9 Mathematics Achievement Indicators 2014 (Updated 2015) Alberta Education, Alberta, Canada
Grade 9
Strand: Patterns and Relations (Variables and Equations) General Outcome: Represent algebraic expressions in multiple ways.
Specific Outcomes
It is expected that students will:
Achievement Indicators
The following set of indicators may be used to determine whether students have met the corresponding specific outcome.
3. Model and solve problems, using linear equations of the form: • ax = b • x ba = , a ≠ 0 • ax + b = c
• x b ca
+ = , a ≠ 0
• ax = b + cx • a(x + b) = c • ax + b = cx + d • a(bx + c) = d(ex + f) • a bx = , x ≠ 0 where a, b, c, d, e and f are rational numbers. [C, CN, PS, V]
Model the solution of a given linear equation, using concrete or pictorial representations, and record the process.
Verify by substitution whether a given rational number is a solution to a given linear equation. Solve a given linear equation symbolically. Identify and correct an error in a given incorrect solution of a linear equation. Represent a given problem, using a linear equation. Solve a given problem, using a linear equation, and record the process.
[C] Communication [PS] Problem Solving [CN] Connections [R] Reasoning [ME] Mental Mathematics [T] Technology and Estimation [V] Visualization
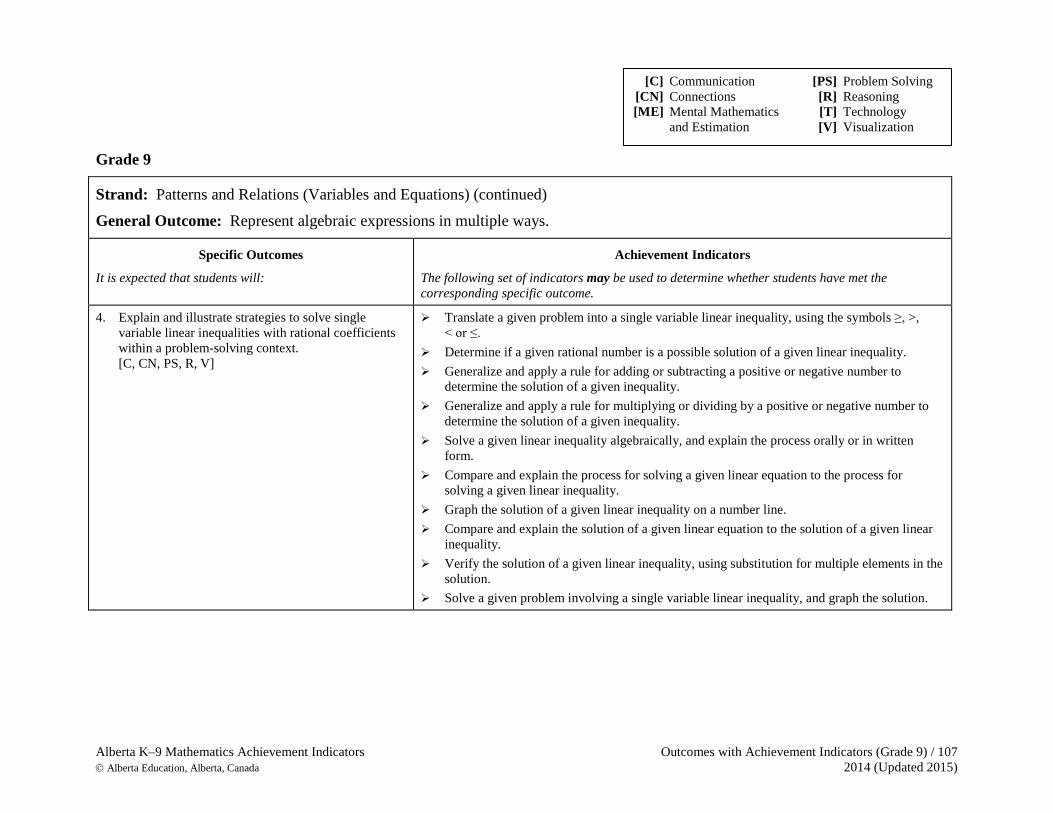
Alberta K–9 Mathematics Achievement Indicators Outcomes with Achievement Indicators (Grade 9) / 107 Alberta Education, Alberta, Canada 2014 (Updated 2015)
Grade 9
Strand: Patterns and Relations (Variables and Equations) (continued) General Outcome: Represent algebraic expressions in multiple ways.
Specific Outcomes
It is expected that students will:
Achievement Indicators
The following set of indicators may be used to determine whether students have met the corresponding specific outcome.
4. Explain and illustrate strategies to solve single variable linear inequalities with rational coefficients within a problem-solving context. [C, CN, PS, R, V]
Translate a given problem into a single variable linear inequality, using the symbols ≥, >, < or ≤.
Determine if a given rational number is a possible solution of a given linear inequality. Generalize and apply a rule for adding or subtracting a positive or negative number to
determine the solution of a given inequality. Generalize and apply a rule for multiplying or dividing by a positive or negative number to
determine the solution of a given inequality. Solve a given linear inequality algebraically, and explain the process orally or in written
form. Compare and explain the process for solving a given linear equation to the process for
solving a given linear inequality. Graph the solution of a given linear inequality on a number line. Compare and explain the solution of a given linear equation to the solution of a given linear
inequality. Verify the solution of a given linear inequality, using substitution for multiple elements in the
solution. Solve a given problem involving a single variable linear inequality, and graph the solution.
[C] Communication [PS] Problem Solving [CN] Connections [R] Reasoning [ME] Mental Mathematics [T] Technology and Estimation [V] Visualization
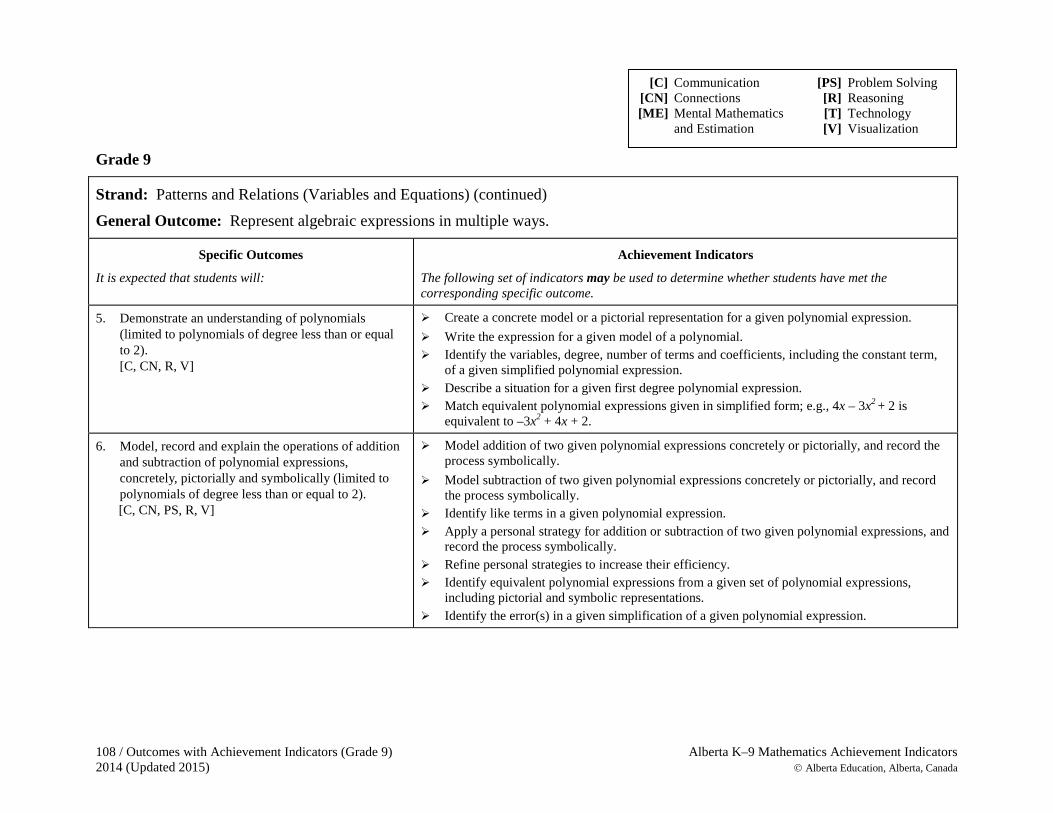
108 / Outcomes with Achievement Indicators (Grade 9) Alberta K–9 Mathematics Achievement Indicators 2014 (Updated 2015) Alberta Education, Alberta, Canada
Grade 9
Strand: Patterns and Relations (Variables and Equations) (continued) General Outcome: Represent algebraic expressions in multiple ways.
Specific Outcomes
It is expected that students will:
Achievement Indicators
The following set of indicators may be used to determine whether students have met the corresponding specific outcome.
5. Demonstrate an understanding of polynomials (limited to polynomials of degree less than or equal to 2).
[C, CN, R, V]
Create a concrete model or a pictorial representation for a given polynomial expression. Write the expression for a given model of a polynomial. Identify the variables, degree, number of terms and coefficients, including the constant term,
of a given simplified polynomial expression. Describe a situation for a given first degree polynomial expression. Match equivalent polynomial expressions given in simplified form; e.g., 4x – 3x2 + 2 is
equivalent to –3x2 + 4x + 2.
6. Model, record and explain the operations of addition and subtraction of polynomial expressions, concretely, pictorially and symbolically (limited to polynomials of degree less than or equal to 2). [C, CN, PS, R, V]
Model addition of two given polynomial expressions concretely or pictorially, and record the process symbolically.
Model subtraction of two given polynomial expressions concretely or pictorially, and record the process symbolically.
Identify like terms in a given polynomial expression. Apply a personal strategy for addition or subtraction of two given polynomial expressions, and
record the process symbolically. Refine personal strategies to increase their efficiency. Identify equivalent polynomial expressions from a given set of polynomial expressions,
including pictorial and symbolic representations. Identify the error(s) in a given simplification of a given polynomial expression.
[C] Communication [PS] Problem Solving [CN] Connections [R] Reasoning [ME] Mental Mathematics [T] Technology and Estimation [V] Visualization
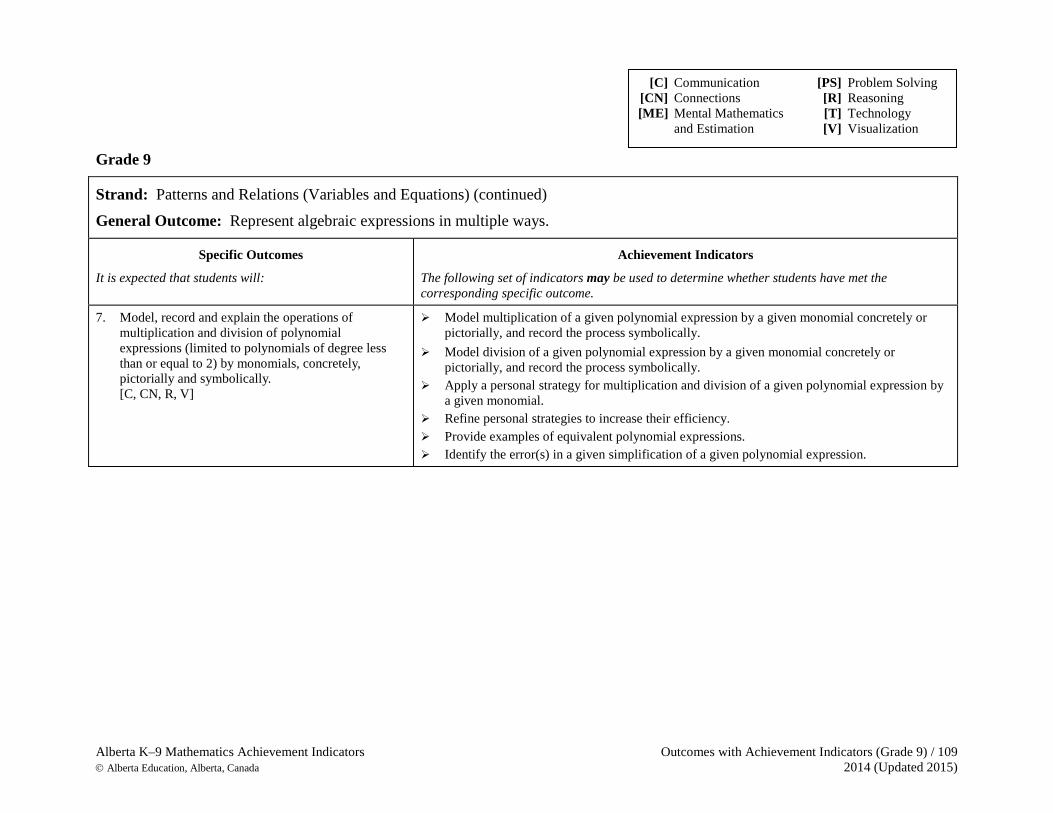
Alberta K–9 Mathematics Achievement Indicators Outcomes with Achievement Indicators (Grade 9) / 109 Alberta Education, Alberta, Canada 2014 (Updated 2015)
Grade 9
Strand: Patterns and Relations (Variables and Equations) (continued) General Outcome: Represent algebraic expressions in multiple ways.
Specific Outcomes
It is expected that students will:
Achievement Indicators
The following set of indicators may be used to determine whether students have met the corresponding specific outcome.
7. Model, record and explain the operations of multiplication and division of polynomial expressions (limited to polynomials of degree less than or equal to 2) by monomials, concretely, pictorially and symbolically. [C, CN, R, V]
Model multiplication of a given polynomial expression by a given monomial concretely or pictorially, and record the process symbolically.
Model division of a given polynomial expression by a given monomial concretely or pictorially, and record the process symbolically.
Apply a personal strategy for multiplication and division of a given polynomial expression by a given monomial.
Refine personal strategies to increase their efficiency. Provide examples of equivalent polynomial expressions. Identify the error(s) in a given simplification of a given polynomial expression.
[C] Communication [PS] Problem Solving [CN] Connections [R] Reasoning [ME] Mental Mathematics [T] Technology and Estimation [V] Visualization
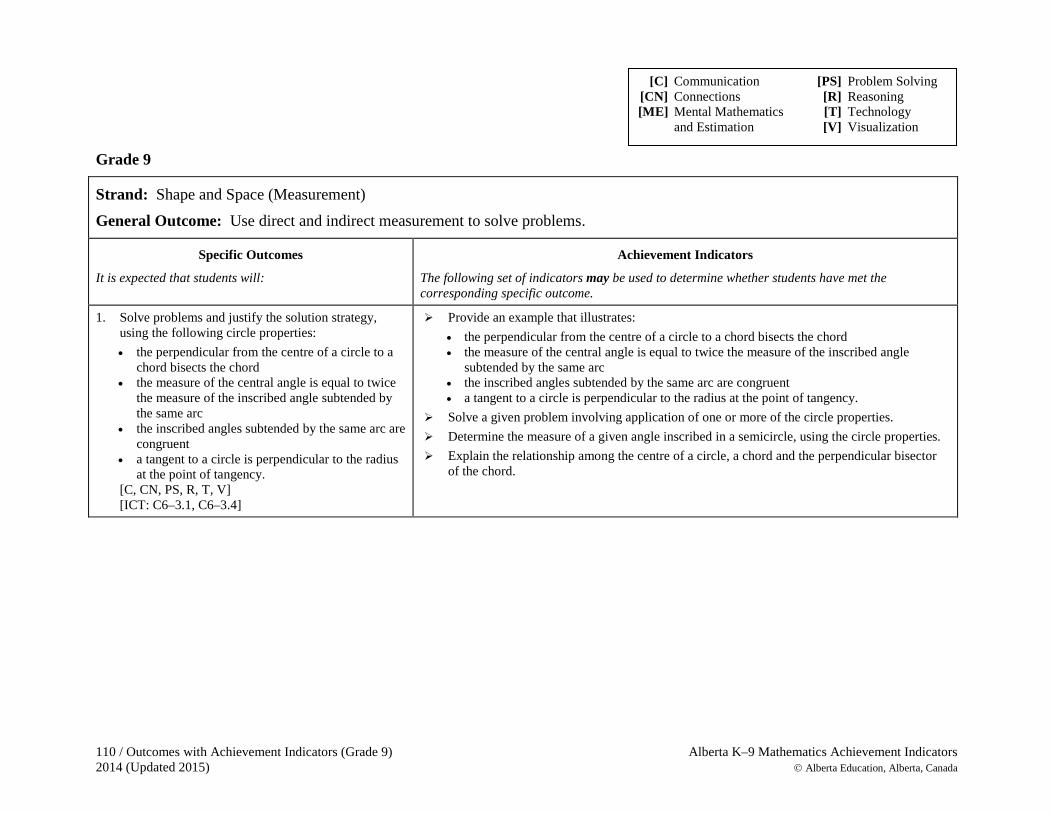
110 / Outcomes with Achievement Indicators (Grade 9) Alberta K–9 Mathematics Achievement Indicators 2014 (Updated 2015) Alberta Education, Alberta, Canada
Grade 9
Strand: Shape and Space (Measurement) General Outcome: Use direct and indirect measurement to solve problems.
Specific Outcomes
It is expected that students will:
Achievement Indicators
The following set of indicators may be used to determine whether students have met the corresponding specific outcome.
1. Solve problems and justify the solution strategy, using the following circle properties: • the perpendicular from the centre of a circle to a
chord bisects the chord • the measure of the central angle is equal to twice
the measure of the inscribed angle subtended by the same arc
• the inscribed angles subtended by the same arc are congruent
• a tangent to a circle is perpendicular to the radius at the point of tangency.
[C, CN, PS, R, T, V] [ICT: C6–3.1, C6–3.4]
Provide an example that illustrates: • the perpendicular from the centre of a circle to a chord bisects the chord • the measure of the central angle is equal to twice the measure of the inscribed angle
subtended by the same arc • the inscribed angles subtended by the same arc are congruent • a tangent to a circle is perpendicular to the radius at the point of tangency.
Solve a given problem involving application of one or more of the circle properties. Determine the measure of a given angle inscribed in a semicircle, using the circle properties. Explain the relationship among the centre of a circle, a chord and the perpendicular bisector
of the chord.
[C] Communication [PS] Problem Solving [CN] Connections [R] Reasoning [ME] Mental Mathematics [T] Technology and Estimation [V] Visualization
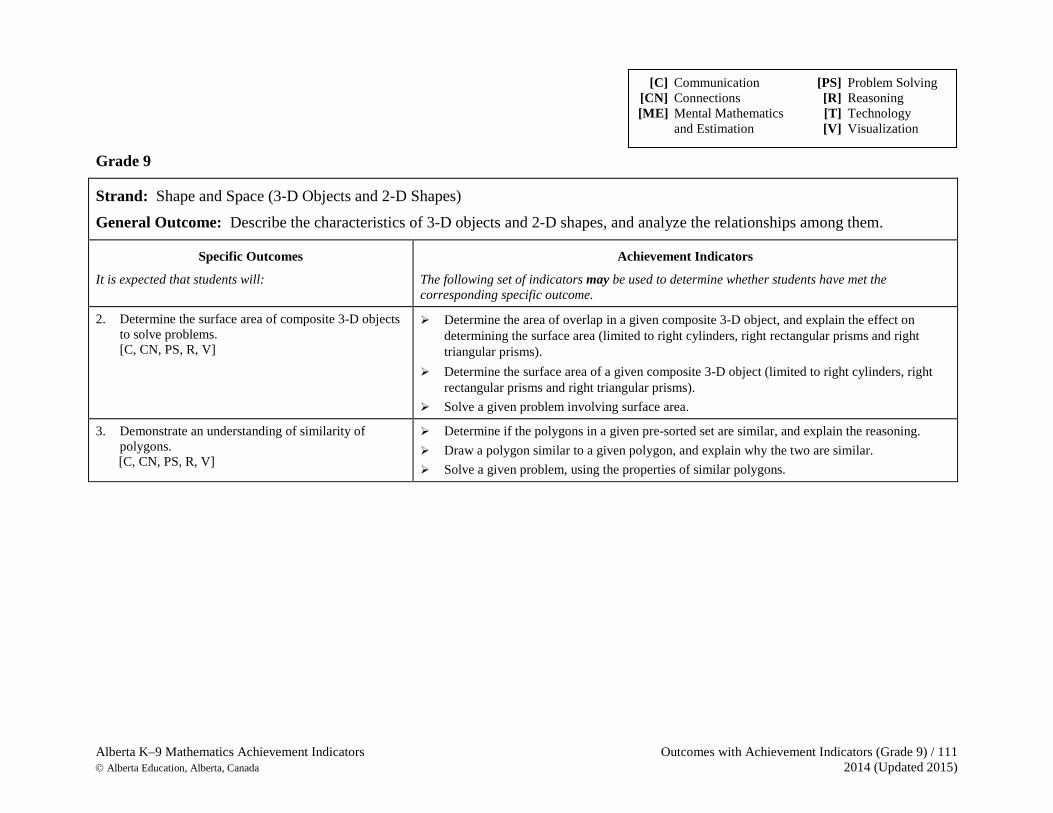
Alberta K–9 Mathematics Achievement Indicators Outcomes with Achievement Indicators (Grade 9) / 111 Alberta Education, Alberta, Canada 2014 (Updated 2015)
Grade 9
Strand: Shape and Space (3-D Objects and 2-D Shapes) General Outcome: Describe the characteristics of 3-D objects and 2-D shapes, and analyze the relationships among them.
Specific Outcomes
It is expected that students will:
Achievement Indicators
The following set of indicators may be used to determine whether students have met the corresponding specific outcome.
2. Determine the surface area of composite 3-D objects to solve problems. [C, CN, PS, R, V]
Determine the area of overlap in a given composite 3-D object, and explain the effect on determining the surface area (limited to right cylinders, right rectangular prisms and right triangular prisms).
Determine the surface area of a given composite 3-D object (limited to right cylinders, right rectangular prisms and right triangular prisms).
Solve a given problem involving surface area.
3. Demonstrate an understanding of similarity of polygons.
[C, CN, PS, R, V]
Determine if the polygons in a given pre-sorted set are similar, and explain the reasoning. Draw a polygon similar to a given polygon, and explain why the two are similar. Solve a given problem, using the properties of similar polygons.
[C] Communication [PS] Problem Solving [CN] Connections [R] Reasoning [ME] Mental Mathematics [T] Technology and Estimation [V] Visualization
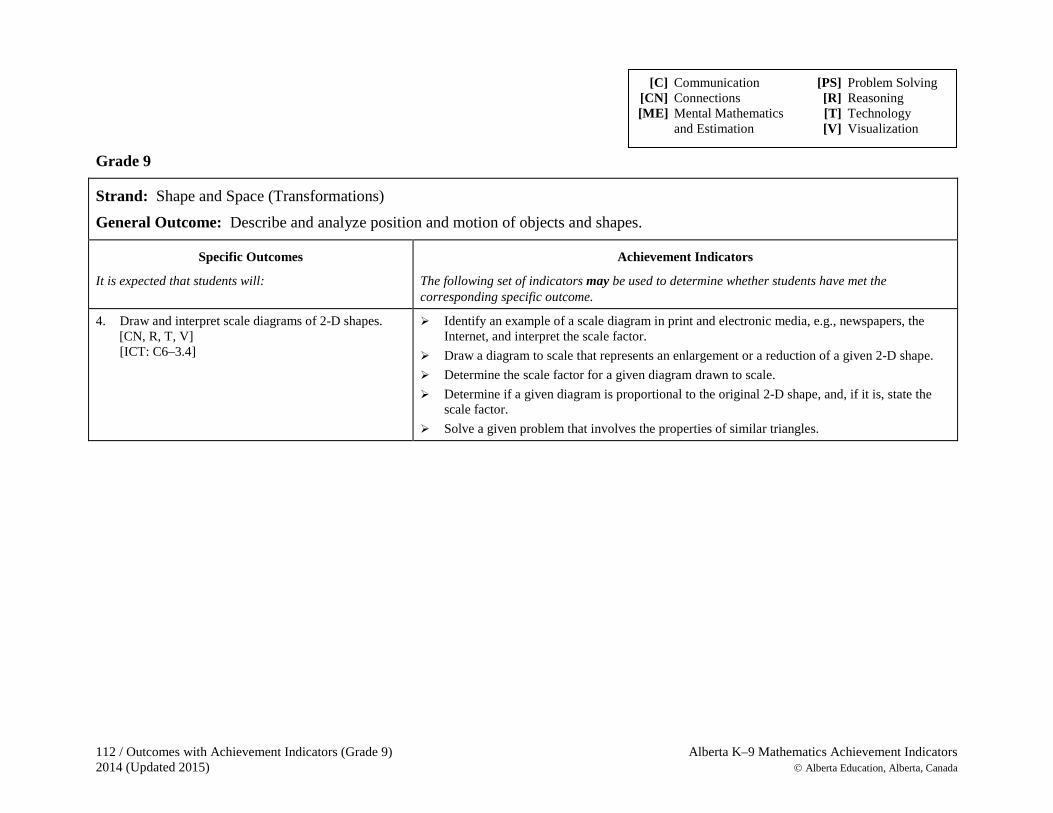
112 / Outcomes with Achievement Indicators (Grade 9) Alberta K–9 Mathematics Achievement Indicators 2014 (Updated 2015) Alberta Education, Alberta, Canada
Grade 9
Strand: Shape and Space (Transformations)
General Outcome: Describe and analyze position and motion of objects and shapes.
Specific Outcomes
It is expected that students will:
Achievement Indicators
The following set of indicators may be used to determine whether students have met the corresponding specific outcome.
4. Draw and interpret scale diagrams of 2-D shapes. [CN, R, T, V]
[ICT: C6–3.4]
Identify an example of a scale diagram in print and electronic media, e.g., newspapers, the Internet, and interpret the scale factor.
Draw a diagram to scale that represents an enlargement or a reduction of a given 2-D shape. Determine the scale factor for a given diagram drawn to scale. Determine if a given diagram is proportional to the original 2-D shape, and, if it is, state the
scale factor. Solve a given problem that involves the properties of similar triangles.
[C] Communication [PS] Problem Solving [CN] Connections [R] Reasoning [ME] Mental Mathematics [T] Technology and Estimation [V] Visualization
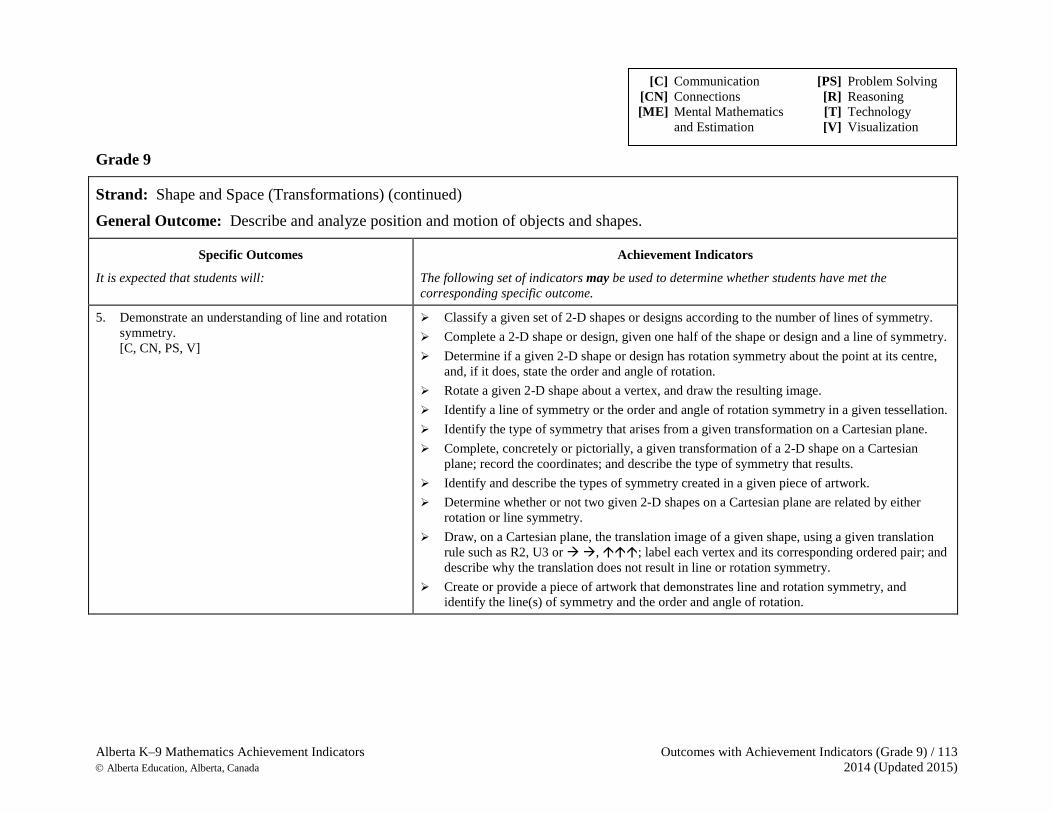
Alberta K–9 Mathematics Achievement Indicators Outcomes with Achievement Indicators (Grade 9) / 113 Alberta Education, Alberta, Canada 2014 (Updated 2015)
Grade 9
Strand: Shape and Space (Transformations) (continued)
General Outcome: Describe and analyze position and motion of objects and shapes.
Specific Outcomes
It is expected that students will:
Achievement Indicators
The following set of indicators may be used to determine whether students have met the corresponding specific outcome.
5. Demonstrate an understanding of line and rotation symmetry.
[C, CN, PS, V]
Classify a given set of 2-D shapes or designs according to the number of lines of symmetry. Complete a 2-D shape or design, given one half of the shape or design and a line of symmetry. Determine if a given 2-D shape or design has rotation symmetry about the point at its centre,
and, if it does, state the order and angle of rotation. Rotate a given 2-D shape about a vertex, and draw the resulting image. Identify a line of symmetry or the order and angle of rotation symmetry in a given tessellation. Identify the type of symmetry that arises from a given transformation on a Cartesian plane. Complete, concretely or pictorially, a given transformation of a 2-D shape on a Cartesian
plane; record the coordinates; and describe the type of symmetry that results. Identify and describe the types of symmetry created in a given piece of artwork. Determine whether or not two given 2-D shapes on a Cartesian plane are related by either
rotation or line symmetry. Draw, on a Cartesian plane, the translation image of a given shape, using a given translation
rule such as R2, U3 or , ; label each vertex and its corresponding ordered pair; and describe why the translation does not result in line or rotation symmetry.
Create or provide a piece of artwork that demonstrates line and rotation symmetry, and identify the line(s) of symmetry and the order and angle of rotation.
[C] Communication [PS] Problem Solving [CN] Connections [R] Reasoning [ME] Mental Mathematics [T] Technology and Estimation [V] Visualization

114 / Outcomes with Achievement Indicators (Grade 9) Alberta K–9 Mathematics Achievement Indicators 2014 (Updated 2015) Alberta Education, Alberta, Canada
Grade 9
Strand: Statistics and Probability (Data Analysis) General Outcome: Collect, display and analyze data to solve problems.
Specific Outcomes
It is expected that students will:
Achievement Indicators
The following set of indicators may be used to determine whether students have met the corresponding specific outcome.
1. Describe the effect of: • bias • use of language • ethics • cost • time and timing • privacy • cultural sensitivity on the collection of data. [C, CN, R, T] [ICT: F4–3.2, F4–3.3]
Analyze a given case study of data collection; and identify potential problems related to bias, use of language, ethics, cost, time and timing, privacy or cultural sensitivity.
Provide examples to illustrate how bias, use of language, ethics, cost, time and timing, privacy or cultural sensitivity may influence data.
2. Select and defend the choice of using either a population or a sample of a population to answer a question. [C, CN, PS, R]
Identify whether a given situation represents the use of a sample or a population. Provide an example of a situation in which a population may be used to answer a question, and
justify the choice. Provide an example of a question where a limitation precludes the use of a population; and
describe the limitation, e.g., too costly, not enough time, limited resources. Identify and critique a given example in which a generalization from a sample of a population
may or may not be valid for the population. Provide an example to demonstrate the significance of sample size in interpreting data.
[C] Communication [PS] Problem Solving [CN] Connections [R] Reasoning [ME] Mental Mathematics [T] Technology and Estimation [V] Visualization
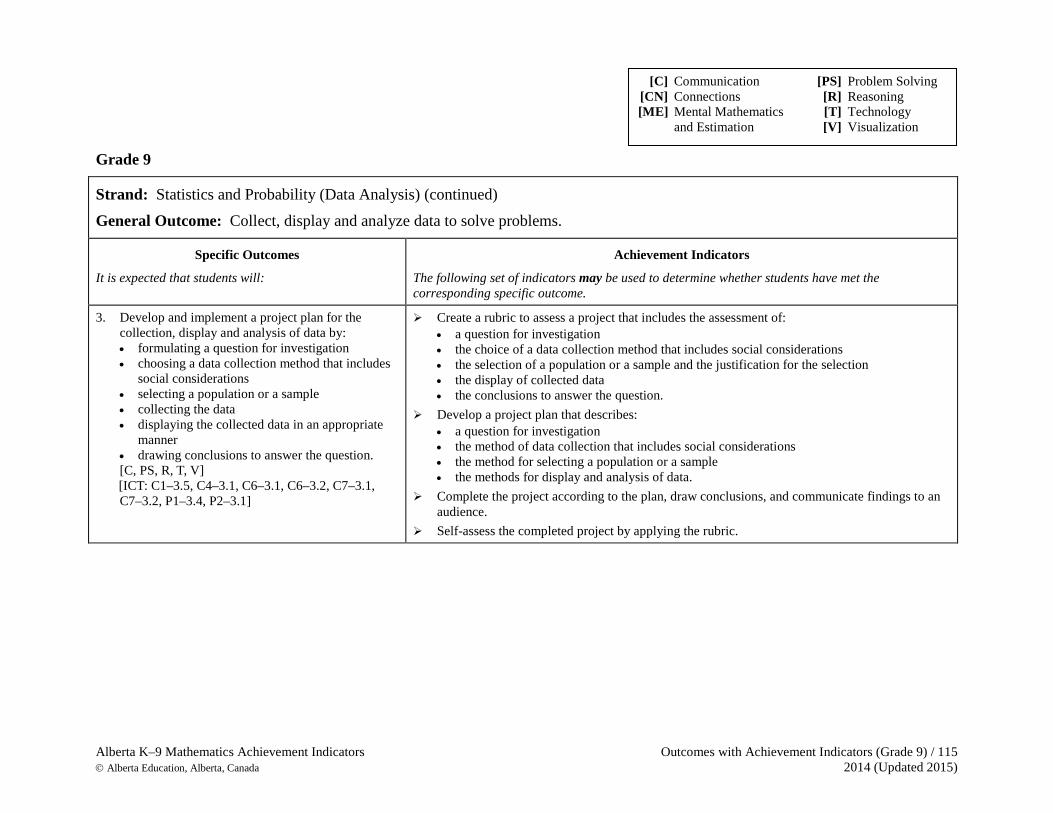
Alberta K–9 Mathematics Achievement Indicators Outcomes with Achievement Indicators (Grade 9) / 115 Alberta Education, Alberta, Canada 2014 (Updated 2015)
Grade 9
Strand: Statistics and Probability (Data Analysis) (continued) General Outcome: Collect, display and analyze data to solve problems.
Specific Outcomes
It is expected that students will:
Achievement Indicators
The following set of indicators may be used to determine whether students have met the corresponding specific outcome.
3. Develop and implement a project plan for the collection, display and analysis of data by: • formulating a question for investigation • choosing a data collection method that includes
social considerations • selecting a population or a sample • collecting the data • displaying the collected data in an appropriate
manner • drawing conclusions to answer the question. [C, PS, R, T, V] [ICT: C1–3.5, C4–3.1, C6–3.1, C6–3.2, C7–3.1, C7–3.2, P1–3.4, P2–3.1]
Create a rubric to assess a project that includes the assessment of: • a question for investigation • the choice of a data collection method that includes social considerations • the selection of a population or a sample and the justification for the selection • the display of collected data • the conclusions to answer the question.
Develop a project plan that describes: • a question for investigation • the method of data collection that includes social considerations • the method for selecting a population or a sample • the methods for display and analysis of data.
Complete the project according to the plan, draw conclusions, and communicate findings to an audience.
Self-assess the completed project by applying the rubric.
[C] Communication [PS] Problem Solving [CN] Connections [R] Reasoning [ME] Mental Mathematics [T] Technology and Estimation [V] Visualization
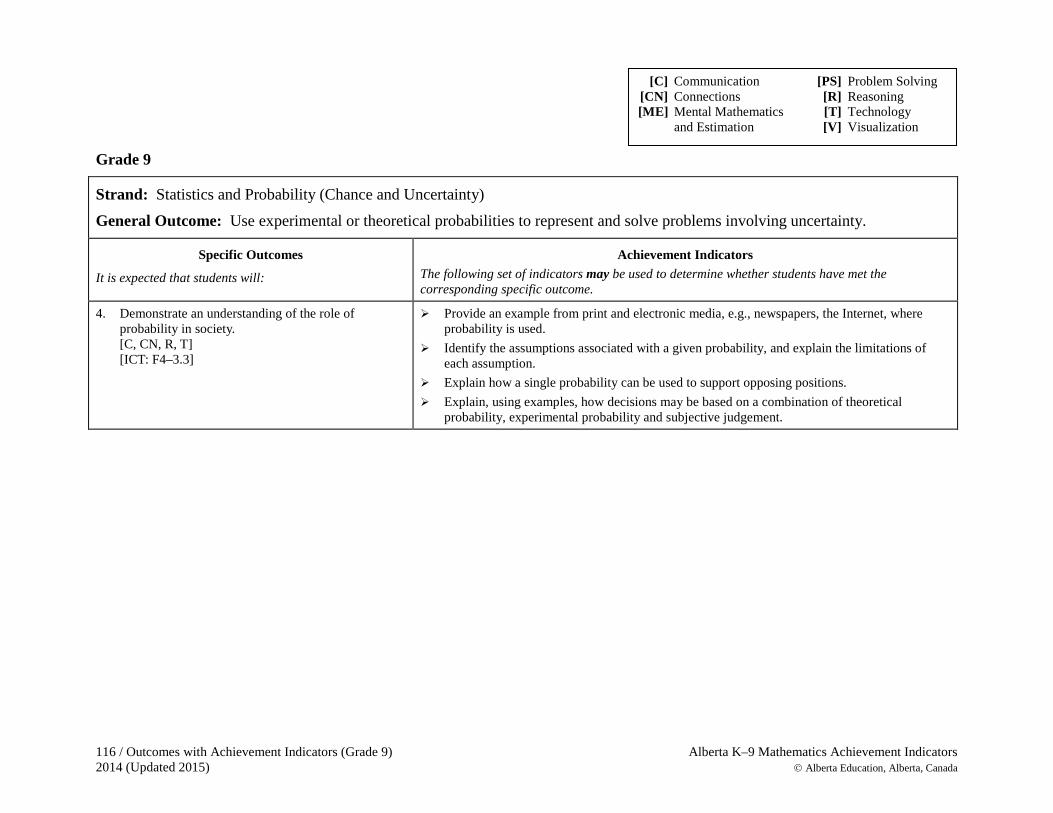
116 / Outcomes with Achievement Indicators (Grade 9) Alberta K–9 Mathematics Achievement Indicators 2014 (Updated 2015) Alberta Education, Alberta, Canada
Grade 9
Strand: Statistics and Probability (Chance and Uncertainty) General Outcome: Use experimental or theoretical probabilities to represent and solve problems involving uncertainty.
Specific Outcomes
It is expected that students will:
Achievement Indicators The following set of indicators may be used to determine whether students have met the corresponding specific outcome.
4. Demonstrate an understanding of the role of probability in society. [C, CN, R, T] [ICT: F4–3.3]
Provide an example from print and electronic media, e.g., newspapers, the Internet, where probability is used.
Identify the assumptions associated with a given probability, and explain the limitations of each assumption.
Explain how a single probability can be used to support opposing positions. Explain, using examples, how decisions may be based on a combination of theoretical
probability, experimental probability and subjective judgement.
[C] Communication [PS] Problem Solving [CN] Connections [R] Reasoning [ME] Mental Mathematics [T] Technology and Estimation [V] Visualization
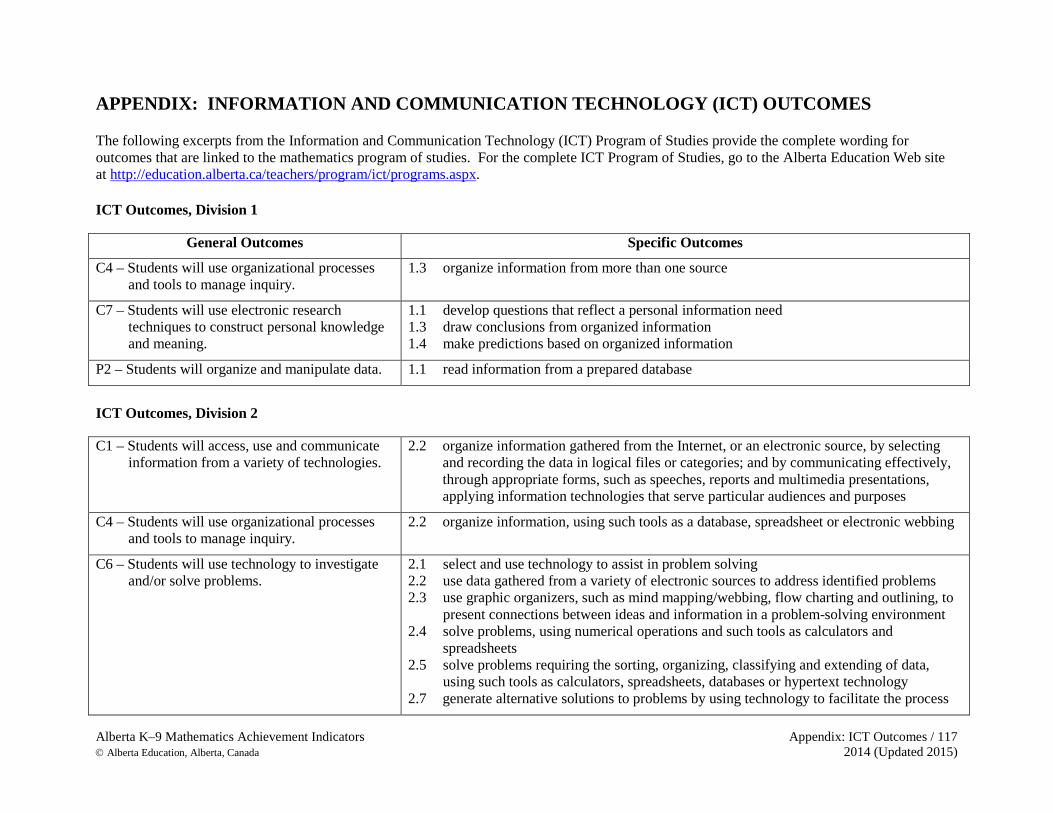
Alberta K–9 Mathematics Achievement Indicators Appendix: ICT Outcomes / 117 Alberta Education, Alberta, Canada 2014 (Updated 2015)
APPENDIX: INFORMATION AND COMMUNICATION TECHNOLOGY (ICT) OUTCOMES The following excerpts from the Information and Communication Technology (ICT) Program of Studies provide the complete wording for outcomes that are linked to the mathematics program of studies. For the complete ICT Program of Studies, go to the Alberta Education Web site at http://education.alberta.ca/teachers/program/ict/programs.aspx. ICT Outcomes, Division 1
General Outcomes Specific Outcomes
C4 – Students will use organizational processes and tools to manage inquiry.
1.3 organize information from more than one source
C7 – Students will use electronic research techniques to construct personal knowledge and meaning.
1.1 develop questions that reflect a personal information need 1.3 draw conclusions from organized information 1.4 make predictions based on organized information
P2 – Students will organize and manipulate data. 1.1 read information from a prepared database
ICT Outcomes, Division 2 C1 – Students will access, use and communicate
information from a variety of technologies. 2.2 organize information gathered from the Internet, or an electronic source, by selecting
and recording the data in logical files or categories; and by communicating effectively, through appropriate forms, such as speeches, reports and multimedia presentations, applying information technologies that serve particular audiences and purposes
C4 – Students will use organizational processes and tools to manage inquiry.
2.2 organize information, using such tools as a database, spreadsheet or electronic webbing
C6 – Students will use technology to investigate and/or solve problems.
2.1 select and use technology to assist in problem solving 2.2 use data gathered from a variety of electronic sources to address identified problems 2.3 use graphic organizers, such as mind mapping/webbing, flow charting and outlining, to
present connections between ideas and information in a problem-solving environment 2.4 solve problems, using numerical operations and such tools as calculators and
spreadsheets 2.5 solve problems requiring the sorting, organizing, classifying and extending of data,
using such tools as calculators, spreadsheets, databases or hypertext technology 2.7 generate alternative solutions to problems by using technology to facilitate the process

118 / Appendix: ICT Outcomes Alberta K–9 Mathematics Achievement Indicators 2014 (Updated 2015) Alberta Education, Alberta, Canada
General Outcomes Specific Outcomes
C7 – Students will use electronic research techniques to construct personal knowledge and meaning.
2.1 use a variety of technologies to organize and synthesize researched information
P2 – Students will organize and manipulate data. 2.1 enter and manipulate data by using such tools as spreadsheets or databases for a specific purpose
2.2 display data electronically through graphs and charts P5 – Students will navigate and create hyperlinked
resources. 2.3 navigate the Internet with appropriate software
ICT Outcomes, Division 3 C1 – Students will access, use and communicate
information from a variety of technologies. 3.5 analyze and synthesize information to create a product
C4 – Students will use organizational processes and tools to manage inquiry.
3.1 create a plan for an inquiry that includes consideration of time management
C6 – Students will use technology to investigate and/or solve problems.
3.1 articulate clearly a plan of action to use technology to solve a problem 3.2 identify the appropriate materials and tools to use in order to accomplish a plan of
action 3.4 pose and test solutions to problems by using computer applications, such as
computer-assisted design or simulation/modelling software C7 – Students will use electronic research techniques
to construct personal knowledge and meaning. 3.1 identify patterns in organized information 3.2 make connections among related, organized data, and assemble various pieces into a
unified message F4 – Students will become discerning consumers of
mass media and electronic information. 3.2 understand the nature of various media and how they are consciously used to
influence an audience 3.3 identify specific techniques used by the media to elicit particular responses from an
audience P1 – Students will compose, revise and edit text. 3.4 use appropriate communication technology to elicit feedback from others P2 – Students will organize and manipulate data. 3.1 design, create and modify a database for a specific purpose
3.3 use a variety of technological graphing tools to draw graphs for data involving one or two variables
3.4 use a scientific calculator or a computer to solve problems involving rational numbers