specific outcomes, achievement indicators and …studentsonline.btps.ca/documents/general/math...
TRANSCRIPT

R3 (Revisit, Review and Revive)
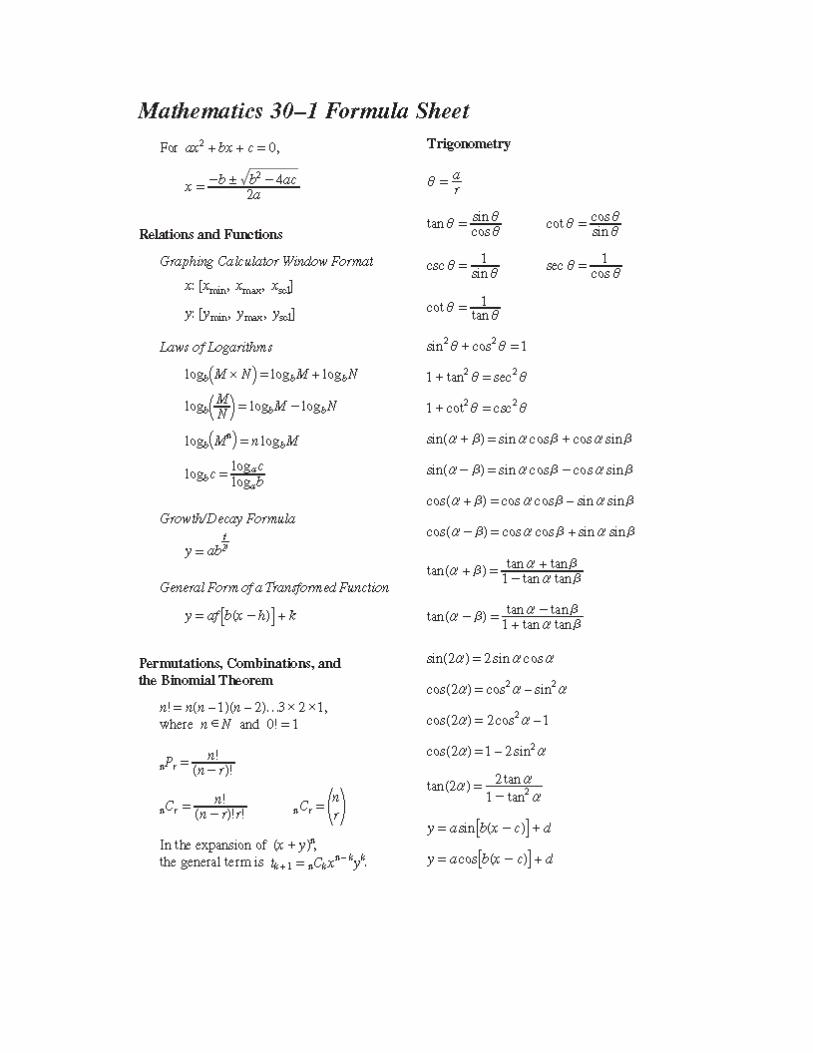
Math 30-1
Pre-session Booklet
Specific Outcomes, Achievement
Indicators and Student Examples
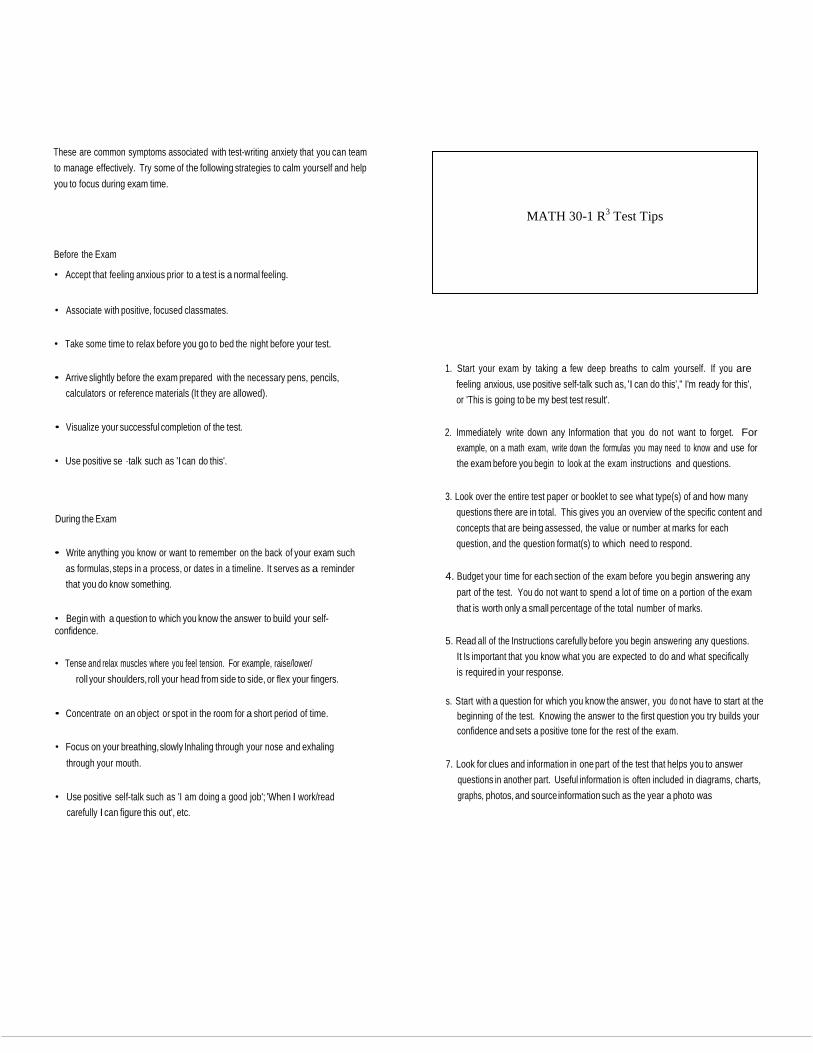
These are common symptoms associated with test-writing anxiety that you can team
to manage effectively. Try some of the following strategies to calm yourself and help
you to focus during exam time.
Before the Exam
• Accept that feeling anxious prior to a test is a normal feeling.
• Associate with positive, focused classmates.
• Take some time to relax before you go to bed the night before your test.
• Arrive slightly before the exam prepared with the necessary pens, pencils,
calculators or reference materials (It they are allowed).
• Visualize your successful completion of the test.
• Use positive se ·talk such as 'I can do this'.
During the Exam
• Write anything you know or want to remember on the back of your exam such
as formulas, steps in a process, or dates in a timeline. It serves as a reminder
that you do know something.
• Begin with a question to which you know the answer to build your self- confidence.
• Tense and relax muscles where you feel tension. For example, raise/lower/
roll your shoulders, roll your head from side to side, or flex your fingers.
• Concentrate on an object or spot in the room for a short period of time.
• Focus on your breathing, slowly Inhaling through your nose and exhaling
through your mouth.
• Use positive self-talk such as 'I am doing a good job'; 'When I work/read
carefully I can figure this out', etc.
1. Start your exam by taking a few deep breaths to calm yourself. If you are
feeling anxious, use positive self-talk such as, 'I can do this'," I'm ready for this',
or 'This is going to be my best test result'.
2. Immediately write down any Information that you do not want to forget. For
example, on a math exam, write down the formulas you may need to know and use for
the exam before you begin to look at the exam instructions and questions.
3. Look over the entire test paper or booklet to see what type(s) of and how many
questions there are in total. This gives you an overview of the specific content and
concepts that are being assessed, the value or number at marks for each
question, and the question format(s) to which need to respond.
4. Budget your time for each section of the exam before you begin answering any
part of the test. You do not want to spend a lot of time on a portion of the exam
that is worth only a small percentage of the total number of marks.
5. Read all of the Instructions carefully before you begin answering any questions.
It Is important that you know what you are expected to do and what specifically
is required in your response.
s. Start with a question for which you know the answer, you do not have to start at the
beginning of the test. Knowing the answer to the first question you try builds your
confidence and sets a positive tone for the rest of the exam.
7. Look for clues and information in one part of the test that helps you to answer
questions in another part. Useful information is often included in diagrams, charts,
graphs, photos, and source information such as the year a photo was
MATH 30-1 R3 Test Tips

taken or where the author Jived. Pictures, charts, graphs, and diagrams may
provide a context for the question you are expected to answer.
8. Answer every question even if you have to guess. Leaving a question blank
is guaranteed to earn you zero marks. A guess in a multiple choice question, or working a
math question through as far as you are able, gives you an opportunity to 'luck out
or earn partial marks.
9. Read over all of your answers before you hand in your test. You want to be sure you've
answered all the questions, that your response satisfies what was asked, and that your
calculations are accurate. Where necessary include the units of measurement.
10. Finish your answers to written response or essay questions in point form If you
are running out of time. This shows the marker that you have understood the
question and have an organized and thoughtful response just not enough time
for complete sentences.
11. Stay In the exam room for the entire amount of time. If you finish before the
time is up, review your answers. Take a short 'mental break' by rolling your head
from side to side and/or shrugging your shoulders. In thinking about the overall
test or reviewing specific questions, you may remember additional information to
add to some of your responses.
TEST RESPONSE STRATEGIES
There are many strategies to help you maximize your performance on quizzes, unit
tests, and final exams. The following provides information on three
common strategies that you may find useful.
• Third Answering Pass- complete all partial answers; guess at any true/false and
multiple choice questions you have left and attempt any questions still
unanswered; all questions should now have full or partial answers
• Review Pass- check all answers and calculations as time permits
Three-Pass Strategy - has three steps or 'passes' for answering exam
questions; is an abbreviated version of the five pass method:
• Overview- scan the entire exam; note question formats, marks tor each
section, instructions, and questions you can complete easily and quickly
• Second Pass- answer all questions you can complete without too much difficulty
stopping when the question becomes too challenging or is taking too much time
• Last Pass- answer any questions that are left; guess and provide partial
answers if necessary ·
Problem-solving Strategy- has four steps to work through in answering a
problem; the problem can be a word problem or a calculation problem:
• Understand the problem- What is the question? Do I have the information I
need?
• Develop a Plan- Have I done something similar before? Can I break the
question down into smaller parts?
• Carry out the Plan- Is my process logical? Have I shown all of the steps in the
process? Have I included the correct units of measurement? ·
• Look Back- Have I answered the question? Does my answer make sense?
Five-Pass Strategy- has five steps or 'passes' for answering exam questions:
• Browsing Pass- scan the entire exam; note question formats, marks for
each section, instructions
• First Answering Pass- answer questions you know the answer to and can
complete quickly; maintain a brisk pace
• Second Answering Pass- answer questions left during ti·1e first pass that require
more effort per mark; work the questions through until you experience an impasse or
it is taking too long; maintain a steady pace
MANAGING TEST ANXIETY
Feeling somewhat anxious or 'stressed' before an exam is quite normal for most
students. At times the tension helps you to 'rise to the challenge'. Do you feel some
or all of the following prior to writing a test?
• Nervousness/Nausea
• Difficulty sleeping the night before
• 'Butterflies' in your stomach
• 'Blanking' or 'not being able to remember anything'

Math 30-1
R3
Revisit, Review and Revive
This review is set up with six 2 hour sessions.
Session 1 – Relations and Functions/Transformations
a.) Topic 2 – Specific Outcome 1-6 b.) Absolute Value Workbook – Unit 1 and 2
Session 2 – Exponential/Logarithmic Functions
a.) Topic 2 – Specific Outcome 7-10 b.) Absolute Value Workbook – Unit 3 and 4
Session 3 – Rational and Radical Equations
a.) Topic 2 – Specific Outcome 13- 14 b.) Absolute Value Workbook – Unit 7
Session 4 – Permutations and Combinations and Polynomial Functions
a.) Topic 3 – Spec. Out. 1-4, Topic 3 Spec. Out. 11-12 b.) Absolute Value Workbook – Unit 5 and 6
Session 5 – Trigonometry Functions and Graphs
a.) Topic 1 – Specific Outcome 1-4 b.) Absolute Value Workbook – Unit 7
Session 6 – Trigonometry Equations and Identities
a.) Topic 1 – Specific Outcome 5 and 6 b.) Absolute Value Workbook – Unit 8

To make this a successful review please follow the instructions below before you attend your first session.
1. Revisit your notes from the year. Read through your notes, assignments and exams from
this course to refresh your memory of what was covered throughout the course.
2. Visit the Quest A+ website and do the practice exam (https://questaplus.alberta.ca/)
Click on “Practice Tests” then “Grade 12”, then scroll to find “Mathematics 30-1”, then
click on “Year End Practice” and finally click on “Take the Practice Test”
3. While going through this exam keep your “Pre-Session Booklet” by your side. When you
run into a question that you need some help with record it by the appropriate Curricular
Outcome/Achievement Indicator. There is a space provided for specific examples that
you would like answered during the review.
4. Take the time to visit some other sites that may help with your Math 30-1 Review. Here
are some sites that may be useful.
a. Salisbury High Math 30-1 Page (http://www.salcomp.ca/eteachers.php?teacher=689&page=8636)
b. Math 30-1 Explained (http://www.math30.ca/index.php)
c. The Centre for Education in Mathematics (http://courseware.cemc.uwaterloo.ca/8?gid=122) Note: Rates of Change and
Inequalities are not part of the Math 30-1 curriculum. All the other topics are covered to some
degree. There is no resource on this website to review Permutations and Combinations.
5. Come to the review sessions prepared to ask questions and work collaboratively with
your teacher and fellow students to make it a positive experience for everyone involved.
6. Make use of the attached Course Year Plan and Diploma Study guide. Plan to review
early and stick to your schedule.


SESSION 1
Topic 2: Relations and Functions
General Outcome: Develop algebraic and graphical reasoning through the study of relations.
Specific Outcome 1: Demonstrate an understanding of operations on, and compositions of, functions.
Achievement Indicator: Example: 1.1 Sketch the graph of a function
that is the sum, difference,
product or quotient of two
functions, given their graphs.
1.2 Determine the domain and
range of a function that is the
sum, difference, product or
quotient of two functions.
1.3 Write the equation of a
function that is the sum,
difference, product or quotient of
two or more functions, given
their equations.
Write a function h(x) as the sum,
difference, product or quotient of
two or more functions.
1.4 Determine the value of the
composition of functions when
evaluated at a point, including:
f (f (a))
f (g(a))
g (f (a))

1.5 Determine, given the
equations of two functions f(x)
and g(x), the equation of the
composite function:
f (f (x))
f (g(x))
g (f (x)) and explain any restrictions.
1.6 Sketch, given the equations
of two functions f(x) and g(x), the
graph of the composite
function:
f (f (x))
f (g(x))
g (f (x))
1.7 Write a function h(x) as the
composition of two or more
functions.
1.8 Write a function h(x) by
combining two or more functions
through operations on, and
compositions of, functions.

Specific Outcome 2: Demonstrate an understanding of the effects of horizontal and vertical
translations on the graphs of functions and their related equations.
Achievement Indicator: Example:
2.1 Compare the graphs of a set
of functions of the form y – k = f
(x) to the graph of y = f (x), and
generalize, using inductive
reasoning, a rule about the effect
of k.
2.2 Compare the graphs of a set
of functions of the form y = f (x
− h) to the graph of y = f (x),
and generalize, using inductive
reasoning, a rule about the effect
of h.
2.3 Compare the graphs of a set
of functions of the form y − k = f
(x − h) to the graph of y = f (x),
and generalize, using inductive
reasoning, a rule about the effects
of h and k.
2.4 Sketch the graph of y − k = f
(x) , y = f (x − h) or y − k = f (x − h) for given
values of h and k, given a sketch
of the function y = f (x) , where
the equation of
y = f (x) is not given.

2.5 Write the equation of a
function whose graph is a vertical
and/or horizontal translation of
the graph of the function y = f (x)
.
Specific Outcome 3: Demonstrate an understanding of the effects of horizontal and vertical stretches
on the graphs of functions and their related equations.
Achievement Indicator: Example: 3.1Compare the graphs of a set of
functions of the formy=af(x)to the
graph of y = f (x) , and
generalize, using inductive
reasoning, a rule about the effect
of a.
3.2 Compare the graphs of a set
of functions of the form y=f(bx)to
the graph of y = f (x) , and
generalize, using inductive
reasoning, a rule about the effect
of b.
3.3 Compare the graphs of a set
of functions of the form
y=af(bx)to the graph of y = f (x) ,
and generalize, using inductive
reasoning, a rule about the effects
of a and b.
3.4 Sketch the graph of y=af(x),
y=f(bx)or y=af(bx) for given
values of a and b, given a sketch
of the function y = f(x), where the
equation of y = f (x) is not given.

3.5 Write the equation of a
function, given its graph which is
a vertical and/or horizontal
stretch of the graph of the
function y = f (x) .
Specific Outcome 4: Apply translations and stretches to the graphs and
equations of functions.
Achievement Indicator: Example: 4.1Sketch the graph of the
function y−k=af(b(x−h))
for given values of a, b, h and k,
given
the graph of the function y= f (x)
, where the equation of
y = f (x) is not given.
4.2 Write the equation of a
function, given its graph which is
a translation and/or stretch of the
graph of the function y = f (x) .
Specific Outcome 5: Demonstrate an understanding of the effects of reflections on the graphs of
functions and their related equations, including reflections through the:
• x-axis
• y-axis
• line y = x.
Achievement Indicator: Example: 5.1Generalize the relationship
between the coordinates of an
ordered pair and the coordinates
of
the corresponding ordered pair
that results from a reflection
through the x-axis, the y-axis or
the line y = x.
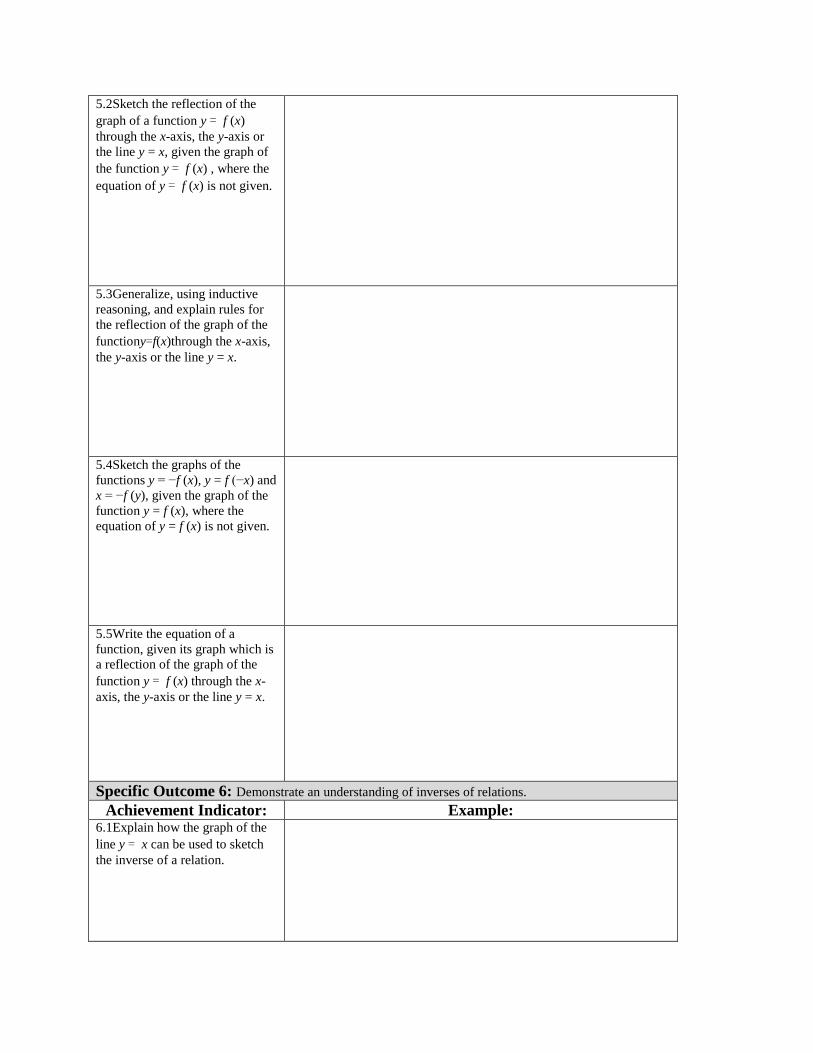
5.2Sketch the reflection of the
graph of a function y = f (x)
through the x-axis, the y-axis or
the line y = x, given the graph of
the function y = f (x) , where the
equation of y = f (x) is not given.
5.3Generalize, using inductive
reasoning, and explain rules for
the reflection of the graph of the
functiony=f(x)through the x-axis,
the y-axis or the line y = x.
5.4Sketch the graphs of the
functions y = −f (x), y = f (−x) and
x = −f (y), given the graph of the
function y = f (x), where the
equation of y = f (x) is not given.
5.5Write the equation of a
function, given its graph which is
a reflection of the graph of the
function y = f (x) through the x-
axis, the y-axis or the line y = x.
Specific Outcome 6: Demonstrate an understanding of inverses of relations.
Achievement Indicator: Example: 6.1Explain how the graph of the
line y = x can be used to sketch
the inverse of a relation.

6.2Explain how the
transformation (x, y) => (y, x) can
be used to sketch the inverse of a
relation.
6.3Sketch the graph of the
inverse relation, given the graph
of a relation.
6.4Determine if a relation and its
inverse are functions.
6.5Determine restrictions on the
domain of a function in order for
its inverse to be a function.
6.6Determine the equation and
sketch the graph of the inverse
relation, given the equation of a
linear or quadratic relation.
6.7Explain the relationship
between the domains and ranges
of a relation and its inverse.
6.8Determine, algebraically or
graphically, if two functions are
inverses of each other

SESSION 2
Specific Outcome 7: Demonstrate an understanding of logarithms.
Achievement Indicator: Example: 7.1Explain the relationship
between logarithms and
exponents.
7.2Express a logarithmic
expression as an exponential
expression and vice versa.
7.3Determine, without
technology, the exact value of a
logarithm, such as . log 2 8
7.4Estimate the value of a
logarithm, using benchmarks, and
explain the reasoning; e.g., since
log 2 8 = 3 and log 2 16 = 4, log 2
9is approximately equal to 3.1.
Specific Outcome 8: Demonstrate an understanding of the product, quotient and power laws of
logarithms.
Achievement Indicator: Example: 8.1Develop and generalize the
laws for logarithms, using
numeric examples and exponent
laws.

8.2Derive each law of logarithms.
8.3Determine, using the laws of
logarithms, an equivalent
expression for a logarithmic
expression.
8.4Determine, with technology,
the approximate value of a
logarithmic expression, such as
log 2 9
Specific Outcome 9: Graph and analyze exponential and logarithmic functions.
Achievement Indicator: Example: 9.1Sketch, with or without
technology, a graph of an
exponential function of the form
y =a^x, a > 0.
9.2Identify the characteristics of
the graph of an exponential
function of the form y = a^x, a >
0, including the domain, range,
horizontal asymptote and
intercepts, and explain the
significance of the horizontal
asymptote.
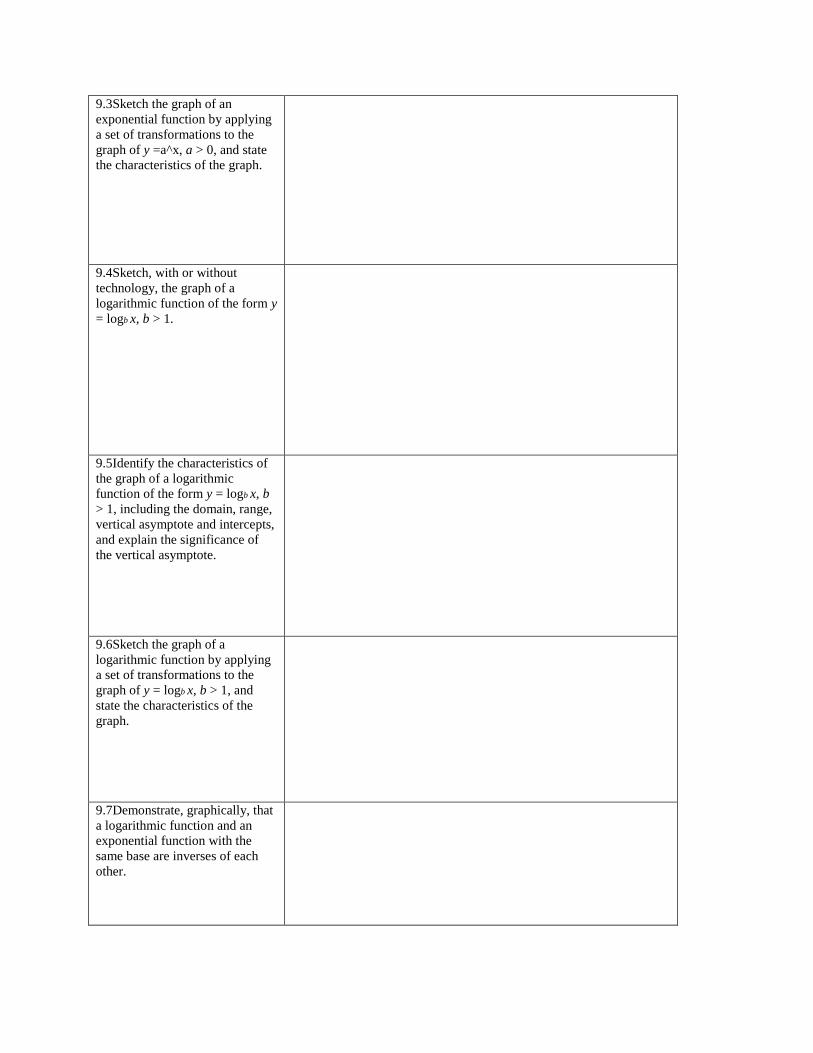
9.3Sketch the graph of an
exponential function by applying
a set of transformations to the
graph of y =a^x, a > 0, and state
the characteristics of the graph.
9.4Sketch, with or without
technology, the graph of a
logarithmic function of the form y
= logb x, b > 1.
9.5Identify the characteristics of
the graph of a logarithmic
function of the form y = logb x, b
> 1, including the domain, range,
vertical asymptote and intercepts,
and explain the significance of
the vertical asymptote.
9.6Sketch the graph of a
logarithmic function by applying
a set of transformations to the
graph of y = logb x, b > 1, and
state the characteristics of the
graph.
9.7Demonstrate, graphically, that
a logarithmic function and an
exponential function with the
same base are inverses of each
other.

Specific Outcome 10: Solve problems that involve exponential and logarithmic equations.
Achievement Indicator: Example: 10.1Determine the solution of an
exponential equation in which the
bases are powers of one another.
10.2Determine the solution of an
exponential equation in which the
bases are not powers of one
another, using a variety of
strategies.
10.3Determine the solution of a
logarithmic equation, and verify
the solution.
10.4Explain why a value
obtained in solving a logarithmic
equation may be extraneous.
10.5Solve a problem that
involves exponential growth or
decay.

10.6Solve a problem that
involves the application of
exponential equations to loans,
mortgages and investments.
10.7Solve a problem that
involves logarithmic scales, such
as the Richter scale and the pH
scale.
10.8Solve a problem by
modelling a situation with an
exponential or a logarithmic
equation.

SESSION 3
Specific Outcome 13: Graph and analyze radical functions (limited to functions involving one
radical).
Achievement Indicator: Example: 13.1Sketch the graph of the
function y =√x , using a table of
values, and state the domain
and range.
13.2Sketch the graph of the
function y −k=a√ b(x−h)by
applying transformations to the
graph of the function y = √x ,
and state the domain and range.
13.3Sketch the graph of the
function y = √f(x) , given the
graph of the function y= f(x),
and explain the strategies used.
13.4Compare the domain and
range of the function y = √f(x) ,
to the domain and range of the
function y = f(x), and explain
why the domains and ranges
may differ.

13.5Describe the relationship
between the roots of a radical
equation and the x-intercepts of
the graph of the corresponding
radical function.
13.6Determine, graphically, an
approximate solution of a
radical equation.
Specific Outcome 14: Graph and analyze rational functions (limited to numerators and denominators
that are monomials, binomials or trinomials).
Achievement Indicator: Example: 14.1Graph, with or without
technology, a rational function.
14.2Analyze the graphs of a set
of rational functions to identify
common characteristics.
14.3Explain the behaviour of
the graph of a rational function
for values of the variable near a
non-permissible value.

14.4Determine if the graph of a
rational function will have an
asymptote or a hole for a non-
permissible value.
14.5Match a set of rational
functions to their graphs, and
explain the reasoning.
14.6Describe the relationship
between the roots of a rational
equation and the x-intercepts of
the graph of the corresponding
rational function.
14.7Determine, graphically, an
approximate solution of a
rational equation.

SESSION 4
Topic 3: Permutations, Combinations and Binomial Theorem,
Topic 2: Polynomial Functions
General Outcome: Develop algebraic and numeric reasoning that involves combinatorics.
Specific Outcome 1: Apply the fundamental counting principle to solve problems.
Achievement Indicator: Example: 1.1Count the total number of
possible choices that can be
made, using graphic organizers
such as lists and tree diagrams.
1.2Explain, using examples,
why the total number of
possible choices is found by
multiplying rather than adding
the number of ways the
individual choices can be made.
1.3Solve a simple counting
problem by applying the
fundamental counting principle.
Specific Outcome 2: Determine the number of permutations of n elements taken r at a time to solve
problems. Achievement
Indicator: Example:
2.1Count, using graphic
organizers such as lists and tree
diagrams, the number of ways
of arranging the elements of a
set in a row.

2.2Determine, in factorial
notation, the number of
permutations of n different
elements taken n at a time to
solve a problem.
2.3Determine, using a variety
of strategies, the number of
permutations of n different
elements taken r at a time to
solve a problem.
2.4Explain why n must be
greater than or equal to r in the
notation nP r .
2.5Solve an equation that
involves nP r notation, such as
nP 2 =30
2.6Explain, using examples, the
effect on the total number of
permutations when two or more
elements are identical.

Specific Outcome 3: Determine the number of combinations of n different elements taken r at a time
to solve problems.
Achievement Indicators:
Example:
3.1Explain, using examples, the
difference between a
permutation and a combination.
3.2Determine the number of
ways that a subset of k elements
can be selected from a set of n
different elements.
3.3Determine the number of
combinations of n different
elements taken r at a time to
solve a problem.
3.4Explain why n must be
greater than or equal to r in the
notation nC r
3.5Explain, using examples,
why n C r = n C n- r

3.6Solve an equation that
involves n C r such as n C 2 = 15
Specific Outcome 4: Expand powers of a binomial in a variety of ways, including using the binomial
theorem (restricted to exponents that are natural numbers).
Achievement Indicators: Example: 4.1Explain the patterns found in
the expanded form of (x + y)n,
n ≤ 4 and n ∈N, by
multiplying n factors of (x + y).
4.2Explain how to determine
the subsequent row in Pascal’s
triangle, given any row.
4.3Relate the coefficients of the
terms in the expansion of
(x + y)n to the (n + 1) row in
Pascal’s triangle.
4.4Explain, using examples,
how the coefficients of the
terms in the expansion of (x +
y)n are determined by
combinations.

4.5Expand, using the binomial
theorem, (x + y)n.
4.6Determine a specific term in
the expansion of (x + y)n.
Specific Outcome 11: Demonstrate an understanding of factoring polynomials of degree greater than
2 (limited to polynomials of degree ≤ 5 with integral coefficients).
Achievement Indicator: Example: 11.1Explain how long division of
a polynomial expression by a
binomial expression of the form x
−a, a∈ I , is related to synthetic
division.
11.2Divide a polynomial
expression by a binomial
expression of the form x −a, a∈ I , using long division or
synthetic division.
11.3Explain the relationship
between the linear factors of a
polynomial expression and the
zeros of the corresponding
polynomial function

11.4Explain the relationship
between the remainder when a
polynomial expression is divided
by x −a, a ∈ I , and the value
of the polynomial expression at x
= a (remainder theorem).
11.5Explain and apply the factor
theorem to express a polynomial
expression as a product of
factors.
Specific Outcome 12: Graph and analyze polynomial functions (limited to polynomial functions of
degree ≤ 5 ).
Achievement Indicator: Example: 12.1Identify the polynomial
functions in a set of functions,
and explain the reasoning.
12.2Explain the role of the
constant term and leading
coefficient in the equation of a
polynomial function with respect
to the graph of the function.

12.3Generalize rules for graphing
polynomial functions of odd or
even degree.
12.4Explain the relationship
between:
the zeros of a
polynomial function
the roots of the
corresponding
polynomial equation
the x-intercepts of the
graph of the polynomial
function.
12.5Explain how the multiplicity
of a zero of a polynomial
function affects the graph.
12.6Sketch, with or without
technology, the graph of a
polynomial function.
12.6Solve a problem by
modelling a given situation with
a polynomial function and
analyzing the graph of the
function.

SESSION 5
Topic 1: Trigonometry
General Outcome: Develop trigonometric reasoning.
Specific Outcome 1: Demonstrate an understanding of angles in standard position, expressed in
degrees and radians.
Achievement Indicators:
Example:
1.1Sketch, in standard position,
an angle (positive or negative)
when the measure is given in
degrees.
1.2Describe the relationship
among different systems of angle
measurement, with emphasis on
radians and degrees.
1.3Sketch, in standard position,
an angle with a measure of 1
radian.
1.4Sketch, in standard position,
an angle with a measure
expressed in the form kπ
radians, where k∈Q.

1.5Express the measure of an
angle in radians (exact value or
decimal approximation), given its
measure in degrees.
1.6Express the measure of an
angle in degrees, given its
measure in radians (exact value
or decimal approximation).
1.7Determine the measures, in
degrees or radians, of all angles
in a given domain that are
coterminal with a given angle in
standard position.
1.8Determine the general form of
the measures, in degrees or
radians, of all angles that are
coterminal with a given angle in
standard position.
1.9Explain the relationship
between the radian measure of an
angle in standard position and the
length of the arc cut on a circle of
radius r, and solve problems
based upon that relationship.

Specific Outcome 2: Develop and apply the equation of the unit circle.
Achievement Indicators:
Example:
2.1Derive the equation of the unit
circle from the Pythagorean
theorem.
2.2Describe the six trigonometric
ratios, using a point P (x, y) that
is the intersection of the terminal
arm of an angle and the unit
circle.
2.3Generalize the equation of a
circle with centre (0, 0) and
radius r.
Specific Outcome 3: Solve problems, using the six trigonometric ratios for angles expressed in radians
and degrees.
Achievement Indicator: Example: 3.1Determine, with technology,
the approximate value of a
trigonometric ratio for any angle
with a measure expressed in
either degrees or radians.

3.2Determine, using a unit circle
or reference triangle, the exact
value of a trigonometric ratio for
angles expressed in degrees that
are multiples of 0º, 30º, 45º, 60º
or 90º, or for angles expressed in
radians that are multiples of 0,
π/6, π/4, π/3, or π/2 , and explain
the strategy.
3.3Explain how to determine the
exact values of the six
trigonometric ratios, given the
coordinates of a point on the
terminal arm of an angle in
standard position.
3.4Determine, with or without
technology, the measures, in
degrees or radians, of the angles
in a specified domain, given the
value of a trigonometric ratio.
3.5Determine the measures of the
angles in a specified domain in
degrees or radians, given a point
on the terminal arm of an angle in
standard position.
3.6Determine the exact values of
the other trigonometric ratios,
given the value of one
trigonometric ratio in a specified
domain.

3.7Sketch a diagram to represent
a problem that involves
trigonometric ratios.
3.8Solve a problem, using
trigonometric ratios.
Specific Outcome 4: Graph and analyze the trigonometric functions sine, cosine and tangent to solve
problems.
Achievement Indicator: Example: 4.1 Sketch, with or without
technology, the graph of y = sin
x, y = cos x or y = tan x.
4.2 Determine the characteristics
(amplitude, asymptotes, domain,
period, range and zeros) of the
graph of y = sin x, y = cos x or y =
tan x.
4.3 Determine how varying the
value of a affects the graphs of y
= a sin x and y = a cos x.

4.4 Determine how varying the
value of d affects the graphs of y
= sin x + d and y = cos x + d.
4.5 Determine how varying the
value of c affects the graphs of y
= sin (x + c) and y = cos (x + c).
4.6 Determine how varying the
value of b affects the graphs of y
= sin bx and y = cos bx.
4.7 Sketch, without technology,
graphs of the form y = a sin b(x −
c) + d or y = a cos b(x − c) + d,
using transformations, and
explain the strategies.
4.8 Determine the characteristics
(amplitude, asymptotes, domain,
period, phase shift, range and
zeros) of the graph of a
trigonometric function of the
form y = a sin b(x − c) + d or y =
a cos b(x − c) + d.

4.9 Determine the values of a, b,
c and d for functions of the form
y = a sin b(x − c) + d or y = a cos
b(x − c) + d that correspond to a
given graph, and write the
equation of the function.
4.10Determine a trigonometric
function that models a situation
to solve a problem.
4.11Explain how the
characteristics of the graph of a
trigonometric function relate to
the conditions in a problem
situation.
4.12 Solve a problem by
analyzing the graph of a
trigonometric function.
SESSION 6
Specific Outcome 5: Solve, algebraically and graphically, first and second degree trigonometric
equations with the domain expressed in degrees and radians.
Achievement Indicator: Example: 5.1 Verify, with or without
technology, that a given value is a
solution to a trigonometric
equation.
5.2 Determine, algebraically, the
solution of a trigonometric
equation, stating the solution in
exact form when possible.
5.3 Determine, using technology,
the approximate solution of a
trigonometric equation in a
restricted domain.
5.4 Relate the general solution of
a trigonometric equation to the
zeros of the corresponding
trigonometric function (restricted
to sine and cosine functions).
5.5 Determine, using technology,
the general solution of a given
trigonometric equation.
5.6 Identify and correct errors in
a solution for a trigonometric
equation.
Specific Outcome 6: Prove trigonometric identities, using:
• reciprocal identities
• quotient identities
• Pythagorean identities
• sum or difference identities (restricted to sine, cosine and tangent)
• double-angle identities (restricted to sine, cosine and tangent).
Achievement Indicator: Example: 6.1 Explain the difference
between a trigonometric identity
and a trigonometric equation.
6.2 Verify a trigonometric
identity numerically for a given
value in either degrees or radians.
6.3 Explain why verifying that
the two sides of a trigonometric
identity are equal for given values
is insufficient to conclude that the
identity is valid.
6.4 Determine, graphically, the
potential validity of a
trigonometric identity, using
technology.

6.5 Determine the non-
permissible values of a
trigonometric identity.
6.6 Prove, algebraically, that a
trigonometric identity is valid.
6.7 Determine, using the sum,
difference and double-angle
identities, the exact value of a
trigonometric ratio.