petroleum industry’s economic contribution to north...
TRANSCRIPT
Agribusiness and Applied Economics Report No. 639 January 2009
Petroleum Industry’s EconomicContribution to North Dakota in 2007
Dean A. BangsundF. Larry Leistritz
Department of Agribusiness and Applied EconomicsAgricultural Experiment StationNorth Dakota State University
Fargo, North Dakota 58108
ACKNOWLEDGMENTS
Special thanks are extended to Ron Ness, President, North Dakota Petroleum Council, forhis leadership, guidance, and information throughout the study. The North Dakota PetroleumCouncil also shared responsibility for administering the surveys and soliciting industrycooperation in the study.
Several individuals were helpful at various stages of the study. Our appreciation andthanks are extended to:
Lynn Helms (North Dakota Industrial Commission)Bruce Hicks (North Dakota Industrial Commission)Ryan Kopseng (Missouri River Royalty Corporation)Rick Ross (Whiting Oil and Gas)Wayne Biberdorf (Hess Corporation)Tod Maleckar (Diamond Resources)Steve Pine (Great Northern Energy)Keith Bayley (State Land Department)Kathy Strombeck (Office of State Tax Commissioner)Larry Melvin (U.S. Forest Service)Justin Kringstad (North Dakota Pipeline Authority)Shelly Swandal (Department of Agribusiness and Applied Economics)Norma Ackerson (Department of Agribusiness and Applied Economics)
The study authors and study sponsors would like to thank all the companies andindividuals that took the time to complete and return the survey materials. This study, with itsreliance on industry data, would not have been possible without industry cooperation.
Thanks are given to Norma Ackerson for document preparation, Shelly Swandal for workwith the study surveys, and to our colleagues for reviewing this manuscript.
Financial support was provided by the North Dakota Oil and Gas Research Council andthe North Dakota Petroleum Council. We express our appreciation for their support.
The authors assume responsibility for any errors of omission, logic, or otherwise. Anyopinions, findings, or conclusions expressed in this publication are those of the authors and donot necessarily reflect the views of the North Dakota Petroleum Council or the NDSUDepartment of Agribusiness and Applied Economics.
A single copy of this publication is available free of charge. Please address your inquiryto the Department of Agribusiness and Applied Economics, NDSU Dept 7610, PO Box 6050,Fargo, ND 58108-6050, phone (701-231-7441), fax (701-231-7400), or e-mail:[email protected] . This publication is also available electronically at the following website: http://agecon.lib.umn.edu/
NDSU is equal opportunity institution.
Copyright © 2009 by Bangsund and Leistritz. All rights reserved. Readers may makeverbatim copies of this document for non-commercial purposes by any means, provided thiscopyright notice appears on all such copies.
TABLE OF CONTENTSPage
List of Tables . . . . . . . . . . . . . . . . . . . . . . . . . . . . . . . . . . . . . . . . . . . . . . . . . . . . . . . . . . . . . . . . ii
List of Figures . . . . . . . . . . . . . . . . . . . . . . . . . . . . . . . . . . . . . . . . . . . . . . . . . . . . . . . . . . . . . . . iii
Executive Summary . . . . . . . . . . . . . . . . . . . . . . . . . . . . . . . . . . . . . . . . . . . . . . . . . . . . . . . . . . . iv
Introduction . . . . . . . . . . . . . . . . . . . . . . . . . . . . . . . . . . . . . . . . . . . . . . . . . . . . . . . . . . . . . . . . . . 1
Objectives . . . . . . . . . . . . . . . . . . . . . . . . . . . . . . . . . . . . . . . . . . . . . . . . . . . . . . . . . . . . . . . . . . . 2
Background . . . . . . . . . . . . . . . . . . . . . . . . . . . . . . . . . . . . . . . . . . . . . . . . . . . . . . . . . . . . . . . . . . 2Industry Organization . . . . . . . . . . . . . . . . . . . . . . . . . . . . . . . . . . . . . . . . . . . . . . . . . . . . 2Production Statistics . . . . . . . . . . . . . . . . . . . . . . . . . . . . . . . . . . . . . . . . . . . . . . . . . . . . . 4
Procedures . . . . . . . . . . . . . . . . . . . . . . . . . . . . . . . . . . . . . . . . . . . . . . . . . . . . . . . . . . . . . . . . . . . 8Data Collection . . . . . . . . . . . . . . . . . . . . . . . . . . . . . . . . . . . . . . . . . . . . . . . . . . . . . . . . . 8
Oil Operators . . . . . . . . . . . . . . . . . . . . . . . . . . . . . . . . . . . . . . . . . . . . . . . . . . . . . 8Pipelines and Processors . . . . . . . . . . . . . . . . . . . . . . . . . . . . . . . . . . . . . . . . . . . . 9Service and Support . . . . . . . . . . . . . . . . . . . . . . . . . . . . . . . . . . . . . . . . . . . . . . . . 9Leasing and Brokerage . . . . . . . . . . . . . . . . . . . . . . . . . . . . . . . . . . . . . . . . . . . . . 9
Estimation Techniques . . . . . . . . . . . . . . . . . . . . . . . . . . . . . . . . . . . . . . . . . . . . . . . . . . . 10Input-Output Analysis . . . . . . . . . . . . . . . . . . . . . . . . . . . . . . . . . . . . . . . . . . . . . . . . . . . 10
Economic Impacts . . . . . . . . . . . . . . . . . . . . . . . . . . . . . . . . . . . . . . . . . . . . . . . . . . . . . . . . . . . . 11Direct Impacts . . . . . . . . . . . . . . . . . . . . . . . . . . . . . . . . . . . . . . . . . . . . . . . . . . . . . . . . . 11
Exploration . . . . . . . . . . . . . . . . . . . . . . . . . . . . . . . . . . . . . . . . . . . . . . . . . . . . . . 11Extraction/Production . . . . . . . . . . . . . . . . . . . . . . . . . . . . . . . . . . . . . . . . . . . . . 13Processing . . . . . . . . . . . . . . . . . . . . . . . . . . . . . . . . . . . . . . . . . . . . . . . . . . . . . . 14Total Direct Impacts . . . . . . . . . . . . . . . . . . . . . . . . . . . . . . . . . . . . . . . . . . . . . . 15
Secondary Impacts . . . . . . . . . . . . . . . . . . . . . . . . . . . . . . . . . . . . . . . . . . . . . . . . . . . . . . 17Employment . . . . . . . . . . . . . . . . . . . . . . . . . . . . . . . . . . . . . . . . . . . . . . . . . . . . . . . . . . . 18
Direct Employment . . . . . . . . . . . . . . . . . . . . . . . . . . . . . . . . . . . . . . . . . . . . . . . 18Secondary Employment . . . . . . . . . . . . . . . . . . . . . . . . . . . . . . . . . . . . . . . . . . . . 20
Government Revenues . . . . . . . . . . . . . . . . . . . . . . . . . . . . . . . . . . . . . . . . . . . . . . . . . . . 21Total Economic Impacts . . . . . . . . . . . . . . . . . . . . . . . . . . . . . . . . . . . . . . . . . . . . . . . . . 22
Comparison of 2005 and 2007 Industry Assessments . . . . . . . . . . . . . . . . . . . . . . . . . . . . . . . . . 24
Summary . . . . . . . . . . . . . . . . . . . . . . . . . . . . . . . . . . . . . . . . . . . . . . . . . . . . . . . . . . . . . . . . . . . 32
Conclusions . . . . . . . . . . . . . . . . . . . . . . . . . . . . . . . . . . . . . . . . . . . . . . . . . . . . . . . . . . . . . . . . . 36
References . . . . . . . . . . . . . . . . . . . . . . . . . . . . . . . . . . . . . . . . . . . . . . . . . . . . . . . . . . . . . . . . . . 38
AppendicesAppendix A - Questionnaire, Oil Operators, North Dakota, 2007 . . . . . . . . . . . . . . 40Appendix B - Questionnaire, Processors, North Dakota, 2007 . . . . . . . . . . . . . . . . 50Appendix C - Questionnaire, Lease/Brokerage Firms, North Dakota, 2007 . . . . . . 57
i
List of TablesTable Page
1 Basic Production Statistics from Survey of Oil Operators, North Dakota, 2007 . . . . . 9
2 Direct Impacts from General Exploration, Drilling Activities, and LeaseBonuses, North Dakota, 2007 . . . . . . . . . . . . . . . . . . . . . . . . . . . . . . . . . . . . . . . . . . . 12
3 Direct Impacts from Oil and Gas Extraction and Production Activities,North Dakota, 2007 . . . . . . . . . . . . . . . . . . . . . . . . . . . . . . . . . . . . . . . . . . . . . . . . . . 14
4 Direct Impacts from Oil and Gas Processing, North Dakota, 2007 . . . . . . . . . . . . . . 15
5 Total Direct Impacts, Petroleum Industry, North Dakota, 2007 . . . . . . . . . . . . . . . . . 16
6 Total Secondary Impacts, Petroleum Industry, North Dakota, 2007 . . . . . . . . . . . . . 18
7 State and Local Government Revenues Attributable to the Petroleum Industry,North Dakota, 2007 . . . . . . . . . . . . . . . . . . . . . . . . . . . . . . . . . . . . . . . . . . . . . . . . . . 22
8 Total (Direct and Secondary) Economic Impacts, Petroleum Industry, North Dakota, 2007 . . . . . . . . . . . . . . . . . . . . . . . . . . . . . . . . . . . . . . . . . . . . . . . . . . 24
9 Oil and Gas Production Statistics, North Dakota, 2005 and 2007 . . . . . . . . . . . . . . . 25
10 Summary of Oil Operator Surveys, North Dakota, 2005 and 2007 . . . . . . . . . . . . . . 26
11 Comparison of 2005 and 2007 Economic Estimates, ExplorationComponent of Petroleum Industry, North Dakota . . . . . . . . . . . . . . . . . . . . . . . . . . . 27
12 Comparison of 2005 and 2007 Economic Estimates, Oil and GasExtraction/Production Component of Petroleum Industry, North Dakota . . . . . . . . . 28
13 Comparison of 2005 and 2007 Economic Estimates, Processing Componentof Petroleum Industry, North Dakota . . . . . . . . . . . . . . . . . . . . . . . . . . . . . . . . . . . . . 29
14 Estimates State and Local Government Revenues Generated by PetroleumIndustry, North Dakota, 2005 and 2007 . . . . . . . . . . . . . . . . . . . . . . . . . . . . . . . . . . . 30
15 Direct and Secondary Employment, Petroleum Industry, North Dakota,2005 and 2007 . . . . . . . . . . . . . . . . . . . . . . . . . . . . . . . . . . . . . . . . . . . . . . . . . . . . . . . 31
16 Key Economic Values, Petroleum Industry, North Dakota, 2005 and 2007 . . . . . . . 32
ii
List of FiguresFigure Page
1 Oil Producing Counties, North Dakota . . . . . . . . . . . . . . . . . . . . . . . . . . . . . . . . . . . . . 4
2 Historic Oil Production, Key Counties, North Dakota, 1952 through 2008 . . . . . . . . . 5
3 Top States in Crude Oil Production, United States, 1981 through 2007 . . . . . . . . . . . 5
4 Crude Oil Production, North Dakota, 1951 through 2007 and Projected 2008 . . . . . . 6
5 Production and Market Value of Crude Oil, North Dakota, 1974 through 2007 . . . . . 7
6 Value of Crude Oil Production in Nominal and Real Dollars, North Dakota,1974 through 2007 . . . . . . . . . . . . . . . . . . . . . . . . . . . . . . . . . . . . . . . . . . . . . . . . . . . . 7
7 Economic Effects of Key Segments of the North Dakota Petroleum Industry, 2007 . . . . . . . . . . . . . . . . . . . . . . . . . . . . . . . . . . . . . . . . . . . . . . . . . . . . . . . 35
iii
Executive Summary
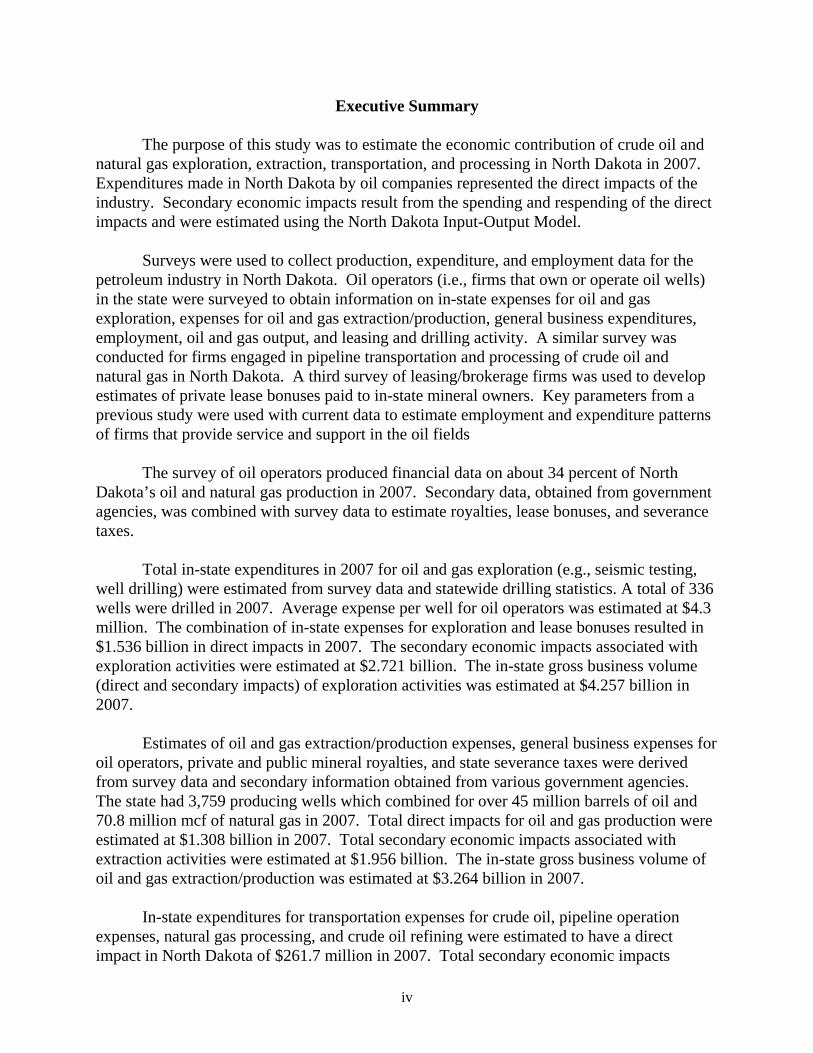
The purpose of this study was to estimate the economic contribution of crude oil andnatural gas exploration, extraction, transportation, and processing in North Dakota in 2007. Expenditures made in North Dakota by oil companies represented the direct impacts of theindustry. Secondary economic impacts result from the spending and respending of the directimpacts and were estimated using the North Dakota Input-Output Model.
Surveys were used to collect production, expenditure, and employment data for thepetroleum industry in North Dakota. Oil operators (i.e., firms that own or operate oil wells)in the state were surveyed to obtain information on in-state expenses for oil and gasexploration, expenses for oil and gas extraction/production, general business expenditures,employment, oil and gas output, and leasing and drilling activity. A similar survey wasconducted for firms engaged in pipeline transportation and processing of crude oil andnatural gas in North Dakota. A third survey of leasing/brokerage firms was used to developestimates of private lease bonuses paid to in-state mineral owners. Key parameters from aprevious study were used with current data to estimate employment and expenditure patternsof firms that provide service and support in the oil fields
The survey of oil operators produced financial data on about 34 percent of NorthDakota’s oil and natural gas production in 2007. Secondary data, obtained from governmentagencies, was combined with survey data to estimate royalties, lease bonuses, and severancetaxes.
Total in-state expenditures in 2007 for oil and gas exploration (e.g., seismic testing,well drilling) were estimated from survey data and statewide drilling statistics. A total of 336wells were drilled in 2007. Average expense per well for oil operators was estimated at $4.3million. The combination of in-state expenses for exploration and lease bonuses resulted in$1.536 billion in direct impacts in 2007. The secondary economic impacts associated withexploration activities were estimated at $2.721 billion. The in-state gross business volume(direct and secondary impacts) of exploration activities was estimated at $4.257 billion in2007.
Estimates of oil and gas extraction/production expenses, general business expenses foroil operators, private and public mineral royalties, and state severance taxes were derivedfrom survey data and secondary information obtained from various government agencies. The state had 3,759 producing wells which combined for over 45 million barrels of oil and70.8 million mcf of natural gas in 2007. Total direct impacts for oil and gas production wereestimated at $1.308 billion in 2007. Total secondary economic impacts associated withextraction activities were estimated at $1.956 billion. The in-state gross business volume ofoil and gas extraction/production was estimated at $3.264 billion in 2007.
In-state expenditures for transportation expenses for crude oil, pipeline operationexpenses, natural gas processing, and crude oil refining were estimated to have a directimpact in North Dakota of $261.7 million in 2007. Total secondary economic impacts
iv
associated with processing and transporting crude oil and natural gas were estimated at $445million. Processing and transporting crude oil and natural gas generated a gross businessvolume of $707 million in 2007.
Industry-wide direct and secondary economic impacts from the petroleum industrywere estimated at $3.106 billion and $5.123 billion, respectively. The gross business volumefor the entire industry in North Dakota in 2007 was estimated at $8.229 billion.
Additional measures of the petroleum industry’s economic importance to the stateinclude direct employment for 7,719 full-time jobs, economy-wide personal income of $3.1billion, statewide retail sales of $2 billion, direct contributions to local and state governmenttax revenues of $520 million, indirect contribution of $120 million in state governmentgeneral tax collections, and secondary employment of 38,500 full-time equivalent jobs.
Comparing various production statistics between 2005 and 2007 revealed that thenumber of producing wells, oil and gas production, and drilling activities all increased in thestate. Oil and natural gas prices between the two periods were similar after adjusting 2005figures for inflation. From 2005 to 2007, expenditures for exploration (i.e., well drilling andleasing mineral rights) in the state increased nearly 230 percent in real terms (i.e., correctingfor inflation). By comparison, expenditures for oil and natural gas production over the sameperiod paralleled changes in oil and gas output and were estimated to increase by 36 percentin real terms. Processing and transportation activities also showed substantial growth overthe period due to increased processing and transportation volumes and expansion ofprocessing and pipeline capacity. Economic activity associated with the processing segmentof the industry increased in real terms by 81 percent. Overall, the gross business volume(i.e., direct and secondary economic effects) of the industry was estimated to double in size inreal terms from $4.1 billion in 2005 to $8.2 billion in 2007.
While this study is a snapshot in time, results from this study would suggest thatrecent increases in exploration, processing and pipeline capacity and output, and increases incrude oil and natural gas production, have translated into substantial increases in grossbusiness volume for the state. The economic size of the industry has grown in recent years tobecome one of most single important basic-sector activities in the state. The industryprovides substantial governmental revenues through traditional tax collections, royaltyrevenue, lease bonuses, and severance taxes. In addition to public sector revenues, thepetroleum industry continues to act as a solidifying force in the North Dakota economythrough an expansion of industry-based employment and indirectly through bolsteredsecondary economic activity involving nearly all sectors of the economy.
The sheer size of the industry in 2007 suggests that much of North Dakota’s recenteconomic vitality can be linked to the expansion of petroleum exploration, production, andprocessing in the state. Current activity levels in the petroleum industry clearly make it oneof the key forces in the North Dakota economy.
v

Petroleum Industry’s Economic Contribution to North Dakota in 2007
Dean A. Bangsund and F. Larry Leistritz*
Introduction
North Dakota’s largest basic sector industries, which include agriculture,manufacturing, and energy, provide much of the economic stimuli for the state’s economy. These large industries are generally comprised of distinct sectors or economic groups. Forexample, agriculture in North Dakota is often considered a combination of crop productionand livestock. The energy industry in North Dakota is also comprised of several distinctsectors that are commonly treated as separate activities. North Dakota’s energy industriescan be conveniently separated into the activities that produce and distribute electricity, coal,and petroleum.
While separating the energy industry into similar activities is relatively straightforward, identifying the economic players within those sectors is less clear. In the case ofelectricity generation, a handful of firms and generating facilities exist within the state. Thesame situation exists with coal production–a handful of companies operate at a limitednumber of locations. However, the industrial organization associated with oil and natural gasproduction is very different. Rather than having a handful of firms and a limited number ofsite-specific facilities and locations, the petroleum industry involves hundreds of firms and amultitude of facilities spread out over the western third of North Dakota.
North Dakota’s rank among the nation’s top 10 oil producing states is commonknowledge to those in the petroleum sector, and national oil production statistics are readilyavailable to the general public (U.S. Department of Energy 2008). In 2006, the firstcomprehensive economic assessment of the petroleum industry in the state was conducted(Bangsund and Leistritz 2007). Since that time, much attention has been focused on theindustry; however, much of the attention has less to do with a revelation of the industry’simportance to the state, but rather due to substantial changes in drilling activity, oil output,tax revenues, and dramatic swings in crude oil prices.
Recent upswings in oil activity since 2005, due in part to increased energy prices, theavailability of improved exploration and extraction technology, and substantial potential foroil recovery from various formations in the Williston Basin, have brought new attention tothe petroleum industry in North Dakota. Increase in leasing activity, expansion of welldrilling rigs operating in the state, substantial growth in severance tax collections, and otherfinancial and economic aspects of the industry have all been discussed in the media. Despitea recently completed study of the industry in 2006, another assessment of the industry is
*Research scientist and professor, respectively, Department of Agribusiness and Applied Economics,North Dakota State University, Fargo.
warranted to track the substantial change in physical and economic activity in NorthDakota’s oil patch.
Ongoing and repeated assessments of key industries in North Dakota are notunprecedented. Actually, many key industries periodically re-assess their economicimportance in the state. Examples include several assessments for the wheat and sugarbeetindustries (Bangsund and Leistritz 2005, 2004, 1998, 1995b) and studies of the ligniteindustry in North Dakota (Coon and Leistritz 2008a).
Determining the economic contribution of a given industry quantifies its importanceto state and local economies. Not only can the economic impacts to the state and localeconomies be measured, but the effects on specific economic sectors and related industriesalso can be identified. Also, economic studies can demonstrate the susceptibility of theNorth Dakota economy to fluctuations in factors affecting petroleum exploration andextraction, demonstrate the economic dependence of the state on natural resource-basedindustries, and indicate the economic impacts that could result from potential changes inpolicies which affect the petroleum industry.
Objectives
The purpose of this report is to estimate the economic contribution (direct andsecondary effects) of the petroleum industry to the economy of North Dakota. Specificobjectives include:
1) estimate the economic size of petroleum exploration, extraction, and processingsectors, and
2) provide estimates of industry-wide employment, tax revenues, and other keyeconomic measures.
Background
The industrial organization of the petroleum industry in the United States is oftendivided into upstream and downstream components. The upstream components of thepetroleum industry generally include exploration, development, and production of crude oiland natural gas. The downstream components include transportation, processing,distribution, marketing, and retail delivery of petroleum products.
Industry Organization
The petroleum industry in North Dakota consists of both upstream and downstreamcomponents. For this study, the petroleum industry was defined to only include in-stateexploration, extraction/production, transportation, and processing of crude oil and naturalgas. Exploration can be generally thought of as the process of finding mineral resources. Extraction or production is the process of developing and recovering mineral resources.
2
Transportation components of the industry, in this study, were limited to the movement of oiland gas from wells to collection points, and then on to processing facilities located either in-state or out-of-state. Petroleum processing in North Dakota included refining of crude oiland natural gas processing. The distribution, marketing, and retail sale of processedpetroleum products (e.g., diesel, gasoline, kerosene, motor oil, lubricants, propane, naturalgas) were not included.
The exploration and extraction phases of the petroleum industry are not organized likeother industries in the state. Firms that own producing wells (oil operators) contract much ofthe work of exploration and extraction of oil and gas to other firms that specialize in variousaspects of those processes. As a result, much of the expenditures incurred in the state for oiland gas production start with the oil operator but flow through the various firms engaged inproviding support and service within the oil fields. While oil operators represent a mix ofsmall to large firms, a majority of the prominent oil operators in North Dakota also haveoperations in other states. For many oil operators, their operations in North Dakota do notrepresent the majority of their oil and gas revenues. As a result of having operations and/orheadquarters in other states, net revenues from North Dakota oil and gas production mayleave the state for a variety of reasons. However, North Dakota is still the beneficiary ofexploration and discovery expenses from firms that may have minimal operations in the state.
Oil and gas wells typically have three types of economic interests. These players areoften referred to as royalty interests, owner/operator interests, and working interests. Royaltyinterests receive a share of the value of a well’s output but do not share in the expensesassociated with the well. Owner and working interests share, based on various percentagesor arrangements, the remaining revenues and all of the expenses of a well. The well owner oroperator is generally responsible or in charge of all operations. The owner arranges to havework completed for most of the necessary activities associated with the well, and chargesworking interests for their share of the expenses. As a result of these typical arrangements,the total number of firms receiving revenues and incurring expenses from oil and gas wells inNorth Dakota is unknown. However, the number of oil operators (firms that own or operatewells) is known.
For various reasons, the magnitude of economic effects of oil and gas production arenot necessarily equivalent to the market value (i.e., price times quantity) of oil and gasproduced. Exploration and extraction technologies use specialized inputs and services, manyof which are not available in North Dakota and must be purchased from out-of-state sources. Many oil operators have operations and/or are headquartered in other states, and revenues forsome firms may leave the state to be used for projects elsewhere. The same situation mayexist where firms use resources obtained from out-of-state operations for oil and gasexploration in the state. In addition, oil operators headquartered out-of-state often haveminimal general business expenses in the state. Similarly, firms that only have workinginterests in producing wells may or may not have physical operations in the state. All ofthese factors make it very problematic to base economic importance of the petroleumindustry solely on the value of oil and gas production.
3
BIL
LIN
GS
BOTTINEAU
BOWMAN
BURKE
DUNN
HETTINGER
MCHENRY
MCKENZIEMCLEAN
MOUNTRAIL
SLOPE
STARK
WARD
WILLIAMS
RE
NV
ILL
E
VA
LL
EY
GO
LD
EN
DIVIDE
Production Statistics
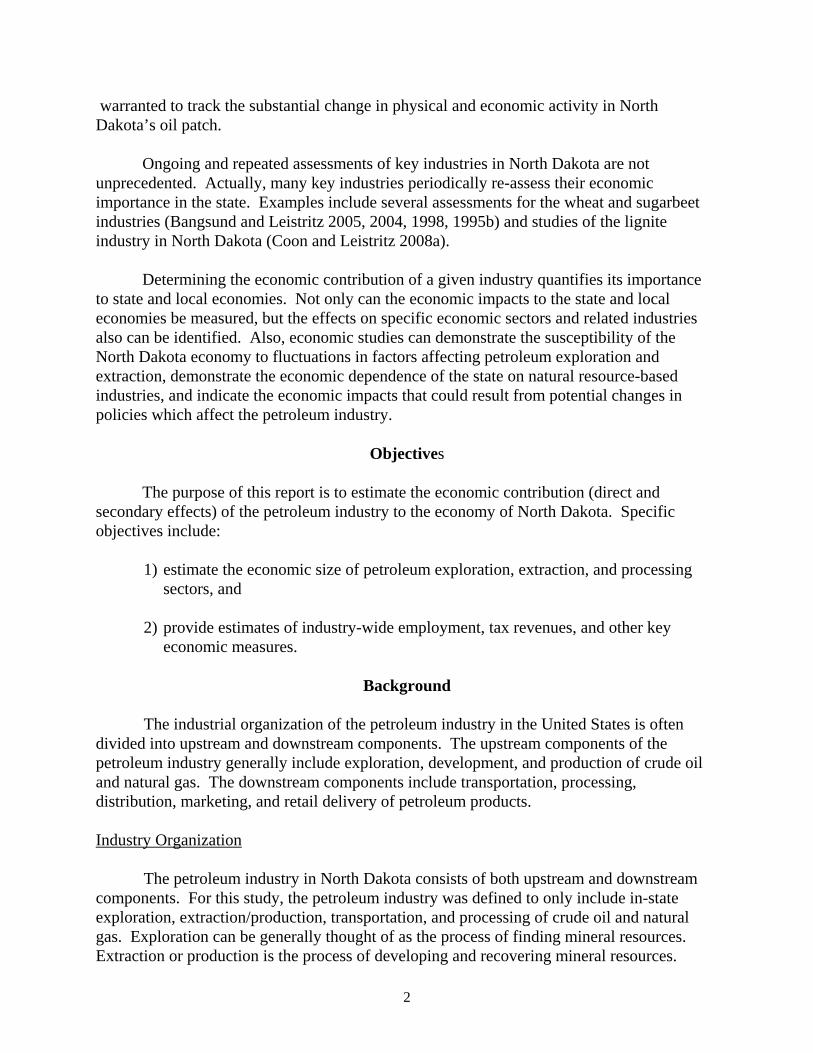
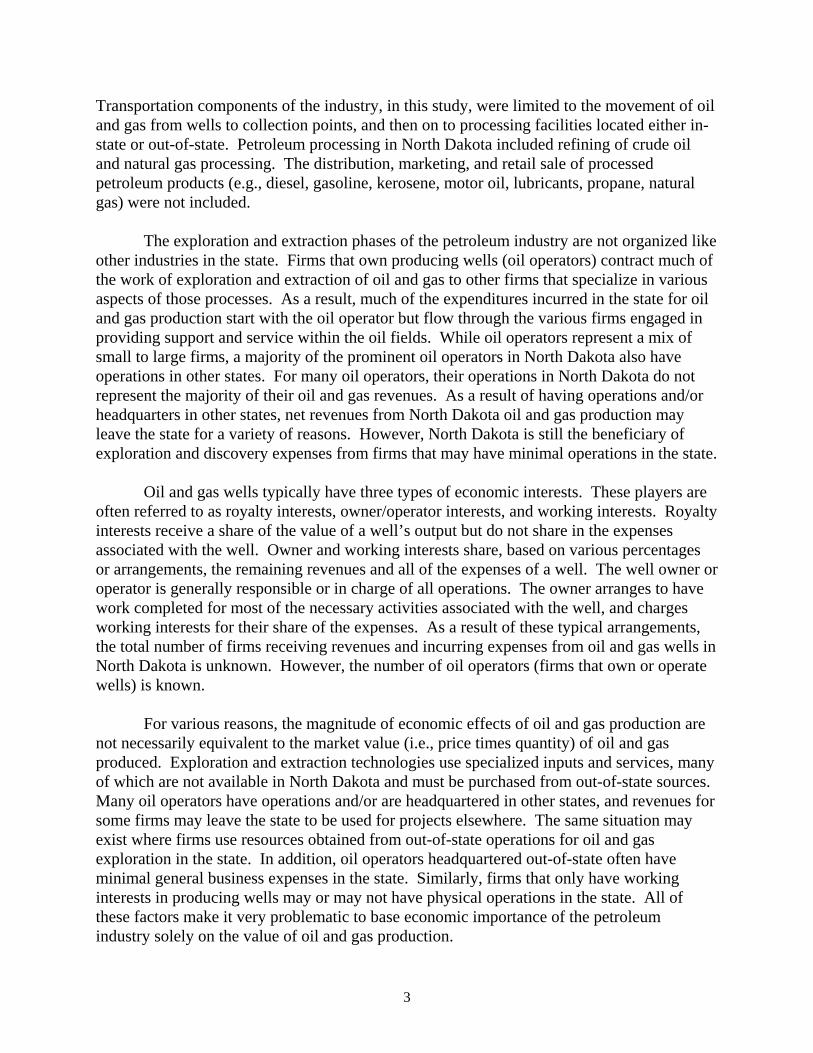
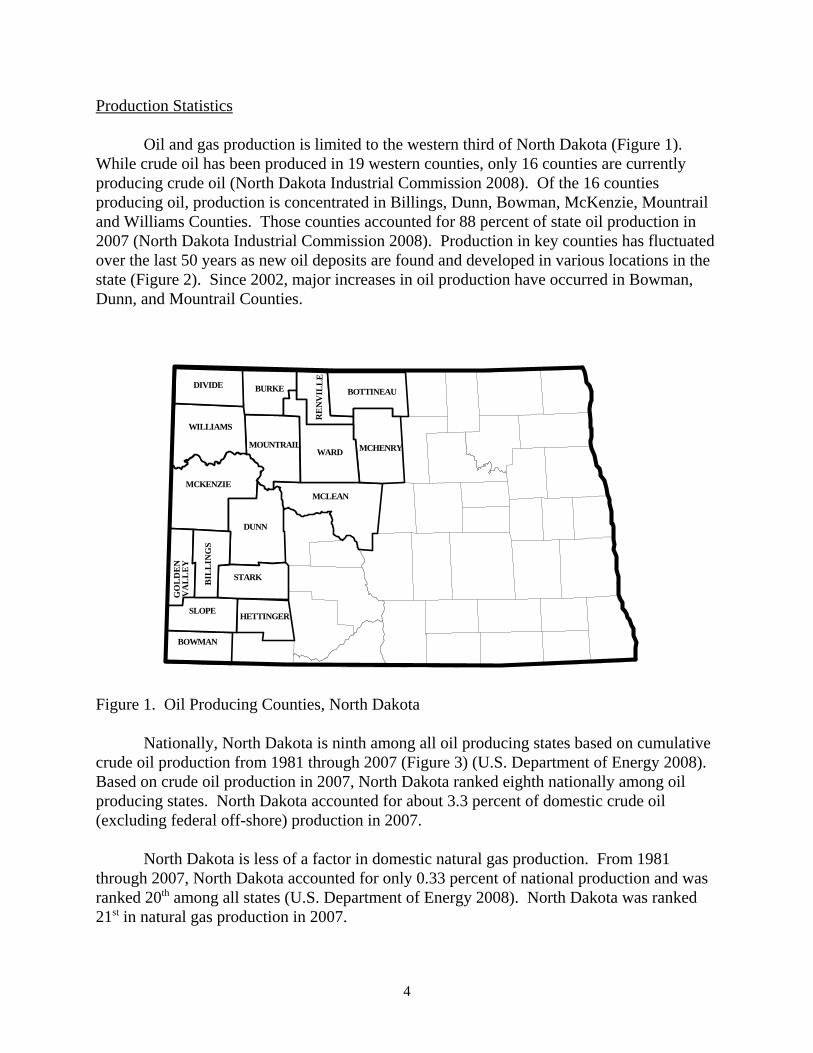
Oil and gas production is limited to the western third of North Dakota (Figure 1). While crude oil has been produced in 19 western counties, only 16 counties are currentlyproducing crude oil (North Dakota Industrial Commission 2008). Of the 16 countiesproducing oil, production is concentrated in Billings, Dunn, Bowman, McKenzie, Mountrailand Williams Counties. Those counties accounted for 88 percent of state oil production in2007 (North Dakota Industrial Commission 2008). Production in key counties has fluctuatedover the last 50 years as new oil deposits are found and developed in various locations in thestate (Figure 2). Since 2002, major increases in oil production have occurred in Bowman,Dunn, and Mountrail Counties.
Figure 1. Oil Producing Counties, North Dakota
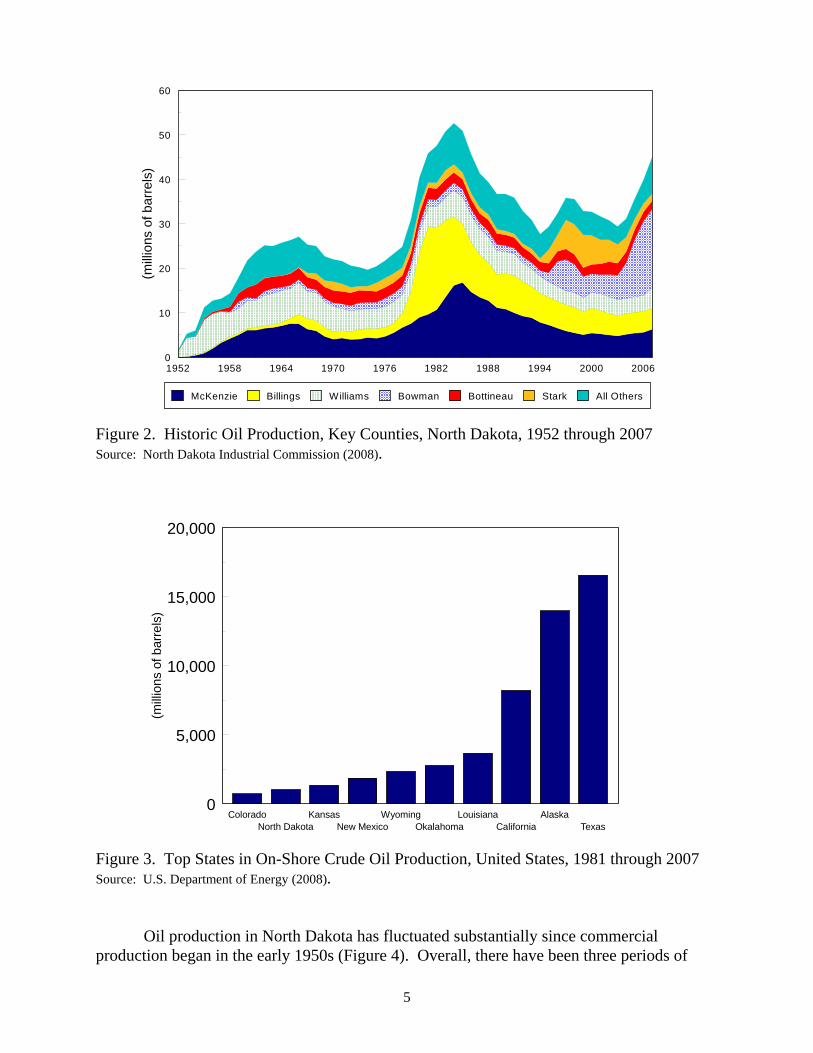
Nationally, North Dakota is ninth among all oil producing states based on cumulativecrude oil production from 1981 through 2007 (Figure 3) (U.S. Department of Energy 2008). Based on crude oil production in 2007, North Dakota ranked eighth nationally among oilproducing states. North Dakota accounted for about 3.3 percent of domestic crude oil(excluding federal off-shore) production in 2007.
North Dakota is less of a factor in domestic natural gas production. From 1981through 2007, North Dakota accounted for only 0.33 percent of national production and wasranked 20th among all states (U.S. Department of Energy 2008). North Dakota was ranked21st in natural gas production in 2007.
4
1952 1958 1964 1970 1976 1982 1988 1994 2000 20060
10
20
30
40
50
60
(milli
ons
of b
arre
ls)
McKenzie Billings Williams Bowman Bottineau Stark All Others
ColoradoNorth Dakota
KansasNew Mexico
WyomingOkalahoma
LouisianaCalifornia
AlaskaTexas
0
5,000
10,000
15,000
20,000
(mill
ions
of b
arre
ls)
Figure 2. Historic Oil Production, Key Counties, North Dakota, 1952 through 2007Source: North Dakota Industrial Commission (2008).
Figure 3. Top States in On-Shore Crude Oil Production, United States, 1981 through 2007Source: U.S. Department of Energy (2008).
Oil production in North Dakota has fluctuated substantially since commercialproduction began in the early 1950s (Figure 4). Overall, there have been three periods of
5
1954 1960 1966 1972 1978 1984 1990 1996 2002 20080
10
20
30
40
50
60
(mill
ions
of b
arre
ls)
Actual Projected
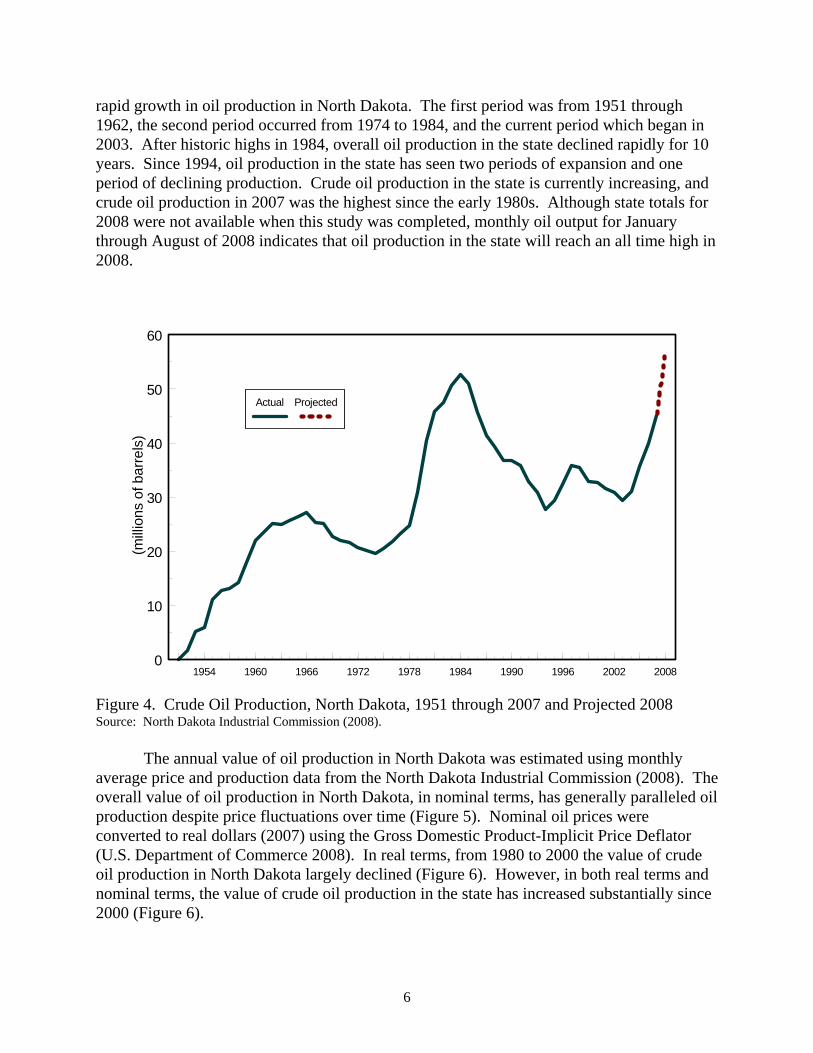
rapid growth in oil production in North Dakota. The first period was from 1951 through1962, the second period occurred from 1974 to 1984, and the current period which began in2003. After historic highs in 1984, overall oil production in the state declined rapidly for 10years. Since 1994, oil production in the state has seen two periods of expansion and oneperiod of declining production. Crude oil production in the state is currently increasing, andcrude oil production in 2007 was the highest since the early 1980s. Although state totals for2008 were not available when this study was completed, monthly oil output for Januarythrough August of 2008 indicates that oil production in the state will reach an all time high in2008.
Figure 4. Crude Oil Production, North Dakota, 1951 through 2007 and Projected 2008Source: North Dakota Industrial Commission (2008).
The annual value of oil production in North Dakota was estimated using monthlyaverage price and production data from the North Dakota Industrial Commission (2008). Theoverall value of oil production in North Dakota, in nominal terms, has generally paralleled oilproduction despite price fluctuations over time (Figure 5). Nominal oil prices wereconverted to real dollars (2007) using the Gross Domestic Product-Implicit Price Deflator(U.S. Department of Commerce 2008). In real terms, from 1980 to 2000 the value of crudeoil production in North Dakota largely declined (Figure 6). However, in both real terms andnominal terms, the value of crude oil production in the state has increased substantially since2000 (Figure 6).
6

1974 1976 1978 1980 1982 1984 1986 1988 1990 1992 1994 1996 1998 2000 2002 2004 200610
20
30
40
50
60
0
0.5
1
1.5
2
2.5
3
3.5
(mill
ions
of b
arre
lls)
(bill
ions
of n
omin
al d
olla
rs)
Value ofoil output
Oilproduction
1974 1976 1978 1980 1982 1984 1986 1988 1990 1992 1994 1996 1998 2000 2002 2004 20060
1
2
3
4
(bill
ions
of d
olla
rs)
NominalDollars
Real (2007)Dollars
Figure 5. Production and Market Value of Crude Oil, North Dakota, 1974 through 2007Source: North Dakota Industrial Commission (2008).
Figure 6. Value of Crude Oil Production in Nominal and Real Dollars, North Dakota, 1974through 2007
7
Procedures
An economic contribution analysis, as defined in this study, represents an estimate ofall relevant in-state expenditures and returns associated with an industry. The economiccontribution approach to estimating economic activity has been used for several otherindustries in North Dakota (Bangsund and Leistritz 1995a, 1995b, 1998, 1999, 2004, 2005;Coon and Leistritz 2008a).
Data Collection
Due to the complexities of how the oil and gas industry is structured, and that in-stateeffects (i.e., first round spending or direct impacts) from oil and gas production in any givenyear may not equal the market value of oil and gas production, an expenditure-basedapproach to measuring the economic size of the petroleum industry was used in this study. Inthis approach, a sample of firms active in the petroleum industry in North Dakota were askedto provide estimates of the amount of expenditures made to entities (i.e., individuals, firms,and governments) in North Dakota. Two separate survey efforts were conducted for thestudy and provided the basis for most of the economic data needed to complete the study.
Oil Operators
Firms that own or operate oil wells in the state were surveyed to obtain information onexpenses for oil and gas exploration and extraction/production, general business expenses inthe state, employment, physical measures of oil and gas production, and leasing and drillingactivity (Appendix A). The North Dakota Petroleum Council provided names and addressesfor 140 oil operators in the state. The survey process started with sending cover letters and aquestionnaire to each firm on the mailing list. A second mailing was conducted for all firmsthat had not responded1 to the first mailing. After two mailings, dissemination of surveymaterials and solicitation of industry cooperation was deferred to the study sponsor.
The combination of two mailings and personal contacts of oil operators conducted bythe study sponsor resulted in useable information from 14 firms. The firms’ production fromowned/operated wells represented about 34 percent of the state’s 2007 production of crudeoil and natural gas (Table 1).
1Firms with non-deliverable addresses, those who responded with completed questionnaires, and those whoindicated they would not or could not participate were excluded in the second mailing.
8

Table 1. Basic Production Statistics from Survey of Oil Operators, North Dakota, 2007
Number of firms responding with useful information 14
Number of wells owned or operated in North Dakota (14 firms) 1,897
Crude oil production in 2007 in North Dakota (14 firms) 13,503,595 barrelsa
Natural gas production in 2007 in North Dakota (14 firms) 34,360,934 mcfa
Number of oil wells drilled in 2007 (9 firms) 126a Output from wells operated or owned. Does not include production from working interests.
Pipelines and Processors
Another survey was conducted for firms engaged in pipeline transportation of crudeoil and unprocessed natural gas produced in North Dakota and for firms involved withprocessing of crude oil and natural gas in North Dakota. The survey was used to obtainestimates of the amount and type of expenditures made in North Dakota and in-stateemployment by those firms (Appendix B). A mailing list of 10 firms operating pipelines, gasprocessing plants, and oil refineries were provided by the North Dakota Petroleum Council. The firms on the mailing list received two mailings, with some firms being contactednumerous times by industry representatives. A total of four firms provided useableinformation. While representative data for industry activities in this segment of the industrywas obtained through the survey, a breakout of survey data for crude oil pipelines, natural gasprocessing plants and pipelines, and crude oil refineries is not possible due to confidentialityreasons. Firms operating pipelines for the transport of refined or processed petroleumproducts were not included in the study.
Service and Support
Information from firms that provide service and support to oil operators in the statewas obtained from Bangsund and Leistritz (2007). Key parameters from the surveyconducted in 2006 were used in this study. When applicable, financial coefficients from2005 data were adjusted to correct for effects of inflation using the Gross Domestic Product-Implicit Price Deflator (U.S. Department of Commerce 2008).
Leasing and Brokerage
A survey of companies providing leasing services to petroleum sector firms wasconducted to obtain information on oil leasing activities in North Dakota. A questionnairewas developed to obtain information necessary to estimate the amount of lease bonuses onprivate land paid to North Dakota entities (Appendix C). The study sponsor distributed thequestionnaire to five firms. The survey resulted in obtaining useable financial information
9

from three firms. Lease bonuses for government mineral ownership were obtained bycontacting the respective federal and state agencies in the state.
Estimation Techniques
The survey of oil operators and processors/pipeline operators and information fromBangsund and Leistritz (2007) provided data for two critical aspects of the study. First, datafrom the oil operator and processor surveys was used to set the level of spending in NorthDakota. In other words, the data was used to determine the magnitude of spending within thestate. Second, data from both current surveys and previous surveys (Bangsund and Leistritz2007) was used to determine the type and distribution of spending among various sectors ofthe North Dakota economy.
The survey of oil operators provided financial data on about one-third of all oil andgas production in the state. In addition, survey respondents provided information onexploration expenses, wells drilled, and leasing data. Benchmark expenses forextraction/production, transportation, and operational expenses (e.g., general administrativecosts) were estimated per barrel of oil equivalent (BOE). Total state production in 2007,expressed in BOE, was then used with survey estimates of in-state expenditures per BOE togenerate state-level estimates for extraction, transportation, and administrative spending. In-state employment by oil operators was estimated in the same manner. Benchmark expensesfor exploration were estimated on a per-well drilled basis and were used with data on thenumber of wells drilled in North Dakota in 2007. Data from the survey of oil lease/brokeragefirms was used with data from the North Dakota State Land Department to estimate in-statebonus payments for private leases. Other economic components of the petroleum industry’sdirect impacts, such as severance taxes, public lease bonuses, and royalty revenuesrepresented a combination of survey data, state-level statistics, and information obtainedfrom various state and federal governmental agencies.
The survey of service and support firms for oil and gas production in North Dakotaprovided estimates of in-state spending by various types of expenses (e.g., salaries/wages,utilities, office supplies, business services) (Bangsund and Leistritz 2007). The percentage ofspending in various categories, obtained from Bangsund and Leistritz (2007), was used toallocate state-level expenditures for exploration and extraction to various economic sectors ofthe North Dakota Input-Output Model. The amount of spending was determined using datafrom the survey of oil operators, while data from Bangsund and Leistritz (2007) providedinsights on how those dollars impacted various sectors of the North Dakota economy.
Input-Output Analysis
Economic activity from a project, program, policy, or activity can be categorized intodirect and secondary impacts. Direct impacts are those changes in output, employment, orincome that represent the initial or first-round effects of the project, program, policy, oractivity. Secondary impacts (sometimes further categorized into indirect and induced effects)result from subsequent rounds of spending and respending within the economy. This process
10
of spending and respending is sometimes termed the multiplier process, and the resultantsecondary effects are sometimes referred to as multiplier effects (Leistritz and Murdock1981).
Input-output (I-O) analysis is an economic tool that traces linkages among sectors ofan economy and calculates the total business activity resulting from a direct impact in a basicsector (Coon et al. 1985). The North Dakota I-O Model has 17 economic sectors, is closedwith respect to households (households are included in the model), and was developed fromprimary (survey) data from firms and households in North Dakota. Empirical testing hasshown the North Dakota Input-Output Model is sufficiently accurate in estimating grossbusiness volume, personal income, retail activity, and gross receipts in major economicsectors in North Dakota (Coon and Leistritz 2008b).
Economic Impacts
The economic contribution of the petroleum industry was primarily based onestimates of in-state expenditures from exploration, extraction, transportation, and processingof crude oil and natural gas. Estimates of in-state expenditures were combined withestimates of oil and gas royalties, state severance taxes, and lease bonuses to determine totaldirect impacts. Subsequently, the direct impacts were applied to the North Dakota Input-Output Model to estimate the secondary impacts. Secondary impacts result from therespending of direct impacts within the economy. The following section is divided into fivemajor parts: (1) direct impacts, (2) secondary impacts, (3) employment, (4) tax revenue, and(5) total economic impacts.
Direct Impacts
From an economic perspective, direct impacts are those changes in economic output,employment, or income that represent the initial or first-round effects of a project, program,or activity. The direct impacts from the petroleum industry in North Dakota includedexpenditures for (1) oil and gas exploration, (2) oil and gas extraction/production, (3)transportation of crude oil and unprocessed gas, and (4) processing crude oil and natural gas. Direct impacts also included various revenue streams originating from either oil and gasexploration, such as lease bonuses, or oil and gas production, such as severance taxes androyalty payments. The following sections describe these direct economic impacts.
Exploration
The economic effects of exploration come from expenditures within North Dakota fora variety of activities that involve searching and discovering viable oil and gas resources. Exploration was defined to include, but not limited to, seismic testing, geological research,lease expenses, other environmental research, land survey work, excavation, road building,construction of drill site, construction and delivery of electricity, pipeline development, andall other activities associated with drilling oil and/or gas wells (Appendix A).
11
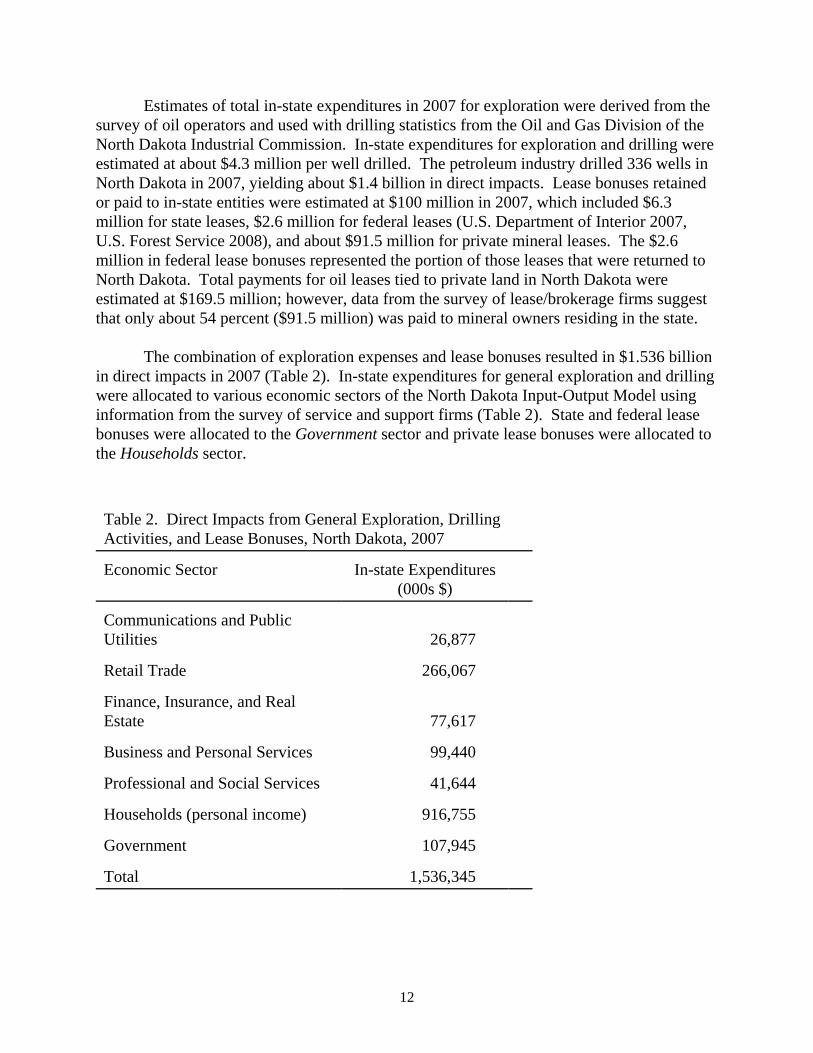
Estimates of total in-state expenditures in 2007 for exploration were derived from thesurvey of oil operators and used with drilling statistics from the Oil and Gas Division of theNorth Dakota Industrial Commission. In-state expenditures for exploration and drilling wereestimated at about $4.3 million per well drilled. The petroleum industry drilled 336 wells inNorth Dakota in 2007, yielding about $1.4 billion in direct impacts. Lease bonuses retainedor paid to in-state entities were estimated at $100 million in 2007, which included $6.3million for state leases, $2.6 million for federal leases (U.S. Department of Interior 2007,U.S. Forest Service 2008), and about $91.5 million for private mineral leases. The $2.6million in federal lease bonuses represented the portion of those leases that were returned toNorth Dakota. Total payments for oil leases tied to private land in North Dakota wereestimated at $169.5 million; however, data from the survey of lease/brokerage firms suggestthat only about 54 percent ($91.5 million) was paid to mineral owners residing in the state.
The combination of exploration expenses and lease bonuses resulted in $1.536 billionin direct impacts in 2007 (Table 2). In-state expenditures for general exploration and drillingwere allocated to various economic sectors of the North Dakota Input-Output Model usinginformation from the survey of service and support firms (Table 2). State and federal leasebonuses were allocated to the Government sector and private lease bonuses were allocated tothe Households sector.
Table 2. Direct Impacts from General Exploration, DrillingActivities, and Lease Bonuses, North Dakota, 2007
Economic Sector In-state Expenditures(000s $)
Communications and PublicUtilities 26,877
Retail Trade 266,067
Finance, Insurance, and RealEstate 77,617
Business and Personal Services 99,440
Professional and Social Services 41,644
Households (personal income) 916,755
Government 107,945
Total 1,536,345
12

Extraction/Production
The economic effects of extraction come from expenditures within North Dakota for avariety of activities that involve bringing crude oil and natural gas from undergroundformations to the earth’s surface. Extraction/production was defined to include, but notlimited to, all activities associated with the removal of crude oil and natural gas from theground, and maintenance and periodic inspections of equipment used to extract oil and gas,and other production related activities, such as well work overs, well idling, shutdown, andabandonment activities (Appendix A). Also included in this segment of the industry are thegeneral business expenditures incurred by oil operators in North Dakota. Examples of theseexpenditures include, but are not limited to, office rent, office supplies, wages and salaries,communications, public utilities, business and professional services, insurance, and interestexpenses (Appendix A). Royalty revenues, both private and public, were included as directimpacts in the extraction/production segment of the petroleum industry. Collections fromstate severance taxes, which include the gross production tax and extraction tax, also wereincluded in the direct impacts.
Estimates of total in-state expenditures in 2007 for extraction/production and generalbusiness expenses were derived from the survey of oil operators and estimated on a BOEbasis. North Dakota produced 45,057,874 barrels of oil and 70,799,663 mcf of natural gas in2007. Those volumes of oil and gas production resulted in an estimated $441.5 million forin-state expenditures for extraction/production and $362.5 million for general businessexpenses. State oil and gas royalties were about $36.1 million (North Dakota State LandDepartment 2007). Total federal royalties returned to North Dakota were about $19.3 million(U.S. Department of the Interior 2008, U.S. Forest Service 2008).
Private royalties were based on data obtained from the survey of lease/brokerage firmsand on production data obtained from the survey of oil operators. Total royalties reported byoil operators were estimated at 14.9 percent and 14.2 percent of well output for oil and gas,respectively. Private royalties were estimated by subtracting state and gross federal royaltiesfrom estimated total royalties. Private royalties (i.e., both in-state and out-of-state mineralowners) from oil and gas production in North Dakota in 2007 were estimated at $369.2million. In-state payments of private royalties were estimated by applying the percentage ofin-state versus out-of-state mineral owners (53.8 percent) to the estimated total privateroyalties ($369.2 million). In-state private royalties in 2007 were estimated at $198.7million.
Total collections from the gross production tax and extraction tax in calendar year2007 were $141.9 million and $108.4 million, respectively (Office of State TaxCommissioner 2008). Those tax collections were included in the extraction/productionsegment of the petroleum industry.
Total direct impacts in the extraction/production segment of the petroleum industry inNorth Dakota in 2007 were estimated at $1.3 billion (Table 3). Data from Bangsund andLeistritz (2007) was used to allocate the in-state expenditures for extraction to various sectors
13
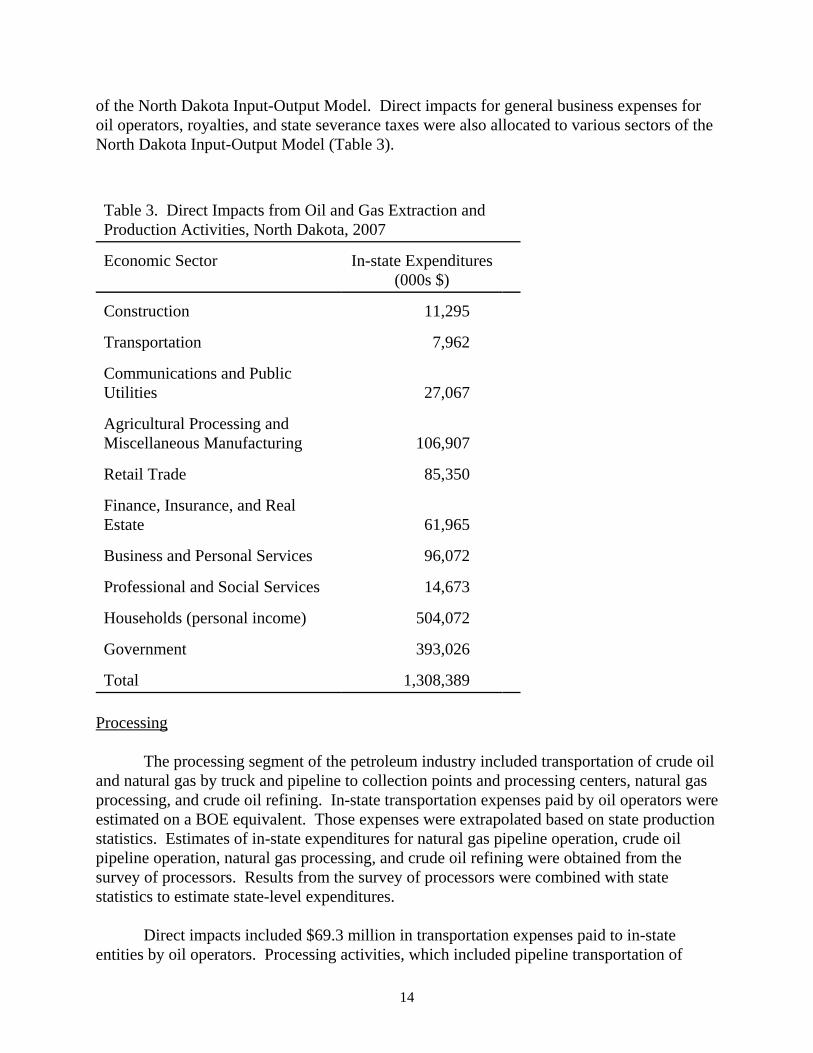
of the North Dakota Input-Output Model. Direct impacts for general business expenses foroil operators, royalties, and state severance taxes were also allocated to various sectors of theNorth Dakota Input-Output Model (Table 3).
Table 3. Direct Impacts from Oil and Gas Extraction andProduction Activities, North Dakota, 2007
Economic Sector In-state Expenditures(000s $)
Construction 11,295
Transportation 7,962
Communications and PublicUtilities 27,067
Agricultural Processing andMiscellaneous Manufacturing 106,907
Retail Trade 85,350
Finance, Insurance, and RealEstate 61,965
Business and Personal Services 96,072
Professional and Social Services 14,673
Households (personal income) 504,072
Government 393,026
Total 1,308,389
Processing
The processing segment of the petroleum industry included transportation of crude oiland natural gas by truck and pipeline to collection points and processing centers, natural gasprocessing, and crude oil refining. In-state transportation expenses paid by oil operators wereestimated on a BOE equivalent. Those expenses were extrapolated based on state productionstatistics. Estimates of in-state expenditures for natural gas pipeline operation, crude oilpipeline operation, natural gas processing, and crude oil refining were obtained from thesurvey of processors. Results from the survey of processors were combined with statestatistics to estimate state-level expenditures.
Direct impacts included $69.3 million in transportation expenses paid to in-stateentities by oil operators. Processing activities, which included pipeline transportation of
14
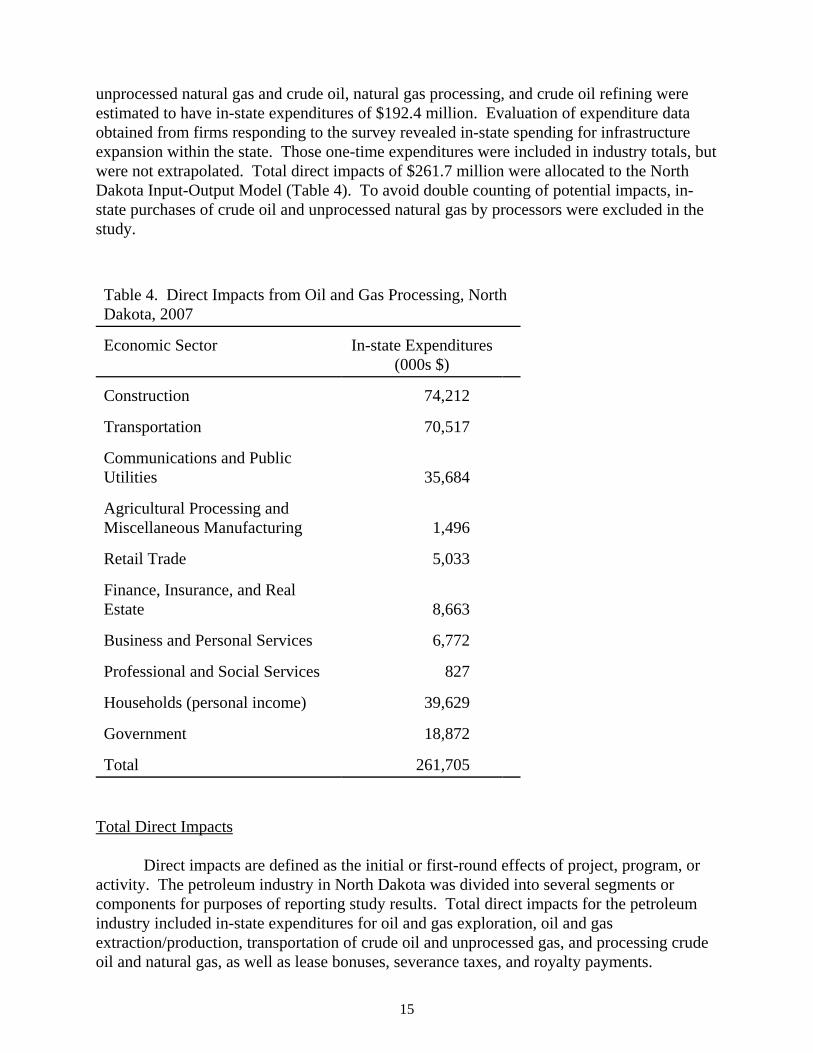
unprocessed natural gas and crude oil, natural gas processing, and crude oil refining wereestimated to have in-state expenditures of $192.4 million. Evaluation of expenditure dataobtained from firms responding to the survey revealed in-state spending for infrastructureexpansion within the state. Those one-time expenditures were included in industry totals, butwere not extrapolated. Total direct impacts of $261.7 million were allocated to the NorthDakota Input-Output Model (Table 4). To avoid double counting of potential impacts, in-state purchases of crude oil and unprocessed natural gas by processors were excluded in thestudy.
Table 4. Direct Impacts from Oil and Gas Processing, NorthDakota, 2007
Economic Sector In-state Expenditures(000s $)
Construction 74,212
Transportation 70,517
Communications and PublicUtilities 35,684
Agricultural Processing andMiscellaneous Manufacturing 1,496
Retail Trade 5,033
Finance, Insurance, and RealEstate 8,663
Business and Personal Services 6,772
Professional and Social Services 827
Households (personal income) 39,629
Government 18,872
Total 261,705
Total Direct Impacts
Direct impacts are defined as the initial or first-round effects of project, program, oractivity. The petroleum industry in North Dakota was divided into several segments orcomponents for purposes of reporting study results. Total direct impacts for the petroleumindustry included in-state expenditures for oil and gas exploration, oil and gasextraction/production, transportation of crude oil and unprocessed gas, and processing crudeoil and natural gas, as well as lease bonuses, severance taxes, and royalty payments.
15
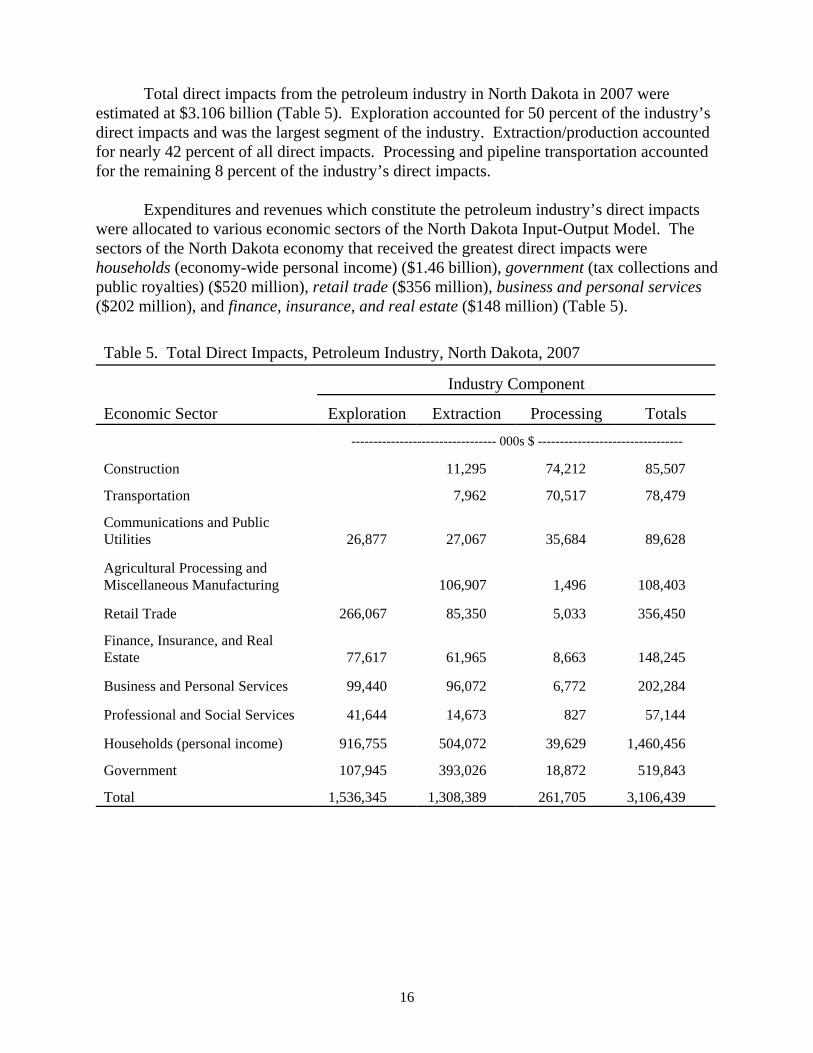
Total direct impacts from the petroleum industry in North Dakota in 2007 wereestimated at $3.106 billion (Table 5). Exploration accounted for 50 percent of the industry’sdirect impacts and was the largest segment of the industry. Extraction/production accountedfor nearly 42 percent of all direct impacts. Processing and pipeline transportation accountedfor the remaining 8 percent of the industry’s direct impacts.
Expenditures and revenues which constitute the petroleum industry’s direct impactswere allocated to various economic sectors of the North Dakota Input-Output Model. Thesectors of the North Dakota economy that received the greatest direct impacts werehouseholds (economy-wide personal income) ($1.46 billion), government (tax collections andpublic royalties) ($520 million), retail trade ($356 million), business and personal services($202 million), and finance, insurance, and real estate ($148 million) (Table 5).
Table 5. Total Direct Impacts, Petroleum Industry, North Dakota, 2007
Industry Component
Economic Sector Exploration Extraction Processing Totals--------------------------------- 000s $ ---------------------------------
Construction 11,295 74,212 85,507
Transportation 7,962 70,517 78,479
Communications and PublicUtilities 26,877 27,067 35,684 89,628
Agricultural Processing andMiscellaneous Manufacturing 106,907 1,496 108,403
Retail Trade 266,067 85,350 5,033 356,450
Finance, Insurance, and RealEstate 77,617 61,965 8,663 148,245
Business and Personal Services 99,440 96,072 6,772 202,284
Professional and Social Services 41,644 14,673 827 57,144
Households (personal income) 916,755 504,072 39,629 1,460,456
Government 107,945 393,026 18,872 519,843
Total 1,536,345 1,308,389 261,705 3,106,439
16
Secondary Impacts
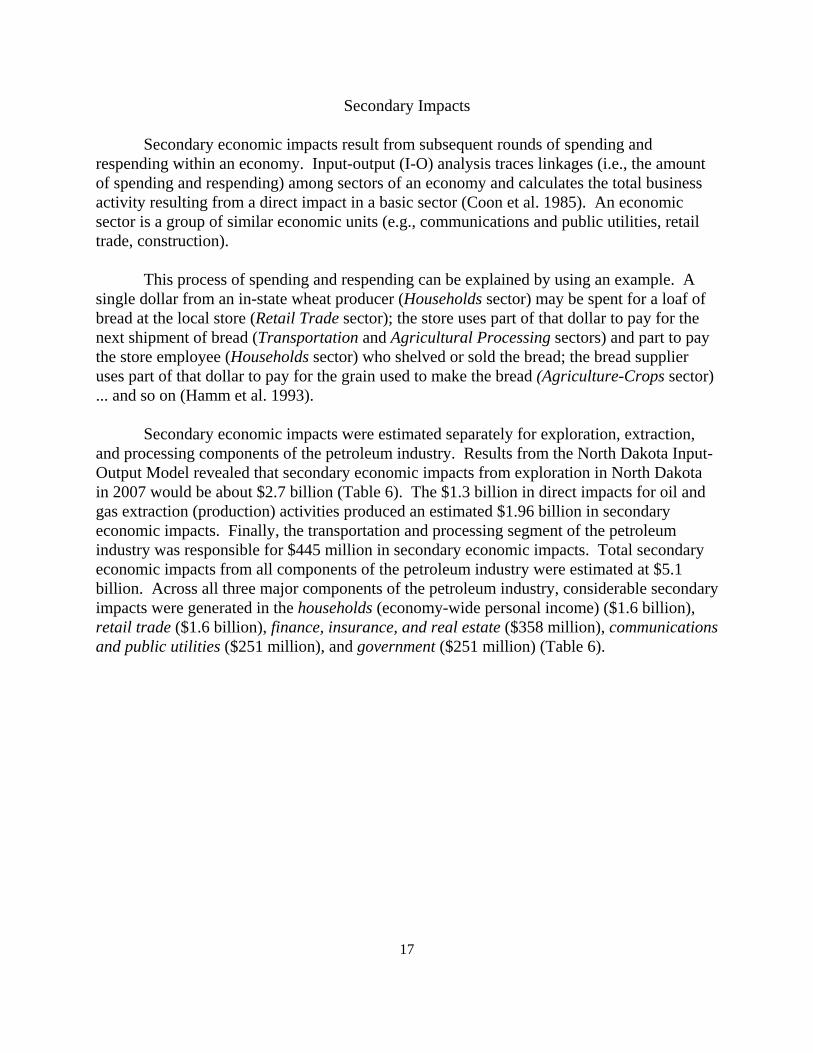
Secondary economic impacts result from subsequent rounds of spending andrespending within an economy. Input-output (I-O) analysis traces linkages (i.e., the amountof spending and respending) among sectors of an economy and calculates the total businessactivity resulting from a direct impact in a basic sector (Coon et al. 1985). An economic sector is a group of similar economic units (e.g., communications and public utilities, retailtrade, construction).
This process of spending and respending can be explained by using an example. Asingle dollar from an in-state wheat producer (Households sector) may be spent for a loaf ofbread at the local store (Retail Trade sector); the store uses part of that dollar to pay for thenext shipment of bread (Transportation and Agricultural Processing sectors) and part to paythe store employee (Households sector) who shelved or sold the bread; the bread supplieruses part of that dollar to pay for the grain used to make the bread (Agriculture-Crops sector)... and so on (Hamm et al. 1993).
Secondary economic impacts were estimated separately for exploration, extraction,and processing components of the petroleum industry. Results from the North Dakota Input-Output Model revealed that secondary economic impacts from exploration in North Dakotain 2007 would be about $2.7 billion (Table 6). The $1.3 billion in direct impacts for oil andgas extraction (production) activities produced an estimated $1.96 billion in secondaryeconomic impacts. Finally, the transportation and processing segment of the petroleumindustry was responsible for $445 million in secondary economic impacts. Total secondaryeconomic impacts from all components of the petroleum industry were estimated at $5.1billion. Across all three major components of the petroleum industry, considerable secondaryimpacts were generated in the households (economy-wide personal income) ($1.6 billion),retail trade ($1.6 billion), finance, insurance, and real estate ($358 million), communicationsand public utilities ($251 million), and government ($251 million) (Table 6).
17
Table 6. Total Secondary Impacts, Petroleum Industry, North Dakota, 2007
Industry Component
Economic Sector Exploration Extraction Processing Totals
--------------------------------- 000s $ ---------------------------------
Construction 108,129 67,750 14,463 191,342
Transportation 14,177 9,515 2,450 26,142
Communications and PublicUtilities 139,692 90,498 20,541 250,731
Agricultural Processing andMiscellaneous Manufacturing 60,226 112,271 8,130 180,627
Retail Trade 892,318 579,914 125,717 1,597,949
Finance, Insurance, and RealEstate 200,157 130,043 27,960 358,160
Business and Personal Services 74,460 49,582 10,237 134,279
Professional and Social Services 114,331 71,149 13,758 199,238
Households (personal income) 843,060 590,138 170,319 1,603,517
Government 131,856 87,024 31,753 250,633
Other sectorsa 142,990 167,444 20,132 330,566
Total 2,721,396 1,956,328 445,460 5,123,184a Includes various agricultural and mining sectors.
Employment
The petroleum industry is responsible for creating and supporting direct andsecondary employment. Direct employment is a measure of the number of full-time jobswithin an industry. Secondary jobs are an estimate of employment outside of an industry, butemployment that is created from the industry's economy-wide economic activity.
Direct Employment
Direct employment is a term used to describe jobs that are considered to be a part ofan industry. For example, workers operating an oil drilling rig would represent directemployment in the petroleum industry. Similarly, someone who works at a natural gasprocessing plant or crude oil refinery would be considered direct employment in thepetroleum industry.
18
While employment figures are frequently reported by various governmental agenciesand are broken into a hierarchy of categories (e.g., North American Industry ClassificationSystem), deriving specific estimates of employment for large basic-sector industries can beproblematic. Much of the problem arises in defining the type of job, and attributing to whichindustry(s) created that employment. For example, the process of drilling an oil welltypically requires developing a road and a drilling site; work that requires heavy constructionwith earth moving or excavating equipment. Most oil companies will contract that work tolocal firms that specialize in heavy construction or excavating. The individuals performingthe road building and preparation of the drill site are likely to be employed with some type ofconstruction firm, and as a result, those jobs are typically classified and reported bygovernment agencies as construction. Government agencies (e.g., Bureau of the Census,Bureau of Labor Statistics) that track employment often base the classification of those jobson the type of activities that generate the most revenue for a firm (primary activities). In thisexample, the primary activity for this firm is likely to be construction, even if the specificactivities are road building and drill site preparation. However, in the case of assigningwhich basic-sector industry created that employment, it may be more accurate to suggestthose jobs exist as a result of the petroleum industry rather than the construction industry. Yet, in other cases, the level of oil well drilling activity may be insufficient to sustainemployment in heavy construction for an entire year. Those situations result in seasonal orpart-time job creation. The challenge is to measure or estimate the total number of full-timejobs created and sustained by the petroleum industry, even if those jobs appear to be part ofanother industry or are only created for part of a year.
Estimates of direct employment were generated from the survey of oil operators andprocessors, and from key parameters obtained from the survey of service and support firms(Bangsund and Leistritz 2007). The survey of oil operators and processors specifically askedfor the number of full-time jobs in North Dakota (Appendices A and B). Employmentfigures from the survey of oil operators were extrapolated to state totals based on a BOEbasis, while employment data from the survey of processors was extrapolated based on state-level statistics for those operations (e.g., processing volumes). Thus, estimating full-timeemployment by oil operators, pipeline firms, and processors in North Dakota was relativelystraightforward.
Oil operators (firms owning or operating wells) contract much of the work ofexploration and extraction of oil and gas to firms that specialize in various aspects of thethose processes. While some of the work in the oil fields is performed by firms located inother states, much of the work is performed by firms located in close proximity toproduction. One of the difficulties of estimating employment in the service and supportcapacities is determining those jobs that are fully supported versus those jobs that are onlypartially supported by the petroleum industry. An additional complexity is to only attributefull-time employment to the petroleum activities located in North Dakota. For many firmslocated in the oil producing region of North Dakota, the obvious possibility is that someemployment by those firms could be partially or wholly supported by petroleum activities inMontana, Canada, or possibly in other states.
19
The questionnaire used in the service and support survey was designed to address thedegree of job support from the petroleum industry and the level of job support attributable toonly petroleum activities in North Dakota (Bangsund and Leistritz 2007). Data on the grossrevenue needed to support one-full time position within the oil field in North Dakota wasadjusted for inflation using the Gross Domestic Product-Implicit Price Deflator (U.S.Department of Commerce 2008). Total state employment for work in the oil fields was thenestimated based on an adjusted level of spending per FTE job and combined with data fromthe oil operator survey for contract work in the areas of exploration, extraction/production,and transportation in North Dakota.
Employment in North Dakota by oil operators in 2007 was estimated at 1,808 full-time equivalent (FTE) positions. Employment in the processing segment of the industry,which included some pipeline employment, was estimated at 579 FTE jobs. Totalemployment in the oil field for contract work, which includes exploration and extractionsegments of the industry, was estimated at 5,332 FTE jobs. The petroleum industry2, asdefined and evaluated in this study, was estimated to create and support 7,719 FTE positionsin North Dakota in 2007.
Secondary Employment
Secondary employment is a term used to describe jobs that are created and supportedby the volume of business activity generated by an industry, but does not include jobs that arepart of the industry. Direct employment and secondary employment are two distinctlydifferent measures. Productivity ratios3 were used with estimates of business activity invarious sectors of the North Dakota economy to obtain estimates of secondary employment. The petroleum industry in North Dakota was estimated to generate an additional $5.1 billionin secondary business activity, which was sufficient to support 38,500 FTE jobs.
2 The petroleum industry in this study did not include employment associated with transportation ofprocessed petroleum products, marketing, or retail sales. In many cases, those downstream componentsof the industry generate substantial employment. Unfortunately, breakout of jobs by segment of theindustry previously reported are no longer available. In 2006, the petroleum industry in North Dakotawas responsible for over 9,200 jobs, excluding jobs in petroleum refining activities due to non-disclosurerules (American Petroleum Institute 2007). However, industry-wide direct employment in 2006 included507 jobs in transportation (jobs in retail distribution also were not disclosed) and 1,671 jobs in wholesaleoperations; two components of the petroleum industry that were only partially included in this study. TheAmerican Petroleum Institute also estimated that retail gasoline stations in the state were responsible for4,058 jobs in 2006; employment that was considered in addition to the 5,179 jobs attributable to othersegments of the petroleum industry (American Petroleum Institute 2007). While similar data for 2007 isnot available, employment changes reported by the American Petroleum Institute from 2005 to 2006 areconsistent with changes observed in this study from 2005 to 2007.
3A measure of the amount of business activity needed in an economic sector to support one full-timejob.
20
Government Revenues
Governmental revenues, usually based on tax collections, are another importantmeasure of the economic impact of an industry on an economy. The petroleum industry inNorth Dakota, specifically oil and gas production, is responsible for substantial amounts ofstate and local government revenues. One distinction is that unlike many other industries inNorth Dakota, severance taxes (taxes placed on the value of oil and gas removed from theground) collect money based on gross revenues produced by the industry. In contrast,taxation for most other industries is more traditional and usually limited to real property andnet income. Another distinction that makes the petroleum industry different from otherindustries in the state is that governments can hold oil and gas leases and receive royaltiesfrom the value of oil and gas production. Of course, the petroleum industry also generatesrevenues from traditional sources, such as personal income, corporate income, sales and use,and property tax collections.
Severance taxes, sales and use taxes, personal income taxes, corporate income taxes,property taxes, royalties, lease bonuses, charitable donations, and licenses, fees, and permitscombined for $519.8 million in government revenues that were directly attributable to thepetroleum industry in North Dakota in 2007 (Table 7). Exploration, extraction/production,and processing segments of the industry were responsible for about 21, 76, and 3 percent,respectively, of the total government revenues from the petroleum industry in North Dakota.
Severance taxes accounted for nearly half (48 percent) of all government revenuesfrom the petroleum industry in North Dakota in 2007. The second largest source was themost common general taxes (i.e., property, personal income, sales and use, and corporateincome) at 36 percent, followed by royalties at 11 percent. The remainder of governmentrevenues represented lease bonuses, permits/fees/licenses, miscellaneous revenues.
In addition to the government revenues that were included as direct impacts,collections from personal income and sales and use taxes were estimated based on thesecondary economic activity generated by the petroleum industry. Secondary economicimpacts in the Retail Trade sector were used to estimate revenue from sales and use taxes. Economic activity in the Households sector (which represents economy-wide personalincome) was used to estimate personal income tax collections. Total collections of personalincome and sales and use taxes arising from secondary economic activity were estimated at$119.9 million (Table 7).
21
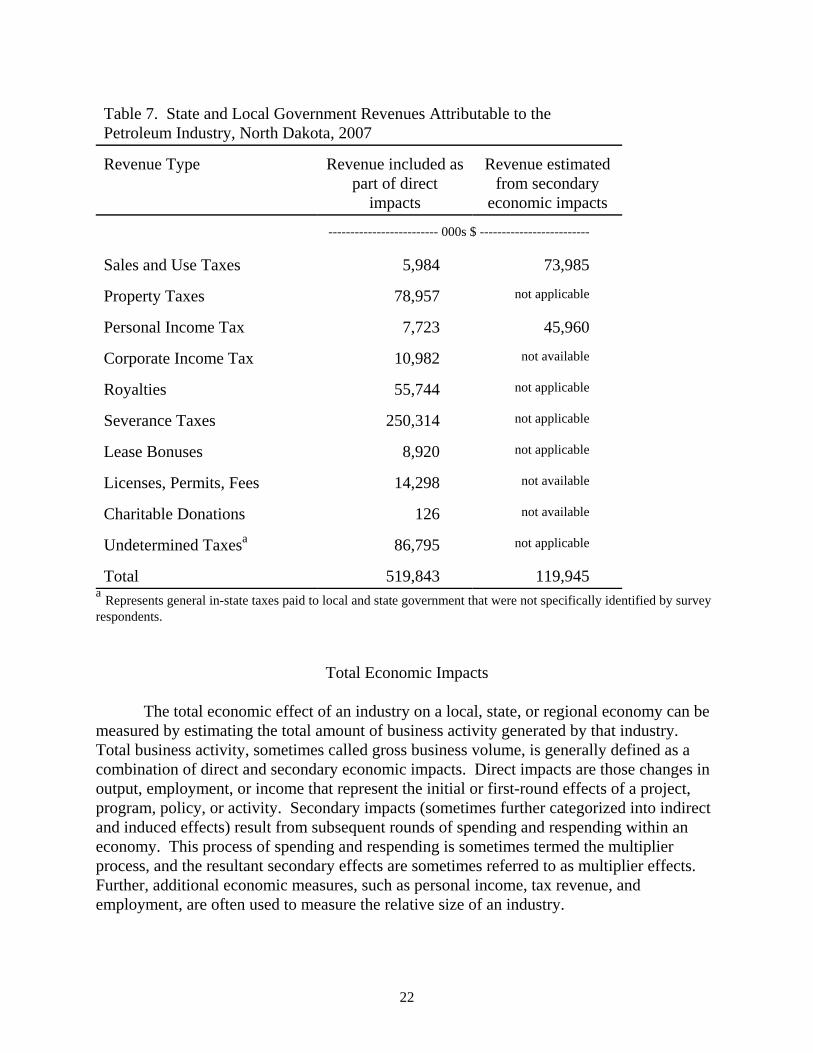
Table 7. State and Local Government Revenues Attributable to the Petroleum Industry, North Dakota, 2007
Revenue Type Revenue included aspart of direct
impacts
Revenue estimatedfrom secondary
economic impacts
------------------------- 000s $ -------------------------
Sales and Use Taxes 5,984 73,985
Property Taxes 78,957 not applicable
Personal Income Tax 7,723 45,960
Corporate Income Tax 10,982 not available
Royalties 55,744 not applicable
Severance Taxes 250,314 not applicable
Lease Bonuses 8,920 not applicable
Licenses, Permits, Fees 14,298 not available
Charitable Donations 126 not available
Undetermined Taxesa 86,795 not applicable
Total 519,843 119,945a Represents general in-state taxes paid to local and state government that were not specifically identified by surveyrespondents.
Total Economic Impacts
The total economic effect of an industry on a local, state, or regional economy can bemeasured by estimating the total amount of business activity generated by that industry. Total business activity, sometimes called gross business volume, is generally defined as acombination of direct and secondary economic impacts. Direct impacts are those changes inoutput, employment, or income that represent the initial or first-round effects of a project,program, policy, or activity. Secondary impacts (sometimes further categorized into indirectand induced effects) result from subsequent rounds of spending and respending within aneconomy. This process of spending and respending is sometimes termed the multiplierprocess, and the resultant secondary effects are sometimes referred to as multiplier effects. Further, additional economic measures, such as personal income, tax revenue, andemployment, are often used to measure the relative size of an industry.
22
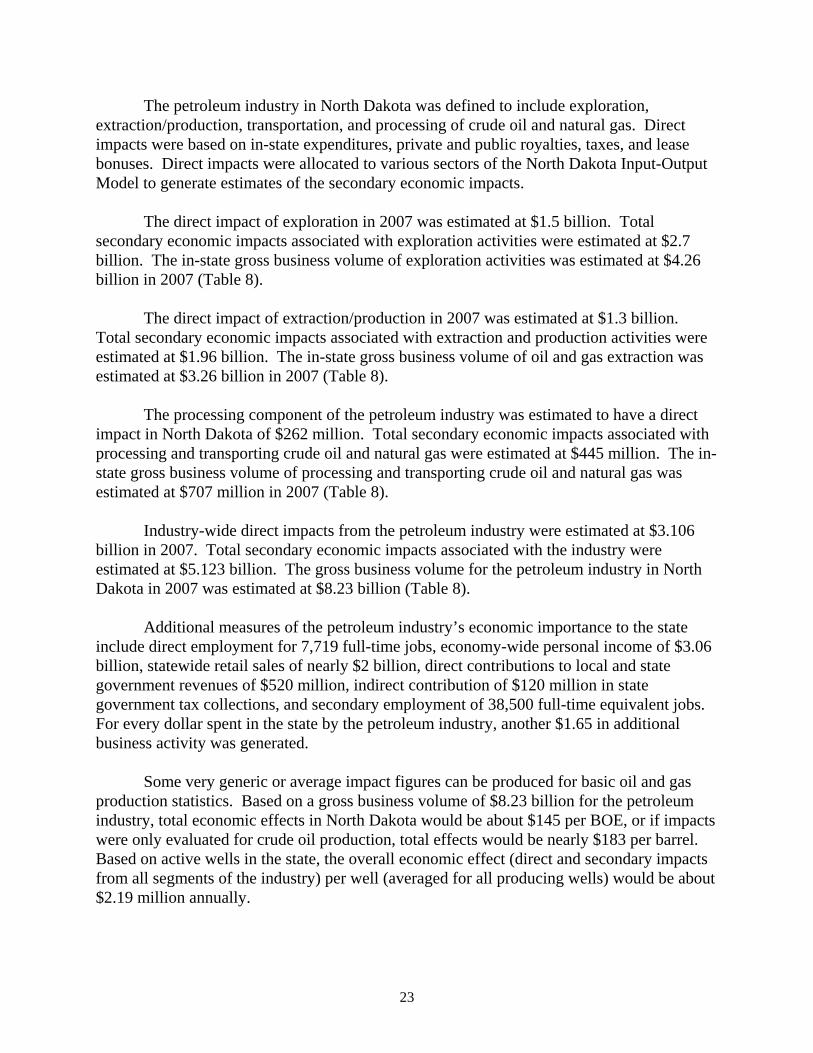
The petroleum industry in North Dakota was defined to include exploration,extraction/production, transportation, and processing of crude oil and natural gas. Directimpacts were based on in-state expenditures, private and public royalties, taxes, and leasebonuses. Direct impacts were allocated to various sectors of the North Dakota Input-OutputModel to generate estimates of the secondary economic impacts.
The direct impact of exploration in 2007 was estimated at $1.5 billion. Totalsecondary economic impacts associated with exploration activities were estimated at $2.7billion. The in-state gross business volume of exploration activities was estimated at $4.26billion in 2007 (Table 8).
The direct impact of extraction/production in 2007 was estimated at $1.3 billion. Total secondary economic impacts associated with extraction and production activities wereestimated at $1.96 billion. The in-state gross business volume of oil and gas extraction wasestimated at $3.26 billion in 2007 (Table 8).
The processing component of the petroleum industry was estimated to have a directimpact in North Dakota of $262 million. Total secondary economic impacts associated withprocessing and transporting crude oil and natural gas were estimated at $445 million. The in-state gross business volume of processing and transporting crude oil and natural gas wasestimated at $707 million in 2007 (Table 8).
Industry-wide direct impacts from the petroleum industry were estimated at $3.106billion in 2007. Total secondary economic impacts associated with the industry wereestimated at $5.123 billion. The gross business volume for the petroleum industry in NorthDakota in 2007 was estimated at $8.23 billion (Table 8).
Additional measures of the petroleum industry’s economic importance to the stateinclude direct employment for 7,719 full-time jobs, economy-wide personal income of $3.06billion, statewide retail sales of nearly $2 billion, direct contributions to local and stategovernment revenues of $520 million, indirect contribution of $120 million in stategovernment tax collections, and secondary employment of 38,500 full-time equivalent jobs. For every dollar spent in the state by the petroleum industry, another $1.65 in additionalbusiness activity was generated.
Some very generic or average impact figures can be produced for basic oil and gasproduction statistics. Based on a gross business volume of $8.23 billion for the petroleumindustry, total economic effects in North Dakota would be about $145 per BOE, or if impactswere only evaluated for crude oil production, total effects would be nearly $183 per barrel. Based on active wells in the state, the overall economic effect (direct and secondary impactsfrom all segments of the industry) per well (averaged for all producing wells) would be about$2.19 million annually.
23
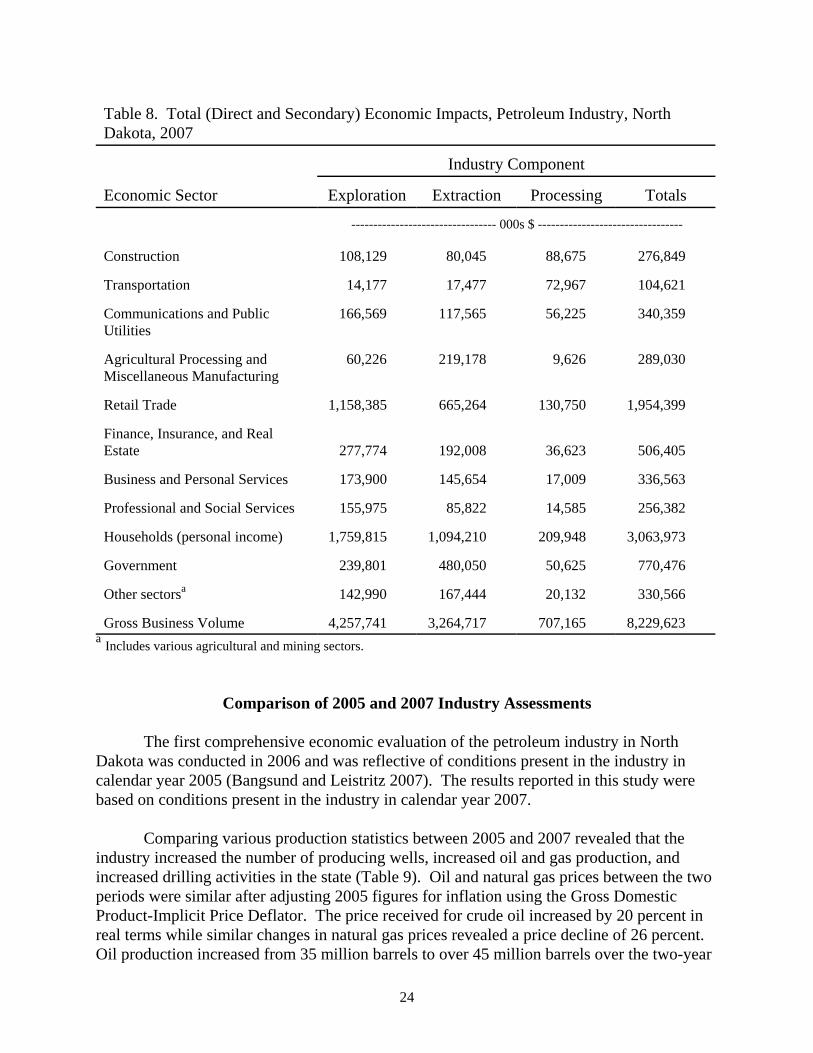
Table 8. Total (Direct and Secondary) Economic Impacts, Petroleum Industry, NorthDakota, 2007
Industry Component
Economic Sector Exploration Extraction Processing Totals
--------------------------------- 000s $ ---------------------------------
Construction 108,129 80,045 88,675 276,849
Transportation 14,177 17,477 72,967 104,621
Communications and PublicUtilities
166,569 117,565 56,225 340,359
Agricultural Processing andMiscellaneous Manufacturing
60,226 219,178 9,626 289,030
Retail Trade 1,158,385 665,264 130,750 1,954,399
Finance, Insurance, and RealEstate 277,774 192,008 36,623 506,405
Business and Personal Services 173,900 145,654 17,009 336,563
Professional and Social Services 155,975 85,822 14,585 256,382
Households (personal income) 1,759,815 1,094,210 209,948 3,063,973
Government 239,801 480,050 50,625 770,476
Other sectorsa 142,990 167,444 20,132 330,566
Gross Business Volume 4,257,741 3,264,717 707,165 8,229,623a Includes various agricultural and mining sectors.
Comparison of 2005 and 2007 Industry Assessments
The first comprehensive economic evaluation of the petroleum industry in NorthDakota was conducted in 2006 and was reflective of conditions present in the industry incalendar year 2005 (Bangsund and Leistritz 2007). The results reported in this study werebased on conditions present in the industry in calendar year 2007.
Comparing various production statistics between 2005 and 2007 revealed that theindustry increased the number of producing wells, increased oil and gas production, andincreased drilling activities in the state (Table 9). Oil and natural gas prices between the twoperiods were similar after adjusting 2005 figures for inflation using the Gross DomesticProduct-Implicit Price Deflator. The price received for crude oil increased by 20 percent inreal terms while similar changes in natural gas prices revealed a price decline of 26 percent. Oil production increased from 35 million barrels to over 45 million barrels over the two-year
24
period. Gas production jumped from around 58 million mcf in 2005 to nearly 71 million mcfin 2007. In addition to increases in oil and gas production, exploration activities in the statecontinued to increase as the number of wells drilled in the state went from 240 in 2005 to 336in 2007.
Table 9. Oil and Gas Production Statistics, North Dakota, 2005 and 2007
Measures of Industry OutputCalendar Year
2005Calendar Year
2007
PercentChange
(2005 - 2007)
Crude oil (barrels) 35,659,583 45,057,874 26.4
Natural gas produced (mcf) 57,970,459 70,799,663 22.1
Natural gas sold (mcf) 50,695,691 55,094,857 8.7
Number of operating/active wells 3,391 3,759 10.8
Number of wells drilled 240 336 40.0
Average annual price per barrel ofcrude oil in North Dakota*
$51.41 nominal$54.20 real
$65.10 nominal$65.10 real
26.620.1
Average annual price per mcf ofnatural gas in North Dakota*
$8.57 nominal$9.04 real
$6.69 nominal$6.69 real
-22.0-26.0
* Nominal dollars adjusted to real (2007) dollars using the Gross Domestic Product-Implicit Price Deflator.Source: Oil and Gas Division, North Dakota Industrial Commission (2008).
Methods and data sources between the 2005 study and this study were largelyunchanged, although the 2007 study included a separate survey of lease/brokerage firms. The survey of lease/brokerage firms was conducted to help generate estimates of leasebonuses on private land in North Dakota. By comparison, lease bonuses on private land in2005 were based on information obtained from the survey of oil operators and data on welldrilling activity. Firms providing oil field services were not surveyed in this study; however,key parameters from the 2005 study were obtained from Bangsund and Leistritz (2007),corrected for inflation, and used in this study.
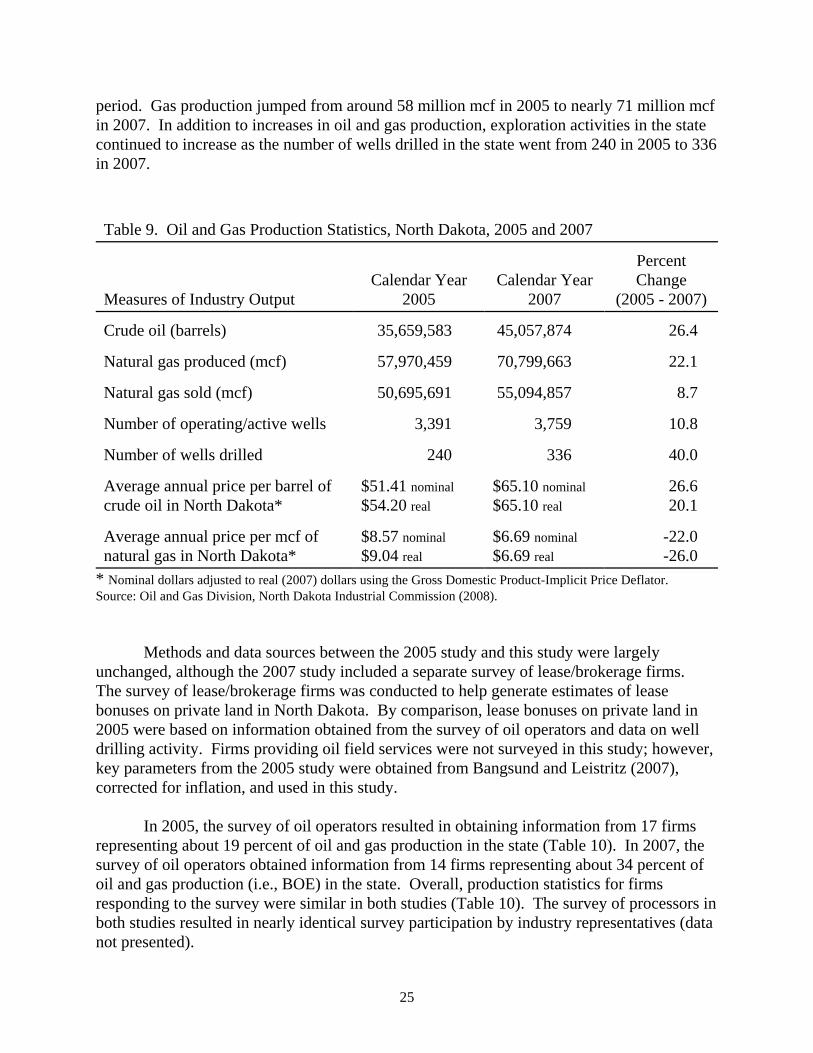
In 2005, the survey of oil operators resulted in obtaining information from 17 firmsrepresenting about 19 percent of oil and gas production in the state (Table 10). In 2007, thesurvey of oil operators obtained information from 14 firms representing about 34 percent ofoil and gas production (i.e., BOE) in the state. Overall, production statistics for firmsresponding to the survey were similar in both studies (Table 10). The survey of processors inboth studies resulted in nearly identical survey participation by industry representatives (datanot presented).
25
Table 10. Summary of Oil Operator Surveys, North Dakota, 2005 and 2007
Description 2005 2007
Number of firms surveyed (first mailing) 135 140
Number of firms responding with useful information 19 14
Number of wells owned/operated by surveyrespondents Share of state totals
1,633
49%
1,897
50%
Crude oil production by survey respondents Share of state totals
8,062,21923%
13,503,59530%
Natural gas production by survey respondents Share of state totals
10,289,32518%
34,360,93448%
Barrel of Oil Equivalent (BOE) Share of state totals
9,777,10622%
19,230,41834%
Number of wells drilled by survey respondents Share of state totals
7529%
12637%
Several notable changes were observed with oil and gas exploration between 2005and 2007 (Table 11). The number of wells drilled increased from 240 in 2005 to 336 in2007. The average cost to drill a well in the state increased in real terms from $1.6 million in2005 to nearly $4.3 million in 2007. The result of both an increase in the number of wellsdrilled and the change in the cost to drill wells increased exploration expenditures in the stateby about 275 percent from 2005 to 2007. The gross business volume (direct and secondaryeconomic effects) associated with exploration went from around $1.3 billion in 2005 to about$4.3 billion in 2007. The amount of direct expenditures for only exploration activities in2007 exceeded the sum of direct expenditures for all segments (i.e., exploration, production,and processing) of the industry in 2005 (see Tables 11 and 12).
26
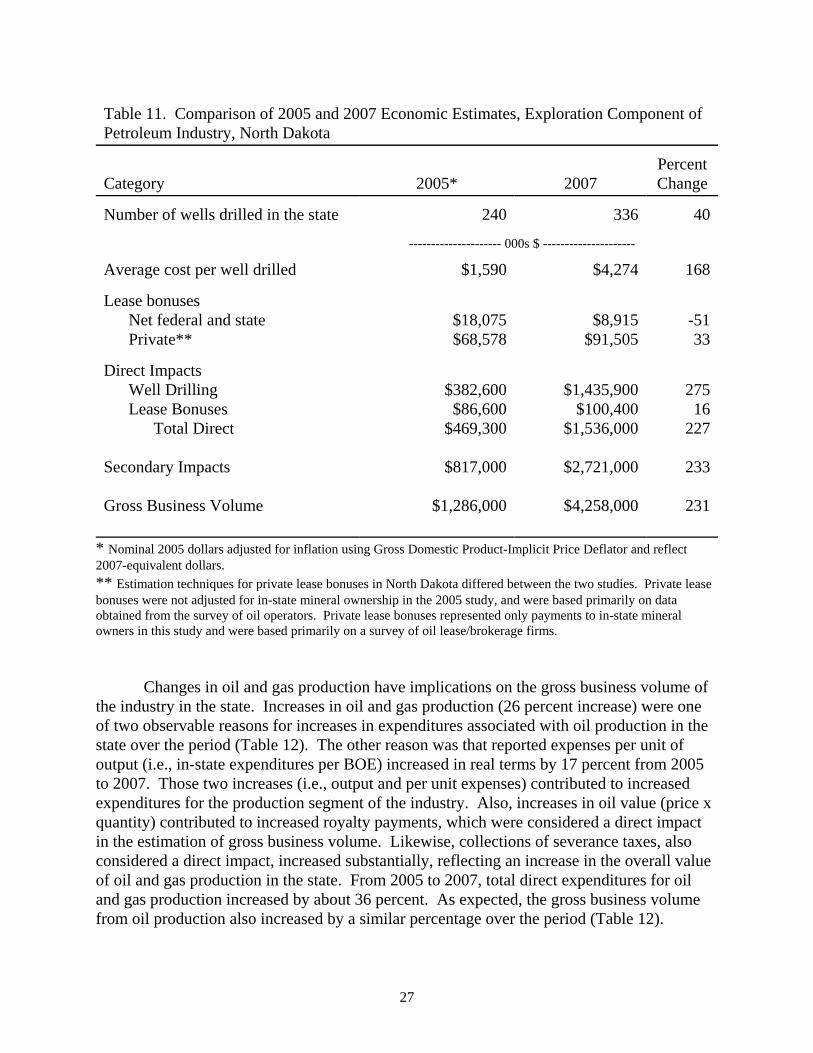
Table 11. Comparison of 2005 and 2007 Economic Estimates, Exploration Component ofPetroleum Industry, North Dakota
Category 2005* 2007PercentChange
Number of wells drilled in the state 240 336 40
--------------------- 000s $ ---------------------
Average cost per well drilled $1,590 $4,274 168
Lease bonuses Net federal and state Private**
$18,075$68,578
$8,915$91,505
-5133
Direct Impacts Well Drilling Lease Bonuses Total Direct
Secondary Impacts
Gross Business Volume
$382,600$86,600
$469,300
$817,000
$1,286,000
$1,435,900$100,400
$1,536,000
$2,721,000
$4,258,000
27516
227
233
231
* Nominal 2005 dollars adjusted for inflation using Gross Domestic Product-Implicit Price Deflator and reflect2007-equivalent dollars.** Estimation techniques for private lease bonuses in North Dakota differed between the two studies. Private leasebonuses were not adjusted for in-state mineral ownership in the 2005 study, and were based primarily on dataobtained from the survey of oil operators. Private lease bonuses represented only payments to in-state mineralowners in this study and were based primarily on a survey of oil lease/brokerage firms.
Changes in oil and gas production have implications on the gross business volume ofthe industry in the state. Increases in oil and gas production (26 percent increase) were oneof two observable reasons for increases in expenditures associated with oil production in thestate over the period (Table 12). The other reason was that reported expenses per unit ofoutput (i.e., in-state expenditures per BOE) increased in real terms by 17 percent from 2005to 2007. Those two increases (i.e., output and per unit expenses) contributed to increasedexpenditures for the production segment of the industry. Also, increases in oil value (price xquantity) contributed to increased royalty payments, which were considered a direct impactin the estimation of gross business volume. Likewise, collections of severance taxes, alsoconsidered a direct impact, increased substantially, reflecting an increase in the overall valueof oil and gas production in the state. From 2005 to 2007, total direct expenditures for oiland gas production increased by about 36 percent. As expected, the gross business volumefrom oil production also increased by a similar percentage over the period (Table 12).
27
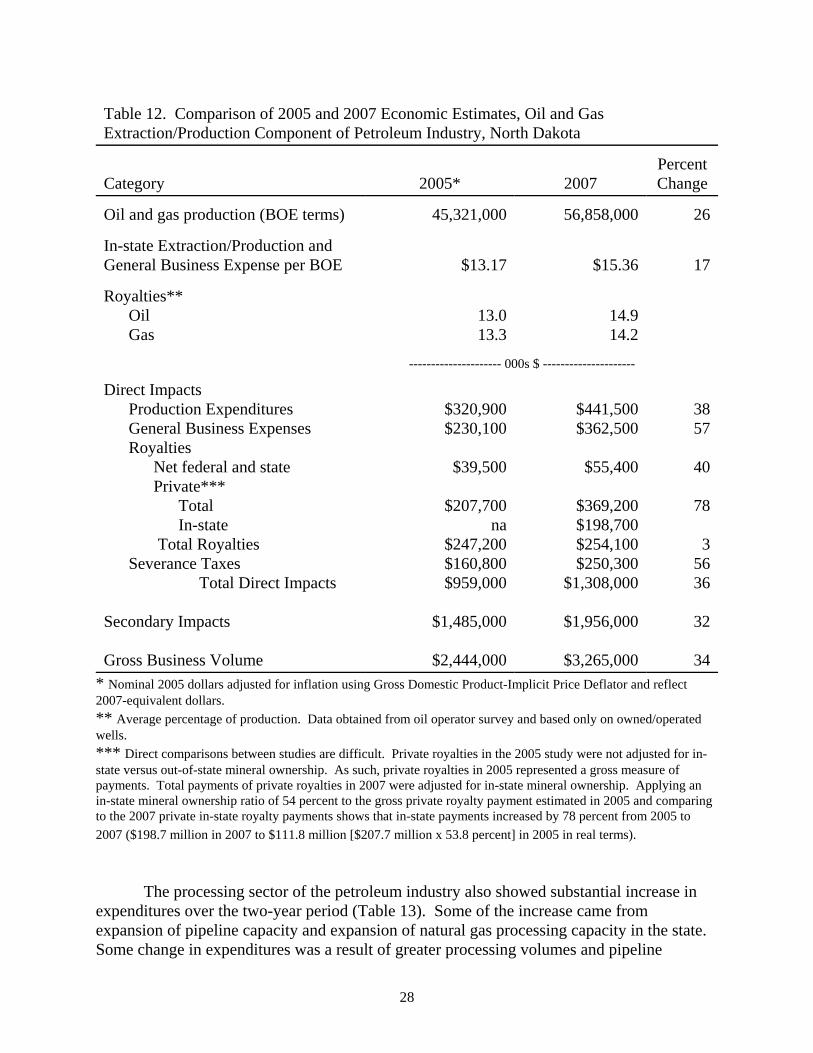
Table 12. Comparison of 2005 and 2007 Economic Estimates, Oil and GasExtraction/Production Component of Petroleum Industry, North Dakota
Category 2005* 2007PercentChange
Oil and gas production (BOE terms) 45,321,000 56,858,000 26
In-state Extraction/Production andGeneral Business Expense per BOE $13.17 $15.36 17
Royalties** Oil Gas
13.013.3
14.914.2
--------------------- 000s $ ---------------------
Direct Impacts Production Expenditures General Business Expenses Royalties Net federal and state Private*** Total In-state Total Royalties Severance Taxes Total Direct Impacts
Secondary Impacts
Gross Business Volume
$320,900$230,100
$39,500
$207,700na
$247,200$160,800$959,000
$1,485,000
$2,444,000
$441,500$362,500
$55,400
$369,200$198,700$254,100$250,300
$1,308,000
$1,956,000
$3,265,000
3857
40
78
35636
32
34* Nominal 2005 dollars adjusted for inflation using Gross Domestic Product-Implicit Price Deflator and reflect2007-equivalent dollars.** Average percentage of production. Data obtained from oil operator survey and based only on owned/operatedwells.*** Direct comparisons between studies are difficult. Private royalties in the 2005 study were not adjusted for in-state versus out-of-state mineral ownership. As such, private royalties in 2005 represented a gross measure ofpayments. Total payments of private royalties in 2007 were adjusted for in-state mineral ownership. Applying anin-state mineral ownership ratio of 54 percent to the gross private royalty payment estimated in 2005 and comparingto the 2007 private in-state royalty payments shows that in-state payments increased by 78 percent from 2005 to2007 ($198.7 million in 2007 to $111.8 million [$207.7 million x 53.8 percent] in 2005 in real terms).
The processing sector of the petroleum industry also showed substantial increase inexpenditures over the two-year period (Table 13). Some of the increase came fromexpansion of pipeline capacity and expansion of natural gas processing capacity in the state. Some change in expenditures was a result of greater processing volumes and pipeline
28
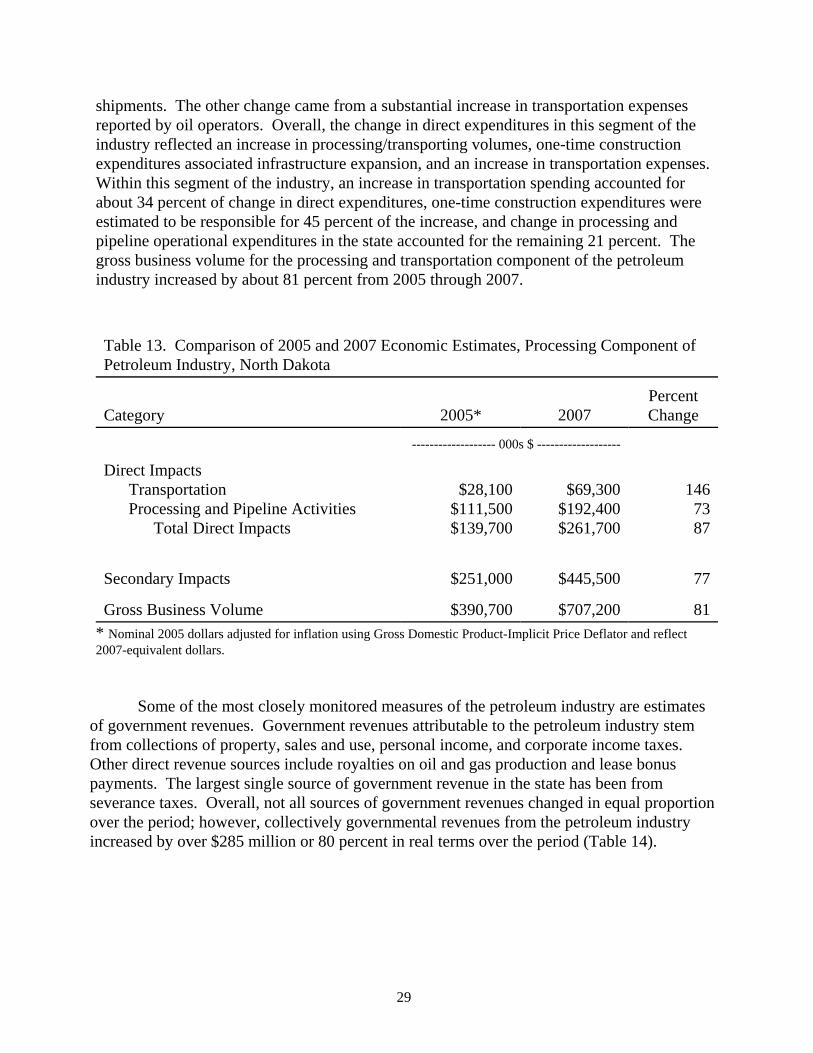
shipments. The other change came from a substantial increase in transportation expensesreported by oil operators. Overall, the change in direct expenditures in this segment of theindustry reflected an increase in processing/transporting volumes, one-time constructionexpenditures associated infrastructure expansion, and an increase in transportation expenses. Within this segment of the industry, an increase in transportation spending accounted forabout 34 percent of change in direct expenditures, one-time construction expenditures wereestimated to be responsible for 45 percent of the increase, and change in processing andpipeline operational expenditures in the state accounted for the remaining 21 percent. Thegross business volume for the processing and transportation component of the petroleumindustry increased by about 81 percent from 2005 through 2007.
Table 13. Comparison of 2005 and 2007 Economic Estimates, Processing Component ofPetroleum Industry, North Dakota
Category 2005* 2007PercentChange
------------------- 000s $ -------------------
Direct Impacts Transportation Processing and Pipeline Activities Total Direct Impacts
$28,100$111,500$139,700
$69,300$192,400$261,700
1467387
Secondary Impacts $251,000 $445,500 77
Gross Business Volume $390,700 $707,200 81* Nominal 2005 dollars adjusted for inflation using Gross Domestic Product-Implicit Price Deflator and reflect2007-equivalent dollars.
Some of the most closely monitored measures of the petroleum industry are estimatesof government revenues. Government revenues attributable to the petroleum industry stemfrom collections of property, sales and use, personal income, and corporate income taxes. Other direct revenue sources include royalties on oil and gas production and lease bonuspayments. The largest single source of government revenue in the state has been fromseverance taxes. Overall, not all sources of government revenues changed in equal proportionover the period; however, collectively governmental revenues from the petroleum industryincreased by over $285 million or 80 percent in real terms over the period (Table 14).
29
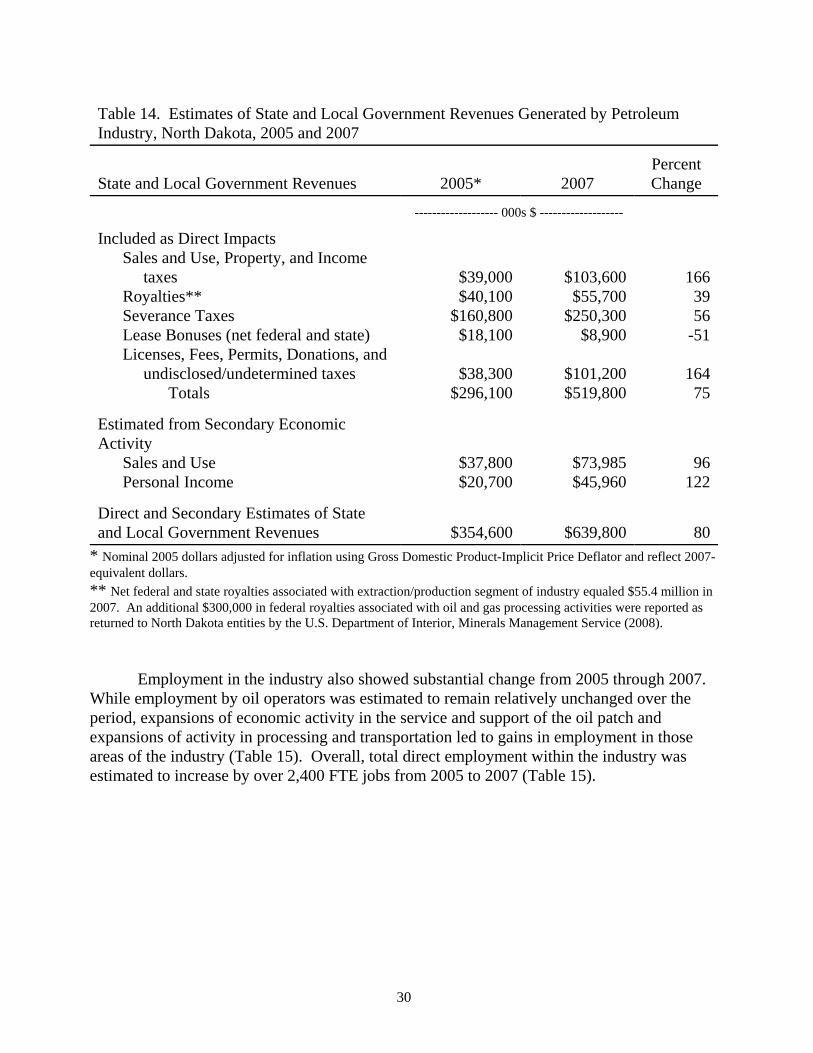
Table 14. Estimates of State and Local Government Revenues Generated by PetroleumIndustry, North Dakota, 2005 and 2007
State and Local Government Revenues 2005* 2007PercentChange
------------------- 000s $ -------------------
Included as Direct Impacts Sales and Use, Property, and Income taxes Royalties** Severance Taxes Lease Bonuses (net federal and state) Licenses, Fees, Permits, Donations, and undisclosed/undetermined taxes Totals
$39,000$40,100
$160,800$18,100
$38,300$296,100
$103,600$55,700
$250,300$8,900
$101,200$519,800
1663956
-51
16475
Estimated from Secondary EconomicActivity Sales and Use Personal Income
$37,800$20,700
$73,985$45,960
96122
Direct and Secondary Estimates of Stateand Local Government Revenues $354,600 $639,800 80
* Nominal 2005 dollars adjusted for inflation using Gross Domestic Product-Implicit Price Deflator and reflect 2007-equivalent dollars.** Net federal and state royalties associated with extraction/production segment of industry equaled $55.4 million in2007. An additional $300,000 in federal royalties associated with oil and gas processing activities were reported asreturned to North Dakota entities by the U.S. Department of Interior, Minerals Management Service (2008).
Employment in the industry also showed substantial change from 2005 through 2007. While employment by oil operators was estimated to remain relatively unchanged over theperiod, expansions of economic activity in the service and support of the oil patch andexpansions of activity in processing and transportation led to gains in employment in thoseareas of the industry (Table 15). Overall, total direct employment within the industry wasestimated to increase by over 2,400 FTE jobs from 2005 to 2007 (Table 15).
30
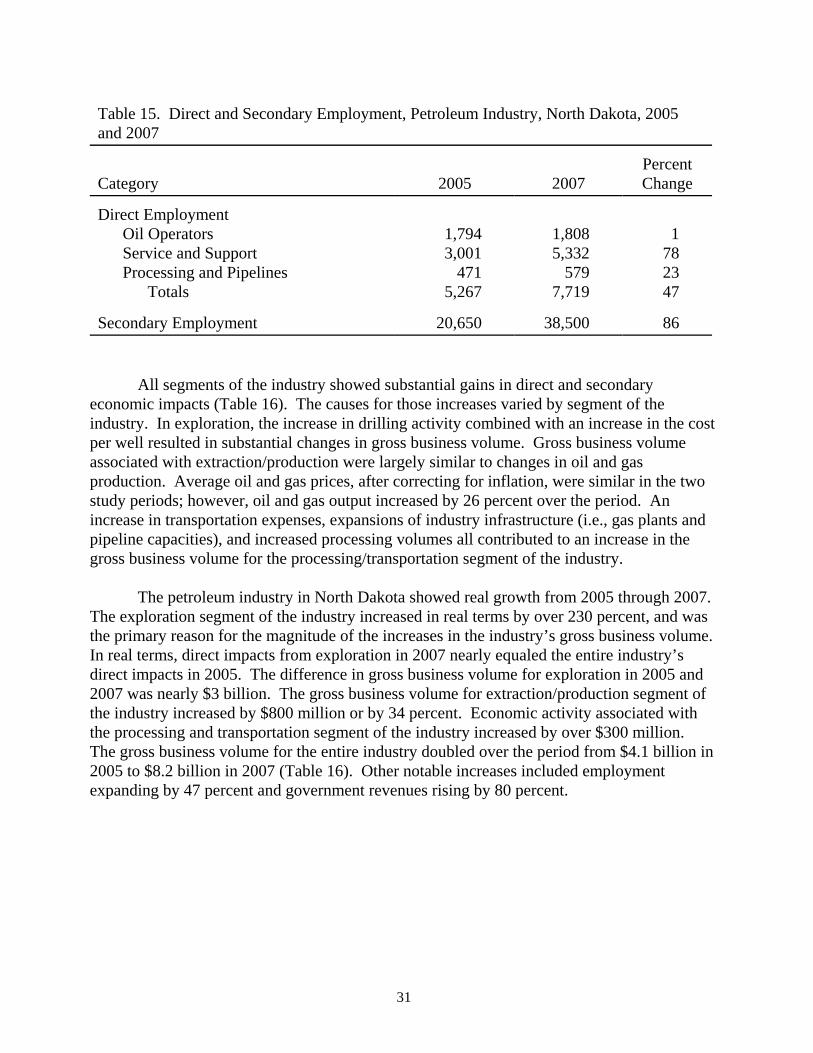
Table 15. Direct and Secondary Employment, Petroleum Industry, North Dakota, 2005and 2007
Category 2005 2007PercentChange
Direct Employment Oil Operators Service and Support Processing and Pipelines Totals
1,7943,001
4715,267
1,8085,332
5797,719
1782347
Secondary Employment 20,650 38,500 86
All segments of the industry showed substantial gains in direct and secondaryeconomic impacts (Table 16). The causes for those increases varied by segment of theindustry. In exploration, the increase in drilling activity combined with an increase in the costper well resulted in substantial changes in gross business volume. Gross business volumeassociated with extraction/production were largely similar to changes in oil and gasproduction. Average oil and gas prices, after correcting for inflation, were similar in the twostudy periods; however, oil and gas output increased by 26 percent over the period. Anincrease in transportation expenses, expansions of industry infrastructure (i.e., gas plants andpipeline capacities), and increased processing volumes all contributed to an increase in thegross business volume for the processing/transportation segment of the industry.
The petroleum industry in North Dakota showed real growth from 2005 through 2007. The exploration segment of the industry increased in real terms by over 230 percent, and wasthe primary reason for the magnitude of the increases in the industry’s gross business volume. In real terms, direct impacts from exploration in 2007 nearly equaled the entire industry’sdirect impacts in 2005. The difference in gross business volume for exploration in 2005 and2007 was nearly $3 billion. The gross business volume for extraction/production segment ofthe industry increased by $800 million or by 34 percent. Economic activity associated withthe processing and transportation segment of the industry increased by over $300 million. The gross business volume for the entire industry doubled over the period from $4.1 billion in2005 to $8.2 billion in 2007 (Table 16). Other notable increases included employmentexpanding by 47 percent and government revenues rising by 80 percent.
31
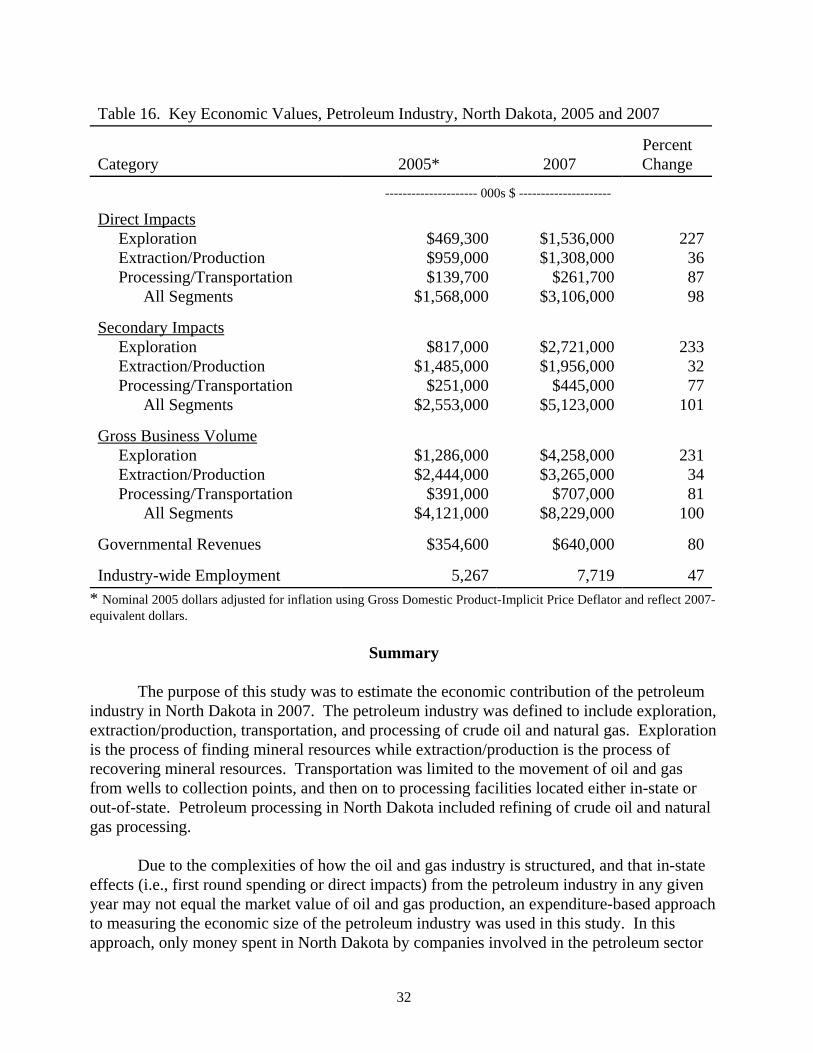
Table 16. Key Economic Values, Petroleum Industry, North Dakota, 2005 and 2007
Category 2005* 2007PercentChange
--------------------- 000s $ ---------------------
Direct Impacts Exploration Extraction/Production Processing/Transportation All Segments
$469,300$959,000$139,700
$1,568,000
$1,536,000$1,308,000
$261,700$3,106,000
227368798
Secondary Impacts Exploration Extraction/Production Processing/Transportation All Segments
$817,000$1,485,000
$251,000$2,553,000
$2,721,000$1,956,000
$445,000$5,123,000
2333277
101
Gross Business Volume Exploration Extraction/Production Processing/Transportation All Segments
$1,286,000$2,444,000
$391,000$4,121,000
$4,258,000$3,265,000
$707,000$8,229,000
2313481
100
Governmental Revenues $354,600 $640,000 80
Industry-wide Employment 5,267 7,719 47* Nominal 2005 dollars adjusted for inflation using Gross Domestic Product-Implicit Price Deflator and reflect 2007-equivalent dollars.
Summary
The purpose of this study was to estimate the economic contribution of the petroleumindustry in North Dakota in 2007. The petroleum industry was defined to include exploration,extraction/production, transportation, and processing of crude oil and natural gas. Explorationis the process of finding mineral resources while extraction/production is the process ofrecovering mineral resources. Transportation was limited to the movement of oil and gasfrom wells to collection points, and then on to processing facilities located either in-state orout-of-state. Petroleum processing in North Dakota included refining of crude oil and naturalgas processing.
Due to the complexities of how the oil and gas industry is structured, and that in-stateeffects (i.e., first round spending or direct impacts) from the petroleum industry in any givenyear may not equal the market value of oil and gas production, an expenditure-based approachto measuring the economic size of the petroleum industry was used in this study. In thisapproach, only money spent in North Dakota by companies involved in the petroleum sector
32
was included in the study and represented the direct impacts of the industry. In addition to in-state expenditures for exploration, production, and processing activities, private and publicroyalties, lease bonuses, and severance taxes were also included as direct impacts. Secondaryeconomic impacts result from the spending and respending of the direct impacts and wereestimated using the North Dakota Input-Output Model.
Three separate surveys were used to collect production, expenditure, and employmentdata for the petroleum industry in North Dakota. Firms that own or operate oil wells in thestate were surveyed to obtain information on in-state expenses for oil and gas exploration, oiland gas extraction/production, general business expenses, employment, oil and gasproduction, and drilling activity. A similar survey was conducted for firms engaged inpipeline transportation of crude oil and unprocessed natural gas and included firms involvedwith processing of crude oil and natural gas in North Dakota. A third survey involvedlease/brokerage firms and was used to obtain information on leasing activity in the state.
The survey of oil operators produced financial data on about 34 percent of NorthDakota’s oil and gas production in 2007. Also, financial data was collected on pipelinetransportation, gas processing, and crude oil refining. The survey of lease/brokerage firmsobtained information on leasing activity on private lands in the state. Secondary data,obtained from government agencies, was combined with survey data to estimate royalties,lease bonuses, and severance taxes.
Estimates of total in-state expenditures in 2007 for oil and gas exploration werederived from the survey of oil operators and used with drilling statistics from the Oil and GasDivision of the North Dakota Industrial Commission. The combination of in-state expensesfor exploration and lease bonuses resulted in $1.536 billion in direct impacts in 2007. Average expense per well drilled was estimated at $4.3 million, and 336 wells were drilled inthe state in 2007. The secondary economic impacts associated with exploration activitieswere estimated at $2.7 billion. The in-state gross business volume of exploration activitieswas estimated at $4.3 billion in 2007 (Figure 7).
Estimates of oil and gas extraction/production expenses, general business expenses foroil operators, private and public royalties, and state severance taxes were derived from surveydata and secondary information obtained from various government agencies. The state had3,759 producing wells in 2007 that produced over 45 million barrels of oil and over 70 millionmcf of natural gas. Total direct impacts for oil and gas production were estimated at $1.308billion in 2007. Total secondary economic impacts associated with oil and gas productionwere estimated at $1.96 billion. The in-state gross business volume of oil and gasextraction/production was estimated at $3.26 billion in 2007 (Figure 7).
The processing component of the petroleum industry was estimated to have a directimpact in North Dakota of $262 million. Total secondary economic impacts associated withprocessing and transporting crude oil and natural gas were estimated at $445 million. The in-state gross business volume of processing and transporting crude oil and natural gas wasestimated at $707 million in 2007 (Figure 7).
33

Industry-wide direct impacts from the petroleum industry were estimated at $3.1billion in 2007. Total secondary economic impacts associated with the industry wereestimated at $5.1 billion. The gross business volume for the petroleum industry in NorthDakota in 2007 was estimated at $8.23 billion (Figure 7).
Additional measures of the petroleum industry’s economic importance to the stateinclude direct employment for 7,719 full-time jobs, economy-wide personal income of $3.1billion, statewide retail sales of nearly $2 billion, direct contributions to local and stategovernment revenues of $520 million, indirect contribution of $120 million in stategovernment tax collections, and secondary employment of 38,500 full-time equivalent jobs. For every dollar spent in the state by the petroleum industry, another $1.65 in additionalbusiness activity was generated.
A number of comparisons to information collected and estimated for 2005 was made tosimilar figures for 2007. While energy prices were not directly used in the study to generateestimates of industry activity, prices directly influence some measures of industry output, suchtax collections and royalties. Oil prices increased from 2005 to 2007 in real terms by 20percent to around $65 per barrel, but remained well below the extreme price spikes observedin 2008. Gas prices, both in nominal and real terms, decreased by 26 percent over the two-year period to about $6.70 per mcf. Oil production increased from 35 million barrels to 45million barrels over the two-year period. Gas production jumped from around 58 million mcfin 2005 to nearly 71 million mcf in 2007. In addition to increases in oil and gas production,exploration activities continued to increase as the number of wells drilled in the state wentfrom 240 in 2005 to 336 in 2007.
34

35
North Dakota Petroleum IndustryKey Segments of the Industry
ExtractionExploration Transportation Processing Distribution Retail
drilling and locatingoil reserves
bringing oil and gasto the surface
moving oil and gasfrom pumps toprocessing centers
oil refining andnatural gas processing
moving productsfrom processorsto retail markets
selling petroleumproducts to endusers
Direct Impacts
Secondary Impacts
Gross Business Volume
Direct Employment
Secondary Employment
$1.536 billion $1.308 billion $262 million
$2.721 billion $1.956 billion $445 million
$4.258 billion $3.264 billion $707 million
7,140 full-time equivalent jobs 579 full-time equivalent jobs
38,500 full-time equivalent jobs
not included
Direct GovernmentRevenues $108 million $393 million $19 million
Figure 7. Economic Effects of Key Segments of the North Dakota Petroleum Industry, 2007
All segments of the industry showed substantial gains in direct and secondaryeconomic impacts over the period. In exploration, the increase in drilling activity combinedwith an increase in the cost per well resulted in substantial changes in gross business volume. Gross business volume associated with extraction/production were largely similar to changesin oil and gas production. An increase in transportation expenses, expansions of industryinfrastructure (i.e., gas plants and pipeline capacities), and increased processing volumes allcontributed to an increase in the gross business volume for the processing/transportationsegment of the industry.
The exploration segment of the industry increased in real terms by over 230 percent,and was the primary reason for the magnitude of the increase in the overall gross businessvolume for the entire industry. In real terms, direct impacts from exploration in 2007 nearlyequaled the entire industry’s direct impacts in 2005. The difference in gross business volumefor exploration in 2005 and 2007 was nearly $3 billion. The gross business volume forextraction/production segment of the industry increased by $800 million or by 34 percent. Economic activity associated with the processing and transportation segment of the industryincreased by over $300 million. The gross business volume for the entire industry doubled inreal terms over the period from $4.1 billion in 2005 to $8.2 billion in 2007 (Table 16). Othernotable increases included direct employment expanding by 47 percent and governmentrevenues rising by 80 percent.
Conclusions
Changes in energy prices, drilling activity, and oil and gas production in North Dakotahave made the petroleum industry the one of largest single basic-sector industries in the state. Comparisons of the industry’s economic importance in 2007 with previous estimates from2005 reveal the industry doubled its economic size in two years. While some of that increasecan be directly attributable to an increase in the number of producing wells, which has led toincreased oil and gas production, the primary reason for the substantial increase has been dueto expenditures for oil drilling/exploration activities.
The economic contribution of the petroleum industry was tied to activity and factorspresent in the industry in 2007. It is important to remember that the figures presented in thisreport represent a snapshot in time, and will not necessarily reflect the future economic impactof the industry. The economic importance of the industry will increase and decrease withchanges in a host of factors that affect petroleum exploration, extraction/production, andprocessing levels. The fact that the economic importance of the industry is subject to changewas readily apparent when comparisons were made between economic output in 2005 andindustry figures for 2007. The gross business volume associated with exploration increasedby over 230 percent in real terms over the period. A combination of a substantial increase inthe number of oil wells drilled and a nearly three-fold increase in the cost per well drilledwere the reasons for the change. Other comparisons between 2005 and 2007 reveal thatchanges in impacts from oil and gas extraction/production more closely mirrored changes inoutput, while increases in economic activity associated with the processing sector of the
36
industry were tied to both increases in state oil and gas production, but also to expandedcapacity of the industry’s infrastructure, and increased transportation activity.
Few other basic-sector industries in North Dakota, outside of various agriculturalindustries and the lignite industry, have had similar comprehensive assessments of theireconomic importance. The figures reported in this study are substantial, and comparisons toother basic-sector industries may be helpful in placing results from this study in context. Thewheat industry and the coal industry are two examples of basic-sector industries that have hadeconomic assessments performed to measure their economic contribution to North Dakota’seconomy. From 2001 through 2003, the production, transportation, handling, and processingof wheat in North Dakota was estimated to produce a gross business volume of $3.56 billionannually. In 2007, the coal industry in North Dakota was estimated to generate $2.4 billion ingross business volume (Coon and Leistritz 2008a). Estimates of the gross business volumefor the petroleum industry were $4.1 billion in real terms in 2005 and nearly $8.2 billion in2007. Direct employment figures for the wheat industry would not be comparable to those inthis study; however, direct employment in the coal industry was estimated at 3,882 FTEpositions, compared to 5,267 FTE jobs in the petroleum industry in 2005 and 7,719 FTEpositions in 2007.
Regardless of the economic measure used, the petroleum industry is one of the largestbasic-sector industries in North Dakota. Considering that the industry’s direct impacts (i.e.,first round of spending) are concentrated geographically in the western portion of the state, theeconomic health of western North Dakota is perhaps tied more to the petroleum industry thanany other single industry. Yet, despite the strong influence of the petroleum industry inwestern North Dakota, the magnitude of the contributions to both the state and localgovernments and the shear volume of secondary economic effects in nearly all sectors of theNorth Dakota economy would suggest that the economic effects of the industry are feltstatewide. Current activity levels in the petroleum industry clearly make it one of the keyforces in the North Dakota economy.
37

References
American Petroleum Institute. 2006. Basic Petroleum Data Book, 2nd Edition. Vol 25, No. 2. American Petroleum Institute, Washington, D.C.
Bangsund, Dean A. and F. Larry Leistritz. 2007. Economic Contribution of the PetroleumIndustry to North Dakota. Agribusiness and Applied Economics Report No. 599. Department of Agribusiness and Applied Economics, North Dakota State University,Fargo.
Bangsund, Dean A. and F. Larry Leistritz. 2005. Economic Contribution of the WheatIndustry to North Dakota. Agribusiness and Applied Economics Report No. 554. Department of Agribusiness and Applied Economics, North Dakota State University,Fargo.
Bangsund, Dean A. and F. Larry Leistritz. 2004. Economic Contribution of the SugarbeetIndustry in Minnesota, North Dakota, and Eastern Montana. Agribusiness andApplied Economics Report No. 532, Department of Agribusiness and AppliedEconomics, North Dakota State University, Fargo.
Bangsund, Dean A. and F. Larry Leistritz. 1999. Economic Contribution of the SoybeanIndustry in North Dakota. Agricultural Economics Report No. 416, Department ofAgricultural Economics, North Dakota State University, Fargo.
Bangsund, Dean A. and F. Larry Leistritz. 1998. Economic Contribution of the BarleyIndustry in North Dakota, South Dakota, and Minnesota. Agricultural EconomicsReport No. 391, Department of Agricultural Economics, North Dakota StateUniversity, Fargo.
Bangsund, Dean A. and F. Larry Leistritz. 1998. Economic Contribution of the SugarbeetIndustry in North Dakota and Minnesota. Agricultural Economics Report No. 395. Department of Agricultural Economics, North Dakota State University, Fargo.
Bangsund, Dean A. and F. Larry Leistritz. 1995a. Economic Contribution of the UnitedStates Sunflower Industry. Agricultural Economics Report No. 327, Department ofAgricultural Economics, North Dakota State University, Fargo.
Bangsund, Dean A. and F. Larry Leistritz. 1995b. Economic Contribution of the WheatIndustry to the North Dakota Economy. Agricultural Economics Report No. 332,Department of Agricultural Economics, North Dakota State University, Fargo.
Coon, Randal C. and F. Larry Leistritz. 2008a. North Dakota Lignite Energy Industry’sContribution to the State Economy for 2007 and Projected for 2008. AAE Staff Paper08001. Department of Agribusiness and Applied Economics, North Dakota StateUniversity, Fargo.
38
Coon, Randal C. and F. Larry Leistritz. 2008b. The North Dakota Input-Output Model DataBase. Department of Agribusiness and Applied Economics, North Dakota StateUniversity, Fargo.
Coon, Randal C., F. Larry Leistritz, Thor A. Hertsgaard, and Arlen G. Leholm. 1985. TheNorth Dakota Input-Output Model: A Tool for Analyzing Economic Linkages. Agricultural Economics Report No. 187, Department of Agricultural Economics, NorthDakota State University, Fargo.
Hamm, Rita R., JoAnn M. Thompson, Randal C. Coon, and F. Larry Leistritz. 1993. TheEconomic Impact of North Dakota's Health Care Industry on the State's Economy in1991. Agricultural Economics Report No. 296, Institute for Business and IndustryDevelopment and Department of Agricultural Economics, North Dakota StateUniversity, Fargo.
Leistritz, F. Larry and Steve H. Murdock. 1981. Socioeconomic Impact of ResourceDevelopment: Methods for Assessment. Westview Press, Boulder, Colorado.
North Dakota Industrial Commission. 2008. Unpublished data on oil and gas production,well drilling activity, and energy prices. Oil and Gas Division, Department of MineralResources, North Dakota Industrial Commission, Bismarck, ND.
North Dakota Office of State Tax Commissioner. 2008. Unpublished data on statecollections of gross production tax and extraction tax. North Dakota Office of StateTax Commissioner, Bismarck, ND.
North Dakota State Land Department. 2008. Oil and gas lease statistics. http://www.land.state.nd.us/ Minerals Management Division, North Dakota State LandDepartment, Bismarck, ND.
U.S. Department of Commerce. 2008. Implicit Price Deflators for Gross Domestic Producthttp://www.bea.gov/national/nipaweb/TableView.asp?SelectedTable=13&Freq=Qtr&FirstYear=2006&LastYear=2008 Bureau of Economic Analysis, U.S. Department ofCommerce, Washington, D.C.
U.S. Department of Energy. 2008. http://www.eia.doe.gov/ Energy InformationAdministration, U.S. Department of Energy, Washington, D.C.
U.S. Department of the Interior. 2008. http://www.mrm.mms.gov/MRMWebStats/Home.aspx Minerals Revenue Management, Minerals Management Service, U.S. Department of theInterior, Washington, D.C.
U.S. Forest Service. 2008. Unpublished data. U.S. Forest Service, U.S. Department ofAgriculture, Bismarck, ND.
39

APPENDIX A
Questionnaire, Oil Operators,North Dakota, 2005
Contribution of the Petroleum Industryto the North Dakota Economy
Survey of Oil Operators
Department of Agribusiness and Applied EconomicsNorth Dakota State University
andNorth Dakota Petroleum Council
41
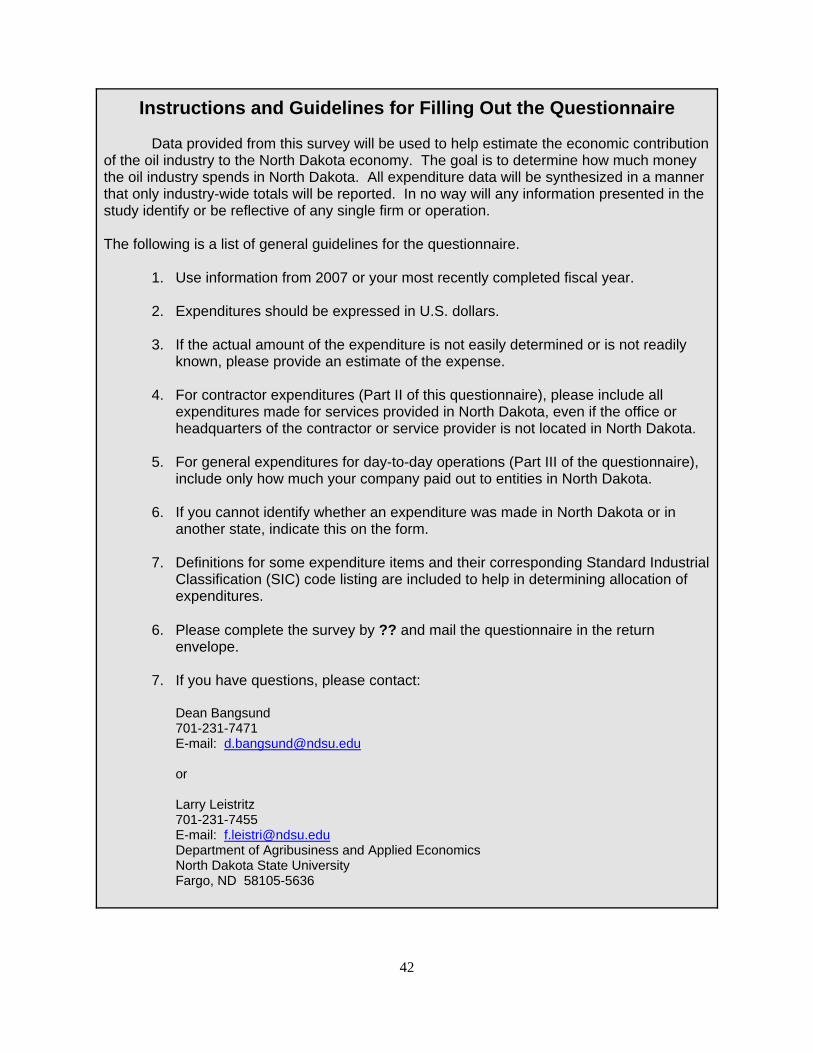
Instructions and Guidelines for Filling Out the Questionnaire
Data provided from this survey will be used to help estimate the economic contributionof the oil industry to the North Dakota economy. The goal is to determine how much moneythe oil industry spends in North Dakota. All expenditure data will be synthesized in a mannerthat only industry-wide totals will be reported. In no way will any information presented in thestudy identify or be reflective of any single firm or operation.
The following is a list of general guidelines for the questionnaire.
1. Use information from 2007 or your most recently completed fiscal year.
2. Expenditures should be expressed in U.S. dollars.
3. If the actual amount of the expenditure is not easily determined or is not readilyknown, please provide an estimate of the expense.
4. For contractor expenditures (Part II of this questionnaire), please include allexpenditures made for services provided in North Dakota, even if the office orheadquarters of the contractor or service provider is not located in North Dakota.
5. For general expenditures for day-to-day operations (Part III of the questionnaire),include only how much your company paid out to entities in North Dakota.
6. If you cannot identify whether an expenditure was made in North Dakota or inanother state, indicate this on the form.
7. Definitions for some expenditure items and their corresponding Standard IndustrialClassification (SIC) code listing are included to help in determining allocation ofexpenditures.
6. Please complete the survey by ?? and mail the questionnaire in the returnenvelope.
7. If you have questions, please contact:
Dean Bangsund701-231-7471E-mail: [email protected]
or
Larry Leistritz701-231-7455E-mail: [email protected] of Agribusiness and Applied EconomicsNorth Dakota State UniversityFargo, ND 58105-5636
42

Part I - - General Information
Business Name:
Mailing Address:
Contact Person:
The following questions pertain only to wells for which your company is the operator.
Number of producing oil wells in ND in 2007 for which your company was the operator __________
Oil Gas
Total production from your operated wells in 2007 _______ bbls _______ mcf
Operator interest share of production _______ % _______ %
Overriding royalty interest share of production _______ % _______ %
Remaining working interest share of production _______ % _______ %
Total number of employees working in North Dakota: (Full-time equivalents)
Number of jobs (FTE’s) above dedicated to exploration/drilling
Number of jobs (FTE’s) above dedicated to general production/extraction
__________
__________
43
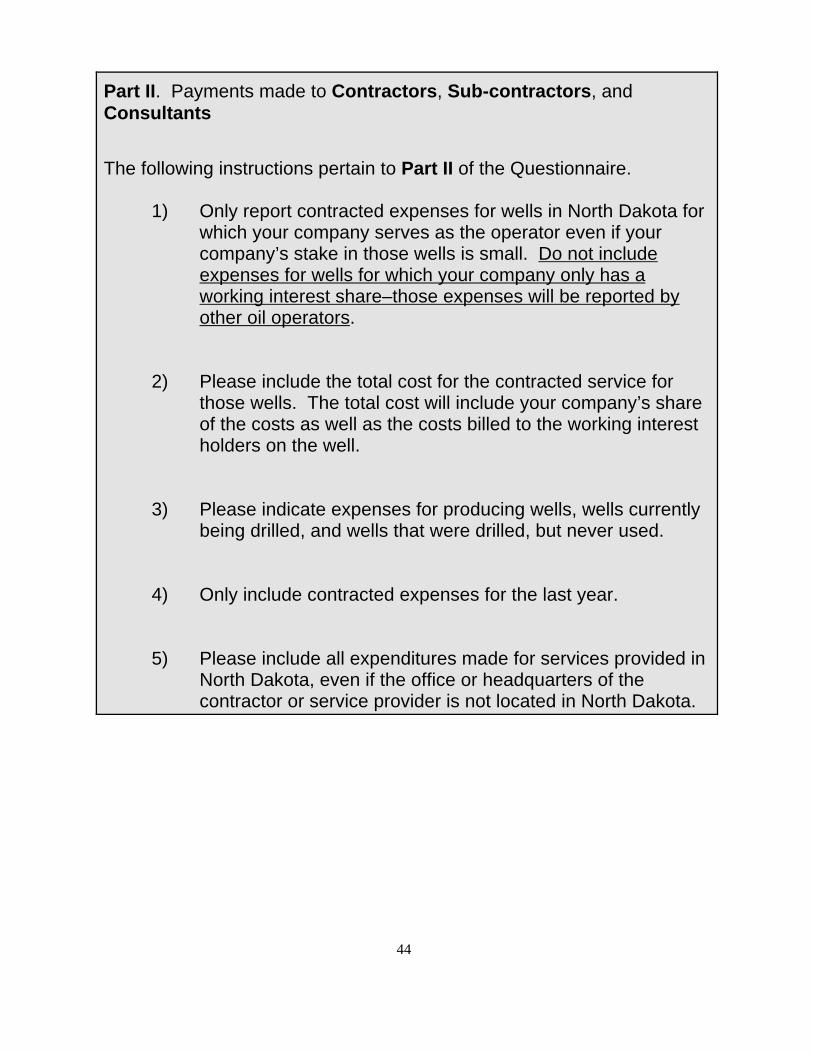
Part II. Payments made to Contractors, Sub-contractors, andConsultants
The following instructions pertain to Part II of the Questionnaire.
1) Only report contracted expenses for wells in North Dakota forwhich your company serves as the operator even if yourcompany’s stake in those wells is small. Do not includeexpenses for wells for which your company only has aworking interest share–those expenses will be reported byother oil operators.
2) Please include the total cost for the contracted service forthose wells. The total cost will include your company’s shareof the costs as well as the costs billed to the working interest holders on the well.
3) Please indicate expenses for producing wells, wells currentlybeing drilled, and wells that were drilled, but never used.
4) Only include contracted expenses for the last year.
5) Please include all expenditures made for services provided inNorth Dakota, even if the office or headquarters of thecontractor or service provider is not located in North Dakota.
44
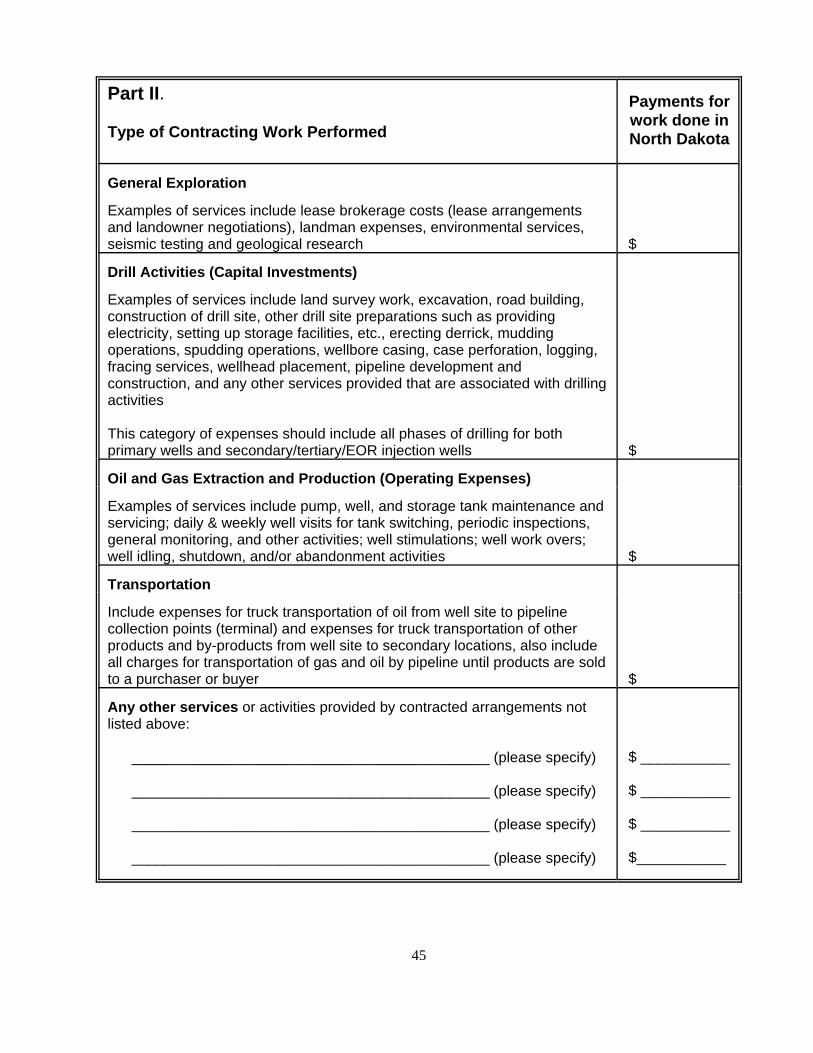
Part II.
Type of Contracting Work Performed
Payments forwork done inNorth Dakota
General Exploration
Examples of services include lease brokerage costs (lease arrangementsand landowner negotiations), landman expenses, environmental services,seismic testing and geological research $
Drill Activities (Capital Investments)
Examples of services include land survey work, excavation, road building,construction of drill site, other drill site preparations such as providingelectricity, setting up storage facilities, etc., erecting derrick, muddingoperations, spudding operations, wellbore casing, case perforation, logging,fracing services, wellhead placement, pipeline development andconstruction, and any other services provided that are associated with drillingactivities
This category of expenses should include all phases of drilling for bothprimary wells and secondary/tertiary/EOR injection wells $
Oil and Gas Extraction and Production (Operating Expenses)
Examples of services include pump, well, and storage tank maintenance andservicing; daily & weekly well visits for tank switching, periodic inspections,general monitoring, and other activities; well stimulations; well work overs;well idling, shutdown, and/or abandonment activities $
Transportation
Include expenses for truck transportation of oil from well site to pipelinecollection points (terminal) and expenses for truck transportation of otherproducts and by-products from well site to secondary locations, also includeall charges for transportation of gas and oil by pipeline until products are soldto a purchaser or buyer $
Any other services or activities provided by contracted arrangements notlisted above:
____________________________________________ (please specify)
____________________________________________ (please specify)
____________________________________________ (please specify)
____________________________________________ (please specify)
$ ___________
$ ___________
$ ___________
$___________
45
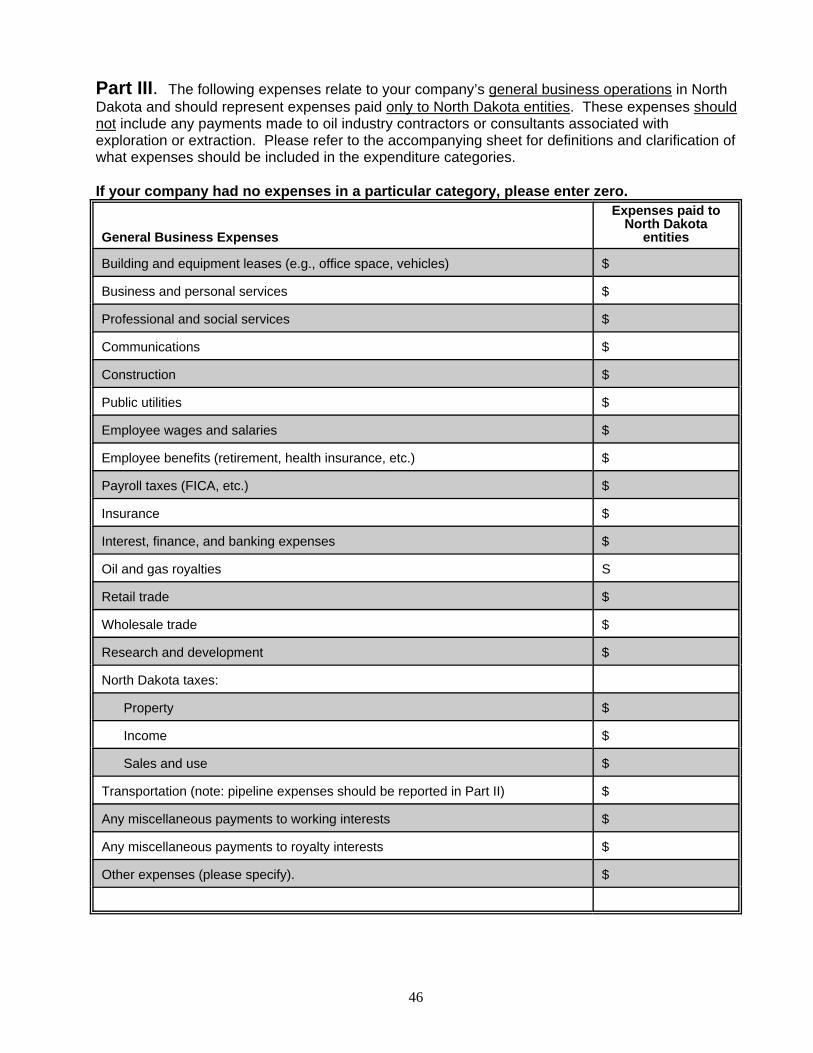
Part III. The following expenses relate to your company’s general business operations in NorthDakota and should represent expenses paid only to North Dakota entities. These expenses shouldnot include any payments made to oil industry contractors or consultants associated withexploration or extraction. Please refer to the accompanying sheet for definitions and clarification ofwhat expenses should be included in the expenditure categories.
If your company had no expenses in a particular category, please enter zero.
General Business Expenses
Expenses paid toNorth Dakota
entities
Building and equipment leases (e.g., office space, vehicles) $
Business and personal services $
Professional and social services $
Communications $
Construction $
Public utilities $
Employee wages and salaries $
Employee benefits (retirement, health insurance, etc.) $
Payroll taxes (FICA, etc.) $
Insurance $
Interest, finance, and banking expenses $
Oil and gas royalties S
Retail trade $
Wholesale trade $
Research and development $
North Dakota taxes:
Property $
Income $
Sales and use $
Transportation (note: pipeline expenses should be reported in Part II) $
Any miscellaneous payments to working interests $
Any miscellaneous payments to royalty interests $
Other expenses (please specify). $
46
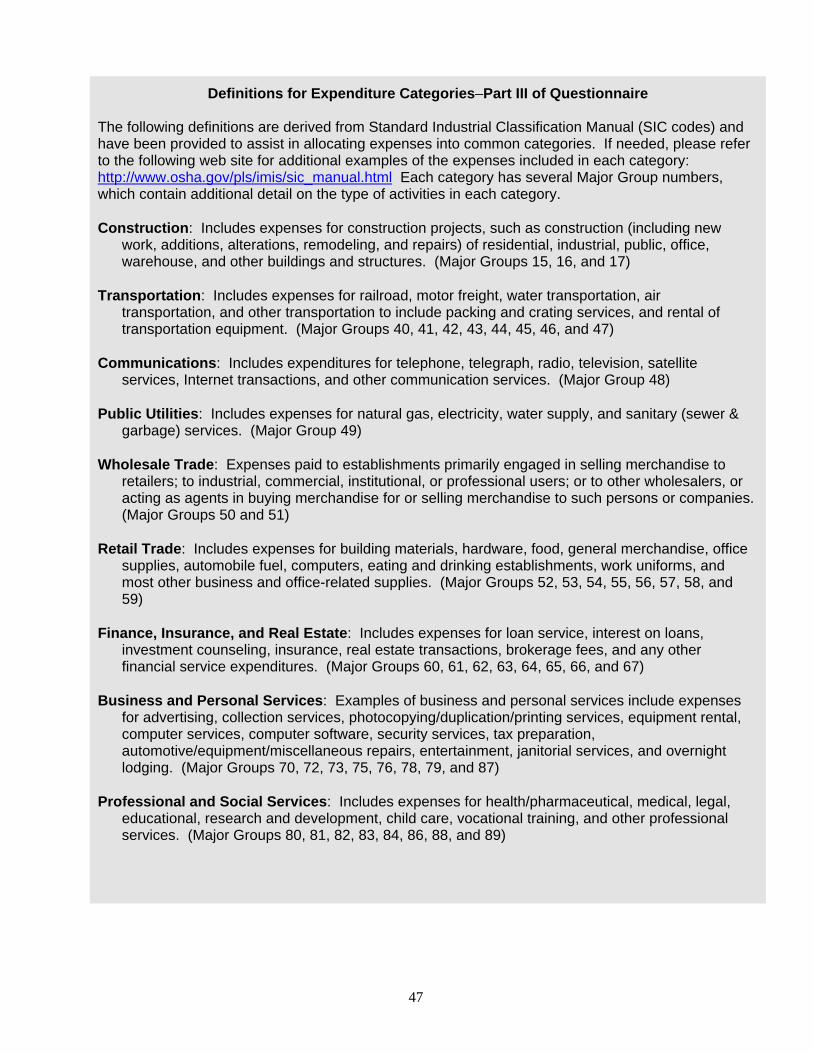
Definitions for Expenditure Categories–Part III of Questionnaire
The following definitions are derived from Standard Industrial Classification Manual (SIC codes) andhave been provided to assist in allocating expenses into common categories. If needed, please referto the following web site for additional examples of the expenses included in each category: http://www.osha.gov/pls/imis/sic_manual.html Each category has several Major Group numbers,which contain additional detail on the type of activities in each category.
Construction: Includes expenses for construction projects, such as construction (including newwork, additions, alterations, remodeling, and repairs) of residential, industrial, public, office,warehouse, and other buildings and structures. (Major Groups 15, 16, and 17)
Transportation: Includes expenses for railroad, motor freight, water transportation, airtransportation, and other transportation to include packing and crating services, and rental oftransportation equipment. (Major Groups 40, 41, 42, 43, 44, 45, 46, and 47)
Communications: Includes expenditures for telephone, telegraph, radio, television, satelliteservices, Internet transactions, and other communication services. (Major Group 48)
Public Utilities: Includes expenses for natural gas, electricity, water supply, and sanitary (sewer &garbage) services. (Major Group 49)
Wholesale Trade: Expenses paid to establishments primarily engaged in selling merchandise toretailers; to industrial, commercial, institutional, or professional users; or to other wholesalers, oracting as agents in buying merchandise for or selling merchandise to such persons or companies. (Major Groups 50 and 51)
Retail Trade: Includes expenses for building materials, hardware, food, general merchandise, officesupplies, automobile fuel, computers, eating and drinking establishments, work uniforms, andmost other business and office-related supplies. (Major Groups 52, 53, 54, 55, 56, 57, 58, and59)
Finance, Insurance, and Real Estate: Includes expenses for loan service, interest on loans,investment counseling, insurance, real estate transactions, brokerage fees, and any otherfinancial service expenditures. (Major Groups 60, 61, 62, 63, 64, 65, 66, and 67)
Business and Personal Services: Examples of business and personal services include expensesfor advertising, collection services, photocopying/duplication/printing services, equipment rental,computer services, computer software, security services, tax preparation,automotive/equipment/miscellaneous repairs, entertainment, janitorial services, and overnightlodging. (Major Groups 70, 72, 73, 75, 76, 78, 79, and 87)
Professional and Social Services: Includes expenses for health/pharmaceutical, medical, legal,educational, research and development, child care, vocational training, and other professionalservices. (Major Groups 80, 81, 82, 83, 84, 86, 88, and 89)
47
Part IV. Leasing and Drilling Activity in North Dakota. Please summarize yourcompany’s lease expenditures and drilling activities over the last five years. Leaseexpenditures and drilling activities should be for North Dakota operations only.
Leasing 2007
Total lease expenditures ($)
Private leases
State leases
Federal leases
Total acres leased
Private land
State land
Federal land
Drilling 2007
Overall number of wells drilled
Number of wells drilled that were plugged (dry holes)
Number of wells drilled that went into production (completed as a producer)
48
Thank You for completing this questionnaire!
Please return the questionnaire in the postpaid envelope.
If you would like a copy of the study results mailed to you, make sure you haveprovided a mailing address in Part I of the questionnaire. Otherwise, you may contactEdie Watts in the Department of Agribusiness and Applied Economics at NorthDakota State University for more information on our departmental reports. Phone701-231 7441, fax 701-231-7400, email: [email protected] or visit ourdepartmental listing of research reports on the internet at http://agecon.lib.umn.edu
Study results should be available in the fall of 2008.
49
APPENDIX B
Questionnaire, Processors,North Dakota, 2007
Contribution of the Petroleum Industryto the North Dakota Economy
Survey of Processors
Department of Agribusiness and Applied EconomicsNorth Dakota State University
andNorth Dakota Petroleum Council
51

Instructions and Guidelines for Filling Out the Questionnaire
Data provided from this survey will be used to help estimate the economic contribution of theoil industry to the North Dakota economy. The goal is to determine how much money the oilindustry spends in North Dakota. All expenditure data will be synthesized in a manner that onlyindustry-wide totals will be reported. In no way will any information presented in the studyidentify or be reflective of any single firm or operation.
The following is a list of general guidelines for the questionnaire.
1. Use information from your most recently completed fiscal year.
2. Expenditures should be expressed in U.S. dollars.
3. If the actual amount of the expenditure is not easily determined or is not readily known,please provide an estimate of the expense.
4. Only include expenditures made to businesses, governments, or individuals in NorthDakota.
5. If you cannot identify whether an expenditure was made in North Dakota or in anotherstate, indicate this on the form.
6. Definitions for some expenditure items and their corresponding Standard IndustrialClassification (SIC) code listing are included to help in determining allocation ofexpenditures.
7. We would prefer to have the questionnaire completed and returned by June 4, 2008.
If you have questions, please contact:
Dean Bangsund701-231-7471E-mail: [email protected] Leistritz701-231-7455E-mail: [email protected] of Agribusiness and Applied EconomicsNorth Dakota State UniversityFargo, ND 58105-5636
52
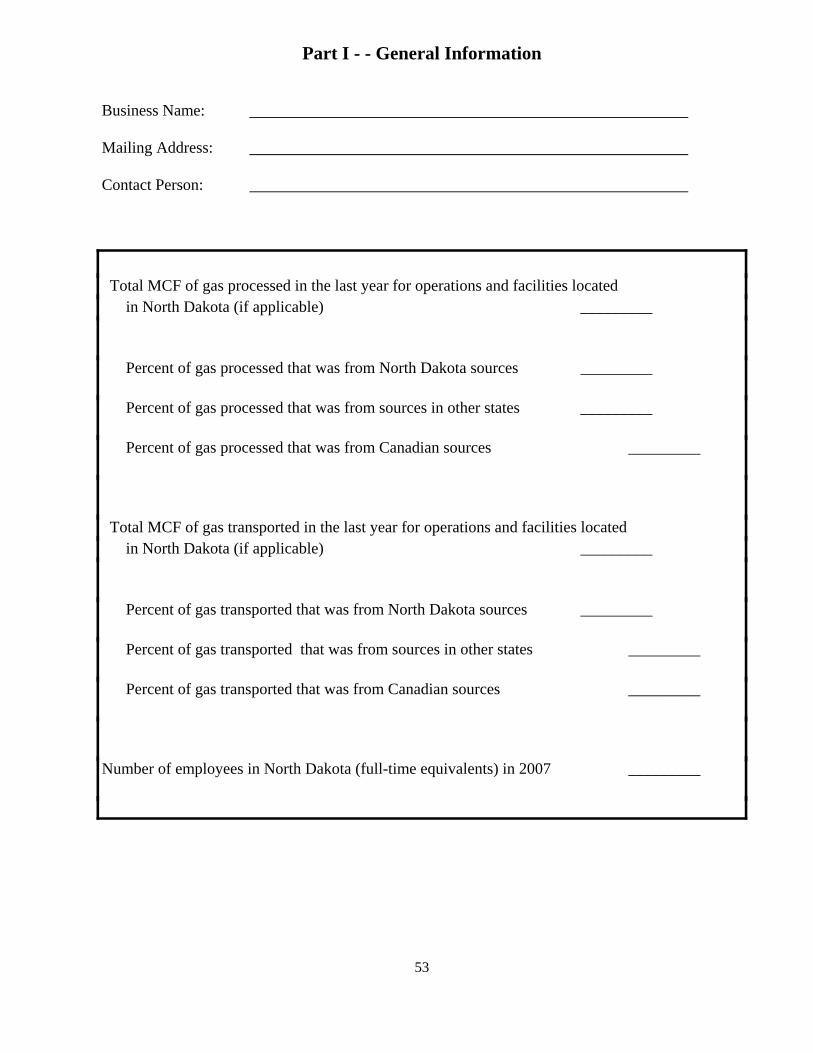
Part I - - General Information
Business Name:
Mailing Address:
Contact Person:
Total MCF of gas processed in the last year for operations and facilities located
in North Dakota (if applicable) _________
Percent of gas processed that was from North Dakota sources _________
Percent of gas processed that was from sources in other states _________
Percent of gas processed that was from Canadian sources _________
Total MCF of gas transported in the last year for operations and facilities located in North Dakota (if applicable) _________
Percent of gas transported that was from North Dakota sources _________
Percent of gas transported that was from sources in other states _________
Percent of gas transported that was from Canadian sources _________
Number of employees in North Dakota (full-time equivalents) in 2007 _________
53
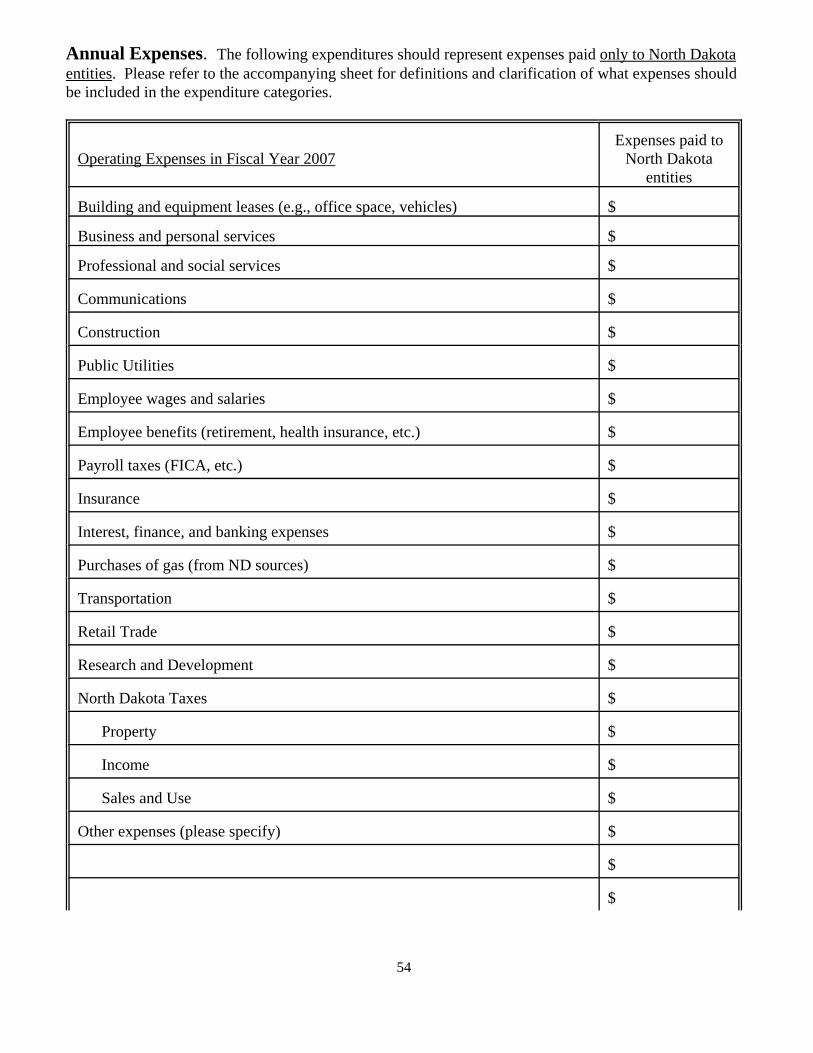
Annual Expenses. The following expenditures should represent expenses paid only to North Dakotaentities. Please refer to the accompanying sheet for definitions and clarification of what expenses shouldbe included in the expenditure categories.
Operating Expenses in Fiscal Year 2007Expenses paid to
North Dakotaentities
Building and equipment leases (e.g., office space, vehicles) $
Business and personal services $
Professional and social services $
Communications $
Construction $
Public Utilities $
Employee wages and salaries $
Employee benefits (retirement, health insurance, etc.) $
Payroll taxes (FICA, etc.) $
Insurance $
Interest, finance, and banking expenses $
Purchases of gas (from ND sources) $
Transportation $
Retail Trade $
Research and Development $
North Dakota Taxes $
Property $
Income $
Sales and Use $
Other expenses (please specify) $
$
$
54
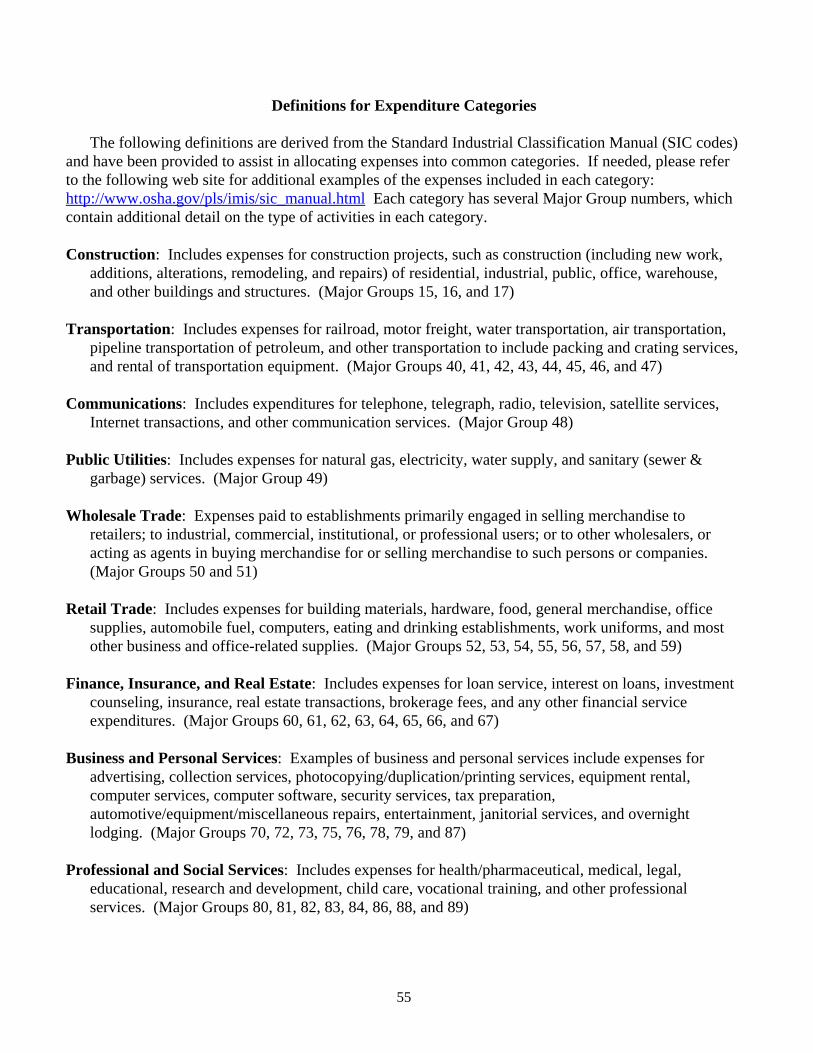
Definitions for Expenditure Categories
The following definitions are derived from the Standard Industrial Classification Manual (SIC codes)and have been provided to assist in allocating expenses into common categories. If needed, please referto the following web site for additional examples of the expenses included in each category: http://www.osha.gov/pls/imis/sic_manual.html Each category has several Major Group numbers, whichcontain additional detail on the type of activities in each category.
Construction: Includes expenses for construction projects, such as construction (including new work,additions, alterations, remodeling, and repairs) of residential, industrial, public, office, warehouse,and other buildings and structures. (Major Groups 15, 16, and 17)
Transportation: Includes expenses for railroad, motor freight, water transportation, air transportation,pipeline transportation of petroleum, and other transportation to include packing and crating services,and rental of transportation equipment. (Major Groups 40, 41, 42, 43, 44, 45, 46, and 47)
Communications: Includes expenditures for telephone, telegraph, radio, television, satellite services,Internet transactions, and other communication services. (Major Group 48)
Public Utilities: Includes expenses for natural gas, electricity, water supply, and sanitary (sewer &garbage) services. (Major Group 49)
Wholesale Trade: Expenses paid to establishments primarily engaged in selling merchandise toretailers; to industrial, commercial, institutional, or professional users; or to other wholesalers, oracting as agents in buying merchandise for or selling merchandise to such persons or companies. (Major Groups 50 and 51)
Retail Trade: Includes expenses for building materials, hardware, food, general merchandise, officesupplies, automobile fuel, computers, eating and drinking establishments, work uniforms, and mostother business and office-related supplies. (Major Groups 52, 53, 54, 55, 56, 57, 58, and 59)
Finance, Insurance, and Real Estate: Includes expenses for loan service, interest on loans, investmentcounseling, insurance, real estate transactions, brokerage fees, and any other financial serviceexpenditures. (Major Groups 60, 61, 62, 63, 64, 65, 66, and 67)
Business and Personal Services: Examples of business and personal services include expenses foradvertising, collection services, photocopying/duplication/printing services, equipment rental,computer services, computer software, security services, tax preparation,automotive/equipment/miscellaneous repairs, entertainment, janitorial services, and overnightlodging. (Major Groups 70, 72, 73, 75, 76, 78, 79, and 87)
Professional and Social Services: Includes expenses for health/pharmaceutical, medical, legal,educational, research and development, child care, vocational training, and other professionalservices. (Major Groups 80, 81, 82, 83, 84, 86, 88, and 89)
55

Thank You for completing this questionnaire!
Please return the questionnaire in the postpaid envelope.
If you would like a copy of the study results mailed to you, make sure you haveprovided a mailing address in Part I of the questionnaire. Otherwise, you may contactEdie Watts in the Department of Agribusiness and Applied Economics at NorthDakota State University for more information on our departmental reports. Phone701-231 7441, fax 701-231-7400, email: [email protected] or visit ourdepartmental listing of research reports on the internet at http://agecon.lib.umn.edu
Study results should be available in the fall of 2008.
56
APPENDIX C
Questionnaire, Leasing/Brokerage Firms,North Dakota, 2007
Contribution of the Petroleum Industry to the North Dakota Economy
Department of Agribusiness and Applied EconomicsNorth Dakota State University
and North Dakota Petroleum Council
Confidential Survey of Oil Leasing Firms
Company _________________________________________________Contact Person _________________________________________________
Total bonus payments paid out for oil leases in North Dakota in 2007 $________________
Of the total above, what percentage went to:%_________ In-state residents (North Dakota addresses only)%_________ Federal agencies%_________ ND State agencies
Total net lease acres made by your firm in North Dakota in 2007 _________________
Of the total above, what percentage was represented by:%_________ Private acreage%_________ Federal acreage%_________ State acreage
Thank you for completing this questionnaire. The material you provide is kept strictly confidential andwill be averaged with data from other firms.
Please mail your completed questionnaire to:
Dean BangsundDept of Agribusiness and Applied Economics
North Dakota State UniversityNDSU Dept 7610
PO Box 6050Fargo, ND 58108-6050
Please call or e-mail Dean Bangsund, NDSU, for any questions regarding this survey or the study of thePetroleum Industry in North Dakota.Ph. 701-231-7471E-mail: [email protected]
58