petroleum industry’s economic contribution to north dakota
TRANSCRIPT

Agribusiness and Applied Economics Report No. 807 February 2021
Petroleum Industry’s Economic Contribution to North Dakota in 2019
Dean A. Bangsund Department of Agribusiness and Applied Economics
and Nancy M. Hodur, PhD
Center for Social Research
North Dakota State University Fargo, North Dakota 58105

ACKNOWLEDGMENTS Special thanks are extended to Ron Ness, President, North Dakota Petroleum Council, for his leadership, guidance, and information throughout the study, and to Kristen Hamman, Director of Communications, North Dakota Petroleum Council, who assisted with the surveys and soliciting industry cooperation for the study. Several individuals were helpful at various stages of the study. Our appreciation and thanks are extended to: Justin Kringstad (North Dakota Pipeline Authority) Bruce Hicks (North Dakota Department of Mineral Resources) Kathy Strombeck (North Dakota Office of State Tax Commissioner) Kristy McCuster (North Dakota Department of Trust Lands) The study authors and study sponsors would like to thank all the companies and individuals that took the time to complete and return the survey materials. This study, with its reliance on industry data, would not have been possible without industry cooperation. Thanks are given to Edie Nelson for work with the study surveys and document preparation, and to our colleagues for reviewing this manuscript. Financial support was provided by the North Dakota Petroleum Council. We express our appreciation for their support. The authors assume responsibility for any errors of omission, logic, or otherwise. Any opinions, findings, or conclusions expressed in this publication are those of the authors and do not necessarily reflect the views of the North Dakota Petroleum Council, the NDSU Department of Agribusiness and Applied Economics or NDSU Center for Social Research. A single copy of this publication is available free of charge. Please address your inquiry to the Department of Agribusiness and Applied Economics, North Dakota State University, PO Box 5636, Fargo, ND 58105-5636, phone (701-231-7441), fax (701-231-7400), or e-mail: [email protected] . This publication is also available electronically at the following web site: http://ageconsearch.umn.edu/ NDSU is equal opportunity institution. Copyright © 2021 by Bangsund and Hodur. All rights reserved. Readers may make verbatim copies of this document for non-commercial purposes by any means, provided this copyright notice appears on all such copies.

i
TABLE OF CONTENTS Page List of Tables ................................................................................................................................................ iii List of Figures ............................................................................................................................................... iv List of Appendix Tables ................................................................................................................................. v List of Appendix Figures .............................................................................................................................. viii Executive Summary .......................................................................................................................................ix Introduction .................................................................................................................................................. 1 Objectives ..................................................................................................................................................... 2 Background ................................................................................................................................................... 2 Industry Organization ...................................................................................................................... 2 Production Statistics ........................................................................................................................ 3 Procedures .................................................................................................................................................... 6 Data Collection ................................................................................................................................. 6 Oil Operators and Oil Field Development ........................................................................... 6 Processors and Transportation ........................................................................................... 6 IMPLAN Industry Profiles ................................................................................................................. 7 Input-Output Analysis ...................................................................................................................... 7 Key Economic Metrics ................................................................................................................................... 9 Exploration and Development ......................................................................................................... 9 Oil and Gas Production .................................................................................................................. 10 Processing and Transportation ...................................................................................................... 11 Government Revenues .................................................................................................................. 12 Economic Contribution Employment ................................................................................................................................... 13 Exploration and Development ....................................................................................................... 18 Oil and Gas Production .................................................................................................................. 18 Processing and Transportation ...................................................................................................... 19 Capital Expenditures ...................................................................................................................... 20 Government Revenues .................................................................................................................. 23 Total Economic Contribution ......................................................................................................... 26 Comparison of Previous Economic Assessments ........................................................................................ 29

ii
TABLE OF CONTENTS (continued) Page Summary and Conclusions .......................................................................................................................... 31 References .................................................................................................................................................. 32 Appendices Appendix A: Survey Questionnaires .................................................................................. 35 Appendix B: Economic Impact Modeling .......................................................................... 60 Appendix C: Reconstructed Economic Sectors for IMPLAN, Petroleum Industry, North Dakota, 2015, 2017 and 2019 ............................................................ 84 Appendix D: Direct Employment and Employment Compensation, Petroleum Industry,
North Dakota, 2013 through 2019 ................................................................ 94 Appendix E: Economic Impacts by Industry Segments, Delineated by 2 Digit NAICS Codes, Petroleum Industry, North Dakota, 2017 and 2019........................ 113

iii
LIST OF TABLES Table Page 1 Selected Statistics and Economic Metrics, Petroleum Industry North Dakota, 2017 and 2019.... 10 2 Comparison of Economic Estimates, Government Revenues, Petroleum Industry, North Dakota, 2017 and 2019........................................................................................................ 12 3 Estimates of Direct Employment, Selected NAICS Codes and Job Service North Dakota Analysis, Petroleum Industry, North Dakota, 2003 through 2019 ................................................ 15 4 Oil and Gas Industry Employment and Employment Compensation, NAICS Code 21, North Dakota, 2010 through 2019 ................................................................................................. 16 5 Employment, Direct and Secondary Economic Activity, Petroleum Industry, North Dakota, 2011 through 2019 ................................................................................................. 17 6 Employment Compensation, Direct and Secondary Economic Activity, Petroleum Industry, North Dakota, 2013 through 2019 ................................................................................................. 17 7 Direct, Indirect, and Induced Economic Effects, Well Development, Petroleum Industry, North Dakota, 2019 ...................................................................................... 18 8 Direct, Indirect, and Induced Economic Effects, Oil and Gas Production, Petroleum Industry, North Dakota, 2019 ...................................................................................... 19 9 Direct, Indirect, and Induced Economic Effects, Processing and Transportation, Petroleum Industry, North Dakota, 2019 ...................................................................................... 20 10 Capital Expenditures (Infrastructure), Petroleum Industry, North Dakota, 2011 through 2019 ................................................................................................. 21 11 Direct, Indirect, and Induced Economic Effects, Infrastructure, Petroleum Industry, North Dakota, 2019 ...................................................................................... 22 12 State and Local Government Revenues from Indirect and Induced Economic Activity, Petroleum Industry, North Dakota, 2015, 2017, and 2019 ............................................................ 25 13 Total Economic Contribution, All Segments, Petroleum Industry, North Dakota, 2019 ............... 26 14 Direct, Indirect, and Induced Employment, by Economic Sector, Petroleum Industry, North Dakota, 2019........................................................................................................................ 27 15 Gross Business Volume, by Economic Sector, Petroleum Industry, North Dakota, 2019 .............. 28 16 Key Economic Values, Petroleum Industry, North Dakota, Selected Years, 2005 through 2019 ........................................................................................................................ 30

iv
LIST OF FIGURES Figure Page 1 Oil Producing Counties, North Dakota ............................................................................................. 4 2 Crude Oil Production, North Dakota, 1951 through 2020 ............................................................... 5 3 Production and Market Value of Crude Oil, North Dakota, 2000 through 2019 ............................. 5 4 State and Local Government Revenues, Paid Directly by Petroleum Industry, North Dakota, 2005 through 2019 ................................................................................................. 24

v
LIST OF APPENDIX TABLES Appendix Table Page C1 Input-Output Modeling Industry Components, Default IMPLAN Data and Customized Values, Well Development and Oil and Gas Extraction, Petroleum Industry, North Dakota, 2019 ...................................................................................... 85 C2 Input-Output Modeling Industry Components, Default IMPLAN Data and Customized Values, Support Activities, Petroleum Industry, North Dakota, 2019 ................ 86 C3 Input-Output Modeling Industry Components, Estimation of Well Drilling and Oil Field Service Shares for IMPLAN Sector 38, Petroleum Industry, North Dakota, 2019 ......................... 87 C4 Input-Output Modeling Industry Components, Default IMPLAN Data and Customized Values, Well Development and Oil and Gas Extraction, Petroleum Industry, North Dakota, 2017 ...................................................................................... 88 C5 Input-Output Modeling Industry Components, Default IMPLAN Data and Customized Values, Petroleum Industry, Support Activities, North Dakota, 2017 ................ 89 C6 Input-Output Modeling Industry Components, Estimation of Well Drilling and Oil Field Service Shares for IMPLAN Sector 38, Petroleum Industry, North Dakota, 2017 ......................... 90 C7 Input-Output Modeling Industry Components, Default IMPLAN Data and Customized Values, Well Development and Oil and Gas Extraction, Petroleum Industry, North Dakota, 2015 ...................................................................................... 91 C8 Input-Output Modeling Industry Components, Default IMPLAN Data and Customized Values, Support Activities, Petroleum Industry, North Dakota, 2015 ................ 92 C9 Input-Output Modeling Industry Components, Estimation of Well Drilling and Oil Field Service Shares for IMPLAN Sector 38, Petroleum Industry, North Dakota, 2015 ......................... 93 D1 Statewide Private Employment, All Sectors and Direct Employment in Petroleum Industry, North Dakota, 2019 .................................................................................. 99 D2 Statewide Private Employment Wages and Salaries, All Sectors and Direct Employment in Petroleum Industry, North Dakota, 2019 ................................................................................ 100 D3 Statewide Private Employment, All Sectors and Direct Employment in Petroleum Industry, North Dakota, 2018 ................................................................................ 101 D4 Statewide Private Employment Wages and Salaries, All Sectors and Direct Employment in Petroleum Industry, North Dakota, 2018 ................................................................................ 102 D5 Statewide Private Employment, All Sectors and Direct Employment in Petroleum Industry, North Dakota, 2017 ................................................................................ 103

vi
LIST OF APPENDIX TABLES (continued) Appendix Table Page D6 Statewide Private Employment Wages and Salaries, All Sectors and Direct Employment in Petroleum Industry, North Dakota, 2017 ................................................................................ 104 D7 Statewide Private Employment, All Sectors and Direct Employment in Petroleum Industry, North Dakota, 2016 ................................................................................ 105 D8 Statewide Private Employment Wages and Salaries, All Sectors and Direct Employment in Petroleum Industry, North Dakota, 2016 ................................................................................ 106 D9 Statewide Private Employment, All Sectors and Direct Employment in Petroleum Industry, North Dakota, 2015 ................................................................................ 107 D10 Statewide Private Employment Wages and Salaries, All Sectors and Direct Employment in Petroleum Industry, North Dakota, 2015 ................................................................................ 108 D11 Statewide Private Employment, All Sectors and Direct Employment in Petroleum Industry, North Dakota, 2014 ................................................................................ 109 D12 Statewide Private Employment Wages and Salaries, All Sectors and Direct Employment in Petroleum Industry, North Dakota, 2014 ................................................................................ 110 D13 Statewide Private Employment, All Sectors and Direct Employment in Petroleum Industry, North Dakota, 2013 ................................................................................ 111 D14 Statewide Private Employment Wages and Salaries, All Sectors and Direct Employment in Petroleum Industry, North Dakota, 2013 ................................................................................ 112 E1 Employment, Direct, Indirect, and Induced Economic Effects, by Economic Sector, Oil and Gas Development, Petroleum Industry, North Dakota, 2019 ......................................... 114 E2 Employment Compensation, Direct, Indirect, and Induced Economic Effects, by Economic Sector, Oil and Gas Development, Petroleum Industry, North Dakota, 2019 ............................. 114 E3 Gross Business Volume, Direct, Indirect, and Induced Economic Effects, by Economic Sector, Oil and Gas Development, Petroleum Industry, North Dakota, 2019 ............................. 115 E4 Value-added Activity, Direct, Indirect, and Induced Economic Effects, by Economic Sector, Oil and Gas Development, Petroleum Industry, North Dakota, 2019 ............................. 115 E5 Employment, Direct, Indirect, and Induced Economic Effects, by Economic Sector, Oil and Gas Production, Petroleum Industry, North Dakota, 2019 ............................................. 116 E6 Employment Compensation, Direct, Indirect, and Induced Economic Effects, by Economic Sector, Oil and Gas Production, Petroleum Industry, North Dakota, 2019 ................................. 116

vii
LIST OF APPENDIX TABLES (Continued) Appendix Table Page E7 Gross Business Volume, Direct, Indirect, and Induced Economic Effects, by Economic Sector, Oil and Gas Production, Petroleum Industry, North Dakota, 2019 ................................. 117 E8 Value-added Activity, Direct, Indirect, and Induced Economic Effects, by Economic Sector, Oil and Gas Production, Petroleum Industry, North Dakota, 2019 ................................. 117 E9 Employment, Direct, Indirect, and Induced Economic Effects, by Economic Sector, Oil and Gas Processing and Transportation, Petroleum Industry, North Dakota, 2019 .............. 118 E10 Employment Compensation, Direct, Indirect, and Induced Economic Effects, by Economic Sector, Oil and Gas Processing and Transportation, Petroleum Industry, North Dakota, 2019 .................................................................................... 118 E11 Gross Business Volume, Direct, Indirect, and Induced Economic Effects, by Economic Sector, Oil and Gas Processing and Transportation, Petroleum Industry, North Dakota, 2019 .............. 119 E12 Value-added Activity, Direct, Indirect, and Induced Economic Effects, by Economic Sector, Oil and Gas Processing and Transportation, Petroleum Industry, North Dakota, 2019 .............. 119 E13 Employment, Direct, Indirect, and Induced Economic Effects, by Economic Sector, Oil and Gas Development, Petroleum Industry, North Dakota, 2017 ......................................... 120 E14 Employment Compensation, Direct, Indirect, and Induced Economic Effects, by Economic Sector, Oil and Gas Development, Petroleum Industry, North Dakota, 2017...................................................................................................................... 120 E15 Gross Business Volume, Direct, Indirect, and Induced Economic Effects, by Economic Sector, Oil and Gas Development, Petroleum Industry, North Dakota, 2017 ......................................... 121 E16 Value-added Activity, Direct, Indirect, and Induced Economic Effects, by Economic Sector, Oil and Gas Development, Petroleum Industry, North Dakota, 2017 ......................................... 121 E17 Employment, Direct, Indirect, and Induced Economic Effects, by Economic Sector, Oil and Gas Production, Petroleum Industry, North Dakota, 2017 ............................................. 122 E18 Employment Compensation, Direct, Indirect, and Induced Economic Effects, by Economic Sector, Oil and Gas Production, Petroleum Industry, North Dakota, 2017...................................................................................................................... 122 E19 Gross Business Volume, Direct, Indirect, and Induced Economic Effects, by Economic Sector, Oil and Gas Production, Petroleum Industry, North Dakota, 2017 ............................................. 123 E20 Value-added Activity, Direct, Indirect, and Induced Economic Effects, by Economic Sector, Oil and Gas Production, Petroleum Industry, North Dakota, 2017 ............................................. 123

viii
LIST OF APPENDIX TABLES (continued) Appendix Table Page E21 Employment, Direct, Indirect, and Induced Economic Effects, by Economic Sector, Oil and Gas Processing and Transportation, Petroleum Industry, North Dakota, 2017 ................................. 124 E22 Employment Compensation, Direct, Indirect, and Induced Economic Effects, by Economic Sector, Oil and Gas Processing and Transportation, Petroleum Industry, North Dakota, 2017...................................................................................................................... 124 E23 Gross Business Volume, Direct, Indirect, and Induced Economic Effects, by Economic Sector, Oil and Gas Processing and Transportation, Petroleum Industry, North Dakota, 2017 ...................................................................................................... 125 E24 Value-added Activity, Direct, Indirect, and Induced Economic Effects, by Economic Sector, Oil and Gas Processing and Transportation, Petroleum Industry, North Dakota, 2017 ...................................................................................................... 125
LIST OF APPENDIX FIGURES Appendix Figure Page B1 General Transposition of Financial Information into IMPLAN Economic Sector Profiles .............. 69 B2 Economic Sector Organization and Use with IMPLAN ................................................................... 71 E1 Gross Business Volume, Indirect and Induced Activity, by 2-digit NAICS, North Dakota, 2019 .. 126 E2 Employment, Indirect and Induced Activity, by 2-digit NAICS, North Dakota, 2019 ................... 126
ix
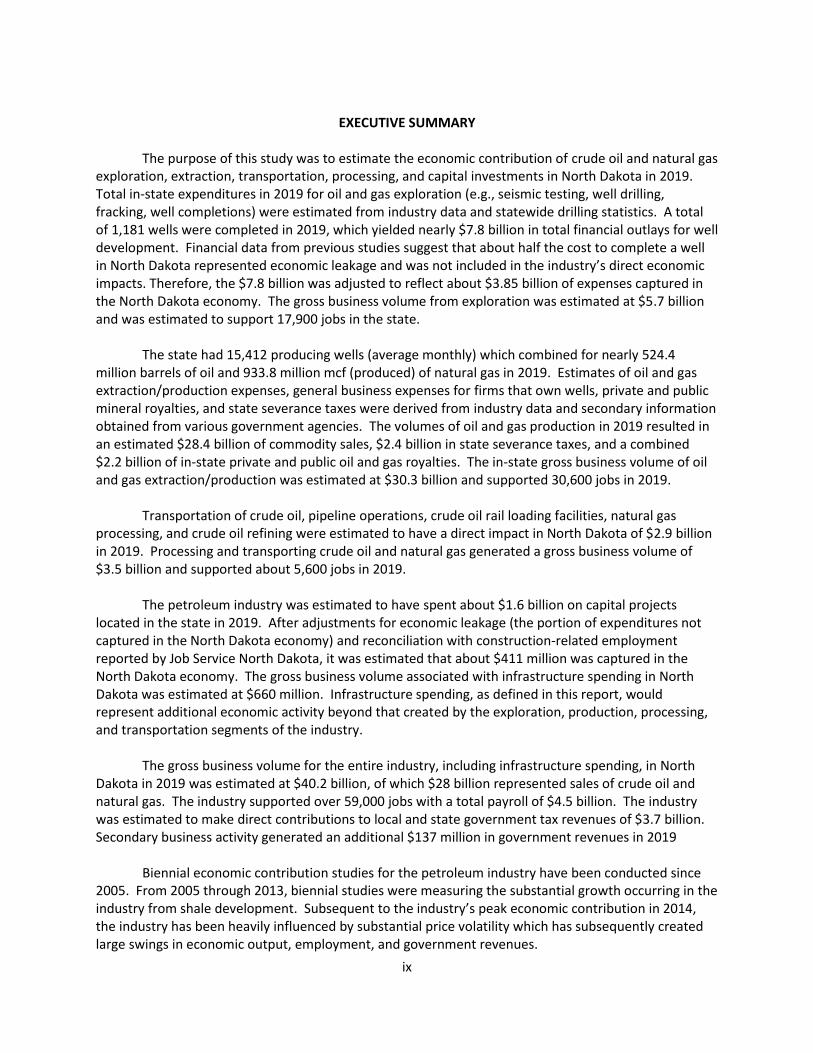
EXECUTIVE SUMMARY The purpose of this study was to estimate the economic contribution of crude oil and natural gas exploration, extraction, transportation, processing, and capital investments in North Dakota in 2019. Total in-state expenditures in 2019 for oil and gas exploration (e.g., seismic testing, well drilling, fracking, well completions) were estimated from industry data and statewide drilling statistics. A total of 1,181 wells were completed in 2019, which yielded nearly $7.8 billion in total financial outlays for well development. Financial data from previous studies suggest that about half the cost to complete a well in North Dakota represented economic leakage and was not included in the industry’s direct economic impacts. Therefore, the $7.8 billion was adjusted to reflect about $3.85 billion of expenses captured in the North Dakota economy. The gross business volume from exploration was estimated at $5.7 billion and was estimated to support 17,900 jobs in the state. The state had 15,412 producing wells (average monthly) which combined for nearly 524.4 million barrels of oil and 933.8 million mcf (produced) of natural gas in 2019. Estimates of oil and gas extraction/production expenses, general business expenses for firms that own wells, private and public mineral royalties, and state severance taxes were derived from industry data and secondary information obtained from various government agencies. The volumes of oil and gas production in 2019 resulted in an estimated $28.4 billion of commodity sales, $2.4 billion in state severance taxes, and a combined $2.2 billion of in-state private and public oil and gas royalties. The in-state gross business volume of oil and gas extraction/production was estimated at $30.3 billion and supported 30,600 jobs in 2019. Transportation of crude oil, pipeline operations, crude oil rail loading facilities, natural gas processing, and crude oil refining were estimated to have a direct impact in North Dakota of $2.9 billion in 2019. Processing and transporting crude oil and natural gas generated a gross business volume of $3.5 billion and supported about 5,600 jobs in 2019. The petroleum industry was estimated to have spent about $1.6 billion on capital projects located in the state in 2019. After adjustments for economic leakage (the portion of expenditures not captured in the North Dakota economy) and reconciliation with construction-related employment reported by Job Service North Dakota, it was estimated that about $411 million was captured in the North Dakota economy. The gross business volume associated with infrastructure spending in North Dakota was estimated at $660 million. Infrastructure spending, as defined in this report, would represent additional economic activity beyond that created by the exploration, production, processing, and transportation segments of the industry. The gross business volume for the entire industry, including infrastructure spending, in North Dakota in 2019 was estimated at $40.2 billion, of which $28 billion represented sales of crude oil and natural gas. The industry supported over 59,000 jobs with a total payroll of $4.5 billion. The industry was estimated to make direct contributions to local and state government tax revenues of $3.7 billion. Secondary business activity generated an additional $137 million in government revenues in 2019 Biennial economic contribution studies for the petroleum industry have been conducted since 2005. From 2005 through 2013, biennial studies were measuring the substantial growth occurring in the industry from shale development. Subsequent to the industry’s peak economic contribution in 2014, the industry has been heavily influenced by substantial price volatility which has subsequently created large swings in economic output, employment, and government revenues.

PETROLEUM INDUSTRY’S ECONOMIC CONTRIBUTION TO NORTH DAKOTA IN 2019
Dean A. Bangsund and Nancy M. Hodur*
INTRODUCTION
North Dakota’s largest basic sector industries, which include agriculture, manufacturing, and energy, provide much of the economic stimuli for the state’s economy. These large industries are generally comprised of distinct sectors or economic groups. For example, agriculture in North Dakota often is considered a combination of crop production and livestock. The energy industry in North Dakota also is comprised of several distinct sectors that are commonly treated as separate activities. North Dakota’s energy industries can be conveniently separated into the activities that produce and distribute electricity, coal, petroleum, and renewable fuels. While separating the energy industry into similar activities is relatively straight forward, identifying the economic players within those sectors is less clear. In the case of electricity generation, a handful of firms and generating facilities exist within the state. The same situation exists with coal production – a handful of companies operate at a limited number of locations. However, the industrial organization associated with oil and natural gas production is different. Rather than having a handful of firms and a limited number of site-specific facilities and locations, the petroleum industry involves hundreds of firms and a multitude of facilities spread throughout the western third of North Dakota. North Dakota has been a top 10 oil-producing state for over a decade. To those familiar with North Dakota’s economy, the petroleum sector has always been an important part of the state’s economic base. Recent upswings in oil production became prevalent in the 2000s. In 2006 during the beginning of the latest expansion of oil field development, the first comprehensive economic assessment of the petroleum industry in the state was conducted (Bangsund and Leistritz 2007). Another assessment was conducted two years later (Bangsund and Leistritz 2009). From 2006 through 2015, North Dakota witnessed an unprecedented increase in oil production. Production dropped in the latter half of 2015 and through 2016, but increased in 2017 and 2018. While North Dakota has recently been recording state records for monthly oil production, the state remains second in oil production behind Texas (U.S. Department of Energy 2020). The expansion of oil development associated with shale formations that started in the mid-2000s has continued to garner local, state, and national headlines. The rapid development of the oil patch in North Dakota is no longer a local phenomenon visible to only those working in the industry or living in western North Dakota. The economic value of the rapidly expanding petroleum industry is difficult to follow as the industry has grown and expanded beyond historical precedents. The state was beginning to adjust to a continually-expanding petroleum sector when a price collapse at the end of 2014 caused a substantial roll back in shale oil development, and substantially impacted employment, personal income, and government revenues. This assessment is the third effort to examine the economic footprint of the industry since the 2014 price collapse.
*Research scientist, Department of Agribusiness and Applied Economics and Director, Center for Social
Research, respectively, North Dakota State University, Fargo.

2
Determining the economic contribution of a given industry quantifies its importance to state and local economies. Not only can the economic contribution to the state and local economies be measured, but the effects on specific economic sectors and related industries also can be identified. In addition, economic studies can demonstrate the susceptibility of the North Dakota economy to fluctuations in factors affecting petroleum development and production, demonstrate the economic dependence of the state on natural resource-based industries, and indicate the economic consequences that could result from potential changes in policies which affect the petroleum industry.
OBJECTIVES The purpose of this report is to estimate the economic contribution (direct and secondary effects) of the petroleum industry to the economy of North Dakota. Specific objectives include 1) estimate the economic size of petroleum exploration, extraction, and processing sectors, 2) estimate in-state spending on petroleum industry infrastructure, and 3) provide estimates of industry-wide employment, tax revenues, and other key economic
measures.
BACKGROUND The industrial organization of the petroleum industry in the United States often is divided into upstream and downstream components. The upstream components of the petroleum industry generally include exploration, development, and production of crude oil and natural gas. The downstream components include transportation, processing, distribution, marketing, and retail delivery of petroleum products.
Industry Organization The petroleum industry in North Dakota consists of both upstream and downstream components. For this study, the petroleum industry was defined to only include in-state exploration, extraction/production, transportation, and processing of crude oil and natural gas. Exploration can be generally thought of as the process of finding mineral resources. Extraction or production is the process of developing and recovering mineral resources. Transportation components of the industry, in this study, were limited to the movement of oil and gas from wells to collection points, and then on to processing facilities located either in-state or out-of-state. Petroleum processing in North Dakota included refining of crude oil and natural gas processing. The distribution, marketing, and retail sale of processed petroleum products (e.g., diesel, gasoline, kerosene, motor oil, lubricants, propane, natural gas) were not included. The exploration and extraction phases of the petroleum industry are not organized like other industries in the state. Firms that own producing wells (oil operators) contract much of the work of exploration and extraction of oil and gas to other firms that specialize in various aspects of those processes. As a result, much of the expenditures incurred in the state for oil and gas production start with the oil operator but flow through the various firms engaged in providing support and service within

3
the oil fields. While oil operators represent a mix of small to large firms, a majority of the prominent oil operators in North Dakota also have operations in other states. For many oil operators, their operations in North Dakota do not represent the majority of their oil and gas revenues. As a result of having operations and/or headquarters in other states, net revenues from North Dakota oil and gas production may leave the state for a variety of reasons. However, North Dakota is still the beneficiary of exploration and discovery expenses from firms that may have minimal operations in the state. Oil and gas wells typically have three types of economic interests. These players are often referred to as royalty interests, owner/operator interests, and working interests. Royalty interests receive a share of the value of a well’s output but do not share in the expenses associated with the well. Owner and working interests share, based on various percentages or arrangements, the remaining revenues and all of the expenses of a well. The well owner or operator is generally responsible or in charge of all operations. The owner arranges to have work completed for most of the necessary activities associated with the well, and charges working interests for their share of the expenses. As a result of these typical arrangements, the total number of firms receiving revenues and incurring expenses from oil and gas wells in North Dakota is unknown. However, the number of oil operators (firms that own or operate wells) is known. For various reasons, the magnitude of economic effects of oil and gas production are not necessarily equivalent to the market value (i.e., price times quantity) of oil and gas produced. Exploration and extraction technologies use specialized inputs and services, many of which are not available in North Dakota and must be purchased from out-of-state sources. Many oil operators have operations and/or are headquartered in other states, and revenues for some firms may leave the state to be used for projects elsewhere. The same situation may exist where firms use resources obtained from out-of-state operations for oil and gas exploration in the state. In addition, oil operators headquartered out-of-state often have minimal general business expenses in the state. Similarly, firms that only have working interests in producing wells may or may not have physical operations in the state. All of these factors make it problematic to base economic importance of the petroleum industry solely on the value of oil and gas production.
Production Statistics Oil and gas production is limited to the western third of North Dakota (Figure 1). While crude oil has been produced in 19 western counties, 17 counties are currently producing crude oil (North Dakota Department of Mineral Resources 2020). Of the 17 counties producing oil, production is concentrated in Billings, Dunn, Bowman, McKenzie, Mountrail and Williams counties (North Dakota Department of Mineral Resources 2020). Production in key counties has fluctuated over the past 50 years as new oil deposits are found and developed in various locations in the state. Since 2002, major increases in oil production have occurred in Bowman, McKenzie, Dunn, and Mountrail counties.

4
Figure 1. Oil Producing Counties, North Dakota Oil production in North Dakota has fluctuated substantially since commercial production began in the early 1950s (Figure 2). Overall, there have been four periods of rapid growth in oil production in North Dakota. The first period was from 1951 through 1962, the second period occurred from 1974 to 1984, the third period from 1994 to 1997, and the current period which began in 2003. After historic highs in 1984, overall oil production in the state declined rapidly for 10 years. More recently, changes in crude oil production have been created by the price collapse in late 2014 and the covid-19 pandemic of 2020. The annual value of oil production in North Dakota was estimated using monthly average price and production data from the North Dakota Department of Mineral Resources (2020). The overall value of oil production in North Dakota, in nominal terms, has generally paralleled oil production despite price fluctuations over time (Figure 3). Nominal oil prices were converted to real dollars (2020) using the Gross Domestic Product-Implicit Price Deflator (U.S. Bureau of Economic Analysis 2020).
BIL
LIN
GS
BOTTINEAU
BOWMAN
BURKEDIVIDE
DUNN
MCHENRY
MCKENZIEMCLEAN
MERCER
MOUNTRAIL
RE
NV
ILL
E
SLOPE
STARK
WARD
WILLIAMS
VA
LL
EY
GO
LD
EN

5
6
PROCEDURES An economic contribution analysis, as defined in this study, represents an estimate of all relevant in-state expenditures and returns associated with an industry. The economic contribution approach to estimating economic activity has been used for several other industries in North Dakota (Bangsund and Hodur 2017, 2019a, 2019b, 2020, 2021; Coon et al. 2012).
Data Collection Previous studies from 2005 through 2015 used an expenditure-based approach, almost entirely driven by survey data, combined with the ND Input-Output Model to estimate statewide economic effects. A switch from the ND Input-Output Model to the IMPLAN modeling system occurred after the 2015 study. Survey questionnaires have been adjusted slightly to align more closely with the new Input-Output (I-O) modeling platform. A sample of firms active in the petroleum industry in North Dakota were asked to provide estimates of the amount of expenditures made to entities (i.e., individuals, firms, and governments) in North Dakota. Oil operators (i.e., firms owning oil wells) represented one segment of the industry. Firms involved with natural gas collection and processing represented another segment of the industry. Finally, firms involved with rail loading and pipeline operations were surveyed. Oil Operators and Oil Field Development Firms that own or operate oil wells in the state were surveyed to obtain information on expenses for oil and gas exploration, oil and gas extraction/production, general business expenses in the state, employment, physical measures of oil and gas production, and leasing and drilling activity (Appendix A). The North Dakota Petroleum Council provided contact information for those firms. The survey process started with sending cover letters and a questionnaire to each firm on the mailing list. A second mailing was conducted for all firms that had not responded1 to the first mailing. Processors and Transportation Another survey was conducted for firms engaged in pipeline transportation of crude oil and unprocessed natural gas produced in North Dakota, firms operating crude oil rail loading facilities, and firms involved with processing of crude oil and natural gas in North Dakota. The survey was used to obtain estimates of the amount and type of expenditures made in North Dakota and in-state employment by those firms (Appendix A).
1Firms with non-deliverable addresses, those who responded with completed questionnaires, and those who indicated they would not or could not participate were excluded from the second mailing.

7
IMPLAN Industry Profiles In previous studies, survey data combined with other publicly available statistics were used to set the level and distribution of spending by the industry. These estimates were based on relating various expenditures to levels of production (e.g., utilities expense per barrel of oil equivalent2 (BOE) produced) to estimate direct impacts. In previous studies, expenditures (and other cash outlays such as royalty payments) represented the direct impacts for the contribution analysis. Those expenditures were considered analogous to sales in the affected economic sectors. IMPLAN treats industry sales (e.g., value of crude oil sold) as the direct or first-round impacts for most economic contribution analyses. This differs from previous methodologies as only in-state expenditures and other selected revenue streams were treated as sales, and those sales were not within the petroleum sector but rather allocated to other sectors affected by petroleum industry spending (e.g., communications, transportation, manufacturing). IMPLAN starts with sales or output for an economic sector, and uses several financial categories based on different classifications and economic requirements (Appendix B, Appendix Figure B1) to distinguish expenditures, payroll, taxes, and income. Expenditures for goods and services used to produce a product or service within IMPLAN are called ‘intermediate inputs’ and are treated as a function of sales. To arrive at IMPLAN’s baseline data, a number of econometric techniques are used to estimate industry expenditures within a given economic sector and also the percentage of those expenditures supplied by local vendors (i.e., other economic sectors). Those values also are treated within the model as a percentage of sales. IMPLAN arrives at an estimate of industry expenditures supplied by local sources within a given economic area (Appendix B, Appendix Figure B2), which was also the goal of methodologies used in previous petroleum industry economic contribution studies in North Dakota. Data used for economic contribution studies involving IMPLAN can be supplied by outside sources or rely on default data supplied by IMPLAN. However, some underlying data, such as trade flows, are not adjustable within the IMPLAN I-O matrix. The key sectors within IMPLAN relating to the petroleum industry were re-constructed since baseline data greatly underestimated the economic size of the industry. Appendix C contains information on the reconstruction of IMPLAN sectors associated with oil and gas exploration, development, and production for 2015, 2017, and 2019.
Input-Output Analysis Economic activity from a project, program, policy, or activity can be categorized into direct and secondary impacts. Direct impacts are those changes in output, employment, or income that represent the initial or first-round effects of the project, program, policy, or activity. Secondary impacts (often categorized into indirect and induced effects) result from subsequent rounds of spending and respending within the economy (Appendix B contains a more detail discussion). Indirect economic effects arise from the additional consumption of goods and services triggered by
2Barrel of oil equivalent places oil and gas production on a common basis, and is estimated by dividing mcf of natural gas by 6 and adding barrels of oil.

8
businesses that supply inputs to firms in a given sector/industry. Indirect effects can be interpreted as the additional economic activity created through purchases of goods and services by businesses. Induced economic effects arise from the spending by households from changes in personal income associated with direct effects and indirect effects. Changes in personal income can come from payrolls of businesses that are directly impacted, changes in payrolls from businesses that supply goods and services to an impacted sector (induced effects), and proprietor income resulting from a change in sales volume of businesses that represent sole proprietorships. Induced effects measure the additional business activity that is triggered as changes in household income are translated into the purchase of goods and services for personal consumption.
I-O analysis is an accepted methodology to examine how initial changes in employment, income, and/or business activity translate into additional or subsequent rounds of economic output within a given economic unit. Economic units often represent individual economic sectors, groups of sectors that constitute industries, or an entire economy. I-O models require an underlying database to calibrate the linkages among economic sectors, households, and governments. This study used the IMPLAN modeling system based on its proprietary data set and I-O methodologies. [See Appendix B for more discussion of the IMPLAN model].

9
KEY ECONOMIC METRICS A number of key economic metrics have been developed in previous studies that help articulate the economic output of the industry. The estimation of those metrics was continued in this study even though not all that information is directly used in the IMPLAN modeling system. The values reported in this section were used as direct effects in previous assessments. However, the values were used to re-construct the oil and gas sectors in the IMPLAN modeling system as part of the industry profiles, and were not necessarily considered a direct effect as used in previous assessments. Exploration and Development Estimates of total 2019 in-state expenditures for exploration were derived from the survey of oil operators and used with drilling statistics from the North Dakota Department of Mineral Resources (2020). Gross expenditures for exploration, drilling, and well completion were estimated at about $6.6 million per well drilled in North Dakota in 2019. The petroleum industry completed 1,181 new wells in North Dakota in 2019, yielding about $7.8 billion in total financial outlays for well development. Financial data on expenses for well development from Bangsund and Hodur (2015, 2017) were used to adjust for in-state spending. Considering the rapid expansion of well drilling, and the volume of economic activity, adjustments to the capital costs to drill and complete a well were performed to reflect specific inputs only supplied by in-state sources. Examples of well development expenses that were determined to be primarily supplied by out-of-state firms included drill bits, well casing, well head equipment, conductor pipe, fuel, cement, packers, christmas tree, sucker rod, heater/treater, fracture materials, and emissions control. Removing input expenses supplied primarily by out-of-state sources revealed that about 48 percent of the capital cost to complete a well came from in-state sources. Therefore, the $6.6 million completion cost per well in North Dakota in 2019 was adjusted to reflect about $3.3 million of expenses captured in the North Dakota economy (Table 1). Lease bonuses retained or paid to in-state entities were estimated at $38 million in 2019, which included $10.6 million for state leases and about $27 million for private mineral leases. Net federal lease bonuses, reported by the Office of Natural Resource Revenues, were -$255,000. Disbursements of lease bonuses from tribal lands back to North Dakota are not reported; however, tribal lease bonuses are contained within “gross” estimates of lease bonuses on Federal lands reported by the Office of Natural Resource Revenue, U.S. Department of the Interior.

10
Table 1. Selected Statistics and Economic Metrics, Petroleum Industry, North Dakota, 2017 and 2019 2017 2019
Number of wells drilled and completed 1,039 1,181
Cost per well completed (000s nominal $)a 6,601 6,601
In-state expenditures per completed well (000s nominal $) 3,285 3,285
Lease bonuses (000s nominal $)
Net federal and state 4,505 10,610
Privateb 13,472 27,590
Crude oil (000s barrels)c 465,030 524,432
Natural gas produced (mmcf)c 688,771 933,850
Natural gas sold (mmcf)c 568,790 787,750
Crude oil and natural gas produced (000s Barrel of Oil
Equivalents) 509,622 680,074
Number of operating/active wells (monthly average)c 13,951 15,412
Number of wells completedc 1,039 1,181
Crude oil price (first purchaser prices nominal $ per bbl)d $45.67 $50.91
Natural gas price (nominal $ per mcf)c $2.54 $2.12
Crude oil sales (millions nominal $) 18,034 26,699
Natural gas sales (millions nominal $) 1,445 1,701
Oil and gas combined (millions nominal $) 19,478 28,400
Oil royalty ratee 18.26%
Gas royalty ratee 18.17%
Royalties (millions nominal $)
Net federal, state, and Tribal 649.2 830.6
Private
Total 2,490.2 3,622.5
In-state 938.8 1,367.7
All net public and private royalties 1,588.0 2,206.2
Severance taxes (millions nominal $)d 1,637.7 2,418.8 Mmcf = 1,000,000 cubic feet. Mcf = 1,000 cubic feet. aWell costs in 2019 obtained from 2017 survey data. bPrivate lease bonuses represented only payments to in-state mineral owners. cND Department of Mineral Resources (2020). dND Office of State Tax Commissioner (2020b). eData obtained from industry surveys.
Oil and Gas Production Estimates of total in-state expenditures in 2019 for extraction/production and general business expenses were derived from the survey of oil operators and estimated on a BOE basis. Data obtained from the survey of oil operators for general business expenses and oil and gas production expenses were specific to expenses paid to entities within North Dakota.

11
North Dakota produced 524.4 million barrels of oil and 933.8 million MCF of natural gas in 2019 (Table 1) (North Dakota Department of Mineral Resources 2020). State oil and gas royalties were about $264 million (net of severance taxes) (North Dakota Department of Trust Lands 2020). Federal royalties returned to North Dakota were about $566 million (net of severance taxes), which includes tribal royalties (Office of Natural Resources Revenue 2020). Separate estimates of tribal royalties are not published by the Office of Natural Resources Revenue. Private royalties were based on production data obtained from industry surveys and information on the distribution of in-state and out-of-state mineral payments. Overall royalty percentages used in this study were 18.26 percent and 18.17 percent of well output for oil and gas, respectively (Table 1). The total value of oil and gas production was estimated at $28.4 billion using data obtained from the North Dakota Department of Mineral Resources (2020) and the North Dakota Office of State Tax Commissioner (2020b) (Table 1). Total royalties were estimated by applying the industry-wide oil and gas royalty percentages to the gross sales value of crude oil and estimated sales value of natural gas. Private royalties were estimated by subtracting state and gross federal royalties from estimated total royalties. Gross private royalties (i.e., both in-state and out-of-state mineral owners) from oil and gas production in North Dakota in 2019 were estimated to be $3.6 billion. In-state payments of private royalties were estimated by applying the percentage of in-state versus out-of-state mineral owners’ royalty payments (37.7 percent) to the estimated total private royalties ($3.6 billion). The in-state percentage of mineral ownership (37.7%) was estimated from private royalty payments made by oil operators in the state. The survey of oil operators provided information on total private mineral payments from North Dakota wells (includes both mineral owners who reside in the state and those that live elsewhere) and total private in-state mineral payments from North Dakota wells (only private mineral payments going to North Dakota mailing addresses). In-state private royalties in 2019 were estimated at $1.4 billion (without adjustments for severance taxes) or about $1.3 billion net of severance taxes (severance taxes were included as a separate component of direct impacts and subtracted from private in-state mineral royalty payments). Total collections from the gross production tax and extraction tax in calendar year 2019 were about $1.26 billion and $1.16 billion, respectively (North Dakota Office of State Tax Commissioner 2020a). Those tax collections were included in the extraction/production segment of the petroleum industry. Processing and Transportation Direct impacts included $780 million in transportation expenses paid to in-state entities by oil operators. Processing activities, which included pipeline transportation of unprocessed natural gas and crude oil, natural gas processing, crude oil rail loading, and crude oil refining were estimated to have in-state expenditures of $2.89 billion (see Table 9). One-time spending for infrastructure by processors was included in processing expenditures prior to the 2011 industry assessments; however, infrastructure spending has been estimated separately since the 2011 assessment. Processors were directed to omit any infrastructure spending in their operational expenditures (Appendix A). To avoid double counting of potential economic effects, in-state purchases of crude oil and unprocessed natural gas by processors were excluded in the study.

12
Government Revenues Some of the most closely monitored measures of the petroleum industry are estimates of government revenues. Government revenues attributable to the petroleum industry stem from collections of property, sales and use, personal income, and corporate income taxes. Other direct revenue sources include royalties on oil and gas production and lease bonus payments. The largest single source of government revenue from the petroleum industry in the state has been severance taxes. Total government revenues paid directly by the industry to governments in North Dakota was estimated at $3.69 billion, of which severance taxes comprised $2.42 billion or 66 percent of the total (Table 2). An additional $137 million in tax revenues were estimated from indirect and induced economic effects. Total government revenues attributable to the oil and gas industry in 2019 were estimated to be $3.8 billion.
Table 2. Comparison of Economic Estimates, Government Revenues, Petroleum Industry, North Dakota, 2017 and 2019 Category 2017 2019
Included in Direct Effects
Sales and Use, Property, and Income Taxes 271.3 299.2
Royaltiesa 649,194 830,635
Severance Taxes 1,637,742 2,418,791
Lease Bonuses (net federal and state) 4,597 10,610
Licenses, Fees, Permits, Donations, and Undetermined Taxes
131.1 129.9
Totals 2,422,877 3,688,456
Estimated from Secondary Effects
Sales and Use 50,420.0 49,033.0
Personal Income 16,026.8 13,559.4
Other taxes (IMPLAN analysis) 68,975.8 74,312.8
Direct and Secondary Generation Total 2,881,500 3,825,361 aNet federal and state royalties from oil and gas production, and royalties from processing activities
returned to North Dakota from federal mineral ownership.

13
ECONOMIC CONTRIBUTION The economic contribution of the petroleum industry was primarily based on estimates of total sales, gross and net (in-state) expenditures, government taxes, and payroll for exploration, extraction, transportation, and processing of crude oil and natural gas. In-state expenditures, oil and gas royalties, state severance taxes, and lease bonuses were included in the development of economic profiles of various sectors of the IMPLAN modeling system.
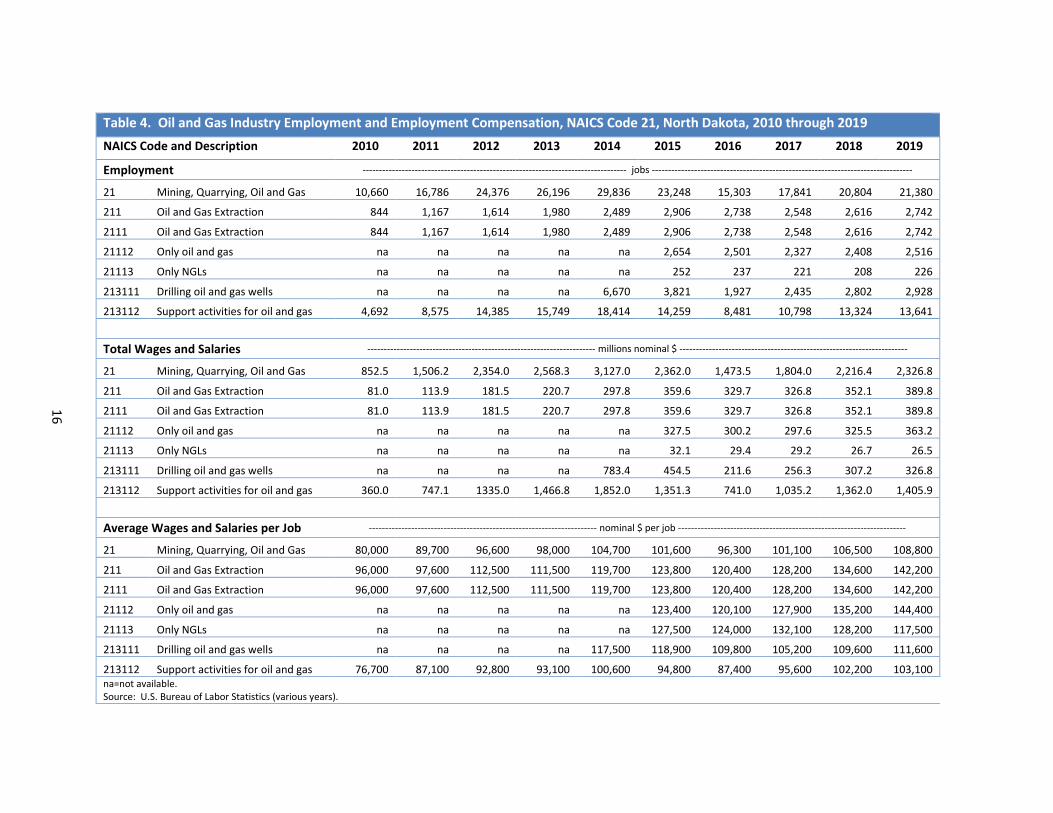
Employment The petroleum industry is responsible for creating and supporting a variety of jobs. Those jobs are traditionally divided into direct and secondary employment when measuring the economic contribution of industries. Direct employment is a term used to describe jobs that are considered to be an integral part of an industry. For example, workers operating an oil drilling rig would represent direct employment in the petroleum industry. Similarly, someone who works at a natural gas processing plant or crude oil refinery would be considered direct employment in the petroleum industry. Secondary employment represents employment supported by economic output using two different economic mechanisms. Indirect employment represents the employment supported through the business purchases of goods and services. An oil drilling firm contracting with a construction firm to build a road and drilling pad would be an example of indirect employment. Induced employment represents jobs that are supported by the purchase of goods and services by households. The jobs supported by the purchase of goods and services for personal consumption by employees of the drilling firm and those employees supported in the construction firm would constitute induced employment. From 2013 through 2016, Job Service North Dakota conducted a special annual assessment to measure the number of private jobs in the petroleum industry using the Quarterly Census of Employment and Wages (QCEW) program (Table 4) (Job Service North Dakota 2014, 2015, 2016, 2017) (see Appendix D for detailed Job Service North Dakota data and additional discussion of Job Service North Dakota methodologies). The Job Service North Dakota study of petroleum industry employment was discontinued in 2017. Using recent NAICS code data and relating those values to past relationships in the Job Service North Dakota studies and using other economic metrics, estimates of employment in the industry were produced that match the organization and descriptions used in the 2013 through 2016 Job Service North Dakota reports (Appendix D). The U.S. Bureau of Labor Statistics (BLS) collects data from state agencies responsible for implementation of the QCEW. The BLS reporting of the employment within NAICS code 21 contains key divisions between oil and gas development and oil and gas production (Table 4). Employment in NAICS code 213 is often reported as a total for that sector. However, that sector includes jobs that support oil and gas development (drilling and fracking) and oil and gas production. The split in labor between those two groups was used in the development of the IMPLAN industry profiles, and has only recently been made available by the BLS (U.S. Bureau of Labor Statistics 2020) (see Appendix C for development of IMPLAN industry profiles and the approximate split in oil field services between oil and gas production and oil field development).

14
Statewide, 10.3 percent of all private sector jobs covered by unemployment insurance were directly employed in the oil and gas industry in 2019 (Table 5). Including all secondary employment, the oil and gas industry supported 59,100 jobs in 2019 equating to 16 percent, respectively, of all private sector jobs covered by unemployment insurance (Table 5). Direct employment in the industry was estimated to have a payroll of $3.6 billion which represented 18.7 percent of the state’s total private QCEW employment compensation. Including indirect and induced employment, total private wages and salaries supported by the petroleum industry were nearly $4.5 billion in 2019, equating to 23.2 percent of all private sector wages and salaries (Table 6).

15
Table 3. Estimates of Industry Employment, Selected NAICS Codes and Job Service North Dakota Analysis, Petroleum Industry, North Dakota, 2003 through 2019
Categories Employment in Petroleum Industrya,b
2019 2018 2017 2016 2015 2014 2013 2012 2011 2010 2009 2008 2007 2006 2005 2004 2003
------------------------------------------------------------------------------------------------------- jobs -------------------------------------------------------------------------------------------------------
Statewide NAICS code 211 2,742 2,616 2,548 2,738 2,906 2,489 1,980 1,614 1,167 844 704 544 432 427 474 445 443
Statewide NAICS code 213 16,598 16,158 13,263 10,437 18,111 25,115 22,032 20,627 13,759 8,119 4,608 4,651 3,103 2,688 2,090 1,605 1,334
Total 19,340 18,774 15,811 14,215 21,017 27,604 24,012 22,241 14,926 8,963 5,312 5,195 3,535 3,115 2,564 2,050 1,777
Oil & Gas Drilling, Extraction, Production, & Refining
19,532 19,178 16,150 13,516 21,348 27,865 24,254 na
Infrastructure Development
5,442 5,675 5,767 6,521 7,978 10,983 9,541
Professional Services 2,950 2,983 2,869 2,847 4,891 6,277 5,055
Transportation 4,819 4,609 4,446 4,393 8,540 11,331 10,173
Wholesale Trade and Manufacturing
3,567 3,505 3,440 3,541 5,613 6,486 6,114
Total 36,311 35,949 32,672 30,818 48,369 62,942 55,137
na=not available. NAICS 211—Oil and gas extraction activities. NAICS 213—Providing support services, on a contract or fee basis, for the mining and quarrying of minerals and for the extraction of oil and gas. a Petroleum sector defined to include exploration, production, processing, and transportation of crude oil and unprocessed natural gas. Does not include distribution from processors to retail markets or sale of
petroleum products in retail outlets. Employment estimates do not include sole proprietors or self-employed individuals not contributing to unemployment insurance. b All Data for 2003 through 2016 obtained from Job Service North Dakota. NAICs code 211 and 213 for 2017 and 2018 obtained from Job Service North Dakota; however, other employment categories for 2017
and 2018 were estimated from NAICS data and previous Job Service North Dakota reports. NAICS code 213 contains roughly 35 or fewer jobs, per year, that support mining industries other than oil and gas production. Sources: Job Service North Dakota (various years), North Dakota Job Service (2017, 2016, 2015, 2014).
16
Table 4. Oil and Gas Industry Employment and Employment Compensation, NAICS Code 21, North Dakota, 2010 through 2019
NAICS Code and Description 2010 2011 2012 2013 2014 2015 2016 2017 2018 2019
Employment --------------------------------------------------------------------------------- jobs --------------------------------------------------------------------------------
21 Mining, Quarrying, Oil and Gas 10,660 16,786 24,376 26,196 29,836 23,248 15,303 17,841 20,804 21,380
211 Oil and Gas Extraction 844 1,167 1,614 1,980 2,489 2,906 2,738 2,548 2,616 2,742
2111 Oil and Gas Extraction 844 1,167 1,614 1,980 2,489 2,906 2,738 2,548 2,616 2,742
21112 Only oil and gas na na na na na 2,654 2,501 2,327 2,408 2,516
21113 Only NGLs na na na na na 252 237 221 208 226
213111 Drilling oil and gas wells na na na na 6,670 3,821 1,927 2,435 2,802 2,928
213112 Support activities for oil and gas 4,692 8,575 14,385 15,749 18,414 14,259 8,481 10,798 13,324 13,641
Total Wages and Salaries ---------------------------------------------------------------------- millions nominal $ ----------------------------------------------------------------------
21 Mining, Quarrying, Oil and Gas 852.5 1,506.2 2,354.0 2,568.3 3,127.0 2,362.0 1,473.5 1,804.0 2,216.4 2,326.8
211 Oil and Gas Extraction 81.0 113.9 181.5 220.7 297.8 359.6 329.7 326.8 352.1 389.8
2111 Oil and Gas Extraction 81.0 113.9 181.5 220.7 297.8 359.6 329.7 326.8 352.1 389.8
21112 Only oil and gas na na na na na 327.5 300.2 297.6 325.5 363.2
21113 Only NGLs na na na na na 32.1 29.4 29.2 26.7 26.5
213111 Drilling oil and gas wells na na na na 783.4 454.5 211.6 256.3 307.2 326.8
213112 Support activities for oil and gas 360.0 747.1 1335.0 1,466.8 1,852.0 1,351.3 741.0 1,035.2 1,362.0 1,405.9
Average Wages and Salaries per Job ---------------------------------------------------------------------- nominal $ per job ----------------------------------------------------------------------
21 Mining, Quarrying, Oil and Gas 80,000 89,700 96,600 98,000 104,700 101,600 96,300 101,100 106,500 108,800
211 Oil and Gas Extraction 96,000 97,600 112,500 111,500 119,700 123,800 120,400 128,200 134,600 142,200
2111 Oil and Gas Extraction 96,000 97,600 112,500 111,500 119,700 123,800 120,400 128,200 134,600 142,200
21112 Only oil and gas na na na na na 123,400 120,100 127,900 135,200 144,400
21113 Only NGLs na na na na na 127,500 124,000 132,100 128,200 117,500
213111 Drilling oil and gas wells na na na na 117,500 118,900 109,800 105,200 109,600 111,600
213112 Support activities for oil and gas 76,700 87,100 92,800 93,100 100,600 94,800 87,400 95,600 102,200 103,100 na=not available. Source: U.S. Bureau of Labor Statistics (various years).

17
Table 5. Employment, Direct and Secondary Economic Activity, Petroleum Industry, North Dakota, 2011 through 2019
Year
Private Employment (Quarterly Census of Employment and Wages)
Statewidea
Direct Jobs Indirect and Induced Jobs Direct, Indirect, and
Induced Jobs
Oil and Gasb Share of
State Oil and Gas Share of
State Oil and Gas Share of
State
2011 312,525 40,856 13.1% 18,703 6.0% 59,559 19.1%
2012c 344,543 50,074 14.5% 22,443 6.5% 72,000 20.9%
2013 359,415 55,137 15.3% 26,270 7.3% 81,407 22.6%
2014c 376,068 62,941 16.7% 28,324 7.5% 91,266 24.3%
2015 367,157 48,372 13.2% 23,984 6.5% 72,353 19.7%
2016c 345,731 30,818 8.9% 16,341 4.7% 47,159 13.6%
2017 343,191 32,672 9.5% 18,756 5.5% 51,427 15.0%
2018c 346,456 35,710 10.3% 19,460 5.6% 55,410 16.0%
2019 351,470 36,311 10.3% 22,757 6.5% 59,068 16.8% aJob Service North Dakota (various years). bEmployment in 2013, 2014, 2015, and 2016 obtained from Job Service North Dakota (2014, 2015, 2016, 2017). Employment in 2011, 2012, 2017, 2018, and 2019 estimated using formats similar to those found with Job Service North Dakota (2014, 2015, 2016, 2017). cEstimate of oil and gas industry employment for 2012 was obtained from IHS, oil and gas industry employment in 2014, 2016, 2018 should
be interpreted as being approximate as a comprehensive economic contribution assessment was not conducted in those years.
Table 6. Employment Compensation, Direct and Secondary Economic Activity, Petroleum Industry, North Dakota, 2013 through 2019
Year
Private Wages and Salaries (Quarterly Census of Employment and Wages)
Statewidea
Direct Jobs Indirect and Induced Jobs Direct, Indirect, and
Induced Jobs
Oil and Gasb Share of
State Oil and Gas Share of
State Oil and Gas Share of
State
------ millions nominal $ ------ --- % --- - millions nominal $ - ---- % --- - millions nominal $ - ---- % ---
2013 17,518 5,000 28.5 960 5.5 5,960 34.0
2014 c 19,586 6,077 31.0 1085 5.5 7,162 36.6
2015 18,937 4,550 24.0 973 5.1 5,523 29.2
2016 c 17,055 2,758 16.2 659 3.9 3,416 20.0
2017 17,439 2,977 17.1 822 4.7 3,798 21.8
2018 c 18,432 3,524 19.1 838 4.5 4,362 23.7
2019 19,351 3,611 18.7 882 4.6 4,493 23.2 aJob Service North Dakota (various years). bEmployment compensation in 2013, 2014, 2015, and 2016 obtained from Job Service North Dakota (2014, 2015, 2016, 2017). Employment compensation in 2017, 2018, and 2019 estimated using formats similar to those found with Job Service North Dakota (2014, 2015, 2016, 2017). cOil and gas industry employment compensation in 2014, 2016, 2018 should be interpreted as being approximate as a comprehensive
economic contribution assessment was not conducted in those years.

18
Exploration and Development The economic effects of exploration and development come primarily from activities that involve searching and discovering viable oil and gas resources. Exploration/development was defined to include, but not limited to, seismic testing, geological research, lease expenses, other environmental research, land survey work, excavation, road building, construction of drill site, construction and delivery of electricity, pipeline development, and all other activities associated with drilling and completing oil and/or gas wells (Appendix A). Direct employment relating in oil and gas exploration and development was estimated at 6,800 jobs. An additional 11,000 jobs (i.e., indirect and induced) were supported in 2019 in various economic sectors by oil and gas exploration and development in the state. Overall, exploration and development was responsible for 17,900 jobs in the state in 2019 (Table 7). Appendix E contains detailed data, by economic causality by 2-digit NAICS, for oil field development.
Table 7. Direct, Indirect, and Induced Economic Effects, Well Development, Petroleum Industry, North Dakota, 2019
Economic Effects Employment Employment
Compensation Value-added Gross Business
Volume --- jobs --- ---------------------------------- millions $ ----------------------------------
Direct 6,832 861.4 1,582.7 3,843.6
Indirect 5,656 311.7 566.1 1,096.1
Induced 5,386 226.3 428.0 785.4
Total 17,874 1,399.4 2,576.8 5,725.1
Jobs supported by exploration and development had a total payroll of $1.4 billion, and oil and gas exploration and development contributed about $2.6 billion to the state’s gross domestic product (value-added). Gross business volume related to activities of exploration and development across all economic sectors was estimated at $5.7 billion in 2019 (Table 7).
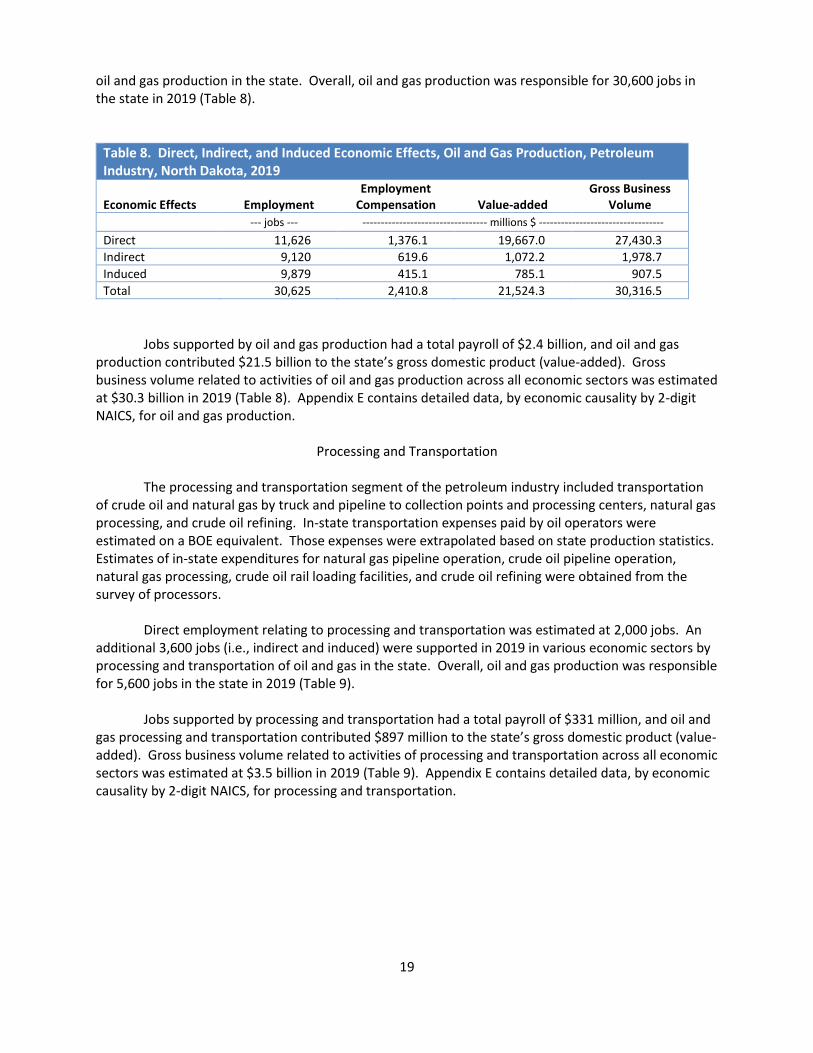
Oil and Gas Production The economic effects of extraction/production come from a series of revenue streams associated with bringing crude oil and natural gas from underground formations to the earth’s surface. Extraction/production was defined to include, but not limited to, all activities associated with the removal of crude oil and natural gas from the ground, and maintenance and periodic inspections of equipment used to extract oil and gas, and other production related activities, such as well work overs, well idling, shutdown, and abandonment activities (Appendix A). Also included in this segment of the industry are the general business expenditures incurred by oil operators in North Dakota. Examples of these expenditures include, but are not limited to, office rent, office supplies, wages and salaries, communications, public utilities, business and professional services, insurance, and interest expenses (Appendix A). Royalty revenues, both private and public, are included in the industry balance sheets (i.e., IMPLAN sector descriptions) for oil and gas production. Collections from state severance taxes, which include the gross production tax and extraction tax, are also part of the economic profile for the sector (see Appendix C). Direct employment relating to oil and gas production was estimated at 11,600 jobs. An additional 19,000 jobs (i.e., indirect and induced) were supported in 2019 in various economic sectors by
19
oil and gas production in the state. Overall, oil and gas production was responsible for 30,600 jobs in the state in 2019 (Table 8).
Table 8. Direct, Indirect, and Induced Economic Effects, Oil and Gas Production, Petroleum Industry, North Dakota, 2019
Economic Effects Employment Employment
Compensation Value-added Gross Business
Volume
--- jobs --- ---------------------------------- millions $ ----------------------------------
Direct 11,626 1,376.1 19,667.0 27,430.3
Indirect 9,120 619.6 1,072.2 1,978.7
Induced 9,879 415.1 785.1 907.5
Total 30,625 2,410.8 21,524.3 30,316.5
Jobs supported by oil and gas production had a total payroll of $2.4 billion, and oil and gas production contributed $21.5 billion to the state’s gross domestic product (value-added). Gross business volume related to activities of oil and gas production across all economic sectors was estimated at $30.3 billion in 2019 (Table 8). Appendix E contains detailed data, by economic causality by 2-digit NAICS, for oil and gas production.
Processing and Transportation The processing and transportation segment of the petroleum industry included transportation of crude oil and natural gas by truck and pipeline to collection points and processing centers, natural gas processing, and crude oil refining. In-state transportation expenses paid by oil operators were estimated on a BOE equivalent. Those expenses were extrapolated based on state production statistics. Estimates of in-state expenditures for natural gas pipeline operation, crude oil pipeline operation, natural gas processing, crude oil rail loading facilities, and crude oil refining were obtained from the survey of processors. Direct employment relating to processing and transportation was estimated at 2,000 jobs. An additional 3,600 jobs (i.e., indirect and induced) were supported in 2019 in various economic sectors by processing and transportation of oil and gas in the state. Overall, oil and gas production was responsible for 5,600 jobs in the state in 2019 (Table 9). Jobs supported by processing and transportation had a total payroll of $331 million, and oil and gas processing and transportation contributed $897 million to the state’s gross domestic product (value-added). Gross business volume related to activities of processing and transportation across all economic sectors was estimated at $3.5 billion in 2019 (Table 9). Appendix E contains detailed data, by economic causality by 2-digit NAICS, for processing and transportation.

20
Table 9. Direct, Indirect, and Induced Economic Effects, Processing and Transportation, Petroleum Industry, North Dakota, 2019
Economic Effects Employment Employment
Compensation Value-added Gross Business
Volume
--- jobs --- ---------------------------------- millions $ ----------------------------------
Direct 1,997 154.1 552.1 2,890.3
Indirect 1,790 101.1 201.7 335.4
Induced 1,803 75.7 143.2 262.9
Total 5,589 330.9 897.0 3,488.6
Capital Expenditures The petroleum industry in North Dakota has been adding infrastructure to the Williston Basin since the beginning stages of developing the Bakken/Three Forks Formations. Additional transportation capacity has been added to the region in the form of new export pipelines, expansions of existing crude oil pipelines, crude oil gathering systems, and crude oil rail loading facilities. New gas plants and expansions of existing plants have been added to the region, along with associated expansion and development of new collection systems to capture and transport natural gas and natural gas liquids to processing locations. Additional infrastructure added by the petroleum industry includes office buildings, regional transportation and distribution centers, worker housing, fracking water re-cycling facilities, and general facility and building upgrades and renovations. Capital expenditures for many forms of infrastructure have not been directly included in the previous industry assessments (Bangsund and Leistritz 2007, 2009, 2010), as industry costs and expenses in those studies focused solely on expenditures associated with well drilling/completion, oil and gas production, transportation, and processing operations. Information to estimate capital expenditures for infrastructure came from survey data and secondary sources containing published estimates of project costs. Some estimates of capital expenditures represent discrete projects (e.g., gas plant) whereas other estimates represent projects that have less definable start and finish dates and less site-specific designations (e.g., oil field gathering systems). Estimating industry-wide infrastructure spending requires addressing several key issues. First, timing of the start and completion of project-based infrastructure (e.g., gas plant) does not necessarily coincide with the study time frame. Projects can be initiated in one year and completed in another (e.g., started in 2019 while completion may not occur until 2020 or later). Survey data represented expenditures made for project(s) in 2019, while various secondary sources of capital expenditures represent total costs for specific projects that might involve spending over extended periods. Therefore, secondary data on infrastructure costs was reconciled with the anticipated timing of project-based expenditures. A project’s total cost does not necessarily require all spending to occur in a single year, or occur solely in 2019. Information was not available, on an industry-wide basis or on a project basis, to determine what portion of capital expenditures was captured in the North Dakota economy. For example, a substantial portion of the cost of a new gas processing plant or pipeline represents specialized equipment. Specialized equipment is acquired from out-of-state sources as primary suppliers are not available in North Dakota. Other studies have identified that a high proportion of specialized equipment

21
for various types of processing facilities constructed in North Dakota results in economic leakage (Bangsund et al. 2012; Coon et al. 2012a). Based on published estimates of project expenditures, survey data, and extrapolation of survey data in combination with unpublished data, the petroleum industry was estimated to have spent around $1.6 billion on infrastructure projects in the state in 2019 (Table 10).
Table 10. Capital Expenditures (Infrastructure), Petroleum Industry, North Dakota, 2011 through 2019 Industry Category 2011a 2013a 2015a 2017a 2019 a
------------------------------------- millions of nominal $ -------------------------------------
Gas Processing 961.7 753.0 925.6 600.0 810.0
Gas Midstream (excluding processing plants) 252.9 490.7 325.2 236.2 338.0
Crude Oil Pipelines, Crude Oil Rail Loading Facilities, and Refineries 654.7 690.4 732.4 668.7 116.2
Gathering Systems 221.5 515.7 318.6 281.8 365.8
Water Re-cycling Facilitiesb,c 33.2 185.8 122.4 11.6 na
Housing and Lodgingb,c 240.9 64.2 21.1 2.3 na
Office and Other Facilitiesb,c 184.9 263.2 162.2 170.2 na
Other (miscellaneous) b,c,d 50.3 241.1 13.8 0 na
Total 2,599.8 3,203.9 2,621.2 1,970.8 1,630.0 na=not available. a Represent an estimate of capital expenditures spent in calendar year. Capital expenditures in any particular year will not necessarily equal the total estimated cost of any particular project(s). b Estimated based on extrapolation of survey data. c Only includes expenditures for firms surveyed as part of the oil and gas industry. d Based on survey of firms providing service and support in the oil fields, and represented miscellaneous or unclassified infrastructure investments. This category also includes capital expenditures for development of the crude oil refinery in Dickinson. Sources: North Dakota Pipeline Authority (2020), North Dakota Department of Mineral Resources (2020), North Dakota Public Service Commission (2020), North Dakota Office of the State Tax Commissioner (2020c) and confidential survey data.
Infrastructure spending, as defined in this report, would represent additional economic activity beyond that created by the exploration, production, transportation, and processing segments of the industry. Within the IMPLAN modeling system, capital expenditures are not included with intermediate inputs (Appendix B). Therefore, capital expenditures are modeled as a separate source of impacts, even if some of the construction activity would be aligned in one of the industry’s key segments (e.g., construction of gathering systems as part of oil and gas production). In the analysis performed by Job Service North Dakota (2013, 2014, 2015, 2016) construction employment was included as part of the industry’s ‘related’ employment. The estimated construction jobs not considered part of the indirect and induced effects from exploration and drilling, oil production, transportation, and processing were used with several construction sectors in IMPLAN to estimate the overall economic effects of infrastructure spending. Because of the nature of the employment estimates generated by the Job Service North Dakota assessment, indirect and induced effects in NAICS 23 were treated as double counting, and not included in the final contribution figures. The gross business volume associated with infrastructure spending in North Dakota was estimated at $660 million in 2019 (Table 11), which would include adjustments for construction inputs

22
not obtained from in-state sources. Total employment related to petroleum industry capital expenditures was estimated at about 5,000 jobs with a payroll of $316 million. Capital expenditures by the industry in 2019 was estimated to contribute $376 million to the state’s GDP.
Table 11. Direct, Indirect, and Induced Economic Effects, Infrastructure, Petroleum Industry, North Dakota, 2019
Category Employment Employment
Compensation Value-added Gross Business
Volume
--- jobs --- ---------------------------------- millions $ ----------------------------------
Direct 3,453 228.8 243.0 411.2
Indirect 408 32.5 43.9 86.1
Induced 1,119 54.8 88.9 163.2
Total 4,980 316.1 375.8 660.5
23
Government Revenues Governmental revenues, usually based on tax collections, are another important measure of the economic impact of an industry on an economy. The petroleum industry in North Dakota, specifically oil and gas production, is responsible for substantial amounts of state and local government revenues. One distinction is that unlike many other industries in North Dakota, severance taxes (taxes placed on the value of oil and gas removed from the ground) collect money based on gross revenues produced by the industry. In contrast, taxation for most other industries is more traditional and usually limited to real property and net income. Another distinction that makes the petroleum industry different from other industries in the state is that governments can hold oil and gas leases and receive royalties from the value of oil and gas production. Of course, the petroleum industry also generates revenues from traditional sources, such as personal income, corporate income, sales and use, and property tax collections. Severance taxes, sales and use taxes, personal income taxes, corporate income taxes, property taxes, royalties, lease bonuses, charitable donations, and licenses, fees, and permits combined for $3.7 billion in government revenues that were directly attributable to the petroleum industry in North Dakota in 2019 (Figure 4). Severance taxes accounted for 66 percent of all government revenues from the petroleum industry in North Dakota in 2019. The second largest source was government royalties at 20 percent, followed by the most common general taxes (i.e., property, personal income, sales and use, and corporate income) at 10 percent. The remainder of government revenues represented lease bonuses, permits/fees/licenses, and miscellaneous revenues.

24
Economic activity from indirect and induced economic effects also create revenues for state and local governments. Secondary economic effects generated about $135 million in state and local government revenues in 2017 with the dominate share being revenues from sales taxes (Table 12). Secondary economic effects generated about $137 million in government revenues in 2019, with over $51 million of the total representing sales tax collections.

25
Table 12. State and Local Government Revenues from Indirect and Induced Economic Activity, Petroleum Industry, North Dakota, 2015, 2017, and 2019
Year and Revenue Category
Industry Segment
Total
Exploration and
Development Oil and Gas Production
Transp. and Processing Infrastructure
---------------------------------------------------------- 000s nominal $ ----------------------------------------------------------
2015
Corporate Income 2,624 4,877 581 517 8,598
Fines/Fees/Permits 1,465 2,649 372 290 4,776
Motor Vehicle 1,326 2,520 357 298 4,501
Miscellaneous 3,435 6,857 961 860 12,112
Personal Income 6,314 11,415 1,602 1,250 20,581
Property 6,529 13,937 2,012 1,908 24,386
Sales Tax 16,878 36,170 5,224 4,973 63,246
Social Insurance 826 1,497 209 165 2,697
Total 39,398 79,921 11,317 10,261 140,897
2017
Corporate Income 468 889 5,447 112 6,915
Fines/Fees/Permits 982 1,939 1,353 238 4,512
Motor Vehicle 977 1,929 973 276 10,576
Miscellaneous 3,176 6,238 180 982 4,155
Personal Income 2,214 4,370 8,906 537 16,027
Property 9,259 18,277 1,721 3,089 32,346
Sales Tax 15,089 29,786 493 5,052 50,420
Social Insurance 3,129 6,153 432 758 10,472
Total
2019
Corporate Income 1,494 2,588 580 199 4,860
Fines/Fees/Permits 1,506 2,694 614 194 5,008
Motor Vehicle 1,161 2,187 525 171 4,044
Miscellaneous 3,177 6,252 1,568 532 11,529
Personal Income 4,188 7,492 1,708 539 13,927
Property 9,399 19,890 5,283 1,821 36,393
Sales Tax 13,184 27,900 7,410 2,554 51,048
Social Insurance 2,973 5,497 1,231 394 10,095
Total 37,083 74,449 18,920 6,403 136,905 Note: Appendix B contains description of tax categories and methodology used by IMPLAN to estimate government revenues.

26
Total Economic Contribution The petroleum industry in North Dakota was defined to include exploration and drilling, oil and gas production, transportation and processing, and infrastructure development. Direct impacts were based on industry sales, in-state expenditures, private and public royalties, taxes, lease bonuses, and expenditures retained in North Dakota for infrastructure development. The petroleum industry’s total economic contribution in 2019 was estimated at $40.2 billion. About 75 percent of the industry’s overall economic contribution was from oil and gas production (Table 13). Aside from impacts in the NAICS Oil and Gas Sector, employment and gross business volume were fairly evenly distributed among most two-digit NAICS groupings in North Dakota (Tables 14 and 15). [See Appendix E for more details on the distribution of economic activity across the state’s key economic sectors].
Table 13. Total Economic Contribution, All Segments, Petroleum Industry, North Dakota, 2019 Economic Metric and Type of Economic Effect
Industry Segment
Total Exploration and
Drilling Oil and Gas Production
Transp. and Processing Infrastructure
Employmenta ------------------------------------------------------------------- jobs -------------------------------------------------------------------
Direct 6,832 11,626 1,997 3,453 23,908
Indirect 5,656 9,120 1,790 408 16,974
Induced 5,386 9,879 1,803 1,119 18,187
Total 17,874 30,625 5,589 4,980 59,068
Employment Compensation ----------------------------------------------------------------- millions $ -----------------------------------------------------------------
Direct 861.4 1,376.1 154.1 228.8 2,620
Indirect 311.7 619.6 101.1 32.5 1,065
Induced 226.3 415.1 75.7 54.8 772
Total 1,399.4 2,410.8 330.9 316.1 4,457
Value-added ----------------------------------------------------------------- millions $ -----------------------------------------------------------------
Direct 1,582.7 19,667.0 552.1 243.0 22,045
Indirect 566.1 1,072.2 201.7 43.9 1,884
Induced 428.0 785.1 143.2 88.9 1,445
Total 2,576.8 21,524.3 897.0 375.8 25,374
Gross Business Volume ----------------------------------------------------------------- millions $ -----------------------------------------------------------------
Direct 3,843.6 27,430.3 2,890.3 411.2 34,575
Indirect 1,096.1 1,978.7 335.4 86.1 3,496
Induced 785.4 907.5 262.9 163.2 2,119
Total 5,725.1 30,316.5 3,488.6 660.5 40,191 aEmployment estimates under IMPLAN modeling system will differ from estimates of direct employment using Job Service North Dakota (2014, 2015,
2016, 2017) designations. Note: IMPLAN output for Indirect and Induced effects for all industry segments was adjusted to more closely align with employment distributions obtained from applying previous Job Service North Dakota (2016, 2017) delineations to current industry estimates. Those adjustments act to reduce the overall level of indirect and induced economic effects and increase the overall size of the direct impacts.

27
Table 14. Direct, Indirect, and Induced Employment, by Economic Sector, Petroleum Industry, North Dakota, 2019
NAICS code and Economic Sector
Industry Segments
Total Exploration and Drilling
Oil and Gas Production
Transp and Processing
Infrastruct-ure
----------------------------------------- jobs -----------------------------------------
11 Ag, Forestry, Fish & Hunting 28 40 8 6 82
21 Mining 6,860 11,647 868 4 19,380
22 Utilities 35 171 67 7 280
23 Construction 228 284 267 3,462 4,242
31-33 Manufacturing 62 96 405 67 631
42 Wholesale Trade 567 840 196 94 1,697
44-45 Retail trade 1,081 1,949 411 229 3,670
48-49 Transportation & Warehousing 482 1,250 1,116 96 2,944
51 Information 161 300 51 23 533
52 Finance & Insurance 1,470 1,985 230 102 3,787
53 Real Estate & Rental 667 1,062 153 87 1,969
54 Professional, Scientific & Technical Services 1,554 2,754 225 85 4,618
55 Management of Companies 192 837 79 11 1,119
56 Administrative & Waste Services 876 1,246 293 68 2,483
61 Educational Services 1,315 2,412 440 273 4,441
62 Health & Social Services 114 206 39 24 383
71 Arts, Entertainment & Recreation 210 378 66 39 693
72 Accommodation & Food Services 1,082 1,620 323 152 3,177
81 Other Services 807 1,269 313 138 2,527
92 Government 82 279 40 13 415
Totals 17,874 30,625 5,589 4,980 59,068

28
Table 15. Gross Business Volume, by Economic Sector, Petroleum Industry, North Dakota, 2019
NAICS code and Economic Sector
Industry Segments
Total Exploration and Drilling
Oil and Gas Production
Transp and Processing
Infrastruct-ure
----------------------------------------- millions $ ---------------------------------------
11 Ag, Forestry, Fish & Hunting 3 3 1 1 7
21 Mining 3,860 27,441 84 1 31,386
22 Utilities 39 165 66 8 278
23 Construction 52 59 52 413 577
31-33 Manufacturing 25 33 2,653 19 2,729
42 Wholesale Trade 181 236 71 28 517
44-45 Retail trade 92 108 35 20 255
48-49 Transportation & Warehousing 63 267 205 14 549
51 Information 59 89 17 8 173
52 Finance & Insurance 362 469 56 27 914
53 Real Estate & Rental 291 361 63 38 754
54 Professional, Scientific & Technical Services 235 368 30 13 645
55 Management of Companies 41 177 15 2 235
56 Administrative & Waste Services 74 103 22 6 205
61 Educational Services 163 189 55 34 441
62 Health & Social Services 6 7 2 1 16
71 Arts, Entertainment & Recreation 13 16 4 2 34
72 Accommodation & Food Services 70 74 20 10 173
81 Other Services 76 83 28 12 199
92 Government 19 68 10 3 101
Totals 5,725 30,317 3,489 660 40,191

29
COMPARISON OF PREVIOUS INDUSTRY ASSESSMENTS The first comprehensive economic evaluation of the petroleum industry in North Dakota, conducted in 2006, was reflective of conditions present in the industry in calendar year 2005 (Bangsund and Leistritz 2007). Biennial assessments have been conducted since the 2005 study (Bangsund and Leistritz 2009, 2010; Bangsund and Hodur 2013, 2015, 2017, 2019). The results reported in this study were based on conditions present in the industry in calendar year 2019. Biennial assessments from 2005 through 2019 have documented the meteoric rise in economic output as the industry ramped up development of shale oil resources and have measured the precipitous drop in output as the industry contracted from a price collapse at the end of 2014. Methods and data sources among the eight studies had undergone several refinements in data collection and estimation techniques since the first economic assessment in 2005. In the 2007 study, a separate survey of lease/brokerage firms was initiated to help generate estimates of in-state lease bonuses on private land in North Dakota. Firms providing oil field services were not surveyed in the 2007, 2013, 2015, 2017 and 2019 studies, but those firms were surveyed in the 2005, 2009, and 2011 studies. Detailed data on input sourcing for well drilling and well completions were obtained from oil operators to examine economic leakage associated with well drilling and well completion activities in the 2011 study and the same information was solicited in the 2019 study. Also, estimates of in-state mineral royalty revenues in 2011 were refined based on payment data obtained from oil operators in the state. Finally, the 2011 study collected survey data on infrastructure spending by the industry. The 2013 study expanded the survey of firms to include rail loading facilities. The 2013 and 2015 studies used data from Job Service North Dakota to estimate direct employment in the industry, rather than develop estimates from survey or other secondary data. The largest change in the data and methods are found with the 2017 and current study. In previous studies, various revenue streams to the state (e.g., spending by the industry for inputs, payroll, and selected government revenues) were estimated using a combination of survey data and information from secondary sources. The primary tool to estimate how those dollar flows affected the state’s economy in the previous six studies was the ND Input-output Model. Prior to running inputs through the model, adjustments were made to expenditure data to obtain estimates of only in-state expenditures. The 2017 and the current study use the IMPLAN modeling system. Many of the revenue flows estimated in the previous studies were retained, and used to shape the economic profile for several economic sectors within IMPLAN. IMPLAN’s analytical structure includes many of the elements used in the previous studies, but combines them in a more comprehensive manner and in a manner more closely reflecting the information in the National Income and Product Accounts produced by the U.S. Bureau of Economic Analysis. Further, IMPLAN initiates the economic analysis using sector revenue or sales; this is a departure from the previous studies’ methodologies. Also, this study accesses the underlying I-O matrix data for North Dakota. The dataset obtained from IMPLAN contains data not previously used in the 2005 through 2015 economic contribution studies. While many of the data sources in previous studies were retained in this study, the switch from the ND Input-Output Model to the IMPLAN modeling system does produce different estimates of economic output. As a result of those differences, data from the 2015 study and the 2015 IMPLAN input-output matrix were used to reconstruct the 2015 study economic contribution estimates using IMPLAN as the modeling platform. The goal of producing 2015 estimates using IMPLAN was to allow a more effective comparison of recent economic contributions from the petroleum industry that are more reflective of changes in industry output than changes in modeling platforms (Table 16).

30
Table 16. Key Economic Values, Petroleum Industry, North Dakota, Selected Years 2005 through 2019 Category 2005 a 2007 a 2009 a 2011 a 2013 a 2015 a 2015 b 2017 b 2019 b ------------------------------------------------------------------------------ millions nominal $ ------------------------------------------------------------------------------
Direct Effects
Exploration and Drilling 445.1 1,536.3 2,802.7 6,141.1 7,609.4 5,301.0 5,733.9 3,381.4 3,843.6
Oil and Gas Production 819.8 1,308.4 1,799.4 3,976.6 7,676.8 6,211.1 19,964.0 22,214.6 27,430.3
Transp. and Processing 132.5 261.7 310.8 475.0 812.6 1,204.4 2,357.1 2,270.8 2,890.3
Infrastructure not estimated not estimated not estimated 1,143.0 1,463.4 1,142.3 852.1 577.5 411.2
Total 1,397.4 3,106.4 4,912.9 11,736.7 17,562.2 13,858.9 28,907.1 28,444.3 34,575.4
Indirect and Induced Effectsc
Exploration and Drilling 775.0 2,721.4 4,727.8 10,697.5 12,788.5 8,868.9 2,685.0 1,071.6 1,881.5
Oil and Gas Production 1,408.4 1,956.3 2,455.7 4,672.6 7,668.3 6,345.2 3,150.6 2,235.8 2,886.2
Transp. and Processing 238.1 445.5 566.3 895.1 1,510.0 2,241.8 462.1 566.1 598.3
Infrastructure not estimated not estimated not estimated 2,419.0 3,098.6 2,414.6 394.2 299.4 249.3
Total 2,421.5 5,123.2 7,749.8 18,685.2 26,065.4 19,870.5 6,691.9 4,172.9 5,615.3
Gross Business Volume
Exploration and Drilling 1,220.1 4,257.7 7,530.5 16,838.6 20,397.9 14,169.9 8,418.8 4,453.0 5,725.1
Oil and Gas Production 2,228.2 3,264.7 4,255.0 8,649.2 15,345.1 12,556.3 22,561.8 24,450.4 30,316.5
Transp. and Processing 370.6 707.2 877.1 1,370.1 2,322.6 3,146.2 2,819.3 2,836.8 3,488.6
Infrastructure not estimated not estimated not estimated 3,562.0 4,562.0 3,556.8 1,246.3 876.9 660.5
Total 3,818.9 8,229.6 12,662.6 30,419.9 43,627.6 33,729.3 35,991.1 32,617.2 40,190.7
Government Revenues 336.3 629.8 1,010.1 2,647.8 4,496.8 3,362.6 3,167.1 2,881.5 3,825.3
---------------------------------------------------------------------------------------------- jobs -------------------------------------------------------------------------------------------
Total Jobs Supported in
NDd 20,022 29,425 36,057 59,559 81,407 72,353 72,353 51,428 59,068 a Estimated using North Dakota Input-Output Model and associated methodologies. b Estimated using IMPLAN modeling platform and associated methodologies. c Indirect and induced effects in the IMPLAN analysis for 2015, 2017, and 2019 were adjusted downward to reflect the treatment of indirect business activity being counted as direct activity. The
adjustments were conducted so that economic output would be similar and consistent with the differences between employment from the Job Service North Dakota (2016, 2017) studies and employment using traditional Input-output analysis. d Employment estimates in 2005, 2007, and 2009 were based on North Dakota Input-Output model’s economic base dataset. Estimates in subsequent years used traditional input-output approaches
examining indirect and induced effects for supporting secondary employment in combination with information from Job Service North Dakota (2014, 2015, 2016, 2017).

31
SUMMARY and CONCLUSIONS Over the past decade, the adoption of new technologies to extract oil and gas from shale has made the petroleum industry one of the largest single basic-sector industries in the state. This study represents the eighth study to measure the economic contribution of petroleum industry activities on North Dakota’s economy. The purpose of this study was to estimate the economic contribution of the petroleum industry in North Dakota in 2019. The petroleum industry was defined to include exploration/development, extraction/production, transportation, and processing of crude oil and natural gas. Also included in this study was an assessment of capital expenditures for infrastructure projects. In previous studies, only money spent in North Dakota by companies involved in the petroleum sector was included in the study and represented the direct impacts of the industry. This study used the IMPLAN modeling system which uses industry sales to represent the direct impacts of the industry. These changes, and other differences between the previous study’s methodologies, make detailed comparisons between the two methodologies challenging. The input-output analysis in this study was modified to be more consistent with Job Service North Dakota employment estimates of direct employment in the industry. Exploration and drilling was estimated to have a $5.7 billion economic contribution to the state, and was estimated to support 17,900 jobs. Statewide employment compensation from exploration and drilling was estimated at $1.4 billion. Oil and gas production was estimated to have a $30.3 billion economic contribution to the state, and was estimated to support 30,600 jobs. Statewide employment compensation from oil and gas production was estimated at $2.4 billion. The processing and transportation component of the petroleum industry was estimated to have an economic contribution in the state of $3.5 billion. Statewide, transportation and processing of crude oil and natural gas supported about 5,600 jobs having $330 million in employment compensation. Infrastructure expenditures in the IMPLAN modeling system are not contained within an industry’s intermediate inputs, and are modeled separately from other sectors of the industry. Development of infrastructure was estimated to support 4,900 jobs statewide and have an economic contribution of $660 million. Overall, the industry was estimated to support 59,100 jobs in the state having a $4.45 billion payroll. The industry’s economic contribution was estimated at $40.2 billion in 2019. The industry was estimated to contribute $25 billion to North Dakota’s gross state product. The industry was responsible for $3.8 billion in local and state government revenues. Regardless of the economic measure used, the petroleum industry is one of the largest basic-sector industries in North Dakota, even though the economic size of the industry has not rebounded to the historical peak in 2014. Current activity levels in the petroleum industry clearly make it one of the key forces in the North Dakota economy.

32
REFERENCES Bangsund, Dean A. and Nancy M. Hodur. 2021. Wind Energy Industry’s Economic Contribution to the North
Dakota Economy in 2019. Agribusiness and Applied Economics Report No. 805. Department of Agribusiness and Applied Economics, North Dakota State University, Fargo.
Bangsund, Dean A. and Nancy M. Hodur. 2020. Economic Contribution of the North Dakota Lignite Industry in
2019. Agribusiness and Applied Economics Report No. 804. Department of Agribusiness and Applied Economics, North Dakota State University, Fargo.
Bangsund, Dean A. and Nancy M. Hodur. 2019a. Economic Contribution of the North Dakota Lignite Industry
in 2017. Agribusiness and Applied Economics Report No. 784. Department of Agribusiness and Applied Economics, North Dakota State University, Fargo.
Bangsund, Dean A. and Nancy M. Hodur. 2019b. Petroleum Industry’s Economic Contribution to North Dakota
in 2017. Agribusiness and Applied Economics Report No. 792. Department of Agribusiness and Applied Economics, North Dakota State University, Fargo.
Bangsund, Dean A. and Nancy M. Hodur. 2017. Petroleum Industry’s Economic Contribution to North Dakota
in 2015. Agribusiness and Applied Economics Report No. 766. Department of Agribusiness and Applied Economics, North Dakota State University, Fargo.
Bangsund, Dean A. and Nancy M. Hodur. 2015. Petroleum Industry’s Economic Contribution to North Dakota
in 2013. Agribusiness and Applied Economics Report No. 736. Department of Agribusiness and Applied Economics, North Dakota State University, Fargo.
Bangsund, Dean A. and Nancy M. Hodur. 2013. Petroleum Industry’s Economic Contribution to North Dakota
in 2011. Agribusiness and Applied Economics Report No. 710. Department of Agribusiness and Applied Economics, North Dakota State University, Fargo.
Bangsund, Dean A., Nancy M. Hodur, and F. Larry Leistritz. 2012. Economic Contribution of the Sugarbeet
Industry in Minnesota and North Dakota. Agribusiness and Applied Economics Report No. 688. Department of Agribusiness and Applied Economics, North Dakota State University, Fargo.
Bangsund, Dean A. and F. Larry Leistritz. 2010. Economic Contribution of the Petroleum Industry to North
Dakota in 2009. Agribusiness and Applied Economics Report No. 676 & 676-S. Department of Agribusiness and Applied Economics, North Dakota State University, Fargo.
Bangsund, Dean A. and F. Larry Leistritz. 2009. Petroleum Industry’s Economic Contribution to North Dakota
in 2007. Agribusiness and Applied Economics Report No. 639. Department of Agribusiness and Applied Economics, North Dakota State University, Fargo.
Bangsund, Dean A. and F. Larry Leistritz. 2007. Economic Contribution of the Petroleum Industry to North
Dakota in 2005. Agribusiness and Applied Economics Report No. 599. Department of Agribusiness and Applied Economics, North Dakota State University, Fargo.

33
Coon, Randal C., Nancy M. Hodur, and Dean A. Bangsund. 2012. Renewable Energy Industries’ Contribution to the North Dakota Economy. AAE 702. . Department of Agribusiness and Applied Economics, North Dakota State University, Fargo.
Job Service North Dakota. 2017. 2016 North Dakota Oil and Gas Employment Report.
http://www.jobsnd.com/ Job Service North Dakota, Bismarck. Job Service North Dakota. 2016. 2015 North Dakota Oil and Gas Employment Report.
http://www.jobsnd.com/ Job Service North Dakota, Bismarck. Job Service North Dakota. 2015. 2014 North Dakota Oil and Gas Employment Report.
http://www.jobsnd.com/ Job Service North Dakota, Bismarck. Job Service North Dakota. 2014. 2013 North Dakota Oil and Gas Employment Report.
http://www.jobsnd.com/ Job Service North Dakota, Bismarck. Job Service North Dakota. Various years. Quarterly Census of Employment and Wages.
http://www.jobsnd.com/ Job Service North Dakota, Bismarck. North Dakota Department of Mineral Resources. 2020. Unpublished data on oil and gas production, well
drilling activity, and energy prices. Oil and Gas Division, Department of Mineral Resources, North Dakota Industrial Commission, Bismarck.
North Dakota Department of Trust Lands. 2020. Oil and gas lease statistics. http://www.land.state.nd.us/
Minerals Management Division, North Dakota Department of Trust Lands, Bismarck, ND. North Dakota Office of State Tax Commissioner. 2020a. Unpublished data on state collections of gross
production tax and extraction tax. North Dakota Office of State Tax Commissioner, Bismarck, ND. North Dakota Office of State Tax Commissioner. 2020b. Unpublished data on average monthly crude oil
prices received in North Dakota. North Dakota Office of State Tax Commissioner, Bismarck, ND. North Dakota Office of State Tax Commissioner. 2020c. Unpublished data on property taxes for pipelines and
other centrally-assessed facilities for oil and gas activities. North Dakota Office of State Tax Commissioner, Bismarck, ND.
North Dakota Pipeline Authority. 2020. Unpublished data on petroleum industry infrastructure in North
Dakota. North Dakota Pipeline Authority, North Dakota Industrial Commission, Bismarck. North Dakota Public Service Commission. 2020. Public Notices. http://www.psc.nd.gov/index.php. North
Dakota Public Service Commission, Bismarck. Office of Natural Resource Revenue. 2020. Mineral revenue collections and distributions.
http://www.onrr.gov/ONRRWebStats/Home.aspx Office of Natural Resource Revenue, U.S. Department of the Interior, Denver, CO.

34
U.S. Bureau of Economic Analysis. 2020. Implicit Price Deflators for Gross Domestic Product. http://www.bea.gov/ U.S. Bureau of Economic Analysis, U.S. Department of Commerce, Washington, D.C.
U.S. Bureau of Labor Statistics. 2020. Quarterly Census of Employment and Wages.
https://www.bls.gov/bls/proghome.htm#employment U.S. Bureau of Economic Analysis, U.S. Department of Labor, Washington, D.C.
U.S. Department of Energy. 2020. http://www.eia.doe.gov/ Energy Information Administration, U.S.
Department of Energy, Washington, D.C.

35
Survey Questionnaires
Appendix A

36
Economic Contribution
of the Petroleum
Industry to
North Dakota
Survey of Oil Operators
Funding for this study is provided by the North Dakota Petroleum Council
This survey is being conducted by the Department of Agribusiness and Applied Economics at NDSU

37
Instructions and Guidelines for Filling Out the Questionnaire
Data provided from this survey will be used to help estimate the economic contribution of the oil industry to the North Dakota economy. The goal is to determine how much money the oil industry spends in North Dakota. All expenditure data will be synthesized in a manner that only industry-wide totals will be reported. In no way will any information presented in the study identify or be reflective of any single firm or operation.
The following is a list of general guidelines for the questionnaire.
1. Use information from 2017 or your most recently completed fiscal year.
2. Expenditures should be expressed in U.S. dollars.
3. If the actual amount of the expenditure is not easily determined or is not readily known, please provide an estimate of the expense.
4. For contractor expenditures (Part II of this questionnaire), please include all expenditures made for services provided in North Dakota, even if the office or headquarters of the contractor or service provider is not located in North Dakota.
4. For infrastructure expenditures (Part III of the questionnaire), include costs associated with the various categories for 2017.
5. For general expenditures for day-to-day operations (Part IV of the questionnaire),
include only how much your company paid out to entities in North Dakota.
6. If you cannot identify whether an expenditure was made in North Dakota or in another state, indicate this on the form.
7. Definitions for some expenditure items and their corresponding Standard
Industrial Classification (SIC) code listing are included to help in determining allocation of expenditures.
8. Please complete the survey by September 15st, 2018 and mail the questionnaire in the return envelope.
9. If you have questions, please contact:
Dean Bangsund 701-231-7471
Email: [email protected]
or
Dr. Nancy Hodur 701-231-7357
Email: [email protected]
Department of Agribusiness and Applied Economics
North Dakota State University
Fargo, ND 58108-6050

38
The following questions pertain only to wells for which your company is the operator.
Number of producing oil wells in ND in 2017 for which your company was the operator
Oil Gas
Total production from your operated wells in 2017 bbls mcf
Operator interest share of production % %
All royalty interest share of production % %
Remaining working interest share of production % %
Total number of employees working in North Dakota: (Full-time equivalents)
Number of jobs (FTE’s) above dedicated to exploration/drilling
Number of jobs (FTE’s) above dedicated to general production/extraction
Part I - - General Information
Business Name:
Mailing Address:
Contact Person:
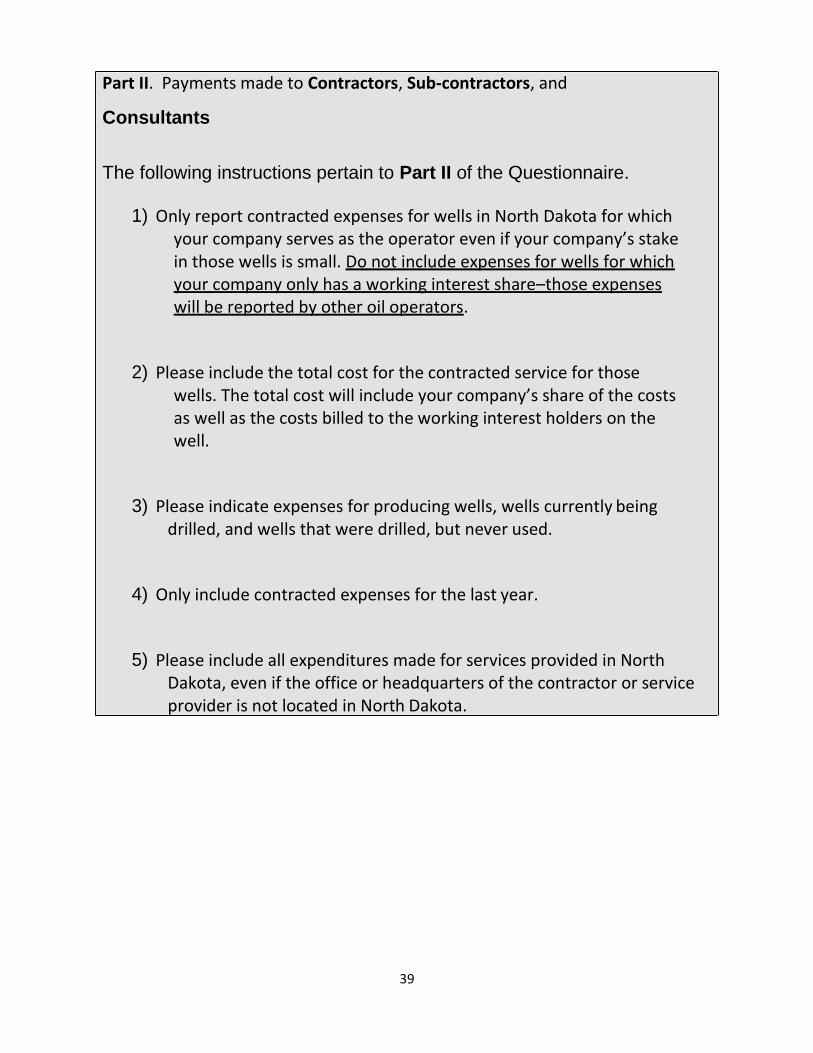
39
Part II. Payments made to Contractors, Sub-contractors, and
Consultants
The following instructions pertain to Part II of the Questionnaire.
1) Only report contracted expenses for wells in North Dakota for which your company serves as the operator even if your company’s stake in those wells is small. Do not include expenses for wells for which your company only has a working interest share–those expenses will be reported by other oil operators.
2) Please include the total cost for the contracted service for those wells. The total cost will include your company’s share of the costs as well as the costs billed to the working interest holders on the well.
3) Please indicate expenses for producing wells, wells currently being drilled, and wells that were drilled, but never used.
4) Only include contracted expenses for the last year.
5) Please include all expenditures made for services provided in North Dakota, even if the office or headquarters of the contractor or service provider is not located in North Dakota.

40
Part II.
Type of Contracting Work Performed
Payments for work done in North Dakota
General Exploration
Examples of services include lease brokerage costs (lease arrangements and landowner negotiations), landman expenses, environmental services, seismic testing and geological research
$
Drilling Activities (Capital Investments)
Examples of services include land survey work, excavation, road building, construction of drill site, other drill site preparations such as providing electricity, setting up storage facilities, etc., erecting derrick, mudding operations, spudding operations, wellbore casing, case perforation, logging, fracing services, wellhead placement, pipeline development and construction, and any other services provided that are associated with drilling activities
This category of expenses should include all phases of drilling for both primary wells and secondary/tertiary/EOR injection wells
$
Oil and Gas Extraction and Production (Operating Expenses)
Examples of services include pump, well, and storage tank maintenance and servicing; daily & weekly well visits for tank switching, periodic inspections, general monitoring, and other activities; well stimulations; well work overs; well idling, shutdown, and/or abandonment activities
$
Transportation
Include expenses for truck transportation of oil from well site to pipeline collection points (terminal) and expenses for truck transportation of other products and by-products from well site to secondary locations, also include all charges for transportation of gas and oil by pipeline or rail until products are sold to a purchaser or buyer
$
Any other services or activities provided by contracted arrangements not listed above:
(please specify)
(please specify)
(please specify)
(please specify)
$
$
$
$

41
Part III. This section relates to your company’s expenses associated with infrastructure
development in North Dakota. To avoid double counting, do not include any expenditures here
that are reported in Part II dealing with exploration, drilling/well development, or operating
expenses. Please report total expenditures in 2017 for the following categories with respect to
infrastructure in North Dakota. Figures can be rounded to thousands.
If your company had no expenses in a particular category, please enter zero.
Infrastructure Categories Expenses for
projects in North Dakota in 2017
Oil Field Gathering Systems
Construction of oil pipeline gathering systems (field systems) to move crude oil
to transmission pipelines or rail facilities.
$
Gas Midstream Projects
Construction of gas gathering systems, construction of gas plants, construction
of fractionation facilities, and pipelines for distribution of gas to main pipelines.
$
Oil Shipment Facilities
Facilities for shipment of crude oil, including pipeline capacity enhancements,
rail loading facilities, and any storage facilities associated with those facilities.
$
Water Treatment Facilities
Construction expenses for water disposal facilities, frac water recycling
facilities, and any distribution systems (in-field pipelines) for movement of frac
and brine water to treatment or disposal facilities.
$
Housing and Lodging
Include expenses associated with the construction/development of man
camps, lodging facilities at work sites, and construction of other housing
projects (e.g., company owned apartments and houses).
NOTE: please include all lodging expenses for actual housing of workers (motel
rooms, meals, other arrangements) that are not related to constructing housing
infrastructure in Section II.
$
Office and Other Facilities
Expenditures for construction/development of company offices, central
facilities, maintenance facilities, and holding/transit facilities.
$
Other Facilities
Please specify
$

42
Part IV. The following expenses relate to your company’s general business operations in North
Dakota and should represent expenses paid only to North Dakota entities. These expenses should not include any payments made to oil industry contractors or consultants associated with exploration or extraction. Please refer to the accompanying sheet for definitions and clarification of what expenses should be included in the expenditure categories.
If your company had no expenses in a particular category, please enter zero.
General Business Expenses
Expenses paid to North Dakota
entities
Building and equipment leases (e.g., office space, vehicles) $
Business and personal services $
Professional and social services $
Communications $
Construction $
Public utilities $
Employee wages and salaries $
Employee benefits (retirement, health insurance, etc.) $
Payroll taxes (FICA, etc.) $
Insurance $
Interest, finance, and banking expenses $
Retail trade $
Wholesale trade $
Research and development $
North Dakota taxes:
Property $
Income $
Sales and use $
Transportation (note: pipeline expenses should be reported in Part II) $
Any miscellaneous payments to working interests $
Any miscellaneous payments to royalty interests $
Other expenses (please specify). $
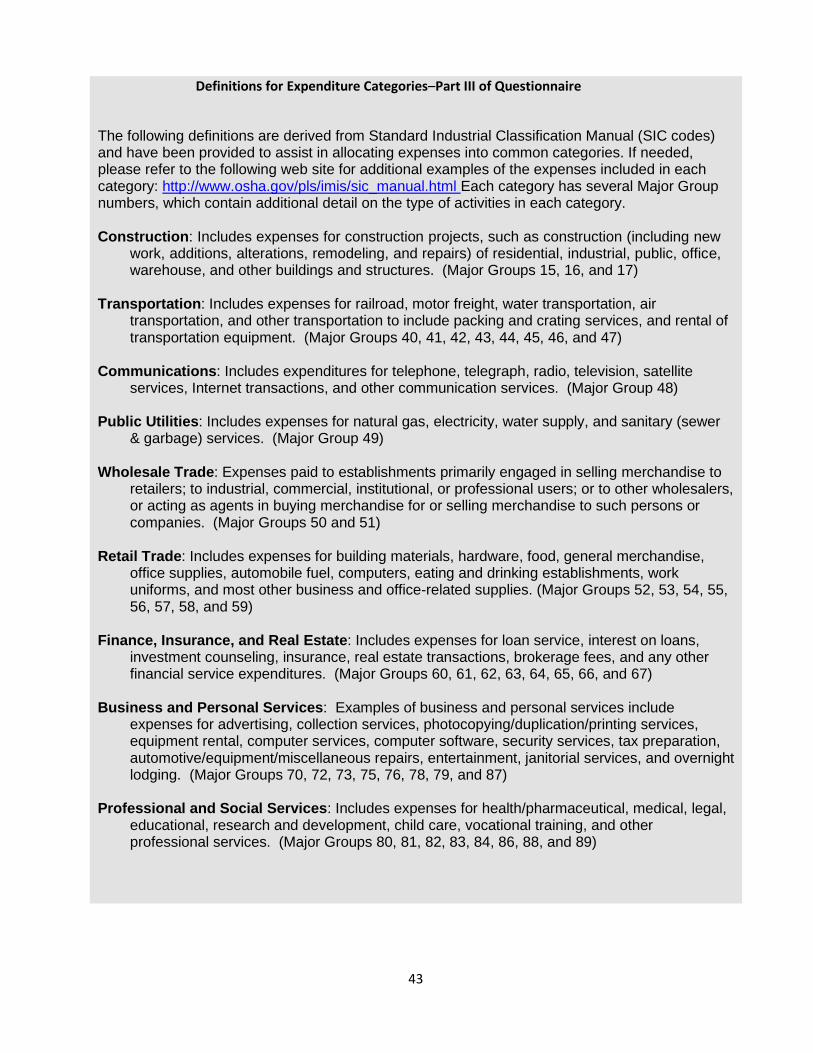
43
Definitions for Expenditure Categories–Part III of Questionnaire
The following definitions are derived from Standard Industrial Classification Manual (SIC codes) and have been provided to assist in allocating expenses into common categories. If needed, please refer to the following web site for additional examples of the expenses included in each category: http://www.osha.gov/pls/imis/sic_manual.html Each category has several Major Group numbers, which contain additional detail on the type of activities in each category.
Construction: Includes expenses for construction projects, such as construction (including new work, additions, alterations, remodeling, and repairs) of residential, industrial, public, office, warehouse, and other buildings and structures. (Major Groups 15, 16, and 17)
Transportation: Includes expenses for railroad, motor freight, water transportation, air transportation, and other transportation to include packing and crating services, and rental of transportation equipment. (Major Groups 40, 41, 42, 43, 44, 45, 46, and 47)
Communications: Includes expenditures for telephone, telegraph, radio, television, satellite services, Internet transactions, and other communication services. (Major Group 48)
Public Utilities: Includes expenses for natural gas, electricity, water supply, and sanitary (sewer & garbage) services. (Major Group 49)
Wholesale Trade: Expenses paid to establishments primarily engaged in selling merchandise to retailers; to industrial, commercial, institutional, or professional users; or to other wholesalers, or acting as agents in buying merchandise for or selling merchandise to such persons or companies. (Major Groups 50 and 51)
Retail Trade: Includes expenses for building materials, hardware, food, general merchandise, office supplies, automobile fuel, computers, eating and drinking establishments, work uniforms, and most other business and office-related supplies. (Major Groups 52, 53, 54, 55, 56, 57, 58, and 59)
Finance, Insurance, and Real Estate: Includes expenses for loan service, interest on loans, investment counseling, insurance, real estate transactions, brokerage fees, and any other financial service expenditures. (Major Groups 60, 61, 62, 63, 64, 65, 66, and 67)
Business and Personal Services: Examples of business and personal services include expenses for advertising, collection services, photocopying/duplication/printing services, equipment rental, computer services, computer software, security services, tax preparation, automotive/equipment/miscellaneous repairs, entertainment, janitorial services, and overnight lodging. (Major Groups 70, 72, 73, 75, 76, 78, 79, and 87)
Professional and Social Services: Includes expenses for health/pharmaceutical, medical, legal, educational, research and development, child care, vocational training, and other professional services. (Major Groups 80, 81, 82, 83, 84, 86, 88, and 89)

44
Part V. Drilling Activity in North Dakota. Please summarize your company’s drilling activities in North Dakota over the past year.
Drilling 2017
Overall number of wells drilled
Number of wells drilled that were plugged (dry holes)
Number of wells drilled that went into production (completed as a producer)
Part VI. Mineral Royalty Payments. This section is looking for total private mineral royalty payments and mineral payments mailed to entities in North Dakota.
Payments to Private Mineral Royalty Owners 2017
Gross Payment of mineral royalties to all private mineral owners associated with oil and gas wells in North Dakota
Note: Only include payments to private mineral owners, exclude payments to working interests and public mineral
owners (e.g., state, Federal).
Gross Payments for private mineral royalties that went to North Dakota addresses
Note: This is the portion of the payment above that went
to some entity (person, bank, trust) in North Dakota.

45
Part VII. List of Contractors/Venders. Please provide the name and mailing address of
all companies that your firm has contracted with over the last year to perform work in the oil fields in North Dakota. Please include all companies even if they do not have a North Dakota address. If a computer listing is not available, please use the following space to provide the information.
Name of Company Address (street, city, state, zip)
Please add sheets or attach printouts as needed.

46
Thank You for completing this questionnaire!
Please return the questionnaire in the postpaid envelope.
If you would like a copy of the study results mailed to you, make sure you have
provided a mailing address in Part I of the questionnaire. Otherwise, you may
contact Edie Nelson in the Department of Agribusiness and Applied Economics at
North Dakota State University for more information on our departmental reports.
Phone (701)231-7441, fax (701)231-7400, email: [email protected] or
visit our departmental listing of research reports on the internet at
http://ageconsearch.umn.edu/
Study results should be available at the end of 2018.

47
Economic Contribution
of the Petroleum
Industry to North
Dakota
Survey of Midstream
Operations
Funding for this study is provided by the North Dakota Petroleum Council
This survey is being conducted by the Department of Agribusiness and Applied Economics at NDSU

48
Confidentiality
This is a confidential request -- only the immediate research team has access to this
information, and the information is never shared with any interests during or after the study. A
confidentiality agreement can be provided upon request.
Guidelines and Instructions
Please use the following guidelines.
1. Please provide information for 2017 or most recent year end.
2. Do not include expenditures for inputs/services purchased last year for this year’s operations.
3. If information is not readily available, please estimate.
4. Definitions for selected expenditure items are included to help in determining allocation of expenditures.
5. Please complete the survey by September 14, 2018. You can mail the survey in the prepaid envelope or email the questionnaire to Dean
Bangsund at the address below.
Study Contacts
Dean Bangsund (701-231-7471)
Dr. Nancy Hodur (701-231-8621)
Mailing Address
Dean Bangsund
Richard H. Barry Hall
Dept # 7610, PO Box 6050
North Dakota State University
Fargo, ND 58108-6050

49
Contribution of Petroleum Industry to North Dakota
Survey of Midstream Operations
Company: ________________________
Contact Person: ________________________
Email: __________________ Phone: ___________________
Many firms have more than one midstream operation in ND. We are looking to identify all of the operations
your firm has in ND.
Please provide some measure of the physical size or output of your midstream operations in ND.
Operations in ND Measure of Size Gas plants/processing
MMcf gas processed/yr
Field gathering systems (oil, gas, water)
Volumes collected and moved (bbls, mcf, bbls)
Intra- and/or Inter-state crude oil pipelines (excluding gathering lines)
Bbls shipped/yr
Intra- and/or inter-state gas pipelines (excluding gathering lines)
MMcf shipped/yr
Crude oil refining
Bbls processed/yr
Rail loading/truck loading terminals
Bbls loaded/yr
Operation of water disposal/injection wells
Bbls injected/yr
Part I: General Characteristics of Operations in ND

50
Included below are confidential questions on financial characteristics of the midstream
operations identified in the previous section.
Do not include capital expenditures in this section—those expenditures should be placed in Part III of
this questionnaire.
Each midstream component has a separate one-page form identifying the key data for this study.
We understand for firms that have more than one midstream operation in ND or for those firms that have
operations crossing state borders (pipelines), it may not be clear how to separate some administrative
and centralized business expenses among those operations. In those cases, please use your best
judgement --a general estimate is sufficient.
In looking at what share of expenses are from ND sources, think of where your firm’s vendors and
suppliers are located. For example, if your firm was billed for a particular service from a firm located in ND
then 100% of that particular expense would be considered from ND sources. If your firm shipped in pipe
or replacement valves from a company in Oklahoma or Texas, then 0% of that expense would qualify as
being from ND sources.
The information provided in the following sheets will be aggregated and extrapolated to produce state totals.
The result of that process prevents any single firm or facility location from being identified in the economic
impact figures.
Part II: General Financial Characteristics

51
Gas Plants in ND
General Financial Operating Characteristics in 2017
Gross Revenue from Operation of Gas Plants $
Payroll
Number
Wages and Salaries1
Benefits2
Full-time jobs
$ $
Part-time and seasonal
$ $
Purchases of Raw Commodities for Processing
Natural Gas (include natural gas liquids) $
Taxes Paid in North Dakota (please exclude payroll taxes)
Property Tax
$
Sales and Use $
Corporate Income
$
Others (please list)
$
General Operating, Facility, and Overhead Expenditures (please exclude commodities, payroll,
and ND taxes)
Total Expenditure for Operating Gas
Plants in ND
Acquired from North Dakota
Sources
Examples: Equipment Electricity
$250,000 $80,000
30% 95%
Utilities (electricity, gas, water, sewer, garbage)
$ %
Repairs and Maintenance $ %
Equipment (vehicles, electric motors, pumps, storage
tanks, pipe, valves, etc.)
$
%
Contracted Services (advertising, legal, payroll, security,
IT support, engineering)
$
%
Office Expenses, Computers, Software, Communications
$
%
Rents, Leases, Loan Interest $ %
All other expenses $ %
$ %
1Wages, salaries, and bonuses for part-time, seasonal, and full-time employees. Please exclude payroll benefits.
2Includes payments for health, dental, and vision insurance, retirement contributions, unemployment taxes, FICA, and Workforce Safety Insurance contributions.

52
Oil Pipelines in ND
General Financial Operating Characteristics in 2017
Gross Revenue from Operation of Crude Oil Pipelines $
Payroll
Number
Wages and Salaries1
Benefits2
Full-time jobs
$ $
Part-time and seasonal
$ $
Purchases of Raw Commodities for Delivery
Crude Oil (if not applicable please enter NA) $
Taxes Paid in North Dakota (please exclude payroll taxes)
Property Tax
$
Sales and Use $
Corporate Income
$
Others (please list)
$
General Operating, Facility, and Overhead Expenditures (please exclude commodities, payroll,
and ND taxes)
Total Expenditure for Operating
Crude Oil Pipelines in ND
Acquired from North Dakota
Sources
Examples: Equipment Electricity
$250,000 $80,000
30% 95%
Utilities (electricity, gas, water, sewer, garbage)
$ %
Repairs and Maintenance $ %
Equipment (vehicles, electric motors, pumps, storage
tanks, pipe, valves, etc.)
$
%
Contracted Services (advertising, legal, payroll, security,
IT support, reclamation, engineering)
$
%
Office Expenses, Computers, Software, Communications
$
%
Rents, Leases, Loan Interest $ %
All other expenses $ %
$ %
1Wages, salaries, and bonuses for part-time, seasonal, and full-time employees. Please exclude payroll benefits.
2Includes payments for health, dental, and vision insurance, retirement contributions, unemployment taxes, and Workforce Safety Insurance contributions.
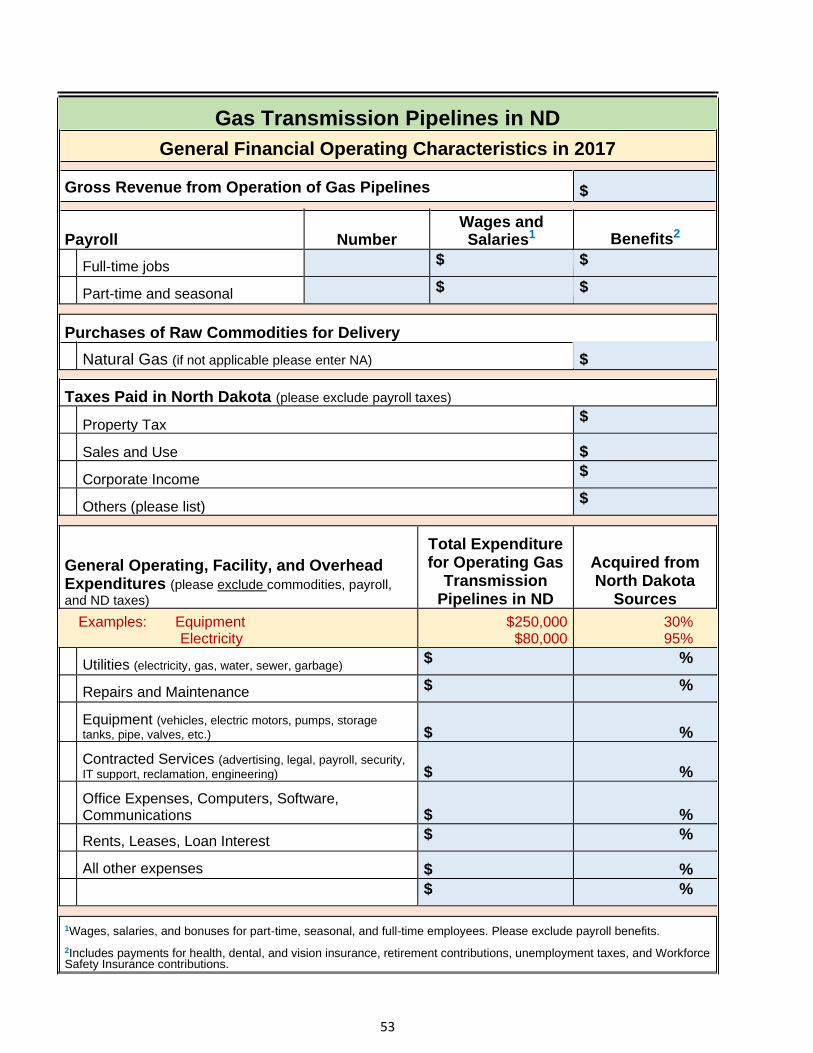
53
Gas Transmission Pipelines in ND
General Financial Operating Characteristics in 2017
Gross Revenue from Operation of Gas Pipelines $
Payroll
Number
Wages and Salaries1
Benefits2
Full-time jobs
$ $
Part-time and seasonal
$ $
Purchases of Raw Commodities for Delivery
Natural Gas (if not applicable please enter NA) $
Taxes Paid in North Dakota (please exclude payroll taxes)
Property Tax
$
Sales and Use $
Corporate Income
$
Others (please list)
$
General Operating, Facility, and Overhead Expenditures (please exclude commodities, payroll,
and ND taxes)
Total Expenditure for Operating Gas
Transmission Pipelines in ND
Acquired from North Dakota
Sources
Examples: Equipment Electricity
$250,000 $80,000
30% 95%
Utilities (electricity, gas, water, sewer, garbage)
$ %
Repairs and Maintenance $ %
Equipment (vehicles, electric motors, pumps, storage
tanks, pipe, valves, etc.)
$
%
Contracted Services (advertising, legal, payroll, security,
IT support, reclamation, engineering)
$
%
Office Expenses, Computers, Software, Communications
$
%
Rents, Leases, Loan Interest $ %
All other expenses $ %
$ %
1Wages, salaries, and bonuses for part-time, seasonal, and full-time employees. Please exclude payroll benefits.
2Includes payments for health, dental, and vision insurance, retirement contributions, unemployment taxes, and Workforce Safety Insurance contributions.

54
Oil Refining and Processing in ND
General Financial Operating Characteristics in 2017
Gross Revenue from Operation of Refineries $
Payroll
Number
Wages and Salaries1
Benefits2
Full-time jobs
$ $
Part-time and seasonal
$ $
Purchases of Raw Commodities for Processing
Crude Oil $
Other (please specify _ _ ) $
Taxes Paid in North Dakota (please exclude payroll taxes)
Property Tax $
Sales and Use
$
Corporate Income
$
Others (please list)
$
General Operating, Facility, and Overhead Expenditures (please exclude commodities, payroll, and ND taxes)
Total Expenditures in
ND
Acquired from North Dakota
Sources
Examples: Equipment Electricity
$250,000 $80,000
30% 95%
Utilities (electricity, gas, water, sewer, garbage)
$ %
Repairs and Maintenance $ %
Equipment (vehicles, electric motors, pumps, storage
tanks, pipe, valves, etc.)
$
%
Contracted Services (advertising, legal, payroll, security,
IT support, reclamation, engineering)
$
%
Office Expenses, Computers, Software, Communications
$
%
Rents, Leases, Loan Interest $ %
All other expenses $ %
$ %
1Wages, salaries, and bonuses for part-time, seasonal, and full-time employees. Please exclude payroll benefits.
2Includes payments for health, dental, and vision insurance, retirement contributions, unemployment taxes, and Workforce Safety Insurance contributions.

55
Gathering Systems in ND
General Financial Operating Characteristics in 2017
Gross Revenue from Operation of Gathering Systems $
Payroll
Number
Wages and Salaries1
Benefits2
Full-time jobs
$ $
Part-time and seasonal
$ $
Purchases of Raw Commodities
Crude Oil (if not applicable please enter NA) $
Natural Gas (if not applicable please enter NA) $
Taxes Paid in North Dakota (please exclude payroll taxes)
Property Tax $
Sales and Use
$
Corporate Income
$
Others (please list)
$
General Operating, Facility, and Overhead Expenditures (please exclude commodities, payroll, and ND taxes)
Total Expenditures for
Gathering Systems in ND
Acquired from North Dakota
Sources
Examples: Equipment Electricity
$250,000 $80,000
30% 95%
Utilities (electricity, gas, water, sewer, garbage)
$ %
Repairs and Maintenance $ %
Equipment (vehicles, electric motors, pumps, storage
tanks, pipe, valves, etc.)
$
%
Contracted Services (advertising, legal, payroll, security,
IT support, reclamation, engineering)
$
%
Office Expenses, Computers, Software, Communications
$
%
Rents, Leases, Loan Interest $ %
All other expenses $ %
$ %
1Wages, salaries, and bonuses for part-time, seasonal, and full-time employees. Please exclude payroll benefits.
2Includes payments for health, dental, and vision insurance, retirement contributions, unemployment taxes, and Workforce Safety Insurance contributions.

56
Rail Loading Facilities
General Financial Operating Characteristics in 2017
Gross Revenue from Operation of Rail Loading Facilities $
Payroll
Number
Wages and Salaries1
Benefits2
Full-time jobs
$ $
Part-time and seasonal
$ $
Purchases of Raw Commodities
Crude Oil (if not applicable please enter NA) $
Taxes Paid in North Dakota (please exclude payroll taxes)
Property Tax
$
Sales and Use $
Corporate Income
$
Others (please list)
$
General Operating, Facility, and Overhead Expenditures (please exclude commodities, payroll, and ND taxes)
Total Expenditures for
Rail Loading Facilities in ND
Acquired from North Dakota
Sources
Examples: Equipment Electricity
$250,000 $80,000
30% 95%
Utilities (electricity, gas, water, sewer, garbage)
$ %
Repairs and Maintenance $ %
Equipment (vehicles, electric motors, pumps, storage
tanks, pipe, valves, etc.)
$
%
Contracted Services (advertising, legal, payroll, security,
IT support, reclamation, engineering)
$
%
Office Expenses, Computers, Software, Communications
$
%
Rents, Leases, Loan Interest $ %
All other expenses $ %
$ %
1Wages, salaries, and bonuses for part-time, seasonal, and full-time employees. Please exclude payroll benefits.
2Includes payments for health, dental, and vision insurance, retirement contributions, unemployment taxes, and Workforce Safety Insurance contributions.

57
Disposal Wells
General Financial Operating Characteristics in 2017
Gross Revenue from Operation of Disposal Wells $
Payroll
Number
Wages and Salaries1
Benefits2
Full-time jobs
$ $
Part-time and seasonal
$ $
Purchases of Commodities
Brine/waste water (if not applicable please enter NA) $
Taxes Paid in North Dakota (please exclude payroll taxes)
Property Tax
$
Sales and Use $
Corporate Income
$
Others (please list)
$
General Operating, Facility, and Overhead Expenditures (please exclude commodities, payroll, and ND taxes)
Total Expenditures for Disposal Wells in
ND
Acquired from North Dakota
Sources
Examples: Equipment Electricity
$250,000 $80,000
30% 95%
Utilities (electricity, gas, water, sewer, garbage)
$ %
Repairs and Maintenance $ %
Equipment (vehicles, electric motors, pumps, storage
tanks, pipe, valves, etc.)
$
%
Contracted Services (advertising, legal, payroll, security,
IT support, reclamation, engineering)
$
%
Office Expenses, Computers, Software, Communications
$
%
Rents, Leases, Loan Interest $ %
All other expenses $ %
$ %
1Wages, salaries, and bonuses for part-time, seasonal, and full-time employees. Please exclude payroll benefits.
2Includes payments for health, dental, and vision insurance, retirement contributions, unemployment taxes, and Workforce Safety Insurance contributions.

58
Part III: Infrastructure Expenditures
This section relates to your company’s expenses associated with infrastructure development in
North Dakota. To avoid double counting, do not include any expenditures here that are reported as
general operating expenses. Please report total expenditures in 2017 for the following categories with
respect to infrastructure in North Dakota. Figures can be rounded to thousands.
If your company had no expenses in a particular category, please enter zero.
Infrastructure Categories Expenses for
projects in North Dakota in 2017
Oil Field Gathering Systems
Construction of oil pipeline gathering systems (field systems) to move
crude oil to transmission pipelines or rail facilities.
$
Gas Midstream Projects
Construction of gas gathering systems, construction of gas plants,
construction of fractionation facilities, and pipelines for distribution of gas
$
Oil Shipment Facilities
Facilities for shipment of crude oil, including pipeline capacity
enhancements, rail loading facilities, and any storage facilities
$
Water Treatment Facilities
Construction expenses for water disposal facilities, frac water recycling
facilities, and any distribution systems (in-field pipelines) for movement
of frac and brine water to treatment or disposal facilities.
$
Housing and Lodging
Include expenses associated with the construction/development
of man camps, lodging facilities at work sites, and construction of
other housing projects (e.g., company owned apartments and
houses).
NOTE: please include all lodging expenses for actual housing of workers
(motel rooms, meals, other arrangements) that are not related to
$
Office and Other Facilities
Expenditures for construction/development of company offices,
central facilities, maintenance facilities, and holding/transit
$
Other Facilities
$

59
59
Thank You for completing this questionnaire!
Please return the questionnaire in the postpaid envelope.
If you would like a copy of the study results mailed to you, make sure you have provided a mailing address
in Part I of the questionnaire. Otherwise, you may contact Edie Nelson in the Department of Agribusiness
and Applied Economics at North Dakota State University for more information on our departmental
reports. Phone 701-231 7441, fax 701-231-7400, email: [email protected] or visit our
departmental listing of research reports on the internet at http://agecon.lib.umn.edu
Study results should be available the end of 2018.

60
60
Economic Impact Modeling
Appendix B

61
61
Overview
Economic impact assessments measure the economic activity from a project, program,
policy, or activity. Economic activity is categorized into direct and secondary impacts. Direct
impacts are those changes in output, employment, or income that represent the initial or first-
round effects of a project, program, or event. Secondary impacts result from subsequent rounds
of spending and re-spending within an economy.
Direct economic impacts are usually measured as injections (or reductions) of money into
a specified economy. Direct impacts therefore represent inputs into an economic model to trace
linkages among sectors of an economy and calculate various forms of business activity resulting
from a direct impact in an economic sector.
Input-Output Analysis
Input-output analysis is a mathematical representation of the production and consumption
of goods and services within a given economy. The basic premise to input-output modeling can
be traced to economic base theory, or the understanding that a given economy is comprised of
both 1) economic sectors or industries which produce goods/services for export outside the
economy (basic sectors) and 2) economic sectors which produce goods/services within the
economy for use by those exporting industries (non-basic sector). However, most current I-O
modeling platforms do not limit economic activity in non-basic sectors to be driven or
determined entirely by basic sector output.
Input-output analysis is premised on the notion of inter-industry transactions, where
industries use products/services from other industries to generate their output, and outputs from
one industry usually represent inputs to another industry. The basis for the interdependence
(linkages) within input-output analysis between consuming and producing industries forms the
foundation for development of multiplier effects. Multiplier effects can then be used to estimate
how initial changes in economic activity result in economy-wide changes in a given area and
represent the core component of input-output analysis.
While input-output analysis is a popular methodology used by a host of different
stakeholders, the methodology has a number of fundamental assumptions or limitations. Key
assumptions in input-output methodologies include 1) the economy is in equilibrium, 2) any
expansion or contraction is linear, constant, and fixed, 3) no price and substitution effects, and 4)
no supply constraints. This means that I-O models are a static representation of an economy and
do not provide for dynamic adjustments that are likely to occur in an economy, especially those
relating to large, fundamental changes in the size or structure of an area’s key industries.
Since I-O models are widely available and used, output from those models is often
accepted without much scrutiny. Despite development and use of other modeling processes
(e.g., general equilibrium models) to mitigate the limitations and shortcomings of I-O modeling,
I-O analysis remains the most widely used approach to conducting economic impact and
contribution assessments.
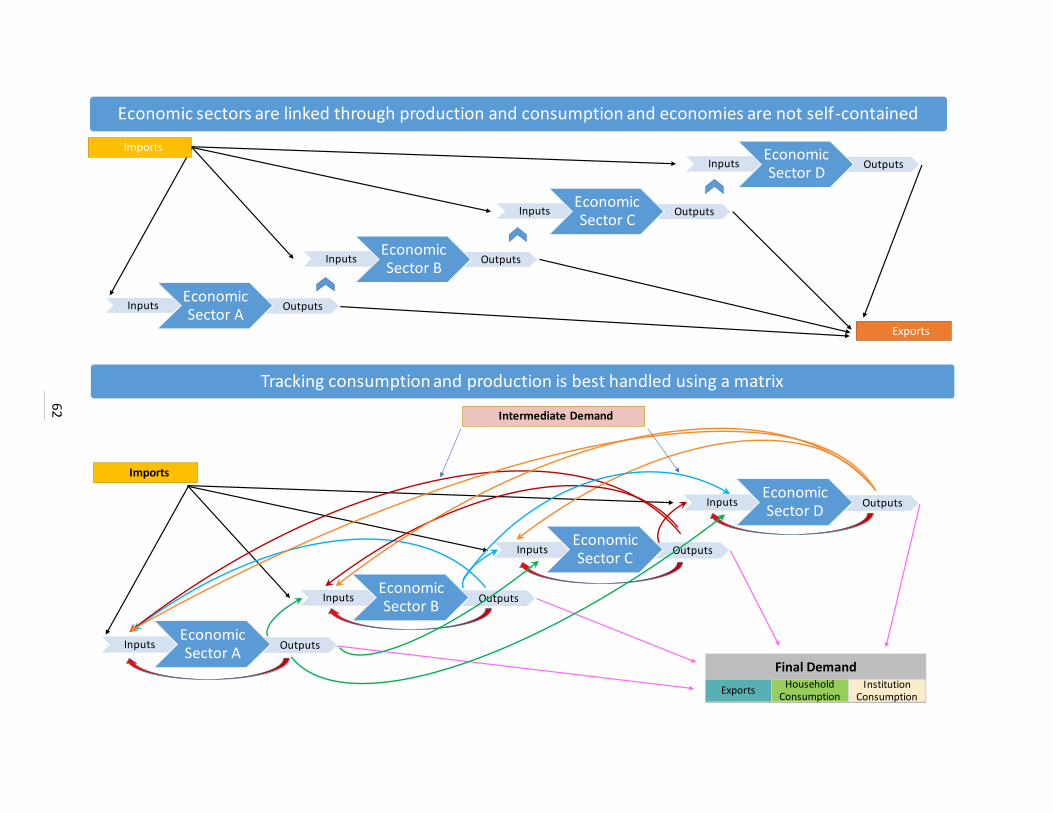
62
Economic Sector A
Inputs Outputs
Economic Sector B
Inputs Outputs
Economic Sector C
Inputs Outputs
Economic Sector D
Inputs Outputs
Exports
Imports
Economic sectors are linked through production and consumption and economies are not self-contained
Economic Sector A
Inputs Outputs
Economic Sector B
Inputs Outputs
Economic Sector C
Inputs Outputs
Economic Sector D
Inputs Outputs
Tracking consumption and production is best handled using a matrix
Imports
Final Demand
ExportsHousehold
Consumption
Intermediate Demand
Institution Consumption

63
Each industry is measured for its production and for its consumption. Rows are dollars spent on commodities (goods and services) by other economic sectors, households, and government.
Total gross output is the market value of all commodities and goods produced—total production must equal total consumption.
Column totals are expenditures (purchases) for commodities (goods and services), labor, and taxes.
GDP can be measured by examining consumption (sum of rows) or through the net value-added from production (sum of columns).
Industry
A
Industry
B
Industry
C
Industry
D
Industry
E
Industry
(n)
Private
Consump
tion
Private
Investme
nt
Net
ExportsGov't Total
Industry A
Industry B
Industry C
Industry D
Industry E
Industry (n)
Labor
Compensation
Taxes
Gross Surplus
Total
List of Consuming Sectors (called Industries)Li
st o
f P
rod
uci
ng
Ind
ust
ries
(cal
led
Co
mm
od
itie
s)
Intermediate Inputs Final Use (Final Demand)
Tota
l Gro
ss O
utp
ut
Total Gross Output
GDPValue-added
Institutions (considered Final Users)

64
Types of Economic Evaluations
Input-Output analysis provides a tool for economists to perform economic impact and
economic contribution analyses. These analyses can be applied to programs, projects,
developments, industries, and other economic activities. Key macro-economic indicators such as
retail trade activity, employment compensation, labor income, value-added output, total business
activity, secondary economic business activity (indirect and induced), selected government tax
collections, and secondary (indirect and induced) employment can be estimated using input-
output analysis.
Economic impact analysis estimates the change in key economic indicators resulting
from the ‘new’ dollars (either gained or lost) from a specific project or development within a
given economy. An economic impact analysis measures the net effect of two possible
situations–often these situations would be the presence or absence of some type of economic
activity, development, or program. Measures of the business activity generated in secondary
industries are included in economic impact figures.
Economic contribution analysis differs in that it includes all relevant revenues and
expenditures in the generation of the amount of economic activity created in an economic unit.
Economic contribution analyses attempt to capture all economic activity without regard to the
net change or value of alternative economic activities; therefore, economic contribution
assessments provide measures of the gross effects. Typically, an economic contribution analysis
will show more economic activity than found in an economic impact study for the same industry
or activity. Measures of the business activity generated in secondary industries are included in
economic contribution figures.
When comparing these economic analyses, it is important to know what type of study
was conducted so valid comparisons can be made. For a detailed discussion of these types of
analyses, see Leistritz (1994) and Leistritz (1998).
Key Definitions
Direct Economic Effects: Direct economic impacts represent the first-round of payments for
services, labor, and materials. Direct effects can be interpreted to represent jobs, labor income,
and business activity that comprise the Agriculture Industry.
Indirect Economic Effects: Indirect economic effects arise from the additional consumption of
goods and services triggered by businesses that supply inputs to firms in a given sector/industry.
Indirect effects can be interpreted as the additional economic activity created through purchases
by businesses.
Induced Economic Effects: Induced economic effects arise from the additional spending by
households from changes in personal income associated with direct effects and indirect effects.
Changes in personal income can come from payrolls of businesses that are directly impacted,
changes in payroll from businesses that supply goods and services to an impacted sector (induced
effects), and proprietor income resulting from a change in business volume. Induced effects
measure the additional business activity that is triggered as changes in personal income are

65
translated into the purchase of goods and services for personal consumption.
Value-added Effects: Value-added economic activity is a measure of the payment to labor and
capital, and includes labor income, business taxes, and business/proprietor income (profit). This
economic effect is sometimes referred to a measure of the value that is added to purchased inputs
by a business or industry, and is analogous to gross state product. The use or consumption of
goods and services in the production of another good or service is not included in value-added
measures.
Total Economic Output: Total output is a measure of the business activity created by summing
direct economic effects, indirect economic effects, and induced economic effects. This
economic measure is sometimes called gross business volume. Total output therefore represents
the sum of gross receipts of all economic sectors.
Employment and Employment Compensation: Employment is perhaps one of the most
important economic measures associated with impact assessments. Direct employment
represents the jobs employed by the business or economic sector for which the activity or event
is being modeled. I-O analysis also estimates employment associated with indirect and induced
economic effects. Changes in employment compensation include wages, salaries, and
employment benefits linked to changes in employment levels.
Proprietor Income: Income to individuals associated with sole proprietorships, partnerships,
tax-exempt cooperatives, or other self-employment. Does not include any dividends, interest, or
rental income, but does include capital consumption allowance found on Federal Tax form
1040C. Individuals receiving Tax Forms 1099 would be counted as sole-proprietors and
compensation would be treated as proprietor income.
Labor Income: Labor income is often interchanged with employment compensation, but labor
income is a broader measure of payments to labor since it includes employment compensation
and proprietor income.
Government Revenue: Changes in revenues to state and local governments are another
important measure in most contribution studies. I-O models estimate changes in selected
government revenues such personal income, sales and use, corporate income, severance, and
property taxes, and a variety of miscellaneous revenues such as permits, fees, licenses, and
dividends. Government revenues are not generally additive to economic effects, as most
government revenues are either imputed internally or directly comprise a component of an
industry balance sheet.
Other Property-type Income: These economic values can be defined as Gross Operating Surplus
less Proprietor Income (BEA defines GOS as gross output less intermediate inputs, employee
compensation, and taxes on production and imports less subsidies). The consumption of fixed
capital (i.e., capital outlays for most depreciable assets) is included, along with corporate profits
and business transfer payments (net of government subsidizes).
Indirect Business Taxes: Can be generally considered as the sum of sales, property, and excise
taxes. This category also includes fines, licenses, permits, and fees. Another perspective is that

66
the category of indirect business taxes are those taxes/nontax liabilities (i.e., any business
liability to governments than are treated like a tax) that can be included as business expenses
when estimating business profit.
Selection of Input-output Model
The Department of Agribusiness and Applied Economics at NDSU developed an I-O model for
North Dakota that dates back to the 1960s and was an important tool examining energy
development projects in the state during the 1970s. The basic data for the model came from
surveys of firms and businesses in the state, and key economic statistics included a
corresponding data set defining state-level net exports (economic base), employment
productivity ratios, and tax coefficients. The model and supporting economic data were widely-
used for examining economic impact and economic contribution effects in the region. Finally,
maintenance and use of the North Dakota Input-output Model was suspended in 2018 as
personnel and resources were no longer available to support the model. This prompted the
impact assessment research team, spearheaded jointly by Dean Bangsund, Department of
Agribusiness and Applied Economics, and Dr. Nancy Hodur, Director, Center for Social
Research, to adopt a new modeling platform.
A number of commonly used input-output models are available for conducting impact
assessments for North Dakota. Publicly available models include RIMS II (Regional Input-
Output Modeling System), IMPLAN (Impact Analysis for Planning), REMI (Regional Economic
Models Inc.), and EMSI Analytics (Economic Modeling Specialists). There are other
commercial models that are 1) not available for state-level analysis (e.g., REdyn, which
combines I-O factors with CGE processes but is only used for the US national economy), 2)
specialized in fiscal effects and do not provide the same degree of impact assessment as the more
common I-O models (e.g., LOCI, which only examines government costs of various types of
impacts), and 3) built with varying degrees of sophistication primarily targeting subject-matter
issues (e.g., JEDI-NREL that examines some economic impacts of constructing and/or operating
energy-based facilities).
REMI was considered the best option from an empirical capacity, but the cost of acquiring the
model and subscribing to annual baseline data updates was prohibitive. RIMs II is inexpensive,
but the analytical capacity is substantially limited, and does not have any baseline or supporting
data sets. IMPLAN was chosen as the modeling system is supported with detailed baseline data,
and cost was not prohibitive.

67
IMPLAN Modeling System
IMPLAN modeling system is a popular input-output methodology because of its flexibility and
customizability for structuring economic scenarios and ease of access to key data sets used in the
modeling process (IMPLAN Group, LLC 2013). IMPLAN can be structured to evaluate
economic effects through a number of model operations. Those operations range from change in
sales for an entire industry to personal spending patterns for households with a specific income
level. The flexibility to structure an assessment using multiple economic criteria, along with
customization of baseline data, allow IMPLAN to be tailored to most economic conditions.
IMPLAN modeling system uses a variety of data sets to construct the I-O model. In general,
those data sets begin with federal data, work through regional and state-level economic statistics,
and if available, attempt to combine information for counties or other smaller geographic units.
[see www.implan.com for more detail regarding data sets used to construct the model].
Major Data Sources, IMPLAN Modeling Platform, Economic Information Agency Program Data Set(s)
U.S. Bureau of Labor
Statistics
Unemployment Insurance Covered
Employment and Wages Program
CEW (ES-202)
Consumer Expenditure Survey CE LABSTAT
U.S. Bureau of Economic
Analysis
National Income and Product
Accounts
Regional Economic Accounts
Benchmark I-O Accounts
SA7, SA27, SA06,
SA05, SA25, CA05,
CA06, CA25, KLEM
U.S. Census Bureau Numerous Census Surveys and
Programs
ACES, ARTS, ASE,
ASM, APES, ASPP,
STC, AWTS, BES,
COG, CBP, CIR, EC,
IA, GUS, ICT, MHS,
NES, QTAX, SAS
Construction Definitions and
Spending
Decennial Census and Population
Surveys
CPS, Decennial Census,
ACS
USDA --
National Agricultural
Statistics Service, and
Economic Research Service
Quinquennial Assessments and
Annual Surveys
Census of Agriculture
Annual Agricultural
Statistics
Agriculture Resource
Management Survey

68
IMPLAN modeling system is a widely used and well-recognized source of economic data—this
process is desirable because it allows for consistency and compatibility across regional, state,
and sub-state economies. However, not all industries within all economies are accurately
represented using federal, state, and local secondary data in combination with IMPLAN baseline
data generation techniques (Bangsund and Hodur 2018a,b; Bangsund and Hodur 2012; Downes
2012; Taylor 2013; Booz Allen 2008). To address potential problems, IMPLAN has built
flexibility into the modeling system so that local or other primary data can be substituted for
default values within the model.
IMPLAN uses a Double Constrained Gravity Model, along with several databases to estimate
trade flows in various economic geographies. In the most general sense, gravity models work
with the mass of demand and supply of commodities, and are constrained so that imports into a
region do not exceed demand and exports from a region do not exceed available supply.
IMPLAN uses data from Center for Transportation Analysis at Oak Ridge National Laboratory
(ORNL) on travel impedances (based on a commodity’s modal mix as reported by the
Commodity Flow Survey) to serve as the distances in IMPLAN’s gravity model. ORNL also
provides the circle distances between county centroids — those are used to calibrate the gravity
model to Commodity Flow Survey data. Commodity Flow Survey (CFS) and Freight Analysis
Framework (FAF) data are used to calibrate the gravity model to estimate trade flows between
economic geographies. The two data sets contain information on the value, weight, distance
traveled, transportation mode, and origin and destination (i.e., state) of the shippable
commodities. These commodities are classified according to the standard classification of
transported goods (SCTG) system, and the survey data are typically reported at the two-digit
SCTG level.

69
Use of Financial Information to Construct or Adjust Industry Balance Sheets
IMPLAN organizes financial information for industries in a manner different from traditional
enterprise budgets or income statements. Despite these seemingly unrelated financial data,
financial data for any particular business or economic sector can be used to customize an
industry balance sheet. In the case of production agriculture, cost-of-production budgets are
helpful in constructing industry balance sheets. Financial statements for firms or businesses also
can serve to adjust or construct an industry balance sheet; however, accounting terms, income
and expense categories, and treatment of debt, capital outlays, and taxes will not necessarily
match perfectly to the industry balance sheet components.

70
Components of Economic Profile Sales / Output The value of an industry's production for the year and represents the
sum of sales to final users in the economy (GDP) plus sales to other
industries (intermediate inputs) and change in inventory.
Payroll Includes all wages and salaries, all benefits, and all payroll taxes for
employees.
Proprietor Income Consists of payments received by self-employed individuals and
unincorporated business owners. However, additional items include
income of partnerships and tax-exempt cooperatives, dividends
(payments in cash or other assets, monetary interest received by
nonfinancial business, and rental income received by persons not
primarily engaged in the real estate business).
Other Property
Type Income
Represents gross operating surplus minus proprietor income, and
includes consumption of fixed capital, corporate profits, and business
current transfer payments (net), income derived from dividends,
royalties, corporate profits, interest income, and is a source of income
for households, business, and governments. OPTI is treated as an
economic leakage to the study region such that any OPTI generated as
part of an analysis will not generate any additional economic effects.
Taxes on
Production and
Imports
Includes sales and excise taxes, customs duties, property taxes, motor
vehicle licenses, severance taxes, other taxes, and special assessments.
This category is net of subsidies and therefore can be negative for an
industry in a given year if that industry received more subsidies from
the government than it paid out in the above taxes in that year. Social
insurance taxes are placed in payroll and income taxes are part of
Other Property Type Income.
Intermediate Inputs Purchases of goods and services used for the production of other
goods and services rather than used for final consumption. These
inputs do not include capital purchases nor do they include the
expenses for capital and labor.
Sources: IMPLAN 2020; DA Bangsund, Department of Agribusiness and Applied
Economics, NDSU

71
Economic Sector Organization and Use within IMPLAN Source: DA Bangsund, Department of Agribusiness and Applied Economics, NDSU.
-) Sets level of Direct Impacts
-) Used to describe multipliers
-) Used to measure contribution to GSP
-) Payroll and Proprietor Income primarily driver of Induced Effects
-) Level of capital expenditures derived from Other Property Type Income
-) A key driver of business volume
-) Important in estimating multipliers
-) Intermediate Inputs primary driver of Indirect Effects

72
IMPLAN Mapping
IMPLAN uses a variety of mechanisms, or economic triggers, to introduce a direct
impact into a specified economy. Using a variety of mechanisms is one of the key attributes of
the model that provide substantial flexibility in tailoring assessments to match expected
economic activity.
An Industry Change represents adjusting the demand for the goods and services
produced by an economic sector by varying that sector’s revenue. Within this context, changes
in sector gross revenues automatically result in changes in required labor, goods and services
used to produce the sector’s output (intermediate inputs), taxes on production and inputs (e.g.,
sales tax, property tax), and sector income. After setting the level of revenue change for an
economic sector, IMPLAN allows custom values for employment, employment compensation,
and sector income to be entered if default values are not desired.
Industry Spending Patterns can be used to change an economic sector’s use of
intermediate inputs without triggering changes in revenues, labor expenses or requirements, or
sector income. The specific input is the sum of the total expenses that are expected to be
changed by that economic sector.
Labor Income Change is not specific to an economic sector, rather it introduces an
increase in the payment for labor inputs within an economy. This approach also by-passes the
need to change other aspects of an industry’s balance sheet to achieve a change in labor income;
however, the Labor Income Change requires a manual (i.e., calculated outside of the IMPLAN
model) estimate of the change in direct employment based on assumptions for payroll expenses
per job.
Household Income Change is used when personal spending capacity within an economy
is increased, but there is not necessarily any direct link to output changes in any particular
economic sector or when personal spending capacity is not directly linked changes in labor
income. These types of changes in household income might be represented by income from
royalties, trusts, easements, gifts, inheritances, lotteries, and social transfer payments.
Institutional Spending Patterns are used to estimate how changes in public sector
revenues influence the consumption of goods and services by government entities, educational
institutions, non-profits and other non-governmental organizations. Institutional Spending
Patterns also provide options for household spending patterns by income levels, which can be
used to approximate the consumption of goods and services by households.

73
Mechanisms for Introducing Economic Effects into an Economy, IMPLAN Pro Software IMPLAN Activity Description
Industry Change Represents a change in sales or revenue to an economic sector. Increases/decreases in sales, unless manually overrode within the model, will automatically produce increases/decreases in employment, employment compensation, purchases of intermediate inputs, and profits based on the economic sector’s balance sheet.
Industry Spending Pattern Represents the expenses for goods and services used by an economic sector, and provides for adjustments in the percentage of those individual goods and services acquired within a specified economy.
Labor Income Change Represents a general change in wages, salaries, and benefits within a specified economy.
Household Income Change Represents a general change in the amount of personal income available to households in the specified economy.
Institutional Spending Pattern Represents the proportional consumption of goods and services by governments, schools, and non-profits per unit of revenue. Includes spending patterns estimating personal consumption of goods and services by households.
Source: DA Bangsund, Agribusiness and Applied Economics, NDSU

74
IMPLAN Fiscal Analysis Methodology
IMPLAN estimates fiscal impacts by examining total government revenues from a variety of
data sources. The model then estimates the share of government revenues based on the
individual source of revenue (e.g., sales tax, income tax, severance tax, fees, and licenses).
IMPLAN compares total government revenues, from all sources, with total industry output from
all sectors in the economy. That process produces an estimate of tax revenue per unit of average
industry output (e.g., gross sales, state gross product). The model does not estimate tax
collections stemming from individual economic sectors or industries. Therefore, to estimate the
fiscal impacts of a project, program, or activity, IMPLAN estimates the change in economy-wide
business output, and then estimates the fiscal effects by multiplying that change in business
output by the ratio of government revenues to economy-wide output. This process produces a
direct relationship between expected new government revenues and a change in industrial or
economic output.
Shortcomings and limitations of IMPLAN’s fiscal impact methodology in North Dakota include.
A.IMPLANs fiscal impact methodology is locked on the premise that all government
revenues are intrinsically linked to changes in economy-wide economic output. This
relationship is embedded within IMPLANs default tax ratios and leads IMPLAN to
generate large changes in some tax revenues even when direct causation is not contained
in the economic assessment (i.e., without linking an economic impact to a specific change
in a tax base or tax rate, or linking tax revenues on a per-sector basis). For some tax
revenues, such as severance taxes, that methodology produces erroneous estimates. For
other tax revenues, general economic output is a reasonable proxy for estimated changes
in tax revenues.
B.IMPLAN’s fiscal impact methodology cannot be adjusted internally to reflect state
rules and stipulations affecting the specific taxes relating to unique conditions or special
treatment that adjusts the tax base or tax rate.
IMPLAN Fiscal Data Sources and Treatment of Tax Data
IMPLAN’s tax impact report values are based on the existing relationships of the data found in
the IMPLAN database. The sources for these data are listed below, followed by description of
each data element in the tax impact report.
• NIPA Tables. All items in the IMPLAN data sets are ultimately controlled to the U.S.
level values from the Bureau of Economic Analysis’ (BEA) National Income and Product
Accounts (NIPA). Section 3 of the NIPA tables covers Government Current Receipts and
Expenditures.
• Consumer Expenditure Survey (CES). The U.S. Census Bureau annually conducts
surveys and diary samplings of household expenditure patterns (the CES). The survey
data are reported for nine different categories of household income, which we control to
the NIPA’s Personal Consumption Expenditure (PCE) totals (which are not split out by

75
income category). From these data, we can establish the tax-to-income relationships for
the nine different household income categories. It is based on these relationships that we
can distribute many of the national-level tax data to states and state-level tax data to
counties, using the number of households in each of the nine household categories in the
state or county.
• Annual Survey of State and Local Government Finances (SLGF). The U.S. Census
Bureau also collects annual State/Local Government receipts and expenditures data.
These data act as preliminary controls for state-level values (subject to controlling to the
national NIPA values). They also give us the proportional split of the TOPI value
amongst the various types (sales, property, etc.). The actual value of total TOPI (at the
state level) comes from the BEA's REA series.
• The annual survey also provides local government collections by tax type. We use
these data to estimate, for the total state/local tax receipts, the share of each type
of tax that belongs to local government. We then use data for each local
government to apportion that local total (at the state level) to each county. Since
we know the local total for each county, we can distinguish the state and local tax
revenue in the tax impact report. In IMPLAN Online, the tax impact report
includes 4 types of governments that compose State/Local Government:
• State government
• County government
• Sub-county general government, which includes city and township
governments, for example
• Sub-county special government, which includes fire and public school
districts, for example
• We supplement gaps in the SLGF with 5-year Census of Governments data, and
supplement the SLGF state tax revenue with current-year state tax collections data
from Census.
• Regional Economic Accounts (REA). The Bureau of Economic Analysis collects and
reports income, wealth, tax, and employment data on a regional, state and county basis.
The REA data from these two tables are used to distribute the U.S. NIPA values to states
and counties:
• Table CA05 -- Personal Income by Major Source and Earnings by
Industry
• Table SA50 -- Personal Tax and Non-tax Payments

76
IMPLAN Tax Identification Scheme
Description
Employee
Compens-
ation
Proprietor
Income
Tax on
Production
and Import
House
holds
Corpor-
ations
State and Local Taxes Dividends O
Social Ins Tax- Employee
Contribution A C
Social Ins Tax- Employer
Contribution B
Tax on Production and Imports:
Sales Tax D
Tax on Production and Imports:
Property Tax E
Tax on Production and Imports:
Motor Vehicle Lic F
Tax on Production and Imports:
Severance Tax G
Tax on Production and Imports:
Other Taxes H
Tax on Production and Imports:
S/L NonTaxes I
Corporate Profits Tax P
Personal Tax: Income Tax J
Personal Tax: NonTaxes (Fines-
Fees K
Personal Tax: Motor Vehicle
License L
Personal Tax: Property Taxes M
Personal Tax: Other Tax
(Fish/Hunt) N
Federal Taxes Social Ins Tax- Employee
Contribution Q S
Social Ins Tax- Employer
Contribution R
Tax on Production and Imports:
Excise Taxes T
Tax on Production and Imports:
Custom Duty U
Tax on Production and Imports:
Fed NonTaxes V
Corporate Profits Tax X
Personal Tax: Income Tax W
Source: IMPLAN (2020).

77
The following definitions and sources are provided by IMPLAN Group LLC (2018) and
correspond with labeling in the IMPLAN Tax Identification Scheme.
Employee-paid portion for State/Local social insurance. This represents
retirement plans and temporary disability insurance. The U.S. value comes from
National Income and Products Accounts (NIPA) Table 3.6. This value is
distributed to states based on each state’s share of the following items from the
State and Local Government Finances report (SLGF).
Employee Retirement – Local Employee Contribution;
Employee Retirement – State Employee Contribution;
Workers Compensation – Other Contributions.
These state values are distributed to counties based on each county’s proportion of
the state’s State/Local Government Non-Education Employee Compensation. The
county-level State/Local Employee Compensation figures come from U.S. Bureau
of Economic Analysis. These are then split into Education vs. Non-Education
using various data from the U.S. Census Bureau and the U.S. Department of
Education.
Employer-paid portion for State/Local social insurance funds. This represents
workers’ compensation and temporary disability insurance. The U.S. value comes
from NIPA Table 3.6. This value is distributed to states and based on each state’s
share of the following items from the SLGF:
Employee Retirement – From Local Government;
Employee Retirement – From State Government;
Unemployment Compensation – Contribution;
Workers Compensation – Own Contributions.
County distribution is based on county portion of state and local government non-
education employee compensation from IMPLAN.
State/Local social insurance paid by self-employed. Self-employed individuals
do not make payments to State/Local government, so this entry will always have a
value of $0.
Sales Taxes on “Other Property Type Income” (TOPI) paid to State and
Local Governments. The U.S. value comes from NIPA Table 3.5. The U.S.
value is distributed to states based on each state’s proportion of Total General
Sales Tax from the SLGF. State government values are then distributed to counties
based on total retail output.

78
TOPI property taxes paid to State and Local Governments. The U.S. value
comes from NIPA Table 3.5. The U.S. value is distributed to states based on each
state’s proportion of Total Property Tax from the SLGF. State government values
are then distributed to counties based on total Personal Income from the BEA’s
CA05 table.
TOPI motor vehicle license taxes paid to State and Local Governments. The
U.S. value comes from NIPA Table 3.5. The U.S. value is distributed to states
based on each state’s proportion of Motor Vehicle Operator’s License Tax and
Motor Vehicle License Tax from the SLGF. State government values are then
distributed to counties based on total Personal Income from the BEA’s CA05
table.
TOPI severance taxes paid to State and Local Governments. The U.S. value
comes from NIPA Table 3.5. The U.S. value is distributed to states based on each
state’s proportion of Severance Tax from the SLGF. State government values are
then distributed to counties based on total Personal Income from the BEA’s CA05
table.
TOPI other taxes paid to State and Local Governments. This item consists
largely of business licenses and documentary and stamp taxes. The U.S. value
comes from NIPA Table 3.5. The U.S. value is distributed to states based on each
state’s proportion of the following tax items from the SLGF: Corporation License;
Amusement License; Other License; Documentary & Stock Transfer; Public
Utility License; Alcoholic Beverage License; Occupation & Business License,
NEC; and NEC. State government values are then distributed to counties based on
total Personal Income from the BEA’s CA05 table.
TOPI non-taxes paid to State and Local Governments. This item includes rents
and royalties, special assessments, fines, settlements, and donations. The U.S.
value comes from NIPA Table 3.5. The U.S. value is distributed to states based
on each state’s proportion of the following tax items from the SLGF:
Miscellaneous – Rents; Miscellaneous – Special Assessments; Miscellaneous –
Royalties; and Miscellaneous – Donations from Private Sources. State government
values are then distributed to counties based on total Personal Income from the
BEA’s CA05 table.
Personal income tax payments to State and Local Governments. The U.S.
value comes from NIPA Table 3.3. The U.S. value is distributed to states based on
Individual Income Tax from the SLGF. State government values are then
distributed to counties based on total Personal Income from the BEA’s CA05
table.

79
Personal non-tax payments to State and Local Governments. This item
includes payments for fines and donations. The U.S. value comes from NIPA
Table 3.3. The U.S. value is distributed to states based on Motor Vehicle License
Tax from the SLGF. State government values are then distributed to counties
based on total Personal Income from the BEA’s CA05 table.
Personal motor vehicle fee payments to State and Local Governments. The
U.S. value comes from NIPA Table 3.4. The U.S. value is distributed to states
based on Miscellaneous – Fines & Forfeits from the SLGF. State government
values are then distributed to counties based on total Personal Income from the
BEA’s CA05 table.
Personal property tax payments to State and Local Governments. The U.S.
value comes from NIPA Table 3.4. The U.S. value is distributed to states based on
Property Tax from the SLGF. State government values are then distributed to
counties based on total Personal Income from the BEA’s CA05 table.
Personal other tax payments to State and Local Governments. This item
consists largely of hunting, fishing, and other personal licenses. The U.S. value
comes from NIPA Table 3.4. The U.S. value is distributed to states based on
Hunting and Fishing License Tax from the SLGF. State government values are
then distributed to counties based on total Personal Income from the BEA’s CA05
table.
State/Local Government Dividends. This item represents net dividend payments
to government by corporations from investments. The U.S. value comes from
NIPA Table 3.3. The U.S. value is distributed to states based on the following
items from the SLGF:
Employee Retirement – Securities – Mortgages;
Employee Retirement – Securities – Corporate Stocks;
Employee Retirement – Securities – Corporate Bonds;
Employee Retirement – Total Other Securities.
State government values are distributed to counties is based on their proportion of
state Other Property Income (from IMPLAN database).
State/Local Government corporate profits tax. The U.S. value comes from
NIPA Table 3.3. The U.S. value is distributed to states based on Corporate Net
Income Tax from the SLGF. State government values are then distributed to
counties is based on counties based on their proportion of the state’s Other
Property Income (from IMPLAN database).

80
Employee-paid portion for Federal social insurance. This item includes social
security, survivors insurance, disability insurance, hospital insurance,
supplemental medical insurance, unemployment insurance, veterans’ life
insurance, and railroad retirement plans. The U.S. value comes from NIPA Table
3.6. The U.S. value is distributed to states and counties based on Personal
Contribution for Social Insurance from the BEA’s CA05 table.
Employer-paid portion for Federal social insurance. This item includes social
security, survivors insurance, disability insurance, hospital insurance, military
medical insurance, unemployment insurance, pension benefit guaranty, veterans’
life insurance, and railroad retirement plans. The U.S. value comes from NIPA
Table 3.6. The U.S. value is distributed to states and counties based on Personal
Contribution for Social Insurance from the BEA’s CA05 table.
Self-Employed contribution to Federal social insurance. This item includes
social security, survivors insurance, disability insurance, and hospital insurance.
The U.S. value comes from NIPA Table 3.6. The U.S. value is distributed to states
and counties based on Personal Contribution for Social Insurance from the BEA’s
CA05 table.
TOPI Federal Excise Taxes. This item includes federally levied excise taxes on
alcohol, tobacco, telephones, coal, fuels, air transportation, vehicles, etc. The
U.S. value comes from NIPA Table 3.2. The U.S. value is distributed to states and
counties based on IMPLAN estimates of total TOPI for all industries in
relationship to U.S. total TOPI.
TOPI Federal Custom Duties. These are gross collections less refunds. The U.S.
value comes from NIPA Table 3.2. The U.S. value is distributed to states and
counties based on IMPLAN estimates of total TOPI for all industries in
relationship to US total TOPI.
TOPI Federal Non-taxes. This item includes rents and royalties4. The U.S. value
comes from NIPA Table 3.2. The U.S. value is distributed to states and counties
based on IMPLAN estimates of total TOPI for all industries in relationship to U.S.
total TOPI.

81
Personal Income taxes paid to the Federal Government. These are taxes paid
through withholding, declarations and final settlement less refunds. The U.S. value
comes from NIPA Table 3.2. The same value can also be found in NIPA Table
3.4. The U.S. value is distributed to states based on each state’s value of “Federal
government: Individual Income taxes (net of refunds)” from the BEA’s SA50
table. State values are then distributed to counties based on total Personal Income
from the BEA’s CA05 table.
Federal Corporate profits tax. The U.S. value comes from NIPA Table 3.2. The
U.S. value is distributed to states and counties based on their proportion of U.S.
Other Property Income (from IMPLAN database).

82
Definition of Government Revenues Produced by IMPLAN Government Level Definition
State and Local Government Revenues
Dividends State and Local government dividends represents dividend
payments to government by corporations from investments.
Social Insurance Taxes:
Employee Contribution
The social insurance contributions paid by state employees
towards state-sponsored pensions, in lieu of social security.
Social Insurance Taxes:
Employer Contribution
The social insurance contributions paid by the State towards State
sponsored pensions, in lieu of social security.
Indirect Business Tax: Sales
Tax Sales taxes paid to State and Local government.
Indirect Business Tax:
Property Tax
Real estate based property taxes paid by firms to State and Local
governments. Because of the special situation encountered with
Sector 361, this includes payments of property taxes made on
homes.
Indirect Business Tax: Motor
Vehicle
Motor vehicle license taxes paid by firms to State and Local
governments.
Indirect Business Tax:
Severance Tax Taxes imposed by a State on the extraction of natural resources.
Indirect Business Tax: Other
Taxes
Other taxes paid to State and Local governments include business
licenses, documentary and stamp taxes.
Indirect Business Tax: S/L
Non-taxes
IBT state and local non-tax payments include fines (such as
parking and speeding tickets), fees (State and County park passes
or day fees) and donated funds.
Corporate Profits Tax Corporate profits taxes paid to State and Local governments.
Personal Tax: Income Tax
Income taxes paid by individuals to State and Local Government
through withholding, declarations and final settlement, less
refunds.
Personal Tax: Non-taxes
(fines and fees)
Household personal nontax payments to State and Local
governments include fines, donations, passport and immigration
fees, and migratory bird-hunting stamps.
Personal Tax: Motor Vehicle
Licenses
Household personal motor vehicle fee payments to State and
Local governments.
Personal Tax: Property
Taxes
Household personal property tax payments to State and Local
governments. Dividend, interest, and rental income of persons
with capital consumption adjustment are sometimes referred to as
property income.
Personal Tax: Other Tax
(Fishing/Hunting)
Other taxes consist of miscellaneous fees and licenses (such as
hunting and fishing licenses, marriage licenses, registration of
pleasure boats, and licenses for pets) to State and Local
governments.

83
Federal Government Revenues
Social Insurance Taxes:
Employee Contribution
The employee paid portion for Federal social insurance. These
contributions include payments by employees, the self-employed,
and other individuals who participate in the following government
programs: Old-age, survivors, and disability insurance (social
security, FICA); hospital insurance; supplementary medical
insurance; unemployment insurance; railroad retirement; veterans
life insurance; and temporary disability insurance.
Social Insurance Taxes:
Employer Contribution
The employer paid portion for Federal social insurance. This
includes social security, unemployment insurance, medical and
retirement plans.
Indirect Business Tax: Excise
Taxes
Includes Federally levied excise taxes on alcohol, tobacco,
telephones, coal, fuels, air transportation, vehicles, etc.
Indirect Business Tax:
Custom Duty Custom duties are gross collections net refunds.
Indirect Business Tax: Non-
Taxes
IBT Federal non-tax payments include petroleum royalties, fines,
regulatory fees, forfeitures and donated funds.
Corporate Profits Tax: Corporate profits taxes paid to Federal governments.
Personal Tax: Income Tax
Income taxes paid by individual to the Federal Government
through withholding, declarations and final settlement, less
refunds.
Source: IMPLAN Group (2020).

84
Reconstructed Economic Sectors for IMPLAN, Petroleum Industry, North Dakota, 2015, 2017 and 2019
Appendix C

85
Appendix Table C1. Input-Output Modeling Industry Components, Default IMPLAN Data and Customized Values, Well Development and Oil and Gas Extraction, Petroleum Industry, North Dakota, 2019
IMPLAN Industries (sectors) and Industry Balance Sheet Components
IMPLAN Default Study Values Estimation and Adjustment Data Sources
Sector 20 (Extraction of Natural Gas and Petroleum) and Sector 21 (Extraction of Natural Gas Liquids)
Employment 5,249 2,742 Use of BLS QCEW data to remove royalty and investment individuals from IMPLAN data BLS data NAICS 2111
Output (sales) 3,554,660,222 25,803,824,311 Oil and gas quantity x value (first purchaser prices) less oil field services’ share of IMPLAN sector 36 NDDRM / NDOSTC
Employee Compensation (EC) 365,695,631 460,481,033 Wages/salaries adjusted to obtain employment compensation BLS/IMPLAN
Proprietor Income (PI) 52,788,369 4,117,786,733 Sole proprietor income plus private and tribal royalties (net of severance taxes)* ONRR/NDSU Survey
Other Property-type Income (OPTI) 421,374,587 14,869,424,270 Sales minus (EC, PI, TPI, & Intermediate Inputs) calculation
Tax on Production and Imports (TPI) 939,570,585 3,026,594,652 Severance tax, property tax, sales taxes, public royalties, misc. government fees NDOSTC/NDSU Survey
Total Value-added (VA) 1,779,429,172 22,474,286,688 Sum of EC, OPTI, PI & TPI calculation
Intermediate Inputs 1,775,231,049 3,329,537,623 $/BOE production expenses x BOE produced, Intermediate Inputs plus VA must equal Sales NDSU Survey
*Royalties would normally be assigned to OPTI, but royalties were run through as proprietor income, and output for induced effects were subsequently reduced by the share of induced going to proprietor income, and those values were subsequently adjusted to account for only rates of in-state spending for royalties received by in-state mineral owners.
Sector 37 (Drilling Oil and Gas Wells)
Employment 3,448 2,928 Use of BLS QCEW data to remove uncovered workers from IMPLAN data BLS data NAICS 2111
Output (sales) 1,630,686,465 1,247,411,311
Estimate of the portion of total well drilling costs allocated between IMPLAN sectors 37 and 38. Just for clarification, not all welling drilling costs are allocated to sectors 37 and 38.
NDSU Survey / NDDMR/IMPLAN
Employee Compensation (EC) 399,133,856 386,070,503 Wages/salaries adjusted to obtain employment compensation BLS/IMPLAN
Proprietor Income (PI) 22,144,991 16,940,051 Ratio analysis using IMPLAN data IMPLAN
Other property-type Income (OPTI) 435,158,339 90,552,383 Sales minus (EC, TPI, & Intermediate Inputs) calculation
Tax on Production and Imports (TPI) 86,797,910 66,397,003 Ratio analysis using IMPLAN data IMPLAN
Total Value-added (VA) 943,235,095 559,959,940 Sum of EC, OPTI, & TPI calculation
Intermediate Inputs 687,451,370 687,451,370 Retained IMPLAN default values IMPLAN

86
Appendix Table C2. Input-Output Modeling Industry Components, Default IMPLAN Data and Customized Values, Support Activities, Petroleum Industry, North Dakota, 2019
IMPLAN Industries (sectors) and Industry Balance Sheet Components
IMPLAN Default Study Values Estimation and Adjustment Data Sources
Sector 38 (Support activities for oil and gas operations)
Employment 14,726 13,641 Use of BLS QCEW data to remove uncovered workers from IMPLAN data BLS data NAICS 2111
Output (sales) 4,378,860,311 5,491,621,799 Combined analysis, see Table C3 BLS/IMPLAN/NDSU/DMR
Employee Compensation (EC) 1,630,725,016 1,478,858,850 Wages/salaries adjusted to obtain employment compensation BLS/IMPLAN
Proprietor Income (PI) 93,454,308 117,203,034 Ratio analysis using IMPLAN data IMPLAN
Other property-type Income (OPTI) 668,715,026 838,649,729 Sales minus (EC, TPI, & Intermediate Inputs) calculation
Tax on Production and Imports (TPI) 161,145,649 202,096,183 Represents a combination of taxes from various sources NDOSTC & NDSU Survey
Total Value-added (VA) 2,554,039,999 2,636,807,797 Sum of EC, OPTI, & TPI calculation
Intermediate Inputs 1,824,820,312 2,854,814,003 Combined analysis, see Table C3 NDSU Survey

87
Appendix Table C3. Input-Output Modeling Industry Components, Estimation of Well Drilling and Oil Field Service Shares for IMPLAN Sector 38, Petroleum Industry, North Dakota, 2019
IMPLAN Industries (sectors) and Industry Balance Sheet Components
Study Values for IMPLAN Sector 38
Estimation and Adjustment Data Sources Well Drilling Oil Field Service
Employment 3,904 9,737
Computed based on NDDMR data on rig counts and well counts, BLS labor division by NAICS codes, combined with Job Service North Dakota information on employment in related sectors.
BLS, NDDMR, & Job Service North Dakota
Output (sales) 2,596,174,790 2,895,447,009
Well drilling revenues represented share of reported drilling expenditures that represent spending in IMPLAN Sector 38. The share was estimated from secondary sources. Total well drilling expenses estimated from number of wells drilled and NDSU survey data. Revenues for oil field service is ratio of sales to employment from default IMPLAN data multiplied by new estimate of employment.
NDSU (2013), HIS (2014), BLM WY (2014), Eagle Ford
(2011) &
NDDMR & NDSU Survey IMPLAN
Employee Compensation (EC) 475,329,074 1,003,529,776 BLS data used to estimated employment compensation BLS & IMPLAN
Proprietor Income (PI) 55,407,960 61,795,074
Based on ratio from IMPLAN default data and new estimate of sales for IMPLAN Sector 38 IMPLAN
Other property-type Income (OPTI) 396,473,276 442,176,453
Based on ratio from IMPLAN default data and new estimate of sales for IMPLAN Sector 38 IMPLAN
Tax on Production and Imports (TPI) 95,541,360 106,554,823
Based on ratio from IMPLAN default data and new estimate of sales for IMPLAN Sector 38 IMPLAN
Total Value-added (VA) 1,022,751,671 1,614,056,126 Sum of EC, OPTI, & TPI calculation
Intermediate Inputs 1,573,423,119 1,281,390,883 Sales less Value-added calculation

88
Appendix Table C4. Input-Output Modeling Industry Components, Default IMPLAN Data and Customized Values, Well Development and Oil and Gas Extraction, Petroleum Industry, North Dakota, 2017
IMPLAN Industries (sectors) and Industry Components
IMPLAN Default Study Values Estimation and Adjustment Data Sources
Sector 20 (Extraction of Natural Gas and Petroleum) and Sector 21 (Extraction of Natural Gas Liquids)
Employment 7,642 2,548 Use of BLS QCEW data to remove royalty and investment individuals from IMPLAN data BLS data NAICS 2111
Output (sales) $3,060,469,360 $19,478,833,957 Oil and gas quantity x value (first purchaser prices) NDDRM / NDOSTC
Employee Compensation (EC) $398,927,585 $386,007,356 Wages/salaries adjusted to obtain employment compensation BLS/IMPLAN
Proprietor Income (PI) $308,860,260 $2,274,233,380 Private and tribal royalties (net of severance taxes) ONRR/NDSU Survey
Other Property-type Income (OPTI) $780,389,921 $12,067,289,874 Sales minus (EC, PI, TPI, & Intermediate Inputs) calculation
Tax on Production and Imports (TPI) $874,194,366 $2,049,230,902 Severance tax, property tax, sales taxes, public royalties, misc. government fees NDOSTC/NDSU Survey
Total Value-added (VA) $2,401,905,587 $16,992,750,157 Sum of EC, OPTI, PI & TPI calculation
Intermediate Inputs $658,563,773 $2,486,083,800 $/BOE production expenses x BOE produced, Intermediate Inputs plus VA must equal Sales NDSU Survey
Sector 37 (Drilling Oil and Gas Wells)
Employment 3,446 2,435 Use of BLS QCEW data to remove uncovered workers from IMPLAN data BLS data NAICS 2111
Output (sales) $2,563,396,240 $1,097,426,208 Estimate of total well drilling cost for well owners allocated between IMPLAN sectors 37 and 38
NDSU Survey / NDDMR/IMPLAN
Employee Compensation (EC) $354,037,628 $302,728,914 Wages/salaries adjusted to obtain employment compensation BLS/IMPLAN
Proprietor Income (PI) $54,680,013 $23,280,853 Ratio analysis using IMPLAN data IMPLAN
Other property-type Income (OPTI) $1,811,608,887 $500,912,199 Sales minus (EC, TPI, & Intermediate Inputs) calculation
Tax on Production and Imports (TPI) $127,412,613 $5,454,7143 Ratio analysis using IMPLAN data IMPLAN
Total Value-added (VA) $2,347,439,141 $881,469,109 Sum of EC, OPTI, & TPI calculation
Intermediate Inputs $215,957,099 $215,957,099 Retained IMPLAN default values IMPLAN

89
Appendix Table C5. Input-Output Modeling Industry Components, Default IMPLAN Data and Customized Values, Support Activities, Petroleum Industry, North Dakota, 2017
IMPLAN Industries (sectors) and Industry Components
IMPLAN Default Study Values Estimation and Adjustment Data Sources
Sector 38 (Support activities for oil and gas operations)
Employment 11,419 10,798 Use of BLS QCEW data to remove uncovered workers from IMPLAN data BLS data NAICS 2111
Output (sales) $2,012,027,100 $3,647,465,361 Combined analysis, see Table C6
Employee Compensation (EC) $1,205,441,895 $1,222,970,174 Wages/salaries adjusted to obtain employment compensation BLS/IMPLAN
Proprietor Income (PI) $135,051,849 $244,826,196 Based on ratio from IMPLAN default data and new estimate of sales for IMPLAN Sector 38 IMPLAN
Other property-type Income (OPTI) $311,447,083 $564,600,967 Sales minus (EC, TPI, & Intermediate Inputs) calculation
Tax on Production and Imports (TPI) $70,684,410 $128,138,899 Based on ratio from IMPLAN default data and new estimate of sales for IMPLAN Sector 38 NDOSTC & NDSU Survey
Total Value-added (VA) $1,722,625,237 $2,160,536,236 Sum of EC, OPTI, & TPI calculation
Intermediate Inputs $289,401,863 $1,486,929,125 Combined analysis, see Table C6 NDSU Survey

90
Appendix Table C6. Input-Output Modeling Industry Components, Estimation of Well Drilling and Oil Field Service Shares for IMPLAN Sector 38, Petroleum Industry, North Dakota, 2017
IMPLAN Industry Components
Study Values for IMPLAN Sector 38
Estimation and Adjustment Data Sources Well Drilling Oil Field Service
Employment 3,060 7,738
Computed based on NDDMR data on rig counts and well counts, BLS labor division by NAICS codes, combined with Job Service North Dakota information on employment in related sectors.
BLS, NDDMR, & Job Service North Dakota
Output (sales) $2,284,018,295 $1,363,447,066
Well drilling revenues represented share of reported drilling expenditures that represent spending in IMPLAN Sector 38. The share was estimated from secondary sources. Total well drilling expenses estimated from number of wells drilled and NDSU survey data. Revenues for oil field service is ratio of sales to employment from default IMPLAN data multiplied by new estimate of employment.
NDSU (2013), HIS (2014), BLM WY (2014), Eagle Ford
(2011) &
NDDMR, NDSU Survey, & IMPLAN
Employee Compensation (EC) $346,572,396 $876,397,778 BLS data used to estimated employment compensation BLS & IMPLAN
Proprietor Income (PI) $153,308,519 $91,517,677
Based on ratio from IMPLAN default data and new estimate of sales for IMPLAN Sector 38 IMPLAN
Other property-type Income (OPTI) $353,549,331 $211,051,636
Based on ratio from IMPLAN default data and new estimate of sales for IMPLAN Sector 38 IMPLAN
Tax on Production and Imports (TPI) $80,239,717 $47,899,182
Based on ratio from IMPLAN default data and new estimate of sales for IMPLAN Sector 38 IMPLAN
Total Value-added (VA) $933,669,963 $1,226,866,273 Sum of EC, OPTI, & TPI calculation
Intermediate Inputs $1,350,348,332 $136,580,792 Sales less Value-added calculation

91
Appendix Table C7. Input-Output Modeling Industry Components, Default IMPLAN Data and Customized Values, Well Development and Oil and Gas Extraction, Petroleum Industry, North Dakota, 2015
IMPLAN Industries (sectors) and Industry Components
IMPLAN Default Study Values Estimation and Adjustment Data Sources
Sector 20 (Extraction of Natural Gas and Petroleum) and Sector 21 (Extraction of Natural Gas Liquids)
Employment 6,075 2,906 Use of BLS QCEW data to remove royalty and investment individuals from IMPLAN data BLS data NAICS 2111
Output (sales) $2,648,208,939 $18,292,074,198 Oil and gas quantity x value (first purchaser prices) NDDRM / NDOSTC
Employee Compensation (EC) $422,629,761 $424,864,859 Wages/salaries adjusted to obtain employment compensation BLS/IMPLAN
Proprietor Income (PI) $247,734,333 $2,468,318,104 Private and tribal royalties (net of severance taxes) ONRR/NDSU Survey
Other Property-type Income (OPTI) $581,582,474 $9,774,084,285 Sales minus (EC, PI, TPI, & Intermediate Inputs) calculation
Tax on Production and Imports (TPI) $996,906,441 $2,369,550,948 Severance tax, property tax, sales taxes, public royalties, misc. government fees NDOSTC/NDSU Survey
Total Value-added (VA) $2,248,853,009 $15,036,818,195 Sum of EC, OPTI, PI & TPI calculation
Intermediate Inputs $399,355,930 $3,255,256,002 $/BOE production expenses x BOE produced, Intermediate Inputs plus VA must equal Sales NDSU Survey
Sector 37 (Drilling Oil and Gas Wells)
Employment 4,663 3,821 Use of BLS QCEW data to remove uncovered workers from IMPLAN data BLS data NAICS 2111
Output (sales) $1,731,619,019 $1,752,482,384 Estimate of total well drilling cost for well owners allocated between IMPLAN sectors 37 and 38
NDSU Survey / NDDMR/IMPLAN
Employee Compensation (EC) $569,077,576 $536,893,793 Wages/salaries adjusted to obtain employment compensation BLS/IMPLAN
Proprietor Income (PI) $33,568,954 $33,568,954 Ratio analysis using IMPLAN data IMPLAN
Other property-type Income (OPTI) $533,624,573 $533,624,573 Sales minus (EC, TPI, & Intermediate Inputs) calculation
Tax on Production and Imports (TPI) $136,789,063 $136,789,063 Ratio analysis using IMPLAN data IMPLAN
Total Value-added (VA) $1,273,060,165 $1,240,876,383 Sum of EC, OPTI, & TPI calculation
Intermediate Inputs $458,558,853 $511,606,001 Retained IMPLAN default values IMPLAN
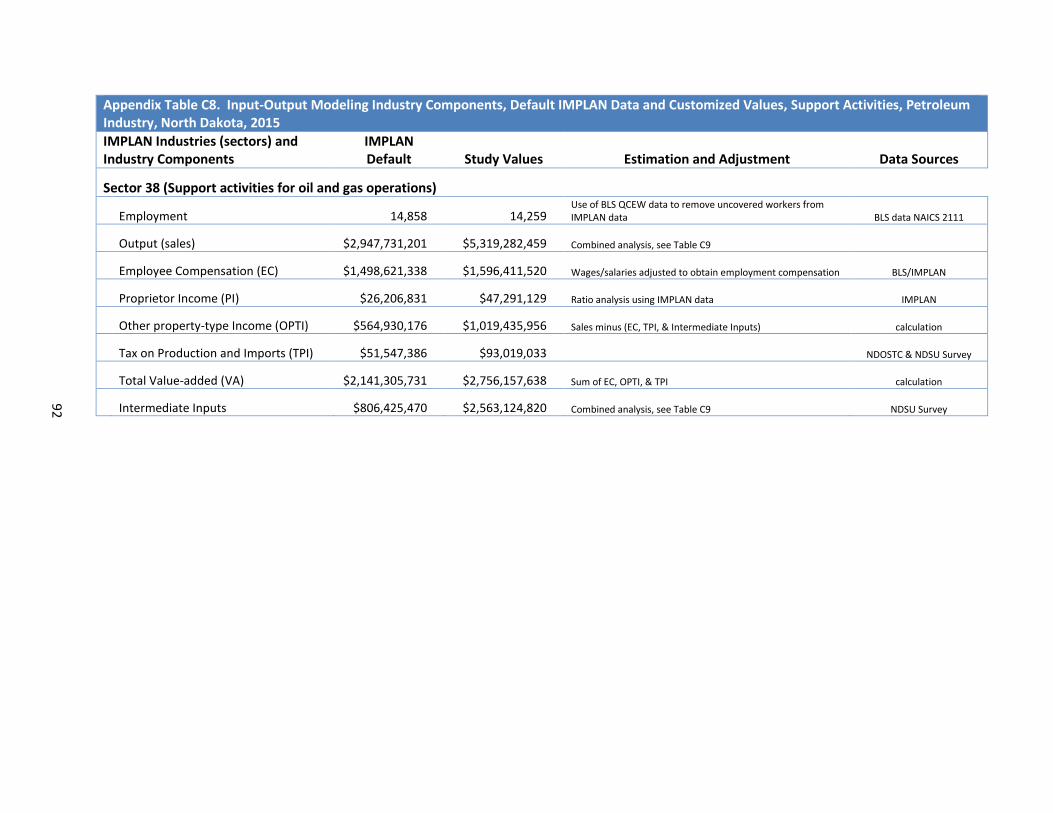
92
Appendix Table C8. Input-Output Modeling Industry Components, Default IMPLAN Data and Customized Values, Support Activities, Petroleum Industry, North Dakota, 2015
IMPLAN Industries (sectors) and Industry Components
IMPLAN Default Study Values Estimation and Adjustment Data Sources
Sector 38 (Support activities for oil and gas operations)
Employment 14,858 14,259 Use of BLS QCEW data to remove uncovered workers from IMPLAN data BLS data NAICS 2111
Output (sales) $2,947,731,201 $5,319,282,459 Combined analysis, see Table C9
Employee Compensation (EC) $1,498,621,338 $1,596,411,520 Wages/salaries adjusted to obtain employment compensation BLS/IMPLAN
Proprietor Income (PI) $26,206,831 $47,291,129 Ratio analysis using IMPLAN data IMPLAN
Other property-type Income (OPTI) $564,930,176 $1,019,435,956 Sales minus (EC, TPI, & Intermediate Inputs) calculation
Tax on Production and Imports (TPI) $51,547,386 $93,019,033 NDOSTC & NDSU Survey
Total Value-added (VA) $2,141,305,731 $2,756,157,638 Sum of EC, OPTI, & TPI calculation
Intermediate Inputs $806,425,470 $2,563,124,820 Combined analysis, see Table C9 NDSU Survey
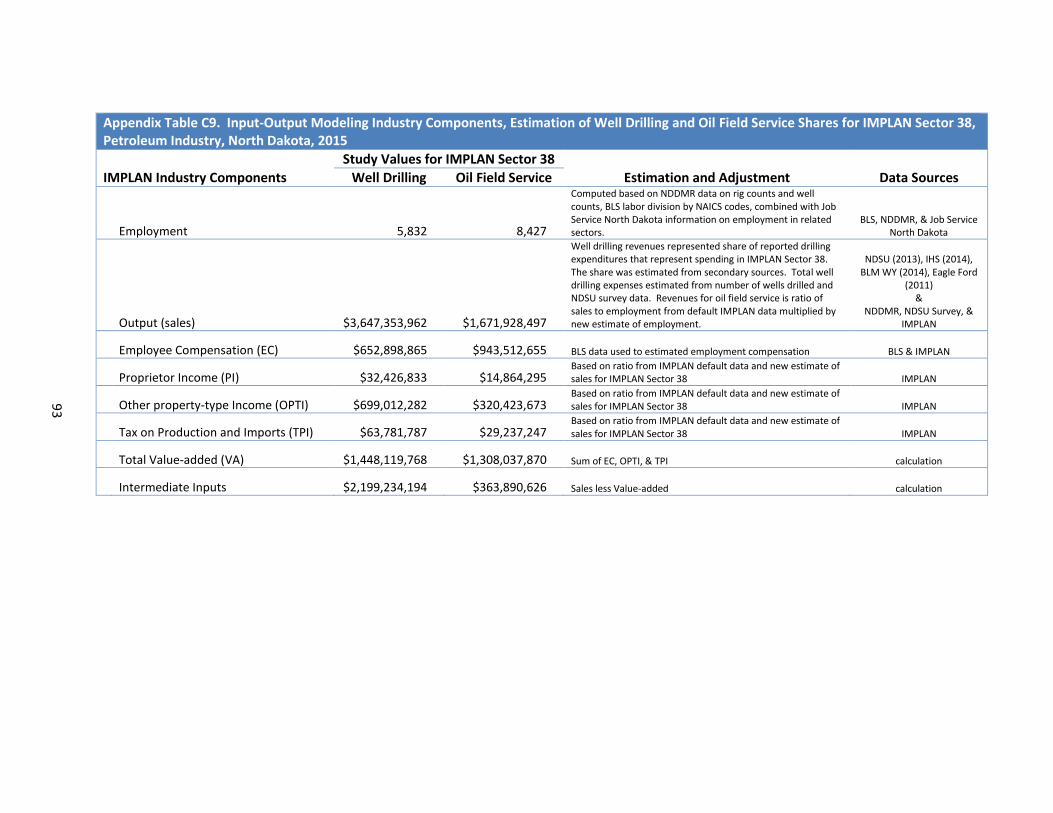
93
Appendix Table C9. Input-Output Modeling Industry Components, Estimation of Well Drilling and Oil Field Service Shares for IMPLAN Sector 38, Petroleum Industry, North Dakota, 2015
IMPLAN Industry Components
Study Values for IMPLAN Sector 38
Estimation and Adjustment Data Sources Well Drilling Oil Field Service
Employment 5,832 8,427
Computed based on NDDMR data on rig counts and well counts, BLS labor division by NAICS codes, combined with Job Service North Dakota information on employment in related sectors.
BLS, NDDMR, & Job Service North Dakota
Output (sales) $3,647,353,962 $1,671,928,497
Well drilling revenues represented share of reported drilling expenditures that represent spending in IMPLAN Sector 38. The share was estimated from secondary sources. Total well drilling expenses estimated from number of wells drilled and NDSU survey data. Revenues for oil field service is ratio of sales to employment from default IMPLAN data multiplied by new estimate of employment.
NDSU (2013), IHS (2014), BLM WY (2014), Eagle Ford
(2011) &
NDDMR, NDSU Survey, & IMPLAN
Employee Compensation (EC) $652,898,865 $943,512,655 BLS data used to estimated employment compensation BLS & IMPLAN
Proprietor Income (PI) $32,426,833 $14,864,295
Based on ratio from IMPLAN default data and new estimate of sales for IMPLAN Sector 38 IMPLAN
Other property-type Income (OPTI) $699,012,282 $320,423,673
Based on ratio from IMPLAN default data and new estimate of sales for IMPLAN Sector 38 IMPLAN
Tax on Production and Imports (TPI) $63,781,787 $29,237,247
Based on ratio from IMPLAN default data and new estimate of sales for IMPLAN Sector 38 IMPLAN
Total Value-added (VA) $1,448,119,768 $1,308,037,870 Sum of EC, OPTI, & TPI calculation
Intermediate Inputs $2,199,234,194 $363,890,626 Sales less Value-added calculation

94
Direct Employment and Employment Compensation, Petroleum Industry, North Dakota, 2013 through 2019
Appendix D

95
Direct Employment While employment figures are frequently reported by various governmental agencies and are broken into a hierarchy of categories (e.g., North American Industry Classification System), deriving specific estimates of employment for large basic-sector industries can be problematic. Much of the problem arises in defining the type of job, and attributing which industry(s) created that employment. For example, the process of drilling an oil well typically requires developing a road and a drilling site; work that requires heavy construction with earth moving or excavating equipment. Most oil companies will contract that work to local firms that specialize in heavy construction or excavating. The individuals performing the road building and preparation of the drill site are likely to be employed with some type of construction firm, and as a result, those jobs are typically classified and reported by government agencies as construction. Government agencies (e.g., Bureau of the Census, Bureau of Labor Statistics) that track employment often base the classification of those jobs on the type of activities that generate the most revenue for a firm (primary activities). In this example, the primary activity for this firm is likely to be construction, even if the revenues for the construction firm are derived from road building and drill site preparation for an oil firm. However, in the case of assigning which basic-sector industry created that employment, it may be more accurate to suggest those jobs exist as a result of the petroleum industry rather than the construction industry. Yet, in other cases, the level of oil well drilling activity may be insufficient to sustain employment in heavy construction for an entire year. Those situations result in seasonal or part-time job creation. The challenge is to measure or estimate the total number of full-time jobs created and sustained by the petroleum industry, even if those jobs appear to be part of another industry or are only created for part of a year. From 2013 through 2016, Job Service North Dakota conducted an annual special assessment to measure the number of private jobs in the petroleum industry using the QCEW program (Job Service North Dakota 2014, 2015, 2016, 2017) (see Appendix Tables D1 through D14 for detailed Job Service North Dakota data). The Job Service assessment divided employment into ‘direct’ and ‘related’ employment. Direct oil and gas employment was based entirely on NAICS codes. Related oil and gas employment was estimated using NAICS codes and survey information. Survey information was based on inquiries to establishments requesting them to estimate the percentage of their business volume received/obtained from oil and gas industry activities. The Job Service North Dakota reports were discontinued in 2017. In an attempt to keep current employment estimates consistent with past estimates, a process of relating employment among the various economic sectors was used with 2-digit NAICS data for 2017, 2018, and 2019 to approximate the distribution of employment found in the Job Service North Dakota previous studies (Appendix Tables D1-D6). Secondary Employment The methodology used by Job Service North Dakota is similar in concept to the delineation of direct jobs and indirect jobs using input-output (I-O) methodologies. All industries have employment that inherently represents a direct job, based on the nature of the employment in relation to the definition of the industry. For example, doctors and nurses working at a medical clinic would inherently be considered direct employment in the Medical Service industry just as a farmer is directly employed in the Agriculture industry. NAICS is helpful in identifying direct employment since it provides a high

96
degree of specificity to the type of activities engaged in by an establishment and its employees. As a point of consistency, both I-O methodologies and the methodology used by Job Service North Dakota for measuring employment in the Petroleum Industry rely on NAICS codes to define direct employment. Large industries often have employment, classified and measured as indirect jobs with I-O analysis, which is claimed to be ‘direct’ employment by industry leaders and representatives. From an empirical perspective, the shifting of jobs among classifications between studies and across different methodologies can create confusion, and also presents potential problems for double counting or over estimation of the number of jobs supported by an industry. The challenge with using the Job Service North Dakota data and its methodology of estimating direct and ‘related’ employment is to ensure that employment that is traditionally measured as indirect jobs does not get used as a direct employment component within an I-O analysis framework.
The study considered two routes or analyses that can produce estimates of economy-wide employment in the petroleum industry. Each method has distinct advantages and disadvantages. Alternative 1 was chosen for this study.
Alternative 1:
Description: Use Job Service North Dakota (JSND) employment as the basis for estimating indirect and induced employment. JSND reports employment in several sectors as representing petroleum industry employment. However, this designation is not consistent with I-O analysis, and if not properly handled, could grossly overstate total indirect and induced employment arising from the industry. The challenge with this method is to combine I-O analysis in a manner than eliminates any duplication of indirect and induced labor.
Advantage: JSND data represents a unique data set based on information gathered directly from firms and businesses in the state.
Disadvantage: JSND approach mixes jobs defined as indirect and induced, and presents those estimates as representing direct and ‘related’ employment in the industry. The treatment of the employment designations with the JS data is not consistent, or compatible with traditional I-O employment designations without considerable adjustment to modeling procedures. It is unclear from the JSND data which employment estimates are truly ‘related’ versus direct employment.
Methods: JSND data is allocated to IMPLAN sectors 20, 37, 38, 156, and 50 (representing production, drilling, transportation, and processing). The I-O model is run to estimate the employment from IMPLAN for sectors 62, 449, 411, and 485 for both indirect and induced employment. Those particular values would represent double counting, as they show up as indirect and induced jobs for core industry activities under traditional I-O modeling; however, JSND already has estimated employment in those sectors (IMPLAN sectors 62, 449, 411, and 485), and is treating those jobs as being direct employment in the industry. Therefore, any indirect and induced employment produced by the core industry sectors in 62, 449, 411, and 485 would necessarily already measured (counted) in JSND direct estimate.
The indirect employment leftover in the other economic sectors from the above analysis is considered the remainder of indirect (i.e., those jobs not already counted as direct employment).

97
The direct employment from JSND in IMPLAN sectors 62, 449, 411, & 485 is then combined with data for IMPLAN sectors 20, 37, 38, 156, and 50 and ran through IMPLAN. All JSND employment, treated as direct employment, is used to estimate induced employment. Induced employment is further reduced to reflect two conditions: 1) some wages/salaries will leave the state reflective of workers retaining residency outside of North Dakota and working shift schedules in the industry that allow them sufficient periods to return home—these workers do not require permanent lodging and they purchase much of their personal goods and services from providers at their permanent address, and 2) all private in-state royalty revenue cannot be treated as personal consumption of goods and services, as income taxes, savings and investments result in money streams being diverted out of household spending.
All of the above analyses are based on a 2-digit NAICS mapping scheme for output from IMPLAN’s 536-sector model.
Alternative 2:
Description: Traditional economic contribution analyses use a series of economic criteria, tied to backward linkages among economic sectors, to define employment as being directly or primarily used in the core components of an industry (direct employment). This particular approach would specify direct employment in the core industry activities, and then use an I-O matrix, with specific backward linkages disconnected to avoid overestimation of total employment in any particular sector, to estimate indirect and induced employment.
Advantage: This is a straightforward process, consistent and compatible with traditional economic contribution modeling.
Disadvantage: This approach relies on the I-O matrix to properly measure employment response to a direct impact. I-O modeling requires an appropriate measure of direct sales or direct employment. Further, data on the amount and percentage of local acquisition of goods and services for any particular industry are paramount to accurately estimating indirect and induced employment. How much local (within the study region) acquisition of goods and services are made by an industry can be obtained through baseline data (e.g., IMPLAN) or from a combination of survey data. The challenge is that, in complex industries, spending patterns of industry segments may not be accurately portrayed with default software data, and collection of survey data is a resource-intensive pursuit.
An additional disadvantage is that IMPLAN’s default data for oil and gas production in the state is substantially underrepresented in their baseline database. It is unclear if the default data for oil and gas services are also underrepresented, and internal data from the model are not consistent with industry behavior in the state. For example, activity in sector 38 is meant to represent the service aspect of firms suppling goods and services to oil production firms and firms actively drilling and fracking wells; however, trade flow data within IMPLAN suggest those services are exported from the state. This is obviously an erroneous condition that must be rectified for an accurate assessment of the industry.
Methods: The reconstruction of IMPLAN sectors for the Petroleum Industry requires collecting information from a number of sources, including Bureau of Labor Statistics, Job Service ND, ND Office of State Tax Commissioner, Office of Nature Resources Revenue, ND Land Department, ND Department of Mineral Resources, IMPLAN, and private industry (surveys).

98
Industry sectors in IMPLAN have several key components, which include sales, employment, employment compensation, proprietor income, other property-type income, taxes on production and imports, and intermediate inputs (industry profiles in the IMPLAN modeling system are detailed in Appendix B). Additional modification is possible through adjustments to intermediate input spending patterns and regional purchases.
After re-constructing the IMPLAN industry profiles using data from all appropriate sources, the I-O framework can be used to estimate indirect and induced employment.

99
Appendix Table D1. Statewide Private Employment, All Sectors and Direct Employment in Petroleum Industry, North Dakota, 2019
NAICS Sector Designation Statewide Private Employment (QCEW)
Industry Segments and Groupings*
Total** Non Oil & Gas
Oil & Gas
Drilling, Extraction, Production & Refining
Infrastr-ucture
Develop-ment
Professional Service
Transport-ation
Wholesale Trade &
Manufact-uring
11 Ag, Forestry, Fishing and Hunting 4,593 4,593 19,146 178
21 Mining, Quarrying, Oil & Gas 21,380 2,056 19,324 604
22 Utilities 3,448 2,844 604 3,870
23 Construction 27,961 24,091 3,870 386
31-33 Manufacturing 26,471 24,631 1,840 1,454
42 Wholesale Trade 24,252 22,140 2,112 2,112
44-45 Retail Trade 45,621 45,621 772
48-49 Transportation and Warehousing 18,002 12,411 5,591 4,819
51 Information 6,093 6,093
52 Finance and Insurance 17,832 17,822 10 10
53 Real Estate and Rental & Leasing 5,432 4,439 993 993
54 Professional and Technical Services 16,262 14,922 1,340 1,340
55 Mgmt of Companies & Enterprises 3,578 3,392 186 18 186
56 Administrative and Waste Services 13,016 12,846 170 152
61 Educational Services 2,794 2,794
62 Health Care and Social Assistance 62,977 62,977
71 Arts, Entertainment, and Recreation 5,617 5,617
72 Accommodation and Food Services 34,806 34,806
81 Other Services 11,337 11,068 269 19,532 5,443 269
Total 351,472 315,161 36,311 19,146 178 2,950 4,819 3,567
*Estimated using relationships from previous employment evaluations by Job Service North Dakota (2014, 2015, 2016, 2017). **Job Service North Dakota (2020).

10
0
Appendix Table D2. Statewide Private Employment Wages and Salaries, All Sectors and Direct Employment in Petroleum Industry, North Dakota, 2019
NAICS Sector Designation Statewide Private Employment Salaries and Wages (QCEW)
Industry Segments and Groupings*
Total** Non Oil & Gas
Oil & Gas
Drilling, Extraction, Production & Refining
Infrastr-ucture
Develop-ment
Professional Service
Transport-ation
Wholesale Trade &
Manufact-uring
--------------------------------------------------------------------------------- millions $ ---------------------------------------------------------------------------------
11 Ag, Forestry, Fishing and Hunting $201.8 $201.8
21 Mining, Quarrying, Oil & Gas $2,326.8 $229.9 $2,096.9 $2,083.7 $13.2
22 Utilities $380.2 $315.6 $64.6 $64.6
23 Construction $1,905.6 $1,536.7 $369.0 $369.0
31-33 Manufacturing $1,460.6 $1,322.2 $138.4 $50.9 $87.6
42 Wholesale Trade $1,704.7 $1,519.9 $184.7 $184.7
44-45 Retail Trade $1,462.2 $1,462.2
48-49 Transportation and Warehousing $1,195.2 $701.8 $493.4 $106.3 $387.1
51 Information $435.9 $435.9
52 Finance and Insurance $1,232.6 $1,231.9 $0.7 $0.7
53 Real Estate and Rental & Leasing $297.7 $213.8 $83.9 $83.9
54 Professional and Technical Services $1,230.5 $1,103.7 $126.8 $126.8
55 Mgmt of Companies & Enterprises $366.8 $344.4 $22.4 $22.4
56 Administrative and Waste Services $502.1 $492.0 $10.1 $1.3 $8.8
61 Educational Services $105.4 $105.4
62 Health Care and Social Assistance $3,353.2 $3,353.2
71 Arts, Entertainment, and Recreation $99.5 $99.5
72 Accommodation and Food Services $651.3 $651.3
81 Other Services $438.7 $418.6 $20.1 $20.1
Total $19,351.0 $15,740.1 $3,610.8 $2,134.6 $554.2 $262.6 $387.1 $272.3
*Estimated using relationships from previous employment evaluations by Job Service North Dakota (2013, 2014, 2015, 2016). **Job Service North Dakota (2020).

10
1
Appendix Table D3. Statewide Private Employment, All Sectors and Direct Employment in Petroleum Industry, North Dakota, 2018
NAICS Sector Designation Statewide Private Employment (QCEW)
Industry Segments and Groupings*
Total** Non Oil & Gas
Oil & Gas
Drilling, Extraction, Production & Refining
Infrastr-ucture
Develop-ment
Professional Service
Transport-ation
Wholesale Trade &
Manufact-uring
11 Ag, Forestry, Fishing and Hunting 4,618 4,618
21 Mining, Quarrying, Oil & Gas 20,804 2,056 18,748 18,575 173
22 Utilities 3,666 3,023 643 643
23 Construction 26,002 21,957 4,045 4,045
31-33 Manufacturing 25,906 24,097 1,809 386 1,423
42 Wholesale Trade 23,892 21,811 2,081 2,081
44-45 Retail Trade 46,858 46,858
48-49 Transportation and Warehousing 17,219 11,840 5,379 770 4,609
51 Information 6,221 6,221
52 Finance and Insurance 17,834 17,824 10 10
53 Real Estate and Rental & Leasing 5,311 4,367 944 944
54 Professional and Technical Services 15,950 14,640 1,310 1,310
55 Mgmt of Companies & Enterprises 5,282 5,007 275 275
56 Administrative and Waste Services 13,327 13,129 198 22 176
61 Educational Services 2,665 2,665
62 Health Care and Social Assistance 59,519 59,519
71 Arts, Entertainment, and Recreation 5,690 5,690
72 Accommodation and Food Services 34,685 34,685
81 Other Services 11,307 11,038 269 269
Total 346,756 311,046 35,710 18,961 5,652 2,984 4,609 3,505
*Estimated using relationships from previous employment evaluations by Job Service North Dakota (2013, 2014, 2015, 2016). **Job Service North Dakota (2019).

10
2
Appendix Table D4. Statewide Private Employment Wages and Salaries, All Sectors and Direct Employment in Petroleum Industry, North Dakota, 2018
NAICS Sector Designation Statewide Private Employment Salaries and Wages (QCEW)
Industry Segments and Groupings*
Total** Non Oil & Gas
Oil & Gas Drilling, Extraction, Production & Refining
Infrastr-ucture
Develop-ment
Professional Service
Transport-ation
Wholesale Trade &
Manufact-uring
--------------------------------------------------------------------------------- millions $ ---------------------------------------------------------------------------------
11 Ag, Forestry, Fishing and Hunting $200.5 $200.5
21 Mining, Quarrying, Oil & Gas $2,216.4 $228.6 $1,987.8 $1,979.0 $8.8
22 Utilities $389.5 $316.2 $73.3 $73.3
23 Construction $1,679.3 $1,235.2 $444.1 $444.1
31-33 Manufacturing $1,395.9 $1,262.5 $133.3 $49.7 $83.7
42 Wholesale Trade $1,626.4 $1,450.2 $176.2 $176.2
44-45 Retail Trade $1,458.0 $1,458.0
48-49 Transportation and Warehousing $1,091.3 $638.3 $453.1 $99.6 $353.5
51 Information $436.7 $436.7
52 Finance and Insurance $1,180.7 $1,180.1 $0.6 $0.6
53 Real Estate and Rental & Leasing $283.2 $205.6 $77.6 $77.6
54 Professional and Technical Services $1,163.8 $1,044.3 $119.6 $119.6
55 Mgmt of Companies & Enterprises $452.8 $425.2 $27.6 $27.6
56 Administrative and Waste Services $518.3 $507.1 $11.2 $0.9 $10.3
61 Educational Services $97.0 $97.0
62 Health Care and Social Assistance $3,099.5 $3,099.5
71 Arts, Entertainment, and Recreation $93.2 $93.2
72 Accommodation and Food Services $629.0 $629.0
81 Other Services $420.8 $401.5 $19.2 $19.2
Total $18,432.4 $14,908.6 $3,523.8 $2,028.7 $626.7 $255.0 $353.5 $259.9
*Estimated using relationships from previous employment evaluations by Job Service North Dakota (2013, 2014, 2015, 2016). **Job Service North Dakota (2019).

10
3
Appendix Table D5. Statewide Private Employment, All Sectors and Direct Employment in Petroleum Industry, North Dakota, 2017
NAICS Sector Designation Statewide Private Employment (QCEW)
Industry Segments and Groupings*
Total** Non Oil & Gas
Oil & Gas Drilling, Extraction, Production & Refining
Infrastr-ucture
Develop-ment
Professional Service
Transport-ation
Wholesale Trade &
Manufact-uring
11 Ag, Forestry, Fishing and Hunting 4,554 4,554
21 Mining, Quarrying, Oil & Gas 17,841 2,053 15,788 15,624 164
22 Utilities 3,782 3,119 663 663
23 Construction 26,732 22,577 4,155 4,155
31-33 Manufacturing 24,681 22,799 1,882 526 1,356
42 Wholesale Trade 23,928 21,844 2,084 2,084
44-45 Retail Trade 47,732 47,732
48-49 Transportation and Warehousing 16,609 11,399 5,210 765 4,446
51 Information 6,502 6,502
52 Finance and Insurance 17,915 17,905 10 10
53 Real Estate and Rental & Leasing 5,220 4,362 858 858
54 Professional and Technical Services 15,905 14,630 1,275 1,275
55 Mgmt of Companies & Enterprises 5,314 5,037 277 277
56 Administrative and Waste Services 13,082 12,904 178 20 157
61 Educational Services 2,584 2,584
62 Health Care and Social Assistance 59,263 59,263
71 Arts, Entertainment, and Recreation 4,557 4,557
72 Accommodation and Food Services 34,759 34,759
81 Other Services 12,231 11,940 291 291
Total 343,191 310,519 32,672 16,150 5,767 2,869 4,446 3,440
*Estimated using relationships from previous employment evaluations by Job Service North Dakota (2013, 2014, 2015, 2016). **Job Service North Dakota (2019).

10
4
Appendix Table D6. Statewide Private Employment Wages and Salaries, All Sectors and Direct Employment in Petroleum Industry, North Dakota, 2017
NAICS Sector Designation Statewide Private Employment Salaries and Wages (QCEW)
Industry Segments and Groupings*
Total** Non Oil & Gas
Oil & Gas
Drilling, Extraction, Production & Refining
Infrastr-ucture
Develop-ment
Professional Service
Transport-ation
Wholesale Trade &
Manufact-uring
--------------------------------------------------------------------------------- millions $ ---------------------------------------------------------------------------------
11 Ag, Forestry, Fishing and Hunting $202.1 $202.1
21 Mining, Quarrying, Oil & Gas $1,804.0 $212.9 $1,591.1 $1,579.7 $11.3
22 Utilities $379.3 $314.9 $64.4 $64.4
23 Construction $1,684.9 $1,318.6 $366.3 $366.3
31-33 Manufacturing $1,298.0 $1,154.1 $143.9 $66.1 $77.8
42 Wholesale Trade $1,557.6 $1,388.8 $168.8 $168.8
44-45 Retail Trade $1,461.3 $1,461.3
48-49 Transportation and Warehousing $1,012.0 $587.6 $424.3 $96.5 $327.8
51 Information $423.4 $423.4
52 Finance and Insurance $1,125.3 $1,124.7 $0.6 $0.6
53 Real Estate and Rental & Leasing $263.8 $197.0 $66.9 $66.9
54 Professional and Technical Services $1,112.9 $1,001.2 $111.7 $111.7
55 Mgmt of Companies & Enterprises $429.6 $403.4 $26.2 $26.2
56 Administrative and Waste Services $496.2 $485.8 $10.4 $1.4 $8.9
61 Educational Services $85.4 $85.4
62 Health Care and Social Assistance $3,001.7 $3,001.7
71 Arts, Entertainment, and Recreation $74.2 $74.2
72 Accommodation and Food Services $609.9 $609.9
81 Other Services $417.9 $398.8 $19.1 $19.1
Total $17,439.5 $14,445.8 $2,993.7 $1,645.9 $540.0 $233.4 $327.8 $246.6
*Estimated using relationships from previous employment evaluations by Job Service North Dakota (2013, 2014, 2015, 2016). **Job Service North Dakota (2019).

10
5
Appendix Table D7. Statewide Private Employment, All Sectors and Direct Employment in Petroleum Industry, North Dakota, 2016
NAICS Sector Designation Statewide Private Employment (QCEW)
Industry Segments and Groupings
Total Non Oil & Gas
Oil & Gas
Drilling, Extraction, Production & Refining
Infrastr-ucture
Develop-ment
Professional Service
Transport-ation
Wholesale Trade &
Manufact-uring
11 Ag, Forestry, Fishing and Hunting 4,487 4,487
21 Mining, Quarrying, Oil & Gas 15,303 2,051 13,252 *13,130 *122
22 Utilities 3,845 3,133 712 712
23 Construction 31,067 26,151 4,916 4,916
31-33 Manufacturing 24,570 23,220 1,350 *386 *964
42 Wholesale Trade 24,416 *21,839 *2,577 *2,577
44-45 Retail Trade 49,160 49,160
48-49 Transportation and Warehousing 16,412 11,261 5,151 758 4,393
51 Information 6,631 6,631
52 Finance and Insurance 18,026 *18,011 *15 *15
53 Real Estate and Rental & Leasing 5,112 4,441 671 671
54 Professional and Technical Services 16,362 14,773 1,589 1,589
55 Mgmt of Companies & Enterprises 5,253 5,140 113 113
56 Administrative and Waste Services 12,829 12,693 136 *13 *123
61 Educational Services 2,521 2,521
62 Health Care and Social Assistance 58,359 58,359
71 Arts, Entertainment, and Recreation 4,469 4,469
72 Accommodation and Food Services 34,825 34,825
81 Other Services 12,084 11,748 336 336
Total 345,731 314,913 30,818 13,516 6,521 2,847 4,393 3,541
Source: Job Service North Dakota (2017). *Values were estimated due to data suppression from Job Service analysis.
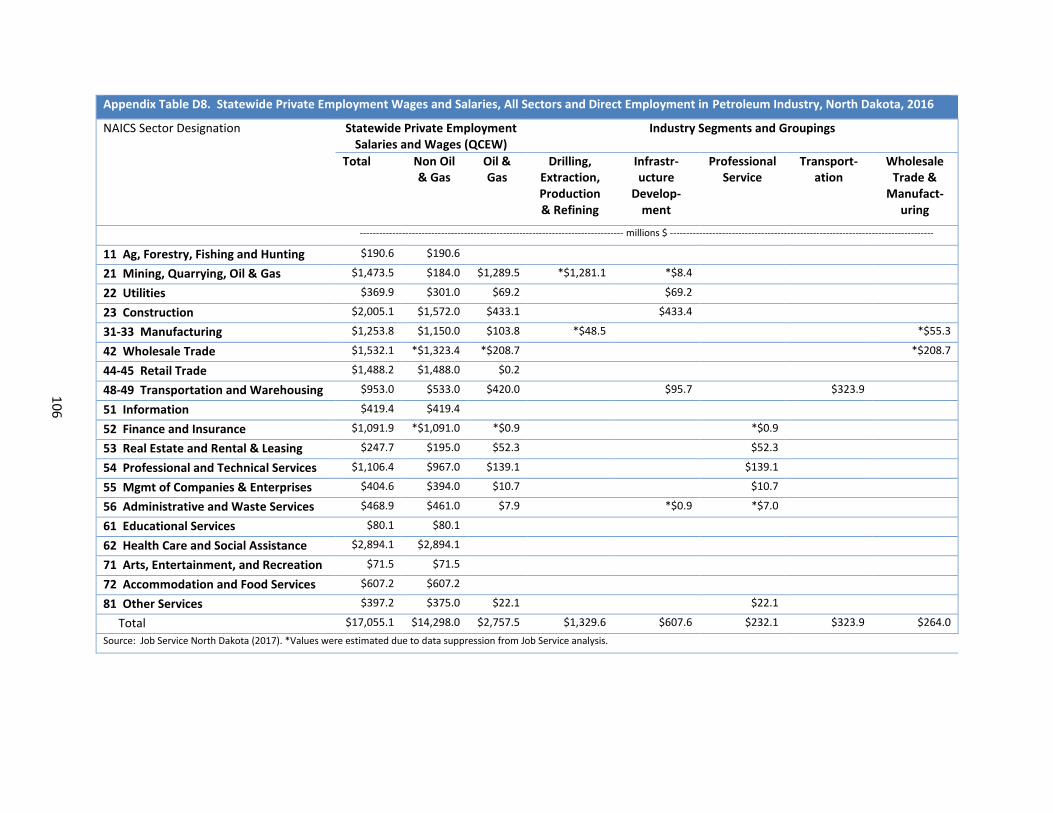
10
6
Appendix Table D8. Statewide Private Employment Wages and Salaries, All Sectors and Direct Employment in Petroleum Industry, North Dakota, 2016
NAICS Sector Designation Statewide Private Employment Salaries and Wages (QCEW)
Industry Segments and Groupings
Total Non Oil & Gas
Oil & Gas
Drilling, Extraction, Production & Refining
Infrastr-ucture
Develop-ment
Professional Service
Transport-ation
Wholesale Trade &
Manufact-uring
--------------------------------------------------------------------------------- millions $ ---------------------------------------------------------------------------------
11 Ag, Forestry, Fishing and Hunting $190.6 $190.6
21 Mining, Quarrying, Oil & Gas $1,473.5 $184.0 $1,289.5 *$1,281.1 *$8.4
22 Utilities $369.9 $301.0 $69.2 $69.2
23 Construction $2,005.1 $1,572.0 $433.1 $433.4
31-33 Manufacturing $1,253.8 $1,150.0 $103.8 *$48.5 *$55.3
42 Wholesale Trade $1,532.1 *$1,323.4 *$208.7 *$208.7
44-45 Retail Trade $1,488.2 $1,488.0 $0.2
48-49 Transportation and Warehousing $953.0 $533.0 $420.0 $95.7 $323.9
51 Information $419.4 $419.4
52 Finance and Insurance $1,091.9 *$1,091.0 *$0.9 *$0.9
53 Real Estate and Rental & Leasing $247.7 $195.0 $52.3 $52.3
54 Professional and Technical Services $1,106.4 $967.0 $139.1 $139.1
55 Mgmt of Companies & Enterprises $404.6 $394.0 $10.7 $10.7
56 Administrative and Waste Services $468.9 $461.0 $7.9 *$0.9 *$7.0
61 Educational Services $80.1 $80.1
62 Health Care and Social Assistance $2,894.1 $2,894.1
71 Arts, Entertainment, and Recreation $71.5 $71.5
72 Accommodation and Food Services $607.2 $607.2
81 Other Services $397.2 $375.0 $22.1 $22.1
Total $17,055.1 $14,298.0 $2,757.5 $1,329.6 $607.6 $232.1 $323.9 $264.0
Source: Job Service North Dakota (2017). *Values were estimated due to data suppression from Job Service analysis.

10
7
Appendix Table D9. Statewide Private Employment, All Sectors and Direct Employment in Petroleum Industry, North Dakota, 2015
NAICS Sector Designation Statewide Private Employment (QCEW)
Industry Segments and Groupings
Total Non Oil & Gas
Oil & Gas
Drilling, Extraction, Production & Refining
Infrastr-ucture
Develop-ment
Professional Service
Transport-ation
Wholesale Trade &
Manufact-uring
11 Ag, Forestry, Fishing and Hunting 4,391 4,391
21 Mining, Quarrying, Oil & Gas 23,248 2,064 21,184 *20,948 *236
22 Utilities 3,830 3,199 631 631
23 Construction 34,051 27,849 6,202 6,201
31-33 Manufacturing 25,431 23,610 1,821 *400 *1,421
42 Wholesale Trade 26,660 *22,468 *4,192 *4,192
44-45 Retail Trade 50,724 50,724
48-49 Transportation and Warehousing 20,393 10,968 9,425 885 8,540
51 Information 6,605 6,605
52 Finance and Insurance 17,929 *17,905 *24 *24
53 Real Estate and Rental & Leasing 5,650 4,233 1,417 1,416
54 Professional and Technical Services 17,042 14,673 2,369 2,369
55 Mgmt of Companies & Enterprises 5,333 4,924 409 409
56 Administrative and Waste Services 13,714 13,474 240 *25 *215
61 Educational Services 2,368 2,368
62 Health Care and Social Assistance 56,765 56,765
71 Arts, Entertainment, and Recreation 4,303 4,303
72 Accommodation and Food Services 36,124 36,124
81 Other Services 12,596 12,138 458 458
Total 367,157 318,785 48,372 21,348 7,978 4,891 8,540 5,613
Source: Job Service North Dakota (2016). *Values were estimated due to data suppression from Job Service analysis.

10
8
Appendix Table D10. Statewide Private Employment Wages and Salaries, All Sectors and Direct Employment in Petroleum Industry, North Dakota, 2015
NAICS Sector Designation Statewide Private Employment Salaries and Wages (QCEW)
Industry Segments and Groupings
Total Non Oil & Gas
Oil & Gas
Drilling, Extraction, Production & Refining
Infrastr-ucture
Develop-ment
Professional Service
Transport-ation
Wholesale Trade &
Manufact-uring
--------------------------------------------------------------------------------- millions $ ---------------------------------------------------------------------------------
11 Ag, Forestry, Fishing and Hunting $185.5 $185.5
21 Mining, Quarrying, Oil & Gas $2,362.0 $182.5 $2,179.5 *$2,162.4 *$17.1
22 Utilities $364.7 $304.1 $60.6 $60.6
23 Construction $2,211.8 $1,670.8 $541.0 $541.0
31-33 Manufacturing $1,301.7 $1,161.1 $140.6 *$52.1 *$88.5
42 Wholesale Trade $1,776.5 *$1,394.2 *$382.3 *$382.3
44-45 Retail Trade $1,561.5 $1,561.5
48-49 Transportation and Warehousing $1,290.3 $502.9 $787.4 $107.9 $679.5
51 Information $395.6 $395.6
52 Finance and Insurance $1,061.9 *$1,060.5 *$1.4 *$1.4
53 Real Estate and Rental & Leasing $320.5 $190.6 $129.8 $129.8
54 Professional and Technical Services $1,188.8 $950.6 $238.3 $238.3
55 Mgmt of Companies & Enterprises $434.3 $396.0 $38.2 $38.2
56 Administrative and Waste Services $478.7 $460.8 $17.9 *$2.0 *$15.9
61 Educational Services $75.2 $75.2
62 Health Care and Social Assistance $2,805.0 $2,805.0
71 Arts, Entertainment, and Recreation $70.0 $70.0
72 Accommodation and Food Services $634.3 $634.3
81 Other Services $419.2 $386.3 $32.9 $32.9
Total $18,937.4 $14,387.4 $4,549.9 $2,214.5 $728.6 $456.5 $679.5 $470.8
Source: Job Service North Dakota (2016). *Values were estimated due to data suppression from Job Service analysis.

10
9
Appendix Table D11. Statewide Private Employment, All Sectors and Direct Employment in Petroleum Industry, North Dakota, 2014
NAICS Sector Designation Statewide Private Employment (QCEW)
Industry Segments and Groupings
Total Non Oil & Gas
Oil & Gas
Drilling, Extraction, Production & Refining
Infrastr-ucture
Develop-ment
Professional Service
Transport-ation
Wholesale Trade &
Manufact-uring
11 Ag, Forestry, Fishing and Hunting 4,365 4,365
21 Mining, Quarrying, Oil & Gas 29,836 2,044 27,792 *27,513 *279
22 Utilities 3,709 2,990 719 719
23 Construction 34,767 25,675 9,092 9,091
31-33 Manufacturing 25,953 24,014 1,939 *352 *1,587
42 Wholesale Trade 27,322 *22,423 *4,899 *4,899
44-45 Retail Trade 50,581 50,581
48-49 Transportation and Warehousing 22,113 9,917 12,196 865 11,331
51 Information 6,832 6,832
52 Finance and Insurance 17,624 *17,563 *61 *61
53 Real Estate and Rental & Leasing 5,827 3,714 2,113 2,113
54 Professional and Technical Services 16,734 13,833 2,901 2,902
55 Mgmt of Companies & Enterprises 5,298 4,979 319 320
56 Administrative and Waste Services 14,234 13,931 303 *29 *274
61 Educational Services 2,246 2,246
62 Health Care and Social Assistance 55,523 55,523
71 Arts, Entertainment, and Recreation 4,256 4,256
72 Accommodation and Food Services 36,206 36,206
81 Other Services 12,642 12,035 607 607
Total 376,068 313,127 62,941 27,865 10,983 6,277 11,331 6,486
Source: Job Service North Dakota (2015). *Values were estimated due to data suppression from Job Service analysis.

11
0
Appendix Table D12. Statewide Private Employment Wages and Salaries, All Sectors and Direct Employment in Petroleum Industry, North Dakota, 2014
NAICS Sector Designation Statewide Private Employment Salaries and Wages (QCEW)
Industry Segments and Groupings
Total Non Oil & Gas
Oil & Gas
Drilling, Extraction, Production & Refining
Infrastr-ucture
Develop-ment
Professional Service
Transport-ation
Wholesale Trade &
Manufact-uring
--------------------------------------------------------------------------------- millions $ ---------------------------------------------------------------------------------
11 Ag, Forestry, Fishing and Hunting $180.1 $180.1
21 Mining, Quarrying, Oil & Gas $3,127.2 $185.7 $2,941.5 *$2,920.4 *$21.1
22 Utilities $335.5 $273.0 $62.4 $62.4
23 Construction $2,257.5 $1,468.6 $788.9 $788.8
31-33 Manufacturing $1,291.9 $1,155.1 $136.8 *$37.9 *$98.9
42 Wholesale Trade $1,860.2 *$1,369.3 *$490.9 *$490.9
44-45 Retail Trade $1,502.0 $1,502.0
48-49 Transportation and Warehousing $1,441.8 $420.1 $1,021.7 $100.6 $921.1
51 Information $399.0 $399.0
52 Finance and Insurance $988.4 *$985.0 *$3.4 *$3.4
53 Real Estate and Rental & Leasing $350.4 $142.4 $208.0 $208.0
54 Professional and Technical Services $1,206.9 $879.6 $327.3 $327.3
55 Mgmt of Companies & Enterprises $405.1 $376.7 $28.4 $28.4
56 Administrative and Waste Services $484.8 $463.5 $21.3 *$1.0 *$20.3
61 Educational Services $70.8 $70.8
62 Health Care and Social Assistance $2,594.1 $2,594.1
71 Arts, Entertainment, and Recreation $66.3 $66.3
72 Accommodation and Food Services $625.3 $625.3
81 Other Services $408.6 $362.7 $45.9 $45.9
Total $19,585.6 $13,509.2 $6,076.5 $2,958.3 $973.9 $633.3 $921.1 $589.8
Source: Job Service North Dakota (2015). *Values were estimated due to data suppression from Job Service analysis.

11
1
Appendix Table D13. Statewide Private Employment, All Sectors and Direct Employment in Petroleum Industry, North Dakota, 2013
NAICS Sector Designation Statewide Private Employment (QCEW)
Industry Segments and Groupings
Total Non Oil & Gas
Oil & Gas
Drilling, Extraction, Production & Refining
Infrastr-ucture
Develop-ment
Professional Service
Transport-ation
Wholesale Trade &
Manufact-uring
11 Ag, Forestry, Fishing and Hunting 4,264 4,264
21 Mining, Quarrying, Oil & Gas 26,196 1,961 24,235 *23,962 *273
22 Utilities 3,591 3,026 565 566
23 Construction 32,303 24,317 7,986 7,985
31-33 Manufacturing 25,410 23,619 1,791 *292 *1,499
42 Wholesale Trade 26,403 *21,788 *4,615 *4,615
44-45 Retail Trade 49,005 49,005
48-49 Transportation and Warehousing 20,349 9,488 10,861 688 10,173
51 Information 6,810 6,810
52 Finance and Insurance 17,105 *17,036 *69 *69
53 Real Estate and Rental & Leasing 5,116 3,473 1,643 1,643
54 Professional and Technical Services 15,565 13,186 2,379 2,379
55 Mgmt of Companies & Enterprises 5,127 4,871 256 256
56 Administrative and Waste Services 13,476 13,222 254 *29 *225
61 Educational Services 2,182 2,182
62 Health Care and Social Assistance 55,086 55,086
71 Arts, Entertainment, and Recreation 4,114 4,114
72 Accommodation and Food Services 35,074 35,074
81 Other Services 12,239 11,756 483 483
Total 359,415 304,278 55,137 24,254 9,541 5,055 10,173 6,114
Source: Job Service North Dakota (2014). *Values were estimated due to data suppression from Job Service analysis.

11
2
Appendix Table D14. Statewide Private Employment Wages and Salaries, All Sectors and Direct Employment in Petroleum Industry, North Dakota, 2013
NAICS Sector Designation Statewide Private Employment Salaries and Wages (QCEW)
Industry Segments and Groupings
Total Non Oil & Gas
Oil & Gas
Drilling, Extraction, Production & Refining
Infrastr-ucture
Develop-ment
Professional Service
Transport-ation
Wholesale Trade &
Manufact-uring
--------------------------------------------------------------------------------- millions $ ---------------------------------------------------------------------------------
11 Ag, Forestry, Fishing and Hunting $170.0 $170.0
21 Mining, Quarrying, Oil & Gas $2,568.3 $160.4 $2,407.9 *$2,388.9 *$19.0
22 Utilities $310.5 $265.5 $45.0 $45.0
23 Construction $1,945.3 $1,312.4 $632.9 $632.9
31-33 Manufacturing $1,222.3 $1,101.4 $120.9 *$32.6 *$88.3
42 Wholesale Trade $1,723.4 *$1,281.3 *$442.1 *$442.1
44-45 Retail Trade $1,387.8 $1,387.8
48-49 Transportation and Warehousing $1,244.2 $385.0 $859.2 $74.6 $784.6
51 Information $380.0 $380.0
52 Finance and Insurance $921.2 *$917.7 *$3.5 *$3.5
53 Real Estate and Rental & Leasing $274.3 $121.8 $152.5 $152.5
54 Professional and Technical Services $1,047.4 $785.2 $262.3 $262.3
55 Mgmt of Companies & Enterprises $358.8 $336.0 $22.8 $22.8
56 Administrative and Waste Services $430.3 $413.7 $16.6 *$0.9 *$15.7
61 Educational Services $65.5 $65.5
62 Health Care and Social Assistance $2,463.6 $2,463.6
71 Arts, Entertainment, and Recreation $62.9 $62.9
72 Accommodation and Food Services $574.2 $574.2
81 Other Services $368.0 $334.0 $34.1 $34.1
Total $17,518.0 $12,518.1 $4,999.8 $2,421.5 $772.4 $490.9 $784.6 $530.4
Source: Job Service North Dakota (2014). *Values were estimated due to data suppression from Job Service analysis.

113
Economic Impacts by Industry Segments, Delineated by 2-Digit NAICS Codes, Petroleum Industry, North Dakota, 2017 and 2019
Appendix E

114
Appendix Table E1. Employment, Direct, Indirect, and Induced Economic Effects, by Economic Sector, Oil and Gas Development, Petroleum Industry, North Dakota, 2019
NAICS Code and Economic Sector Direct Indirect Induced Total ----------------------------------- jobs -----------------------------------
11 Ag, Forestry, Fishing & Hunting 0 8 20 28
21 Mining 6,832 27 1 6,860
22 Utilities 0 14 21 35
23 Construction 0 192 36 228
31-33 Manufacturing 0 44 18 62
42 Wholesale Trade 0 440 127 567
44-45 Retail trade 0 72 1,009 1,081
48-49 Transportation & Warehousing 0 290 193 482
51 Information 0 84 77 161
52 Finance & insurance 0 1,081 389 1,470
53 Real Estate & Rental 0 422 245 667
54 Professional, Scientific & Tech Services 0 1,409 145 1,554
55 Management of Companies 0 165 27 192
56 Administrative & Waste Services 0 708 169 876
61 Educational Services 0 0 1,315 1,315
62 Health & Social Services 0 3 111 114
71 Arts, Entertainment & Recreation 0 37 173 210
72 Accommodation & Food Services 0 392 690 1,082
81 Other Services 0 236 571 807
92 Government 0 33 49 82
Totals 6,832 5,656 5,386 17,874
Appendix Table E2. Employment Compensation, Direct, Indirect, and Induced Economic Effects, by Economic Sector, Oil and Gas Development, Petroleum Industry, North Dakota, 2019
NAICS Code and Economic Sector Direct Indirect Induced Total ----------------------------------- 000s $ -----------------------------------
11 Ag, Forestry, Fishing & Hunting 0 54 232 286
21 Mining 861,400 1,990 90 863,480
22 Utilities 0 2,138 3,149 5,288
23 Construction 0 10,301 1,865 12,167
31-33 Manufacturing 0 2,898 1,006 3,904
42 Wholesale Trade 0 37,972 10,280 48,253
44-45 Retail trade 0 2,842 28,323 31,165
48-49 Transportation & Warehousing 0 14,558 8,754 23,311
51 Information 0 5,826 5,805 11,630
52 Finance & insurance 0 56,174 22,749 78,923
53 Real Estate & Rental 0 17,432 3,021 20,452
54 Professional, Scientific & Tech Services 0 97,134 8,406 105,540
55 Management of Companies 0 18,720 3,061 21,781
56 Administrative & Waste Services 0 22,513 5,846 28,359
61 Educational Services 0 2 81,359 81,361
62 Health & Social Services 0 66 2,815 2,881
71 Arts, Entertainment & Recreation 0 354 2,576 2,930
72 Accommodation & Food Services 0 8,211 14,594 22,804
81 Other Services 0 10,675 18,808 29,483
92 Government 0 1,862 3,564 5,425
Total 861,400 311,719 226,303 1,399,422

115
Appendix Table E3. Gross Business Volume, Direct, Indirect, and Induced Economic Effects, by Economic Sector, Oil and Gas Development, Petroleum Industry, North Dakota, 2019
NAICS Code and Economic Sector Direct Indirect Induced Total ----------------------------------- millions $ -----------------------------------
11 Ag, Forestry, Fishing & Hunting 0 0 2 3
21 Mining 3,844 16 0 3,860
22 Utilities 0 16 23 39
23 Construction 0 44 8 52
31-33 Manufacturing 0 19 6 25
42 Wholesale Trade 0 142 39 181
44-45 Retail trade 0 8 84 92
48-49 Transportation & Warehousing 0 40 23 63
51 Information 0 32 27 59
52 Finance & insurance 0 258 104 362
53 Real Estate & Rental 0 152 140 291
54 Professional, Scientific & Tech Services 0 214 20 235
55 Management of Companies 0 36 6 41
56 Administrative & Waste Services 0 59 15 74
61 Educational Services 0 0 163 163
62 Health & Social Services 0 0 6 6
71 Arts, Entertainment & Recreation 0 2 11 13
72 Accommodation & Food Services 0 26 44 70
81 Other Services 0 27 49 76
92 Government 0 6 14 19
Total 3,843.6 1,096.1 785.4 5,725.1
Appendix Table E4. Value-added Activity, Direct, Indirect, and Induced Economic Effects, by Economic Sector, Oil and Gas Development, Petroleum Industry, North Dakota, 2019
NAICS Code and Economic Sector Direct Indirect Induced Total ----------------------------------- 000s $ -----------------------------------
11 Ag, Forestry, Fishing & Hunting 0 145 975 1,120
21 Mining 1,582,712 8,341 166 1,591,218
22 Utilities 0 5,740 8,308 14,048
23 Construction 0 21,615 3,797 25,413
31-33 Manufacturing 0 6,235 1,689 7,924
42 Wholesale Trade 0 84,191 21,491 105,682
44-45 Retail trade 0 4,891 44,527 49,418
48-49 Transportation & Warehousing 0 23,773 13,329 37,103
51 Information 0 15,859 14,486 30,345
52 Finance & insurance 0 98,556 40,264 138,820
53 Real Estate & Rental 0 107,365 100,008 207,373
54 Professional, Scientific & Tech Services 0 126,247 11,668 137,915
55 Management of Companies 0 20,517 3,355 23,872
56 Administrative & Waste Services 0 32,110 8,119 40,229
61 Educational Services 0 2 96,026 96,028
62 Health & Social Services 0 85 3,308 3,393
71 Arts, Entertainment & Recreation 0 611 4,798 5,409
72 Accommodation & Food Services 0 12,791 22,532 35,323
81 Other Services 0 16,670 27,964 44,634
92 Government 0 -19,626 1,161 -18,465
Total 1,582,712 566,120 427,969 2,576,801

116
Appendix Table E5. Employment, Direct, Indirect, and Induced Economic Effects, by Economic Sector, Oil and Gas Production, Petroleum Industry, North Dakota, 2019
NAICS Code and Economic Sector Direct Indirect Induced Total ----------------------------------- 000s $ -----------------------------------
11 Ag, Forestry, Fishing & Hunting 0 4 37 40
21 Mining 11,626 20 2 11,647
22 Utilities 0 133 38 171
23 Construction 0 218 66 284
31-33 Manufacturing 0 62 34 96
42 Wholesale Trade 0 607 233 840
44-45 Retail trade 0 97 1,852 1,949
48-49 Transportation & Warehousing 0 896 353 1,250
51 Information 0 159 141 300
52 Finance & insurance 0 1,272 713 1,985
53 Real Estate & Rental 0 612 450 1,062
54 Professional, Scientific & Tech Services 0 2,488 266 2,754
55 Management of Companies 0 787 49 837
56 Administrative & Waste Services 0 936 309 1,246
61 Educational Services 0 0 2,412 2,412
62 Health & Social Services 0 4 202 206
71 Arts, Entertainment & Recreation 0 61 317 378
72 Accommodation & Food Services 0 354 1,266 1,620
81 Other Services 0 221 1,047 1,269
92 Government 0 189 91 279
Total 11,626 9,120 9,879 30,625
Appendix Table E6. Employment Compensation, Direct, Indirect, and Induced Economic Effects, by Economic Sector, Oil and Gas Production, Petroleum Industry, North Dakota, 2019
NAICS Code and Economic Sector Direct Indirect Induced Total ----------------------------------- 000s $ -----------------------------------
11 Ag, Forestry, Fishing & Hunting 0 36 427 462
21 Mining 1,376,058 1,621 166 1,377,844
22 Utilities 0 19,749 5,782 25,530
23 Construction 0 11,659 3,422 15,081
31-33 Manufacturing 0 4,167 1,847 6,013
42 Wholesale Trade 0 51,083 18,868 69,950
44-45 Retail trade 0 3,678 51,980 55,658
48-49 Transportation & Warehousing 0 99,513 16,060 115,573
51 Information 0 10,561 10,654 21,215
52 Finance & insurance 0 74,638 41,717 116,355
53 Real Estate & Rental 0 21,602 5,544 27,145
54 Professional, Scientific & Tech Services 0 166,372 15,415 181,787
55 Management of Companies 0 89,504 5,616 95,120
56 Administrative & Waste Services 0 32,690 10,720 43,409
61 Educational Services 0 2 149,235 149,237
62 Health & Social Services 0 88 5,145 5,234
71 Arts, Entertainment & Recreation 0 554 4,722 5,276
72 Accommodation & Food Services 0 7,484 26,772 34,256
81 Other Services 0 10,338 34,490 44,828
92 Government 0 14,314 6,542 20,856
Total 1,376,058 619,649 415,121 2,410,828

117
Appendix Table E7. Gross Business Volume, Direct, Indirect, and Induced Economic Effects, by Economic Sector, Oil and Gas Production, Petroleum Industry, North Dakota, 2019
NAICS Code and Economic Sector Direct Indirect Induced Total ----------------------------------- millions $ -----------------------------------
11 Ag, Forestry, Fishing & Hunting 0 0 3 3
21 Mining 27,430 10 0 27,441
22 Utilities 0 138 27 165
23 Construction 0 50 9 59
31-33 Manufacturing 0 26 7 33
42 Wholesale Trade 0 191 46 236
44-45 Retail trade 0 10 98 108
48-49 Transportation & Warehousing 0 240 27 267
51 Information 0 58 31 89
52 Finance & insurance 0 349 120 469
53 Real Estate & Rental 0 200 161 361
54 Professional, Scientific & Tech Services 0 345 23 368
55 Management of Companies 0 170 7 177
56 Administrative & Waste Services 0 86 17 103
61 Educational Services 0 0 189 189
62 Health & Social Services 0 0 7 7
71 Arts, Entertainment & Recreation 0 3 12 16
72 Accommodation & Food Services 0 23 51 74
81 Other Services 0 26 57 83
92 Government 0 52 16 68
Total 27,430.3 1,978.8 907.5 30,316.5
Appendix Table E8. Value-added Activity, Direct, Indirect, and Induced Economic Effects, by Economic Sector, Oil and Gas Production, Petroleum Industry, North Dakota, 2019
NAICS Code and Economic Sector Direct Indirect Induced Total ----------------------------------- 000s $ -----------------------------------
11 Ag, Forestry, Fishing & Hunting 0 127 1,789 1,916
21 Mining 19,667,024 5,453 304 19,672,780
22 Utilities 0 50,698 15,251 65,949
23 Construction 0 24,452 6,967 31,418
31-33 Manufacturing 0 8,596 3,100 11,696
42 Wholesale Trade 0 111,941 39,442 151,384
44-45 Retail trade 0 6,396 81,717 88,114
48-49 Transportation & Warehousing 0 171,057 24,451 195,508
51 Information 0 26,929 26,591 53,520
52 Finance & insurance 0 138,079 73,846 211,925
53 Real Estate & Rental 0 134,443 183,483 317,926
54 Professional, Scientific & Tech Services 0 212,343 21,397 233,740
55 Management of Companies 0 98,097 6,155 104,251
56 Administrative & Waste Services 0 47,502 14,889 62,391
61 Educational Services 0 2 176,135 176,138
62 Health & Social Services 0 116 6,048 6,164
71 Arts, Entertainment & Recreation 0 996 8,801 9,797
72 Accommodation & Food Services 0 11,545 41,337 52,882
81 Other Services 0 16,057 51,280 67,337
92 Government 0 7,350 2,156 9,506
Total 19,667,024 1,072,178 785,138 21,524,340

118
Appendix Table E9. Employment, Direct, Indirect, and Induced Economic Effects, by Economic Sector, Oil and Gas Processing and Transportation, Petroleum Industry, North Dakota, 2019
NAICS Code and Economic Sector Direct Indirect Induced Total ----------------------------------- jobs -----------------------------------
11 Ag, Forestry, Fishing & Hunting 0 1 7 8
21 Mining 853 15 0 868
22 Utilities 0 60 7 67
23 Construction 0 255 12 267
31-33 Manufacturing 386 13 6 405
42 Wholesale Trade 114 39 43 196
44-45 Retail trade 0 73 338 411
48-49 Transportation & Warehousing 644 407 64 1,116
51 Information 0 25 26 51
52 Finance & insurance 0 100 130 230
53 Real Estate & Rental 0 71 82 153
54 Professional, Scientific & Tech Services 0 177 49 225
55 Management of Companies 0 70 9 79
56 Administrative & Waste Services 0 236 56 293
61 Educational Services 0 0 440 440
62 Health & Social Services 0 2 37 39
71 Arts, Entertainment & Recreation 0 8 58 66
72 Accommodation & Food Services 0 92 231 323
81 Other Services 0 122 191 313
92 Government 0 24 17 40
Total 1,997 1,790 1,803 5,589
Appendix Table E10. Employment Compensation, Direct, Indirect, and Induced Economic Effects, by Economic Sector, Oil and Gas Processing and Transportation, Petroleum Industry, North Dakota, 2019
NAICS Code and Economic Sector Direct Indirect Induced Total ----------------------------------- 000s $ -----------------------------------
11 Ag, Forestry, Fishing & Hunting 0 14 78 92
21 Mining 54,314 1,314 30 55,658
22 Utilities 0 7,618 1,054 8,672
23 Construction 0 11,770 624 12,394
31-33 Manufacturing 31,417 763 337 32,517
42 Wholesale Trade 5,170 2,802 3,441 11,413
44-45 Retail trade 0 1,928 9,481 11,409
48-49 Transportation & Warehousing 63,216 34,007 2,930 100,152
51 Information 0 1,494 1,943 3,437
52 Finance & insurance 0 4,985 7,613 12,598
53 Real Estate & Rental 0 1,714 1,011 2,725
54 Professional, Scientific & Tech Services 0 10,284 2,813 13,097
55 Management of Companies 0 6,902 1,025 7,927
56 Administrative & Waste Services 0 7,043 1,956 8,999
61 Educational Services 0 1 27,230 27,230
62 Health & Social Services 0 40 941 981
71 Arts, Entertainment & Recreation 0 60 862 922
72 Accommodation & Food Services 0 1,690 4,884 6,574
81 Other Services 0 5,092 6,294 11,386
92 Government 0 1,576 1,193 2,769
Total 154,117 101,095 75,741 330,953

119
Appendix Table E11. Gross Business Volume, Direct, Indirect, and Induced Economic Effects, by Economic Sector, Oil and Gas Processing and Transportation, Petroleum Industry, North Dakota, 2019
NAICS Code and Economic Sector Direct Indirect Induced Total ----------------------------------- millions $ -----------------------------------
11 Ag, Forestry, Fishing & Hunting 0 0 1 1
21 Mining 79 5 0 84
22 Utilities 0 59 8 66
23 Construction 0 50 3 52
31-33 Manufacturing 2,646 4 2 2,653
42 Wholesale Trade 47 11 13 71
44-45 Retail trade 0 7 28 35
48-49 Transportation & Warehousing 118 79 8 205
51 Information 0 8 9 17
52 Finance & insurance 0 21 35 56
53 Real Estate & Rental 0 17 47 63
54 Professional, Scientific & Tech Services 0 24 7 30
55 Management of Companies 0 13 2 15
56 Administrative & Waste Services 0 17 5 22
61 Educational Services 0 0 55 55
62 Health & Social Services 0 0 2 2
71 Arts, Entertainment & Recreation 0 0 4 4
72 Accommodation & Food Services 0 5 15 20
81 Other Services 0 11 17 28
92 Government 0 6 5 10
Total 2,890.3 335.4 262.9 3,488.6
Appendix Table E12. Value-added Activity, Direct, Indirect, and Induced Economic Effects, by Economic Sector, Oil and Gas Processing and Transportation, Petroleum Industry, North Dakota, 2019
NAICS Code and Economic Sector Direct Indirect Induced Total ----------------------------------- 000s $ -----------------------------------
11 Ag, Forestry, Fishing & Hunting 0 48 326 374
21 Mining 84,985 2,764 55 87,805
22 Utilities 0 23,233 2,781 26,015
23 Construction 0 27,469 1,271 28,740
31-33 Manufacturing 292,452 1,627 565 294,644
42 Wholesale Trade 50,117 7,252 7,194 64,562
44-45 Retail trade 0 4,258 14,905 19,163
48-49 Transportation & Warehousing 124,554 61,573 4,461 190,588
51 Information 0 4,579 4,850 9,428
52 Finance & insurance 0 9,562 13,475 23,037
53 Real Estate & Rental 0 11,804 33,474 45,278
54 Professional, Scientific & Tech Services 0 15,539 3,905 19,443
55 Management of Companies 0 8,415 1,123 9,537
56 Administrative & Waste Services 0 10,682 2,717 13,399
61 Educational Services 0 1 32,138 32,139
62 Health & Social Services 0 62 1,106 1,168
71 Arts, Entertainment & Recreation 0 130 1,606 1,736
72 Accommodation & Food Services 0 2,888 7,542 10,429
81 Other Services 0 8,236 9,358 17,594
92 Government 0 1,553 390 1,944
Total 552,107 201,674 143,243 897,024

120
Appendix Table E13. Employment, Direct, Indirect, and Induced Economic Effects, by Economic Sector, Oil and Gas Development, Petroleum Industry, North Dakota, 2017
NAICS Code and Economic Sector Direct Indirect Induced Total ----------------------------------- jobs -----------------------------------
11 Ag, Forestry, Fishing & Hunting 0 4 7 11
21 Mining 6,031 28 1 6,060
22 Utilities 0 13 10 23
23 Construction 0 225 29 254
31-33 Manufacturing 0 22 12 34
42 Wholesale Trade 0 255 97 352
44-45 Retail trade 0 42 621 664
48-49 Transportation & Warehousing 0 98 88 186
51 Information 0 71 44 115
52 Finance & insurance 0 609 233 842
53 Real Estate & Rental 0 207 151 358
54 Professional, Scientific & Tech Services 0 863 101 964
55 Management of Companies 0 192 19 211
56 Administrative & Waste Services 0 451 119 570
61 Educational Services 0 0 82 83
62 Health & Social Services 0 0 710 710
71 Arts, Entertainment & Recreation 0 26 82 107
72 Accommodation & Food Services 0 495 402 897
81 Other Services 0 103 361 464
92 Government 0 15 32 48
Totals 6,031 3,720 3,200 12,951
Appendix Table E14. Employment Compensation, Direct, Indirect, and Induced Economic Effects, by Economic Sector, Oil and Gas Development, Petroleum Industry, North Dakota, 2017
NAICS Code and Economic Sector Direct Indirect Induced Total ----------------------------------- 000s $ -----------------------------------
11 Ag, Forestry, Fishing & Hunting 0 39 109 147
21 Mining 709,978 2,299 66 712,344
22 Utilities 0 1,825 1,315 3,139
23 Construction 0 11,355 1,470 12,825
31-33 Manufacturing 0 1,302 687 1,989
42 Wholesale Trade 0 18,592 7,086 25,678
44-45 Retail trade 0 1,414 17,875 19,289
48-49 Transportation & Warehousing 0 5,486 4,459 9,945
51 Information 0 4,522 3,011 7,533
52 Finance & insurance 0 26,184 12,284 38,468
53 Real Estate & Rental 0 8,607 1,400 10,007
54 Professional, Scientific & Tech Services 0 65,790 4,990 70,780
55 Management of Companies 0 18,122 1,822 19,945
56 Administrative & Waste Services 0 16,162 3,856 20,018
61 Educational Services 0 7 1,859 1,866
62 Health & Social Services 0 1 40,841 40,842
71 Arts, Entertainment & Recreation 0 210 1,211 1,421
72 Accommodation & Food Services 0 9,564 8,081 17,645
81 Other Services 0 4,667 9,925 14,592
92 Government 0 872 2,039 2,911
Total 709,978 197,018 124,386 1,031,382

121
Appendix Table E15. Gross Business Volume, Direct, Indirect, and Induced Economic Effects, by Economic Sector, Oil and Gas Development, Petroleum Industry, North Dakota, 2017
NAICS Code and Economic Sector Direct Indirect Induced Total ----------------------------------- 000s $ -----------------------------------
11 Ag, Forestry, Fishing & Hunting 0 266 1,171 1,437
21 Mining 3,381,445 7,973 296 3,389,713
22 Utilities 0 16,060 11,493 27,553
23 Construction 0 39,431 5,141 44,572
31-33 Manufacturing 0 8,382 4,890 13,273
42 Wholesale Trade 0 65,665 25,026 90,692
44-45 Retail trade 0 3,963 55,748 59,711
48-49 Transportation & Warehousing 0 14,981 12,528 27,508
51 Information 0 23,193 14,769 37,962
52 Finance & insurance 0 117,128 51,775 168,903
53 Real Estate & Rental 0 84,739 80,871 165,610
54 Professional, Scientific & Tech Services 0 126,132 11,907 138,039
55 Management of Companies 0 39,906 4,013 43,919
56 Administrative & Waste Services 0 35,823 9,378 45,202
61 Educational Services 0 17 3,652 3,669
62 Health & Social Services 0 2 77,217 77,219
71 Arts, Entertainment & Recreation 0 1,057 5,549 6,605
72 Accommodation & Food Services 0 38,995 23,390 62,385
81 Other Services 0 14,076 24,775 38,851
92 Government 0 2,577 7,638 10,215
Total 3,381,445 640,366 431,227 4,453,037
Appendix Table E16. Value-added Activity, Direct, Indirect, and Induced Economic Effects, by Economic Sector, Oil and Gas Development, Petroleum Industry, North Dakota, 2017
NAICS Code and Economic Sector Direct Indirect Induced Total ----------------------------------- 000s $ -----------------------------------
11 Ag, Forestry, Fishing & Hunting 0 138 639 777
21 Mining 1,875,816 6,799 159 1,882,774
22 Utilities 0 5,940 4,314 10,254
23 Construction 0 21,338 2,665 24,002
31-33 Manufacturing 0 2,642 1,259 3,901
42 Wholesale Trade 0 46,207 17,610 63,817
44-45 Retail trade 0 2,466 33,144 35,609
48-49 Transportation & Warehousing 0 9,146 7,333 16,479
51 Information 0 10,295 7,167 17,462
52 Finance & insurance 0 45,559 22,790 68,350
53 Real Estate & Rental 0 64,556 54,580 119,136
54 Professional, Scientific & Tech Services 0 76,030 7,329 83,359
55 Management of Companies 0 20,968 2,108 23,076
56 Administrative & Waste Services 0 25,367 5,984 31,351
61 Educational Services 0 8 1,876 1,884
62 Health & Social Services 0 1 47,636 47,637
71 Arts, Entertainment & Recreation 0 334 2,273 2,606
72 Accommodation & Food Services 0 22,024 12,710 34,734
81 Other Services 0 10,185 16,541 26,725
92 Government 0 -5,973 -1,364 -7,337
Total 1,875,816 364,028 246,753 2,486,596

122
Appendix Table E17. Employment, Direct, Indirect, and Induced Economic Effects, by Economic Sector, Oil and Gas Production, Petroleum Industry, North Dakota, 2017
NAICS Code and Economic Sector Direct Indirect Induced Total ----------------------------------- jobs -----------------------------------
11 Ag, Forestry, Fishing & Hunting 0 3 30 33
21 Mining 10,286 17 3 10,306
22 Utilities 0 47 39 85
23 Construction 0 878 115 993
31-33 Manufacturing 0 33 47 79
42 Wholesale Trade 0 297 391 688
44-45 Retail trade 0 127 2,513 2,640
48-49 Transportation & Warehousing 0 439 358 796
51 Information 0 95 177 271
52 Finance & insurance 0 440 925 1,365
53 Real Estate & Rental 0 288 599 886
54 Professional, Scientific & Tech Services 0 801 409 1,210
55 Management of Companies 0 742 78 820
56 Administrative & Waste Services 0 357 484 841
61 Educational Services 0 1 352 352
62 Health & Social Services 0 0 2,864 2,864
71 Arts, Entertainment & Recreation 0 36 336 372
72 Accommodation & Food Services 0 291 1,626 1,917
81 Other Services 0 84 1,447 1,531
92 Government 0 57 128 185
Total 10,286 5,031 12,919 28,236
Appendix Table E18. Employment Compensation, Direct, Indirect, and Induced Economic Effects, by Economic Sector, Oil and Gas Production, Petroleum Industry, North Dakota, 2017
NAICS Code and Economic Sector Direct Indirect Induced Total ----------------------------------- 000s $ -----------------------------------
11 Ag, Forestry, Fishing & Hunting 0 35 440 475
21 Mining 1,273,783 1,398 268 1,275,449
22 Utilities 0 6,076 5,252 11,328
23 Construction 0 44,690 6,000 50,690
31-33 Manufacturing 0 1,962 2,788 4,750
42 Wholesale Trade 0 21,891 28,812 50,703
44-45 Retail trade 0 3,959 72,969 76,929
48-49 Transportation & Warehousing 0 51,944 18,239 70,182
51 Information 0 5,935 12,155 18,091
52 Finance & insurance 0 21,956 49,420 71,376
53 Real Estate & Rental 0 12,203 5,613 17,815
54 Professional, Scientific & Tech Services 0 57,187 20,479 77,666
55 Management of Companies 0 70,888 7,403 78,291
56 Administrative & Waste Services 0 13,869 15,814 29,684
61 Educational Services 0 10 8,027 8,037
62 Health & Social Services 0 1 164,553 164,554
71 Arts, Entertainment & Recreation 0 322 5,020 5,342
72 Accommodation & Food Services 0 5,732 32,955 38,687
81 Other Services 0 3,763 40,000 43,764
92 Government 0 3,831 8,159 11,990
Total 1,273,783 327,652 504,366 2,105,801

123
Appendix Table E19. Gross Business Volume, Direct, Indirect, and Induced Economic Effects, by Economic Sector, Oil and Gas Production, Petroleum Industry, North Dakota, 2017
NAICS Code and Economic Sector Direct Indirect Induced Total ----------------------------------- 000s $ -----------------------------------
11 Ag, Forestry, Fishing & Hunting 0 266 3,322 3,588
21 Mining 22,214,571 5,300 834 22,220,705
22 Utilities 0 52,510 31,774 84,284
23 Construction 0 155,895 14,658 170,553
31-33 Manufacturing 0 11,029 13,744 24,773
42 Wholesale Trade 0 76,948 70,393 147,340
44-45 Retail trade 0 11,110 157,328 168,437
48-49 Transportation & Warehousing 0 117,101 35,665 152,766
51 Information 0 28,524 40,998 69,522
52 Finance & insurance 0 88,158 144,042 232,200
53 Real Estate & Rental 0 124,033 230,453 354,486
54 Professional, Scientific & Tech Services 0 111,400 33,995 145,395
55 Management of Companies 0 155,590 11,294 166,884
56 Administrative & Waste Services 0 33,183 26,798 59,981
61 Educational Services 0 27 11,009 11,035
62 Health & Social Services 0 2 216,463 216,466
71 Arts, Entertainment & Recreation 0 1,627 15,873 17,500
72 Accommodation & Food Services 0 21,944 66,317 88,261
81 Other Services 0 11,330 69,542 80,873
92 Government 0 14,243 21,163 35,407
Total 22,214,571 1,020,219 1,215,664 24,450,455
Appendix Table E20. Value-added Activity, Direct, Indirect, and Induced Economic Effects, by Economic Sector, Oil and Gas Production, Petroleum Industry, North Dakota, 2017
NAICS Code and Economic Sector Direct Indirect Induced Total ----------------------------------- 000s $ -----------------------------------
11 Ag, Forestry, Fishing & Hunting 0 136 2,605 2,741
21 Mining 18,383,825 3,974 641 18,388,439
22 Utilities 0 20,093 17,234 37,327
23 Construction 0 83,984 10,874 94,858
31-33 Manufacturing 0 3,588 5,105 8,692
42 Wholesale Trade 0 54,406 71,606 126,012
44-45 Retail trade 0 6,749 135,291 142,040
48-49 Transportation & Warehousing 0 83,689 30,037 113,725
51 Information 0 12,569 28,852 41,421
52 Finance & insurance 0 37,964 91,780 129,744
53 Real Estate & Rental 0 93,257 223,623 316,880
54 Professional, Scientific & Tech Services 0 67,841 30,091 97,932
55 Management of Companies 0 82,018 8,565 90,584
56 Administrative & Waste Services 0 21,156 24,555 45,711
61 Educational Services 0 12 8,082 8,094
62 Health & Social Services 0 1 192,318 192,319
71 Arts, Entertainment & Recreation 0 514 9,329 9,843
72 Accommodation & Food Services 0 12,309 51,829 64,137
81 Other Services 0 8,239 66,860 75,099
92 Government 0 1,600 -5,722 -4,121
Total 18,383,825 594,097 1,003,555 19,981,477

124
Appendix Table E21. Employment, Direct, Indirect, and Induced Economic Effects, by Economic Sector, Oil and Gas Processing and Transportation, Petroleum Industry, North Dakota, 2017
NAICS Code and Economic Sector Direct Indirect Induced Total ----------------------------------- jobs -----------------------------------
11 Ag, Forestry, Fishing & Hunting 0 0 4 4
21 Mining 0 1 0 1
22 Utilities 735 7 5 746
23 Construction 0 168 14 182
31-33 Manufacturing 288 7 6 300
42 Wholesale Trade 99 251 46 396
44-45 Retail trade 0 31 295 327
48-49 Transportation & Warehousing 644 335 42 1,021
51 Information 0 23 21 44
52 Finance & insurance 0 133 111 244
53 Real Estate & Rental 0 58 72 130
54 Professional, Scientific & Tech Services 0 221 48 269
55 Management of Companies 0 42 9 51
56 Administrative & Waste Services 0 157 57 214
61 Educational Services 0 1 39 40
62 Health & Social Services 0 0 338 338
71 Arts, Entertainment & Recreation 0 14 39 53
72 Accommodation & Food Services 0 63 191 254
81 Other Services 0 58 172 230
92 Government 0 11 15 26
Total 1,766 1,583 1,522 4,871
Appendix Table E22. Employment Compensation, Direct, Indirect, and Induced Economic Effects, by Economic Sector, Oil and Gas Processing and Transportation, Petroleum Industry, North Dakota, 2017
NAICS Code and Economic Sector Direct Indirect Induced Total ----------------------------------- 000s $ -----------------------------------
11 Ag, Forestry, Fishing & Hunting 0 5 50 55
21 Mining 0 95 31 125
22 Utilities 97,500 867 606 98,973
23 Construction 0 7,835 675 8,509
31-33 Manufacturing 57,701 333 316 58,349
42 Wholesale Trade 7,229 16,934 3,256 27,419
44-45 Retail trade 0 886 8,208 9,094
48-49 Transportation & Warehousing 91,452 29,289 2,047 122,787
51 Information 0 1,232 1,385 2,618
52 Finance & insurance 0 7,974 5,654 13,627
53 Real Estate & Rental 0 600 645 1,244
54 Professional, Scientific & Tech Services 0 11,071 2,289 13,361
55 Management of Companies 0 3,675 837 4,512
56 Administrative & Waste Services 0 4,617 1,769 6,387
61 Educational Services 0 30 846 875
62 Health & Social Services 0 0 18,792 18,792
71 Arts, Entertainment & Recreation 0 108 555 662
72 Accommodation & Food Services 0 1,186 3,711 4,897
81 Other Services 0 2,010 4,567 6,576
92 Government 0 655 939 1,594
Total 253,881 89,401 57,175 400,457

125
Appendix Table E23. Gross Business Volume, Direct, Indirect, and Induced Economic Effects, by Economic Sector, Oil and Gas Processing and Transportation, Petroleum Industry, North Dakota, 2017
NAICS Code and Economic Sector Direct Indirect Induced Total ----------------------------------- 000s $ -----------------------------------
11 Ag, Forestry, Fishing & Hunting 0 67 658 725
21 Mining 0 529 167 696
22 Utilities 348,748 9,170 6,476 364,394
23 Construction 0 32,713 2,887 35,600
31-33 Manufacturing 1,701,729 1,906 2,749 1,706,384
42 Wholesale Trade 25,533 71,915 14,062 111,510
44-45 Retail trade 0 3,004 31,306 34,310
48-49 Transportation & Warehousing 194,749 84,614 7,030 286,393
51 Information 0 6,736 8,314 15,050
52 Finance & insurance 0 32,615 29,150 61,765
53 Real Estate & Rental 0 14,219 45,381 59,600
54 Professional, Scientific & Tech Services 0 27,346 6,681 34,027
55 Management of Companies 0 9,729 2,255 11,984
56 Administrative & Waste Services 0 13,533 5,258 18,791
61 Educational Services 0 86 2,034 2,120
62 Health & Social Services 0 1 43,446 43,448
71 Arts, Entertainment & Recreation 0 611 3,112 3,723
72 Accommodation & Food Services 0 4,047 13,137 17,184
81 Other Services 0 7,880 13,936 21,816
92 Government 0 2,994 4,304 7,297
Total 2,270,758 323,715 242,343 2,836,816
Appendix Table E24. Value-added Activity, Direct, Indirect, and Induced Economic Effects, by Economic Sector, Oil and Gas Processing and Transportation, Petroleum Industry, North Dakota, 2017
NAICS Code and Economic Sector Direct Indirect Induced Total ----------------------------------- 000s $ -----------------------------------
11 Ag, Forestry, Fishing & Hunting 0 33 339 372
21 Mining 0 272 85 357
22 Utilities 132,008 3,224 2,296 137,528
23 Construction 0 16,789 1,414 18,203
31-33 Manufacturing 281,667 585 669 282,921
42 Wholesale Trade 17,967 47,995 9,348 75,310
44-45 Retail trade 0 1,716 17,583 19,299
48-49 Transportation & Warehousing 145,195 53,981 3,888 203,064
51 Information 0 2,742 3,811 6,552
52 Finance & insurance 0 15,666 12,116 27,782
53 Real Estate & Rental 0 9,481 28,938 38,418
54 Professional, Scientific & Tech Services 0 16,509 3,885 20,394
55 Management of Companies 0 4,848 1,119 5,968
56 Administrative & Waste Services 0 8,265 3,172 11,437
61 Educational Services 0 38 986 1,024
62 Health & Social Services 0 1 25,316 25,316
71 Arts, Entertainment & Recreation 0 190 1,205 1,394
72 Accommodation & Food Services 0 2,071 6,744 8,815
81 Other Services 0 5,432 8,789 14,221
92 Government 0 143 -720 -577
Total 576,836 189,980 130,980 897,796

126