petroleum industry’s economic contribution to north dakota...
TRANSCRIPT
Agribusiness and Applied Economics Report 710 March 2013
Petroleum Industry’s
Economic Contribution to
North Dakota in 2011
Dean A. Bangsund Nancy M. Hodur
North Dakota State University Fargo, ND 58108
ACKNOWLEDGMENTS
Special thanks are extended to Ron Ness, President, North Dakota Petroleum Council, for hisleadership, guidance, and information throughout the study, and to Alexis Brinkman and TessaSandstrom, North Dakota Petroleum Council, who assisted and shared responsibility for administeringthe surveys, collecting data, and soliciting industry cooperation in the study.
Several individuals were helpful at various stages of the study. Our appreciation and thanks areextended to:
Justin Kringstad (North Dakota Pipeline Authority)Lynn Helms (North Dakota Industrial Commission)Bruce Hicks (North Dakota Industrial Commission)Rick Ross (Whiting Petroleum Company)Terry Kovacevich (Marathon Oil)Tod Maleckar (Diamond Resources)Kent Ellis (Aurora Energy Solutions)William LaCrosse (Empire Oil Company)B.J. Kadrmas (B.J. Kadrmas, Inc.)Barry Schumacher (Workforce Safety and Insurance)Pam Rennich and Jeff Engleson (State Land Department)Kathy Strombeck (Office of State Tax Commissioner)Larry Melvin (U.S. Forest Service)Cody Huseby (Rocky Mountain Oil Journal)Claire Shaeffer (Office of Natural Resource Revenue)Randy Coon (Department of Agribusiness and Applied Economics)Edie Nelson (Department of Agribusiness and Applied Economics)Norma Ackerson (Department of Agribusiness and Applied Economics)
The study authors and study sponsors would like to thank all the companies and individuals thattook the time to complete and return the survey materials. This study, with its reliance on industry data,would not have been possible without industry cooperation.
Thanks are given to Norma Ackerson for document preparation, Edie Nelson for work with thestudy surveys, and to our colleagues for reviewing this manuscript.
Financial support was provided by the North Dakota Petroleum Council. We express ourappreciation for their support.
The authors assume responsibility for any errors of omission, logic, or otherwise. Any opinions,findings, or conclusions expressed in this publication are those of the authors and do not necessarilyreflect the views of the North Dakota Petroleum Council or the NDSU Department of Agribusiness andApplied Economics.
A single copy of this publication is available free of charge. Please address your inquiry to theDepartment of Agribusiness and Applied Economics, North Dakota State University, PO Box 5636,Fargo, ND 58105-5636, phone (701-231-7441), fax (701-231-7400), or e-mail: [email protected] . This publication is also available electronically at the following web site: http://ageconsearch.umn.edu/
NDSU is equal opportunity institution.
Copyright © 2013 by Bangsund and Hodur. All rights reserved. Readers may make verbatimcopies of this document for non-commercial purposes by any means, provided this copyright noticeappears on all such copies.
TABLE OF CONTENTS
Page
List of Tables. . . . . . . . . . . . . . . . . . . . . . . . . . . . . . . . . . . . . . . . . . . . . . . . . . . . . . . . . . . . . . iii
List of Figures. . . . . . . . . . . . . . . . . . . . . . . . . . . . . . . . . . . . . . . . . . . . . . . . . . . . . . . . . . . . . iv
Executive Summary. . . . . . . . . . . . . . . . . . . . . . . . . . . . . . . . . . . . . . . . . . . . . . . . . . . . . . . . . v
Introduction. . . . . . . . . . . . . . . . . . . . . . . . . . . . . . . . . . . . . . . . . . . . . . . . . . . . . . . . . . . . . . . . 1
Objectives. . . . . . . . . . . . . . . . . . . . . . . . . . . . . . . . . . . . . . . . . . . . . . . . . . . . . . . . . . . . . . . . . 2
Background. . . . . . . . . . . . . . . . . . . . . . . . . . . . . . . . . . . . . . . . . . . . . . . . . . . . . . . . . . . . . . . . 2Industry Organization.. . . . . . . . . . . . . . . . . . . . . . . . . . . . . . . . . . . . . . . . . . . . . . . . . . 2Production Statistics. . . . . . . . . . . . . . . . . . . . . . . . . . . . . . . . . . . . . . . . . . . . . . . . . . . . 4
Procedures. . . . . . . . . . . . . . . . . . . . . . . . . . . . . . . . . . . . . . . . . . . . . . . . . . . . . . . . . . . . . . . . . 8Data Collection.. . . . . . . . . . . . . . . . . . . . . . . . . . . . . . . . . . . . . . . . . . . . . . . . . . . . . . . 8
Oil Operators.. . . . . . . . . . . . . . . . . . . . . . . . . . . . . . . . . . . . . . . . . . . . . . . . . . . 8Pipelines and Processors. . . . . . . . . . . . . . . . . . . . . . . . . . . . . . . . . . . . . . . . . . . 9Service and Support. . . . . . . . . . . . . . . . . . . . . . . . . . . . . . . . . . . . . . . . . . . . . . 9Leasing and Brokerage. . . . . . . . . . . . . . . . . . . . . . . . . . . . . . . . . . . . . . . . . . . 10
Estimation Techniques. . . . . . . . . . . . . . . . . . . . . . . . . . . . . . . . . . . . . . . . . . . . . . . . . 10Input-Output Analysis. . . . . . . . . . . . . . . . . . . . . . . . . . . . . . . . . . . . . . . . . . . . . . . . . 11
Economic Impacts. . . . . . . . . . . . . . . . . . . . . . . . . . . . . . . . . . . . . . . . . . . . . . . . . . . . . . . . . . 12Direct Impacts. . . . . . . . . . . . . . . . . . . . . . . . . . . . . . . . . . . . . . . . . . . . . . . . . . . . . . . 12
Exploration/Development. . . . . . . . . . . . . . . . . . . . . . . . . . . . . . . . . . . . . . . . . 12Extraction/Production. . . . . . . . . . . . . . . . . . . . . . . . . . . . . . . . . . . . . . . . . . . . 14Processing. . . . . . . . . . . . . . . . . . . . . . . . . . . . . . . . . . . . . . . . . . . . . . . . . . . . . 16Total Direct Impacts. . . . . . . . . . . . . . . . . . . . . . . . . . . . . . . . . . . . . . . . . . . . . 18
Secondary Impacts. . . . . . . . . . . . . . . . . . . . . . . . . . . . . . . . . . . . . . . . . . . . . . . . . . . . 20Employment. . . . . . . . . . . . . . . . . . . . . . . . . . . . . . . . . . . . . . . . . . . . . . . . . . . . . . . . . 22
Direct Employment. . . . . . . . . . . . . . . . . . . . . . . . . . . . . . . . . . . . . . . . . . . . . . 22Survey Data. . . . . . . . . . . . . . . . . . . . . . . . . . . . . . . . . . . . . . . . . . . . . . 23Job Service North Dakota. . . . . . . . . . . . . . . . . . . . . . . . . . . . . . . . . . . 26Workforce Safety and Insurance. . . . . . . . . . . . . . . . . . . . . . . . . . . . . . 27Oil and Gas Division Coefficients.. . . . . . . . . . . . . . . . . . . . . . . . . . . . 29
Secondary Employment. . . . . . . . . . . . . . . . . . . . . . . . . . . . . . . . . . . . . . . . . . 29Government Revenues. . . . . . . . . . . . . . . . . . . . . . . . . . . . . . . . . . . . . . . . . . . . . . . . . 31
i
TABLE OF CONTENTS (continued)
PageEconomic Impacts (continued)
Infrastructure Spending. . . . . . . . . . . . . . . . . . . . . . . . . . . . . . . . . . . . . . . . . . . . . . . . 34Total Economic Impacts.. . . . . . . . . . . . . . . . . . . . . . . . . . . . . . . . . . . . . . . . . . . . . . . 41
Comparison of Previous Industry Assessments. . . . . . . . . . . . . . . . . . . . . . . . . . . . . . . . . . . . 44
Summary. . . . . . . . . . . . . . . . . . . . . . . . . . . . . . . . . . . . . . . . . . . . . . . . . . . . . . . . . . . . . . . . . 54
Conclusions. . . . . . . . . . . . . . . . . . . . . . . . . . . . . . . . . . . . . . . . . . . . . . . . . . . . . . . . . . . . . . . 59
References. . . . . . . . . . . . . . . . . . . . . . . . . . . . . . . . . . . . . . . . . . . . . . . . . . . . . . . . . . . . . . . . 61
AppendicesAppendix A - Questionnaire, Oil Operators, North Dakota, 2011.. . . . . . . . . . . . 65Appendix B - Questionnaire, Processors, North Dakota, 2011. . . . . . . . . . . . . . . 77Appendix C - Questionnaire, Service and Support Firms, 2011. . . . . . . . . . . . . . 85Appendix D - Questionnaire, Lease/Brokerage Firms, North Dakota, 2011. . . . . 93
ii
LIST OF TABLES
Table Page
1 Basic Production Statistics from Survey of Oil Operators, North Dakota, 2011. . . . . . 9
2 Direct Impacts from General Exploration, Drilling Activities, and LeaseBonuses, North Dakota, 2011. . . . . . . . . . . . . . . . . . . . . . . . . . . . . . . . . . . . . . . . . . . . 14
3 Direct Impacts from Oil and Gas Extraction and Production Activities,North Dakota, 2011. . . . . . . . . . . . . . . . . . . . . . . . . . . . . . . . . . . . . . . . . . . . . . . . . . . 16
4 Direct Impacts from Oil and Gas Processing, North Dakota, 2011. . . . . . . . . . . . . . . 17
5 Total Direct Impacts, Petroleum Industry, North Dakota, 2011.. . . . . . . . . . . . . . . . . 19
6 Total Secondary Impacts, Petroleum Industry, North Dakota, 2011. . . . . . . . . . . . . . 21
7 Estimates of Direct Employment, North Dakota Petroleum Sector,2003 Through 2011.. . . . . . . . . . . . . . . . . . . . . . . . . . . . . . . . . . . . . . . . . . . . . . . . . . . 24
8 State and Local Government Revenues Attributable to the Petroleum Industry,North Dakota, 2011. . . . . . . . . . . . . . . . . . . . . . . . . . . . . . . . . . . . . . . . . . . . . . . . . . . 33
9 Infrastructure Investment Spending, Petroleum Industry, North Dakota, 2011. . . . . . 36
10 Total (Direct and Secondary) Economic Impacts, Infrastructure Spending,Petroleum Industry, North Dakota, 2011. . . . . . . . . . . . . . . . . . . . . . . . . . . . . . . . . . . 40
11 Total (Direct and Secondary) Economic Impacts, Petroleum Industry, North Dakota, 2011. . . . . . . . . . . . . . . . . . . . . . . . . . . . . . . . . . . . . . . . . . . . . . . . . . . 43
12 Oil and Gas Production Statistics, North Dakota, 2005, 2007, 2009, and 2011.. . . . . 45
13 Summary of Oil Operator Surveys, North Dakota, 2005, 2007, 2009, and 2011.. . . . 46
14 Comparison of Economic Estimates, Exploration Component of PetroleumIndustry, North Dakota, 2005, 2007, 2009, and 2011. . . . . . . . . . . . . . . . . . . . . . . . . 47
15 Comparison of Economic Estimates, Oil and Gas Extraction/ProductionComponent of Petroleum Industry, North Dakota, 2005, 2007, 2009, and 2011. . . . . 49
iii
LIST OF TABLES (continued)
Table Page
16 Comparison of Economic Estimates, Processing Componentof Petroleum Industry, North Dakota, 2005, 2007, 2009, and 2011.. . . . . . . . . . . . . . 50
17 Estimates State and Local Government Revenues Generated by PetroleumIndustry, North Dakota, 2005, 2007, 2009, and 2011. . . . . . . . . . . . . . . . . . . . . . . . . 51
18 Direct and Secondary Employment, Petroleum Industry, North Dakota,2005, 2007, 2009, and 2011. . . . . . . . . . . . . . . . . . . . . . . . . . . . . . . . . . . . . . . . . . . . . 52
19 Key Economic Values, Petroleum Industry, North Dakota, 2005, 2007, 2009, and 2011. . . . . . . . . . . . . . . . . . . . . . . . . . . . . . . . . . . . . . . . . . . . . 53
LIST OF FIGURES
Figure Page
1 Oil Producing Counties, North Dakota.. . . . . . . . . . . . . . . . . . . . . . . . . . . . . . . . . . . . . 4
2 Historic Oil Production, Key Counties, North Dakota, 1952 through 2011.. . . . . . . . . 5
3 Top States in Cumulative Crude Oil Production, United States, 1981 through 2011. . 5
4 Crude Oil Production, North Dakota, 1951 through 2011. . . . . . . . . . . . . . . . . . . . . . . 6
5 Production and Value of Crude Oil, North Dakota, 1970 through 2011. . . . . . . . . . . . 7
6 Value of Crude Oil Production in Nominal and Real Dollars, North Dakota,1970 through 2011. . . . . . . . . . . . . . . . . . . . . . . . . . . . . . . . . . . . . . . . . . . . . . . . . . . . . 7
7 Economic Effects of Key Segments of the North DakotaPetroleum Industry, 2011. . . . . . . . . . . . . . . . . . . . . . . . . . . . . . . . . . . . . . . . . . . . . . . 57
iv
EXECUTIVE SUMMARY
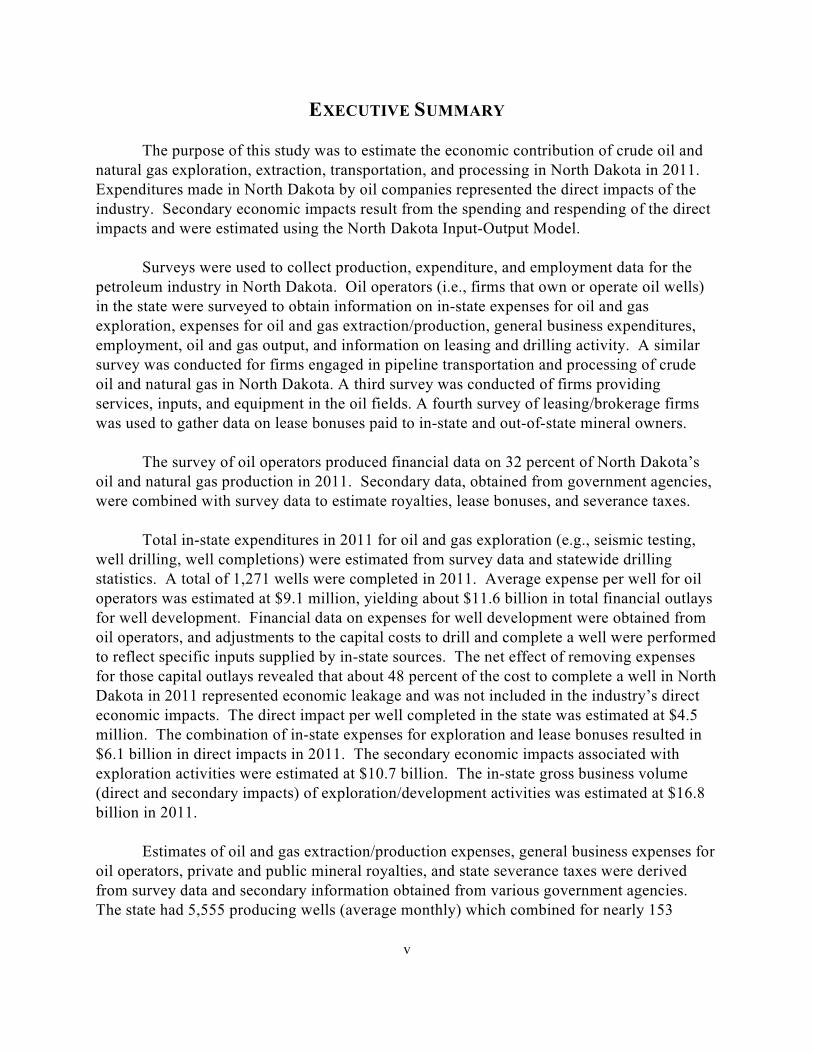
The purpose of this study was to estimate the economic contribution of crude oil andnatural gas exploration, extraction, transportation, and processing in North Dakota in 2011. Expenditures made in North Dakota by oil companies represented the direct impacts of theindustry. Secondary economic impacts result from the spending and respending of the directimpacts and were estimated using the North Dakota Input-Output Model.
Surveys were used to collect production, expenditure, and employment data for thepetroleum industry in North Dakota. Oil operators (i.e., firms that own or operate oil wells)in the state were surveyed to obtain information on in-state expenses for oil and gasexploration, expenses for oil and gas extraction/production, general business expenditures,employment, oil and gas output, and information on leasing and drilling activity. A similarsurvey was conducted for firms engaged in pipeline transportation and processing of crudeoil and natural gas in North Dakota. A third survey was conducted of firms providingservices, inputs, and equipment in the oil fields. A fourth survey of leasing/brokerage firmswas used to gather data on lease bonuses paid to in-state and out-of-state mineral owners.
The survey of oil operators produced financial data on 32 percent of North Dakota’soil and natural gas production in 2011. Secondary data, obtained from government agencies,were combined with survey data to estimate royalties, lease bonuses, and severance taxes.
Total in-state expenditures in 2011 for oil and gas exploration (e.g., seismic testing,well drilling, well completions) were estimated from survey data and statewide drillingstatistics. A total of 1,271 wells were completed in 2011. Average expense per well for oiloperators was estimated at $9.1 million, yielding about $11.6 billion in total financial outlaysfor well development. Financial data on expenses for well development were obtained fromoil operators, and adjustments to the capital costs to drill and complete a well were performedto reflect specific inputs supplied by in-state sources. The net effect of removing expensesfor those capital outlays revealed that about 48 percent of the cost to complete a well in NorthDakota in 2011 represented economic leakage and was not included in the industry’s directeconomic impacts. The direct impact per well completed in the state was estimated at $4.5million. The combination of in-state expenses for exploration and lease bonuses resulted in$6.1 billion in direct impacts in 2011. The secondary economic impacts associated withexploration activities were estimated at $10.7 billion. The in-state gross business volume(direct and secondary impacts) of exploration/development activities was estimated at $16.8billion in 2011.
Estimates of oil and gas extraction/production expenses, general business expenses foroil operators, private and public mineral royalties, and state severance taxes were derivedfrom survey data and secondary information obtained from various government agencies. The state had 5,555 producing wells (average monthly) which combined for nearly 153
v
million barrels of oil and 179 million mcf of natural gas in 2011. Those volumes of oil andgas production resulted in an estimated $932 million for in-state expenditures forextraction/production, $648 million for general business expenses, $1.3 billion in stateseverance taxes, and a combined $1.1 billion of in-state private and public oil and gasroyalties. Total direct impacts for oil and gas production were estimated at $4 billion in2011. Total secondary economic impacts associated with production activities wereestimated at $4.7 billion. The in-state gross business volume of oil and gasextraction/production was estimated at $8.6 billion in 2011.
In-state expenditures for transportation of crude oil, pipeline operation, crude oil railloading facilities, natural gas processing, and crude oil refining were estimated to have adirect impact in North Dakota of $475 million in 2011. Total secondary economic impactsassociated with processing and transporting crude oil and natural gas were estimated at $900million. Processing and transporting crude oil and natural gas generated a gross businessvolume of $1.4 billion in 2011.
The petroleum industry was estimated to have capital expenditures between $2.5billion to $2.7 billion for infrastructure projects in the state in 2011. After adjustments foreconomic leakage (the portion of expenditures not captured in the North Dakota economy), itwas estimated that about $1.1 billion to $1.2 billion were captured in the North Dakotaeconomy. The gross business volume associated with infrastructure spending in NorthDakota was estimated to range from $3.4 to $3.7 billion in 2011. Infrastructure spending, asdefined in this report, would represent additional economic activity beyond that created bythe exploration, production, and processing segments of the industry.
Industry-wide direct and secondary economic impacts from the petroleum industrywere estimated at $11.7 billion and $18.7 billion, respectively. The gross business volumefor the entire industry, including infrastructure spending, in North Dakota in 2011 wasestimated at $30.4 billion.
Additional measures of the petroleum industry’s economic importance to the stateinclude direct employment for 40,800 full-time jobs, economy-wide personal income of$11.6 billion, statewide retail sales of $7.4 billion, direct contributions to local and stategovernment tax revenues of $2.25 billion, indirect contribution of $395 million in stategovernment general tax collections, and secondary employment of 18,700 full-timeequivalent jobs.
Comparing various production statistics between previous studies revealed that thenumber of producing wells, oil and gas production, and drilling activities all increased in thestate. Oil and natural gas prices among the four studies were highest in 2011. From 2005 to2011, expenditures for exploration (i.e., general exploration, well drilling, well completions,and lease bonuses) in the state increased 1,126 percent in real terms (i.e., correcting for
vi
inflation). By comparison, expenditures for oil and natural gas production over the sameperiod paralleled changes in oil and gas output and were estimated to increase by 289 percentin real terms. Processing and transportation activities also showed substantial growth overthe period due to increased processing and transportation volumes and expansion ofprocessing and pipeline capacities. Economic activity associated with the processingsegment of the industry increased in real terms by 219 percent from 2005 to 2011. Overall,the gross business volume (i.e., direct and secondary economic effects) of the industry wasestimated to increase 6-fold (511 percent) in real terms from $4.4 billion in 2005 to $26.9billion in 2011 (excluding infrastructure spending). Infrastructure spending was not includedin earlier assessments; however, when capital expenditures for infrastructure projects areadded to the other segments of the industry, the gross business volume for the petroleumsector in 2011 was estimated at $30.4 billion.
vii
PETROLEUM INDUSTRY’S ECONOMIC CONTRIBUTION
TO NORTH DAKOTA IN 2011
DEAN A. BANGSUND NANCY M. HODUR*
INTRODUCTION
North Dakota’s largest basic sector industries, which include agriculture,manufacturing, and energy, provide much of the economic stimuli for the state’s economy. These large industries are generally comprised of distinct sectors or economic groups. Forexample, agriculture in North Dakota often is considered a combination of crop productionand livestock. The energy industry in North Dakota also is comprised of several distinctsectors that are commonly treated as separate activities. North Dakota’s energy industriescan be conveniently separated into the activities that produce and distribute electricity, coal,petroleum, and renewable fuels.
While separating the energy industry into similar activities is relatively straightforward, identifying the economic players within those sectors is less clear. In the case ofelectricity generation, a handful of firms and generating facilities exist within the state. Thesame situation exists with coal production – a handful of companies operate at a limitednumber of locations. However, the industrial organization associated with oil and natural gasproduction is different. Rather than having a handful of firms and a limited number of site-specific facilities and locations, the petroleum industry involves hundreds of firms and amultitude of facilities spread throughout the western third of North Dakota.
North Dakota has been a top-10 oil-producing state for over a decade. To thosefamiliar with North Dakota’s economy, the petroleum sector has always been an importantpart of the state’s economic base. Recent upswings in oil production became prevalent in the2000s. In 2006, during the beginning of the latest expansion of oil field development, thefirst comprehensive economic assessment of the petroleum industry in the state wasconducted (Bangsund and Leistritz 2007). Another assessment was conducted two yearslater (Bangsund and Leistritz 2009). Since that time, North Dakota has witnessed anunprecedented increase in oil production. As of 2012, North Dakota ranked second in oilproduction behind only Texas (U.S. Department of Energy 2012).
The expansion of oil development associated with shale formations that started in themid 2000s has continued to garner local, state, and national headlines. No longer is the rapiddevelopment of the oil patch in North Dakota a phenomenon only visible to those working inthe industry or living in western North Dakota. The economic value of the rapidly expanding
Research scientist and research assistant professor, respectively, Department of Agribusiness and*
Applied Economics, North Dakota State University, Fargo.
petroleum industry is difficult to follow as the industry has grown and expanded beyondhistorical precedents. However as the state continues to adjust to an ever-expandingpetroleum sector, policymakers, legislators, and business leaders would benefit from anunderstanding of the economic effects of the industry.
Determining the economic contribution of a given industry quantifies its importance tostate and local economies. Not only can the economic impacts to the state and localeconomies be measured, but the effects on specific economic sectors and related industriesalso can be identified. In addition, economic studies can demonstrate the susceptibility of theNorth Dakota economy to fluctuations in factors affecting petroleum exploration andproduction, demonstrate the economic dependence of the state on natural resource-basedindustries, and indicate the economic impacts that could result from potential changes inpolicies which affect the petroleum industry.
OBJECTIVES
The purpose of this report is to estimate the economic contribution (direct andsecondary effects) of the petroleum industry to the economy of North Dakota. Specificobjectives include
1) estimate the economic size of petroleum exploration, extraction, and processingsectors,
2) estimate in-state spending on petroleum industry infrastructure, and
3) provide estimates of industry-wide employment, tax revenues, and other keyeconomic measures.
BACKGROUND
The industrial organization of the petroleum industry in the United States often isdivided into upstream and downstream components. The upstream components of thepetroleum industry generally include exploration, development, and production of crude oiland natural gas. The downstream components include transportation, processing,distribution, marketing, and retail delivery of petroleum products.
Industry Organization
The petroleum industry in North Dakota consists of both upstream and downstreamcomponents. For this study, the petroleum industry was defined to only include in-stateexploration, extraction/production, transportation, and processing of crude oil and naturalgas. Exploration can be generally thought of as the process of finding mineral resources. Extraction or production is the process of developing and recovering mineral resources. Transportation components of the industry, in this study, were limited to the movement of oiland gas from wells to collection points, and then on to processing facilities located either in-
Department of Agribusiness & Applied Economics 2
state or out-of-state. Petroleum processing in North Dakota included refining of crude oiland natural gas processing. The distribution, marketing, and retail sale of processedpetroleum products (e.g., diesel, gasoline, kerosene, motor oil, lubricants, propane, naturalgas) were not included.
The exploration and extraction phases of the petroleum industry are not organized likeother industries in the state. Firms that own producing wells (oil operators) contract much ofthe work of exploration and extraction of oil and gas to other firms that specialize in variousaspects of those processes. As a result, much of the expenditures incurred in the state for oiland gas production start with the oil operator but flow through the various firms engaged inproviding support and service within the oil fields. While oil operators represent a mix ofsmall to large firms, a majority of the prominent oil operators in North Dakota also haveoperations in other states. For many oil operators, their operations in North Dakota do notrepresent the majority of their oil and gas revenues. As a result of having operations and/orheadquarters in other states, net revenues from North Dakota oil and gas production mayleave the state for a variety of reasons. However, North Dakota is still the beneficiary ofexploration and discovery expenses from firms that may have minimal operations in the state.
Oil and gas wells typically have three types of economic interests. These players areoften referred to as royalty interests, owner/operator interests, and working interests. Royaltyinterests receive a share of the value of a well’s output but do not share in the expensesassociated with the well. Owner and working interests share, based on various percentagesor arrangements, the remaining revenues and all of the expenses of a well. The well owner oroperator is generally responsible or in charge of all operations. The owner arranges to havework completed for most of the necessary activities associated with the well, and chargesworking interests for their share of the expenses. As a result of these typical arrangements,the total number of firms receiving revenues and incurring expenses from oil and gas wells inNorth Dakota is unknown. However, the number of oil operators (firms that own or operatewells) is known.
For various reasons, the magnitude of economic effects of oil and gas production arenot necessarily equivalent to the market value (i.e., price times quantity) of oil and gasproduced. Exploration and extraction technologies use specialized inputs and services, manyof which are not available in North Dakota and must be purchased from out-of-state sources. Many oil operators have operations and/or are headquartered in other states, and revenues forsome firms may leave the state to be used for projects elsewhere. The same situation mayexist where firms use resources obtained from out-of-state operations for oil and gasexploration in the state. In addition, oil operators headquartered out-of-state often haveminimal general business expenses in the state. Similarly, firms that only have workinginterests in producing wells may or may not have physical operations in the state. All of these factors make it problematic to base economic importance of the petroleum industrysolely on the value of oil and gas production.
3
Production Statistics
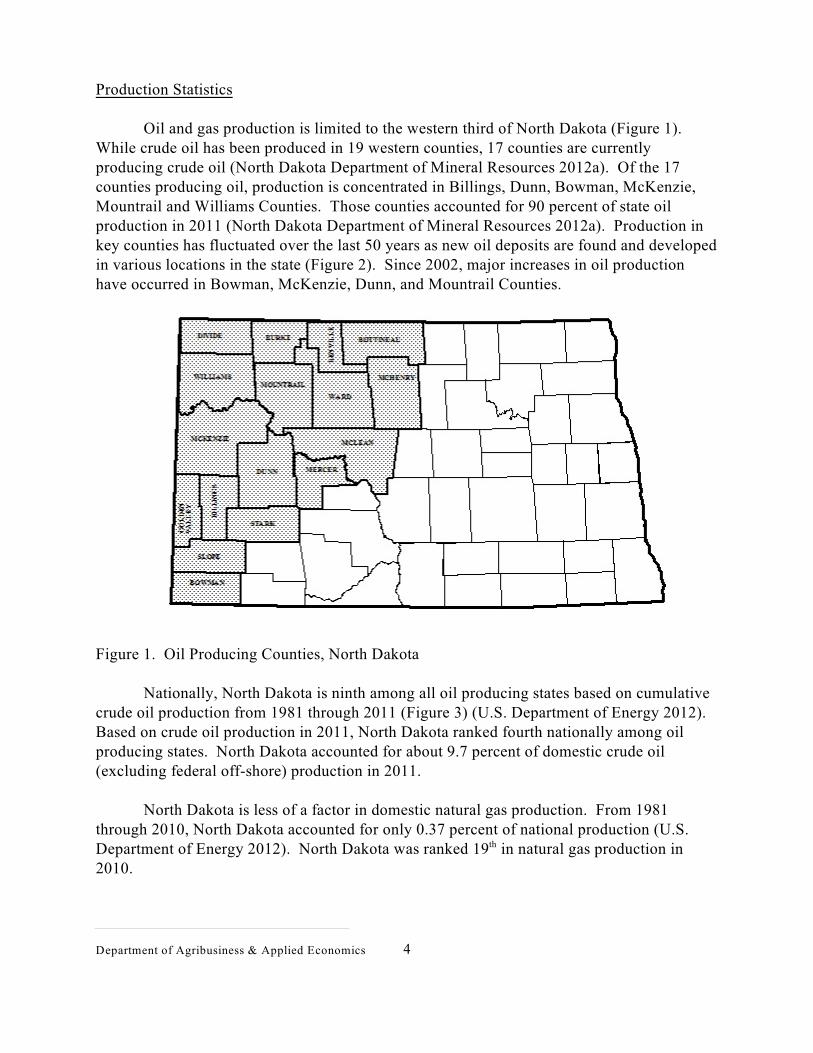
Oil and gas production is limited to the western third of North Dakota (Figure 1). While crude oil has been produced in 19 western counties, 17 counties are currentlyproducing crude oil (North Dakota Department of Mineral Resources 2012a). Of the 17counties producing oil, production is concentrated in Billings, Dunn, Bowman, McKenzie,Mountrail and Williams Counties. Those counties accounted for 90 percent of state oilproduction in 2011 (North Dakota Department of Mineral Resources 2012a). Production inkey counties has fluctuated over the last 50 years as new oil deposits are found and developedin various locations in the state (Figure 2). Since 2002, major increases in oil productionhave occurred in Bowman, McKenzie, Dunn, and Mountrail Counties.
Figure 1. Oil Producing Counties, North Dakota
Nationally, North Dakota is ninth among all oil producing states based on cumulativecrude oil production from 1981 through 2011 (Figure 3) (U.S. Department of Energy 2012). Based on crude oil production in 2011, North Dakota ranked fourth nationally among oilproducing states. North Dakota accounted for about 9.7 percent of domestic crude oil(excluding federal off-shore) production in 2011.
North Dakota is less of a factor in domestic natural gas production. From 1981through 2010, North Dakota accounted for only 0.37 percent of national production (U.S.Department of Energy 2012). North Dakota was ranked 19 in natural gas production inth
2010.
Department of Agribusiness & Applied Economics 4
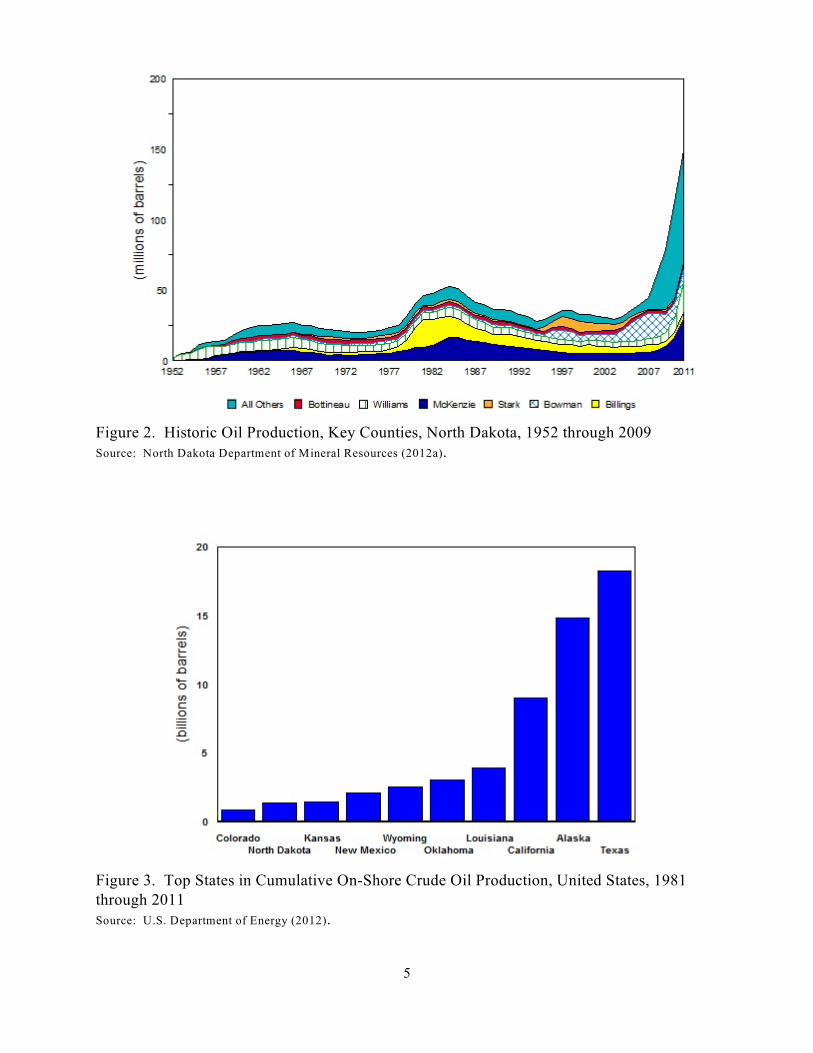
Figure 2. Historic Oil Production, Key Counties, North Dakota, 1952 through 2009Source: North Dakota Department of Mineral Resources (2012a).
Figure 3. Top States in Cumulative On-Shore Crude Oil Production, United States, 1981through 2011Source: U.S. Department of Energy (2012).
5
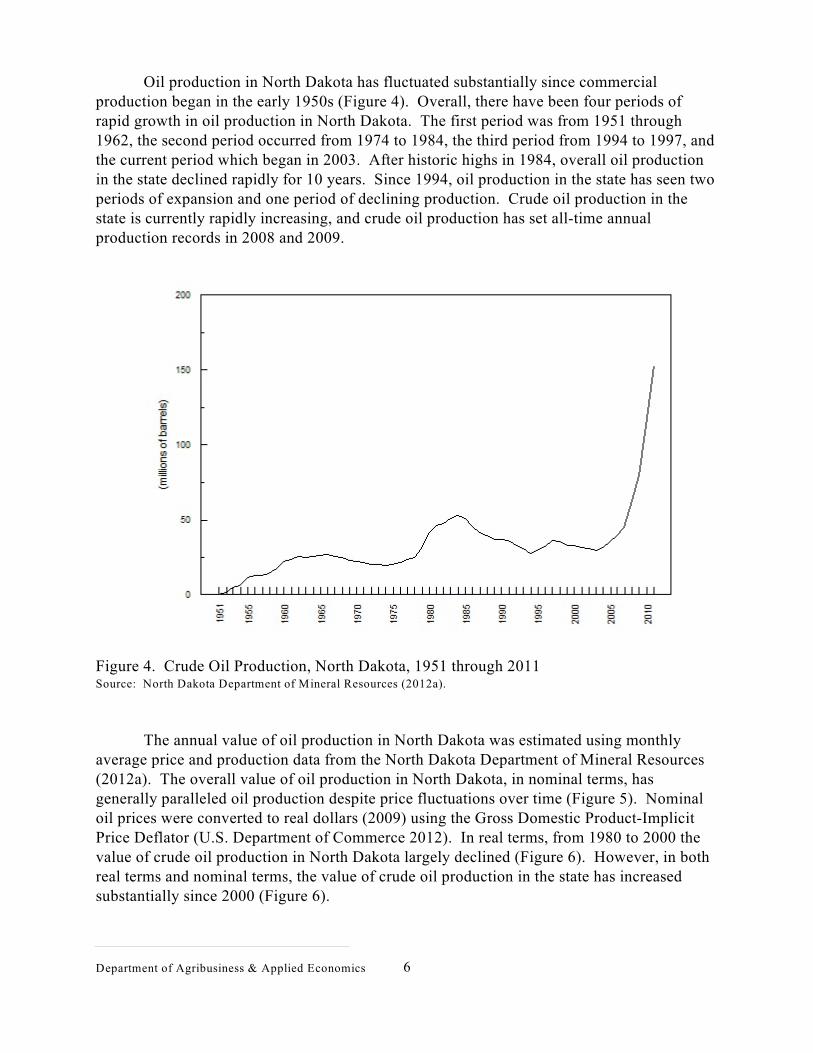
Oil production in North Dakota has fluctuated substantially since commercialproduction began in the early 1950s (Figure 4). Overall, there have been four periods ofrapid growth in oil production in North Dakota. The first period was from 1951 through1962, the second period occurred from 1974 to 1984, the third period from 1994 to 1997, andthe current period which began in 2003. After historic highs in 1984, overall oil productionin the state declined rapidly for 10 years. Since 1994, oil production in the state has seen twoperiods of expansion and one period of declining production. Crude oil production in thestate is currently rapidly increasing, and crude oil production has set all-time annualproduction records in 2008 and 2009.
Figure 4. Crude Oil Production, North Dakota, 1951 through 2011Source: North Dakota Department of Mineral Resources (2012a).
The annual value of oil production in North Dakota was estimated using monthlyaverage price and production data from the North Dakota Department of Mineral Resources(2012a). The overall value of oil production in North Dakota, in nominal terms, hasgenerally paralleled oil production despite price fluctuations over time (Figure 5). Nominaloil prices were converted to real dollars (2009) using the Gross Domestic Product-ImplicitPrice Deflator (U.S. Department of Commerce 2012). In real terms, from 1980 to 2000 thevalue of crude oil production in North Dakota largely declined (Figure 6). However, in bothreal terms and nominal terms, the value of crude oil production in the state has increasedsubstantially since 2000 (Figure 6).
Department of Agribusiness & Applied Economics 6

Figure 5. Production and Market Value of Crude Oil, North Dakota, 1970 through 2011Source: North Dakota Department of Mineral Resources (2012a).
Figure 6. Value of Crude Oil Production in Nominal and Real Dollars, North Dakota, 1970through 2011
7
PROCEDURES
An economic contribution analysis, as defined in this study, represents an estimate ofall relevant in-state expenditures and returns associated with an industry. The economiccontribution approach to estimating economic activity has been used for several otherindustries in North Dakota (Bangsund and Leistritz 1995a, 1995b, 1998, 1999, 2004, 2005,2010; Coon et al. 2012a, 2012b).
Data Collection
Due to the complexities of how the oil and gas industry is structured, and that in-stateeffects (i.e., first round spending or direct impacts) from oil and gas production in any givenyear may not equal the market value of oil and gas production, an expenditure-basedapproach to measuring the economic size of the petroleum industry was used in this study. Inthis approach, a sample of firms active in the petroleum industry in North Dakota were askedto provide estimates of the amount of expenditures made to entities (i.e., individuals, firms,and governments) in North Dakota. Four separate survey efforts were conducted for thestudy and provided the basis for most of the economic data needed to complete the study.
Oil Operators
Firms that own or operate oil wells in the state were surveyed to obtain information onexpenses for oil and gas exploration and extraction/production, general business expenses inthe state, employment, physical measures of oil and gas production, and leasing and drillingactivity (Appendix A). The North Dakota Petroleum Council provided names and addressesfor 60 oil operators in the state. The survey process started with sending cover letters and aquestionnaire to each firm on the mailing list. A second mailing was conducted for all firmsthat had not responded to the first mailing. After two mailings, dissemination of survey1
materials and solicitation of industry cooperation was deferred to the study sponsor.
The combination of two mailings and personal contacts of oil operators conducted bythe study sponsor resulted in useable information from 10 firms. The firms’ production fromowned/operated wells represented 32 percent of the state’s 2011 production of crude oil andnatural gas (Table 1). An additional follow-up data request was initiated for companiesparticipating in the study to obtain detailed financial data on well completion costs todelineate in-state versus out-of-state supplies for those inputs.
Firms with non-deliverable addresses, those who responded with completed questionnaires, and those who1
indicated they would not or could not participate were excluded in the second mailing.
Department of Agribusiness & Applied Economics 8
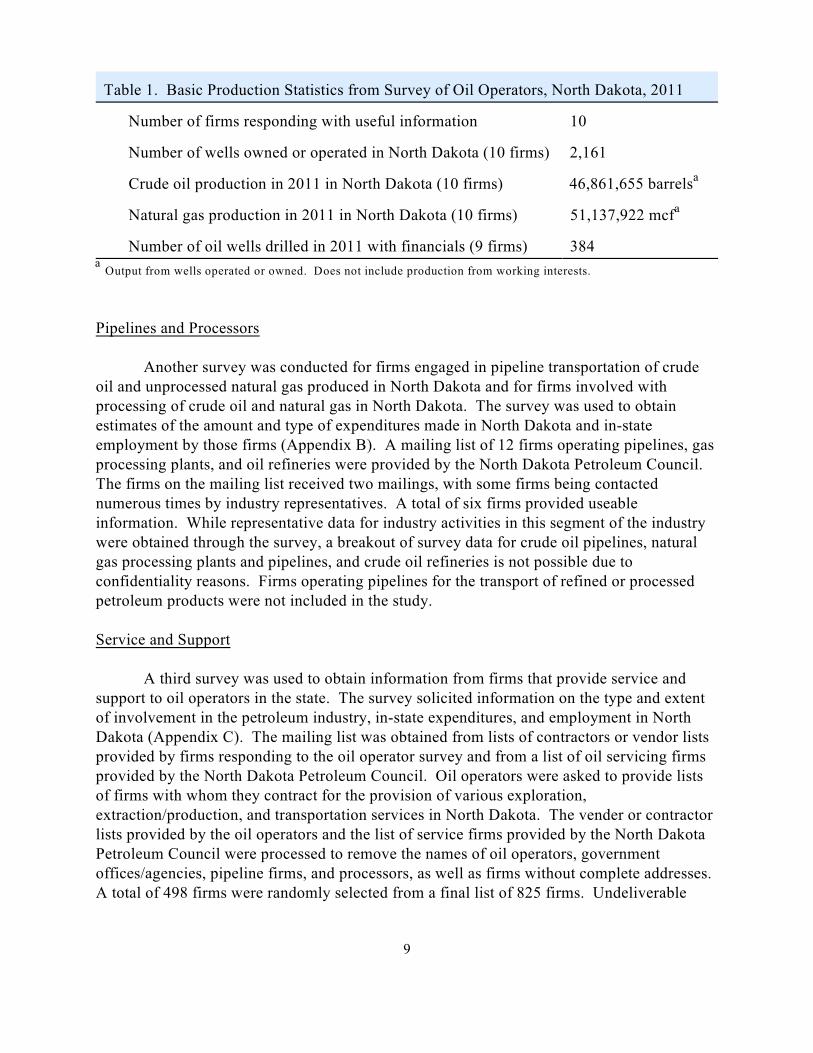
Table 1. Basic Production Statistics from Survey of Oil Operators, North Dakota, 2011
Number of firms responding with useful information 10
Number of wells owned or operated in North Dakota (10 firms) 2,161
Crude oil production in 2011 in North Dakota (10 firms) 46,861,655 barrelsa
Natural gas production in 2011 in North Dakota (10 firms) 51,137,922 mcfa
Number of oil wells drilled in 2011 with financials (9 firms) 384
Output from wells operated or owned. Does not include production from working interests.a
Pipelines and Processors
Another survey was conducted for firms engaged in pipeline transportation of crudeoil and unprocessed natural gas produced in North Dakota and for firms involved withprocessing of crude oil and natural gas in North Dakota. The survey was used to obtainestimates of the amount and type of expenditures made in North Dakota and in-stateemployment by those firms (Appendix B). A mailing list of 12 firms operating pipelines, gasprocessing plants, and oil refineries were provided by the North Dakota Petroleum Council. The firms on the mailing list received two mailings, with some firms being contactednumerous times by industry representatives. A total of six firms provided useableinformation. While representative data for industry activities in this segment of the industrywere obtained through the survey, a breakout of survey data for crude oil pipelines, naturalgas processing plants and pipelines, and crude oil refineries is not possible due toconfidentiality reasons. Firms operating pipelines for the transport of refined or processedpetroleum products were not included in the study.
Service and Support
A third survey was used to obtain information from firms that provide service andsupport to oil operators in the state. The survey solicited information on the type and extentof involvement in the petroleum industry, in-state expenditures, and employment in NorthDakota (Appendix C). The mailing list was obtained from lists of contractors or vendor listsprovided by firms responding to the oil operator survey and from a list of oil servicing firmsprovided by the North Dakota Petroleum Council. Oil operators were asked to provide listsof firms with whom they contract for the provision of various exploration,extraction/production, and transportation services in North Dakota. The vender or contractorlists provided by the oil operators and the list of service firms provided by the North DakotaPetroleum Council were processed to remove the names of oil operators, governmentoffices/agencies, pipeline firms, and processors, as well as firms without complete addresses. A total of 498 firms were randomly selected from a final list of 825 firms. Undeliverable
9
addresses were present on 15 of the 498 firms. An initial mailing and a follow-up postcardmailing resulted in 54 firms responding, with 49 firms providing useable information.
Leasing and Brokerage
A survey of companies providing leasing services to petroleum sector firms wasconducted to obtain information on oil leasing activities in North Dakota. A questionnairewas developed to obtain information necessary to estimate the amount of lease bonuses onprivate land in North Dakota (Appendix D). The study sponsor distributed the questionnaireto eight firms. The survey resulted in obtaining useable financial information from fourfirms. Lease bonuses for government mineral ownership were obtained by contacting theappropriate federal and state agencies. An additional information request was placed by theNorth Dakota Petroleum Council to oil operators participating in the study to obtain data ontotal in-state and out-of-state oil and gas royalty payments from North Dakota wells. Dataobtained from the operators represented 43 percent of oil and gas output in the state, andrevealed an average, weighted by dollar volumes, in-state royalty payment percentage of43.74 percent. The in-state payment percentage for private royalties was used with the datafrom the survey of lease/brokerage firms to estimate in-state lease bonus payments.
Estimation Techniques
The survey of oil operators, survey of processors/pipeline operators, and survey of oilfirms providing services and contract work in the oil fields provided data for two criticalaspects of the study. First, data from the oil operator and processor surveys were used to setthe level of spending in North Dakota. In other words, the data were used to determine thenumber of dollars spent in the state. Second, data from all three surveys (i.e., operators,processors, service firms) were used to determine the distribution of spending among varioussectors of the North Dakota economy.
The survey of oil operators provided financial data on about 32 percent of all oil andgas production in the state in 2011. In addition, survey respondents provided information onexploration expenses, wells drilled, and leasing data. Benchmark expenses forextraction/production, transportation, and operational expenses (e.g., general administrativecosts) were estimated per barrel of oil equivalent (BOE). Total state production in 2011,expressed in BOE, was then used with survey estimates of in-state expenditures per BOE togenerate state-level estimates for production, transportation, and administrative spending. In-state employment by oil operators was estimated in a similar manner. Benchmark expensesfor exploration were estimated on a per-well completed basis and were used with data on thenumber of wells completed in North Dakota in 2011. Data from the survey of oillease/brokerage firms were used with data from the North Dakota State Land Department toestimate lease bonus payments for private mineral leases. Other economic components of thepetroleum industry’s direct impacts, such as severance taxes, public lease bonuses, and
Department of Agribusiness & Applied Economics 10
royalty revenues represented a combination of survey data, state-level statistics, andinformation obtained from various state and federal governmental agencies.
The survey of service and support firms for oil and gas production in North Dakotaprovided estimates of in-state spending by various types of expenses (e.g., salaries/wages,utilities, office supplies, business services) (Appendix C). The percentage of spending invarious categories by firms responding to the survey was used to allocate state-levelexpenditures for exploration and extraction to various economic sectors of the North DakotaInput-Output Model. The amount of spending was determined using data from the survey ofoil operators, while the survey of service and support firms provided insights on how thosedollars impacted various sectors of the North Dakota economy.
Input-Output Analysis
Economic activity from a project, program, policy, or activity can be categorized intodirect and secondary impacts. Direct impacts are those changes in output, employment, orincome that represent the initial or first-round effects of the project, program, policy, oractivity. Secondary impacts (sometimes further categorized into indirect and induced effects)result from subsequent rounds of spending and respending within the economy. This processof spending and respending is sometimes termed the multiplier process, and the resultantsecondary effects are sometimes referred to as multiplier effects (Leistritz and Murdock1981).
Input-output (I-O) analysis is an economic tool that traces linkages among sectors ofan economy and calculates the total business activity resulting from a direct impact in a basicsector (Coon et al. 1985). The North Dakota I-O Model has 17 economic sectors, is closedwith respect to households (households are included in the model), and was developed fromprimary (survey) data from firms and households in North Dakota.
Empirical testing has shown the North Dakota Input-Output Model is sufficientlyaccurate in estimating gross business volume, personal income, retail activity, and grossreceipts in major economic sectors in North Dakota. Over the period 1958-2011, estimates ofstatewide personal income derived from the model averaged within 10 percent of comparablevalues reported by the U.S. Department of Commerce (Coon et al. 2013, Bureau of EconomicAnalysis 2013). Coon et al. (2013) measured the statistical differences between the estimatesof personal income from the two sources and found the absolute average difference was 7.0
1percent, mean difference was -4.63 percent, and Theil’s U coefficient was 0.0400 for the1958 to 2011 period.
11
ECONOMIC IMPACTS
The economic contribution of the petroleum industry was primarily based onestimates of in-state expenditures from exploration, extraction, transportation, and processingof crude oil and natural gas. Estimates of in-state expenditures were combined withestimates of oil and gas royalties, state severance taxes, and lease bonuses to determine totaldirect impacts. Subsequently, the direct impacts were applied to the North Dakota Input-Output Model to estimate the secondary impacts. Secondary impacts result from therespending of direct impacts within the economy. The following section is divided into sixmajor parts: (1) direct impacts, (2) secondary impacts, (3) employment, (4) tax revenue, (5)infrastructure spending, and (6) total economic impacts.
Direct Impacts
From an economic perspective, direct impacts are those changes in economic output,employment, or income that represent the initial or first-round effects of a project, program,or activity. The direct impacts from the petroleum industry in North Dakota includedexpenditures for (1) oil and gas exploration, (2) oil and gas extraction/production, (3)transportation of crude oil and unprocessed gas, and (4) processing crude oil and natural gas. Direct impacts also included various revenue streams originating from either oil and gasexploration, such as lease bonuses, or oil and gas production, such as severance taxes androyalty payments. The following sections describe these direct economic impacts.
Exploration/Development
The economic effects of exploration come from expenditures within North Dakota fora variety of activities that involve searching and discovering viable oil and gas resources. Exploration was defined to include, but not limited to, seismic testing, geological research,lease expenses, other environmental research, land survey work, excavation, road building,construction of drill site, construction and delivery of electricity, pipeline development, andall other activities associated with drilling and completing oil and/or gas wells (Appendix A).
Estimates of total in-state expenditures in 2011 for exploration were derived from thesurvey of oil operators and used with drilling statistics from the North Dakota Department ofMineral Resources (2012a). Gross expenditures for exploration, drilling, and wellcompletion were estimated at about $9.1 million per well drilled in North Dakota in 2011. The petroleum industry completed 1,271 wells in North Dakota in 2011, yielding about $11.6billion in total financial outlays for well development. Financial data on expenses for welldevelopment were obtained from oil operators. Considering the rapid expansion of welldrilling, and the volume of economic activity, adjustments to the capital costs to drill andcomplete a well were performed to reflect specific inputs only supplied by in-state sources. Examples of well development expenses that were determined to be primarily supplied by
Department of Agribusiness & Applied Economics 12
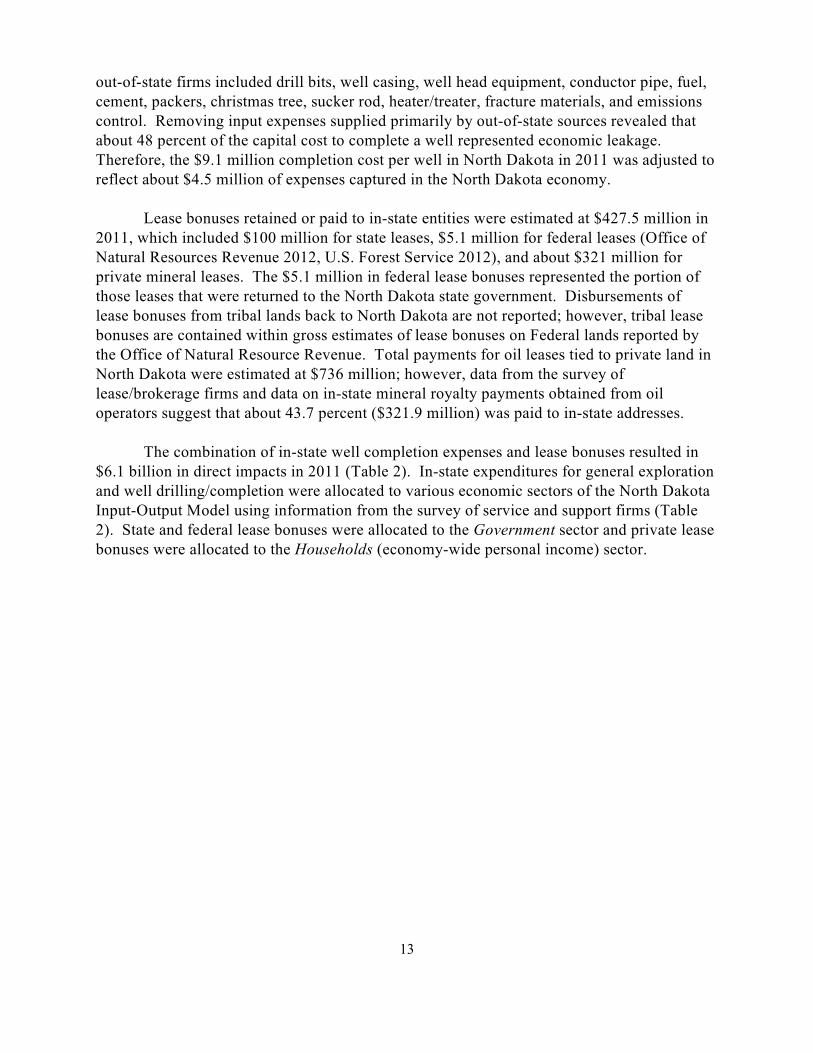
out-of-state firms included drill bits, well casing, well head equipment, conductor pipe, fuel,cement, packers, christmas tree, sucker rod, heater/treater, fracture materials, and emissionscontrol. Removing input expenses supplied primarily by out-of-state sources revealed thatabout 48 percent of the capital cost to complete a well represented economic leakage. Therefore, the $9.1 million completion cost per well in North Dakota in 2011 was adjusted toreflect about $4.5 million of expenses captured in the North Dakota economy.
Lease bonuses retained or paid to in-state entities were estimated at $427.5 million in2011, which included $100 million for state leases, $5.1 million for federal leases (Office ofNatural Resources Revenue 2012, U.S. Forest Service 2012), and about $321 million forprivate mineral leases. The $5.1 million in federal lease bonuses represented the portion ofthose leases that were returned to the North Dakota state government. Disbursements oflease bonuses from tribal lands back to North Dakota are not reported; however, tribal leasebonuses are contained within gross estimates of lease bonuses on Federal lands reported bythe Office of Natural Resource Revenue. Total payments for oil leases tied to private land inNorth Dakota were estimated at $736 million; however, data from the survey oflease/brokerage firms and data on in-state mineral royalty payments obtained from oiloperators suggest that about 43.7 percent ($321.9 million) was paid to in-state addresses.
The combination of in-state well completion expenses and lease bonuses resulted in$6.1 billion in direct impacts in 2011 (Table 2). In-state expenditures for general explorationand well drilling/completion were allocated to various economic sectors of the North DakotaInput-Output Model using information from the survey of service and support firms (Table2). State and federal lease bonuses were allocated to the Government sector and private leasebonuses were allocated to the Households (economy-wide personal income) sector.
13
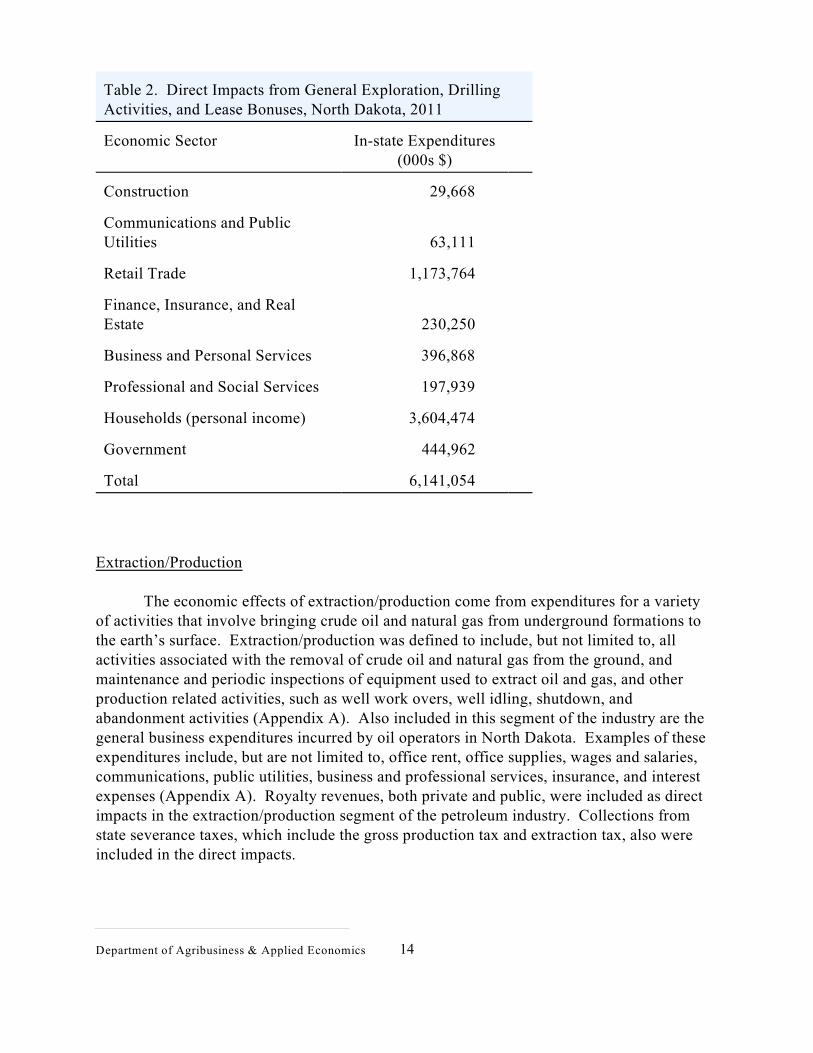
Table 2. Direct Impacts from General Exploration, DrillingActivities, and Lease Bonuses, North Dakota, 2011
Economic Sector In-state Expenditures(000s $)
Construction 29,668
Communications and PublicUtilities 63,111
Retail Trade 1,173,764
Finance, Insurance, and RealEstate 230,250
Business and Personal Services 396,868
Professional and Social Services 197,939
Households (personal income) 3,604,474
Government 444,962
Total 6,141,054
Extraction/Production
The economic effects of extraction/production come from expenditures for a varietyof activities that involve bringing crude oil and natural gas from underground formations tothe earth’s surface. Extraction/production was defined to include, but not limited to, allactivities associated with the removal of crude oil and natural gas from the ground, andmaintenance and periodic inspections of equipment used to extract oil and gas, and otherproduction related activities, such as well work overs, well idling, shutdown, andabandonment activities (Appendix A). Also included in this segment of the industry are thegeneral business expenditures incurred by oil operators in North Dakota. Examples of theseexpenditures include, but are not limited to, office rent, office supplies, wages and salaries,communications, public utilities, business and professional services, insurance, and interestexpenses (Appendix A). Royalty revenues, both private and public, were included as directimpacts in the extraction/production segment of the petroleum industry. Collections fromstate severance taxes, which include the gross production tax and extraction tax, also wereincluded in the direct impacts.
Department of Agribusiness & Applied Economics 14
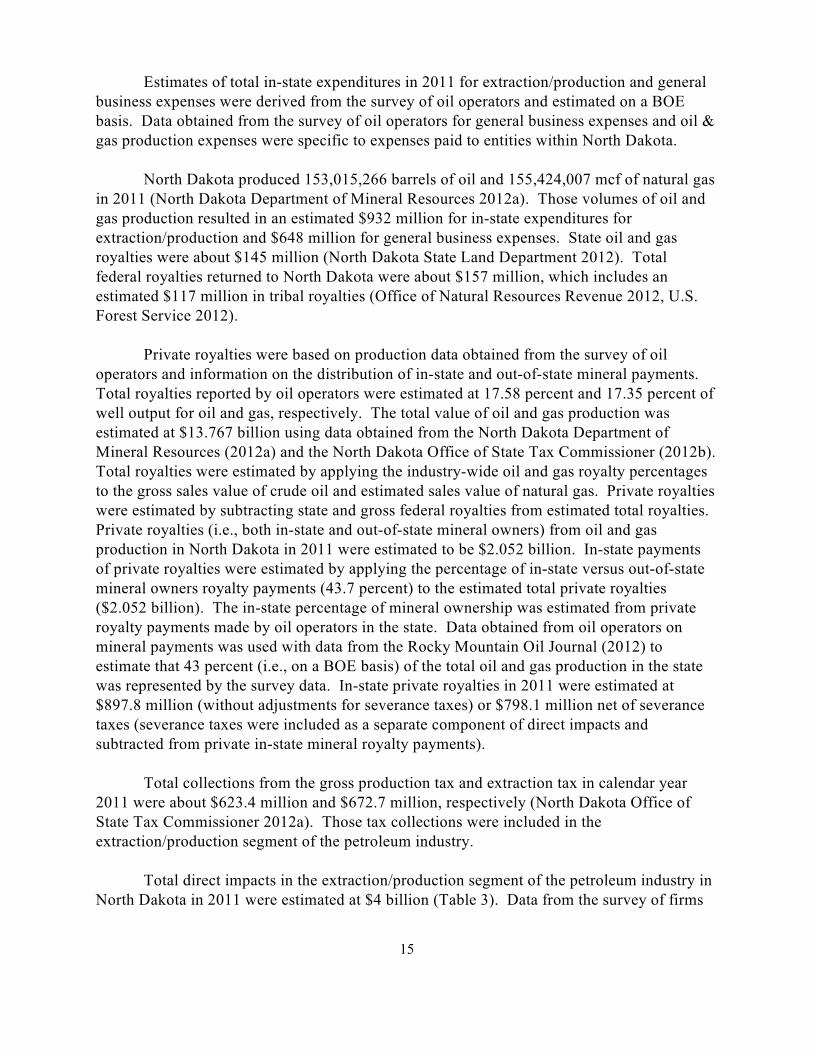
Estimates of total in-state expenditures in 2011 for extraction/production and generalbusiness expenses were derived from the survey of oil operators and estimated on a BOEbasis. Data obtained from the survey of oil operators for general business expenses and oil &gas production expenses were specific to expenses paid to entities within North Dakota.
North Dakota produced 153,015,266 barrels of oil and 155,424,007 mcf of natural gasin 2011 (North Dakota Department of Mineral Resources 2012a). Those volumes of oil andgas production resulted in an estimated $932 million for in-state expenditures forextraction/production and $648 million for general business expenses. State oil and gasroyalties were about $145 million (North Dakota State Land Department 2012). Totalfederal royalties returned to North Dakota were about $157 million, which includes anestimated $117 million in tribal royalties (Office of Natural Resources Revenue 2012, U.S.Forest Service 2012).
Private royalties were based on production data obtained from the survey of oiloperators and information on the distribution of in-state and out-of-state mineral payments. Total royalties reported by oil operators were estimated at 17.58 percent and 17.35 percent ofwell output for oil and gas, respectively. The total value of oil and gas production wasestimated at $13.767 billion using data obtained from the North Dakota Department ofMineral Resources (2012a) and the North Dakota Office of State Tax Commissioner (2012b). Total royalties were estimated by applying the industry-wide oil and gas royalty percentagesto the gross sales value of crude oil and estimated sales value of natural gas. Private royaltieswere estimated by subtracting state and gross federal royalties from estimated total royalties. Private royalties (i.e., both in-state and out-of-state mineral owners) from oil and gasproduction in North Dakota in 2011 were estimated to be $2.052 billion. In-state paymentsof private royalties were estimated by applying the percentage of in-state versus out-of-statemineral owners royalty payments (43.7 percent) to the estimated total private royalties($2.052 billion). The in-state percentage of mineral ownership was estimated from privateroyalty payments made by oil operators in the state. Data obtained from oil operators onmineral payments was used with data from the Rocky Mountain Oil Journal (2012) toestimate that 43 percent (i.e., on a BOE basis) of the total oil and gas production in the statewas represented by the survey data. In-state private royalties in 2011 were estimated at$897.8 million (without adjustments for severance taxes) or $798.1 million net of severancetaxes (severance taxes were included as a separate component of direct impacts andsubtracted from private in-state mineral royalty payments).
Total collections from the gross production tax and extraction tax in calendar year2011 were about $623.4 million and $672.7 million, respectively (North Dakota Office ofState Tax Commissioner 2012a). Those tax collections were included in theextraction/production segment of the petroleum industry.
Total direct impacts in the extraction/production segment of the petroleum industry inNorth Dakota in 2011 were estimated at $4 billion (Table 3). Data from the survey of firms
15
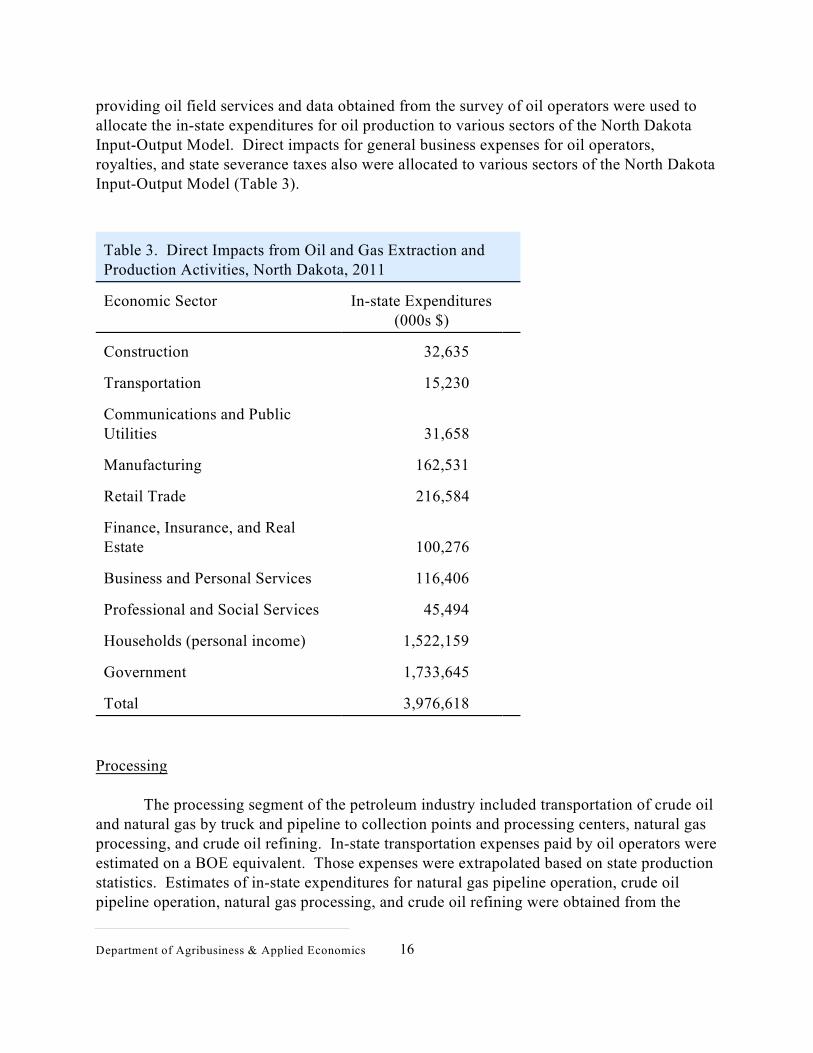
providing oil field services and data obtained from the survey of oil operators were used toallocate the in-state expenditures for oil production to various sectors of the North DakotaInput-Output Model. Direct impacts for general business expenses for oil operators,royalties, and state severance taxes also were allocated to various sectors of the North DakotaInput-Output Model (Table 3).
Table 3. Direct Impacts from Oil and Gas Extraction andProduction Activities, North Dakota, 2011
Economic Sector In-state Expenditures(000s $)
Construction 32,635
Transportation 15,230
Communications and PublicUtilities 31,658
Manufacturing 162,531
Retail Trade 216,584
Finance, Insurance, and RealEstate 100,276
Business and Personal Services 116,406
Professional and Social Services 45,494
Households (personal income) 1,522,159
Government 1,733,645
Total 3,976,618
Processing
The processing segment of the petroleum industry included transportation of crude oiland natural gas by truck and pipeline to collection points and processing centers, natural gasprocessing, and crude oil refining. In-state transportation expenses paid by oil operators wereestimated on a BOE equivalent. Those expenses were extrapolated based on state productionstatistics. Estimates of in-state expenditures for natural gas pipeline operation, crude oilpipeline operation, natural gas processing, and crude oil refining were obtained from the
Department of Agribusiness & Applied Economics 16

survey of processors. Results from the survey of processors were combined with statestatistics to estimate state-level expenditures.
Direct impacts included $206.7 million in transportation expenses paid to in-stateentities by oil operators. Processing activities, which included pipeline transportation ofunprocessed natural gas and crude oil, natural gas processing, and crude oil refining wereestimated to have in-state expenditures of $268.3 million. One-time spending forinfrastructure by processors was included in processing expenditures in previous industryassessments; however, infrastructure spending was estimated separately in this study. Processors were directed to omit any infrastructure spending in their operational expenditures(Appendix C). Total direct impacts of $475 million were allocated to the North DakotaInput-Output Model (Table 4). To avoid double counting of potential impacts, in-statepurchases of crude oil and unprocessed natural gas by processors were excluded in the study.
Table 4. Direct Impacts from Oil and Gas Processing, NorthDakota, 2011
Economic Sector In-state Expenditures(000s $)
Construction 55,942
Transportation 212,330
Communications and PublicUtilities 52,729
Manufacturing 13,352
Retail Trade 8,357
Finance, Insurance, and RealEstate 11,951
Business and Personal Services 37,231
Professional and Social Services 2,053
Households (personal income) 61,680
Government 19,382
Total 475,007
17
Total Direct Impacts
Direct impacts are defined as the initial or first-round effects of a project, program, oractivity. The petroleum industry in North Dakota was divided into several segments orcomponents for purposes of reporting study results. Total direct impacts for the petroleumindustry included in-state expenditures for oil and gas exploration/development, oil and gasextraction/production, transportation of crude oil and unprocessed gas, processing crude oiland natural gas, lease bonuses, severance taxes, and royalty payments.
Total direct impacts from the petroleum industry in North Dakota in 2011 wereestimated at $10.6 billion (Table 5). Exploration (i.e., primarily well drilling and wellcompletion) accounted for 58 percent of the industry’s direct impacts and was the largestsegment of the industry. Extraction/production accounted for nearly 38 percent of all directimpacts. Processing and transportation accounted for the remaining 4 percent of theindustry’s direct impacts.
Expenditures and revenues which constitute the petroleum industry’s direct impactswere allocated to various economic sectors of the North Dakota Input-Output Model. Thesectors of the North Dakota economy that received the greatest direct impacts werehouseholds (economy-wide personal income) ($5.2 billion), government (tax collections andpublic royalties) ($2.2 billion), retail trade ($1.4 billion), business and personal services($550 million), and finance, insurance, and real estate ($342 million) (Table 5).
Department of Agribusiness & Applied Economics 18
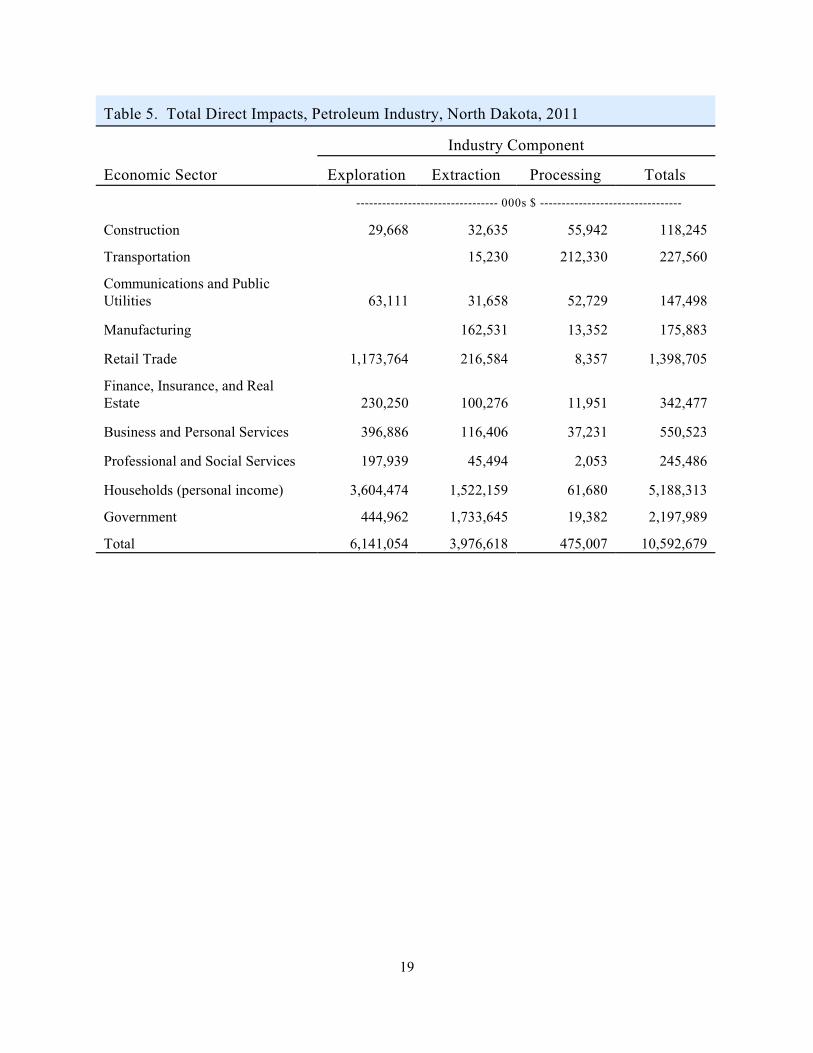
Table 5. Total Direct Impacts, Petroleum Industry, North Dakota, 2011
Industry Component
Economic Sector Exploration Extraction Processing Totals
--------------------------------- 000s $ ---------------------------------
Construction 29,668 32,635 55,942 118,245
Transportation 15,230 212,330 227,560
Communications and PublicUtilities 63,111 31,658 52,729 147,498
Manufacturing 162,531 13,352 175,883
Retail Trade 1,173,764 216,584 8,357 1,398,705
Finance, Insurance, and RealEstate 230,250 100,276 11,951 342,477
Business and Personal Services 396,886 116,406 37,231 550,523
Professional and Social Services 197,939 45,494 2,053 245,486
Households (personal income) 3,604,474 1,522,159 61,680 5,188,313
Government 444,962 1,733,645 19,382 2,197,989
Total 6,141,054 3,976,618 475,007 10,592,679
19
Secondary Impacts
Secondary economic impacts result from subsequent rounds of spending andrespending within an economy. Input-output (I-O) analysis traces linkages (i.e., the amountof spending and respending) among sectors of an economy and calculates the total businessactivity resulting from a direct impact in a basic sector (Coon et al. 1985). An economic sector is a group of similar economic units (e.g., communications and public utilities, retailtrade, construction).
This process of spending and respending can be explained by using an example. Asingle dollar from an in-state wheat producer (Households sector) may be spent for a loaf ofbread at the local store (Retail Trade sector); the store uses part of that dollar to pay for thenext shipment of bread (Transportation and Agricultural Processing sectors) and part to paythe store employee (Households sector) who shelved or sold the bread; the bread supplieruses part of that dollar to pay for the grain used to make the bread (Agriculture-Crops sector)... and so on (Hamm et al. 1993).
Secondary economic impacts were estimated separately for exploration, production,and processing components of the petroleum industry. Results from the North Dakota Input-Output Model revealed that secondary economic impacts from exploration in North Dakotain 2011 would be about $10.7 billion (Table 6). The $4 billion in direct impacts for oil andgas extraction (production) activities produced an estimated $4.7 billion in secondaryeconomic impacts. Finally, the transportation and processing segment of the petroleumindustry was responsible for about $895 million in secondary economic impacts. Totalsecondary economic impacts from all components of the petroleum industry were estimatedat $16.3 billion. Across all three major components of the petroleum industry, considerablesecondary impacts were generated in the retail trade ($5.2 billion), households (economy-wide personal income) ($5 billion), finance, insurance, and real estate ($1.2 billion), andcommunications and public utilities ($800 million) sectors (Table 6).
Department of Agribusiness & Applied Economics 20
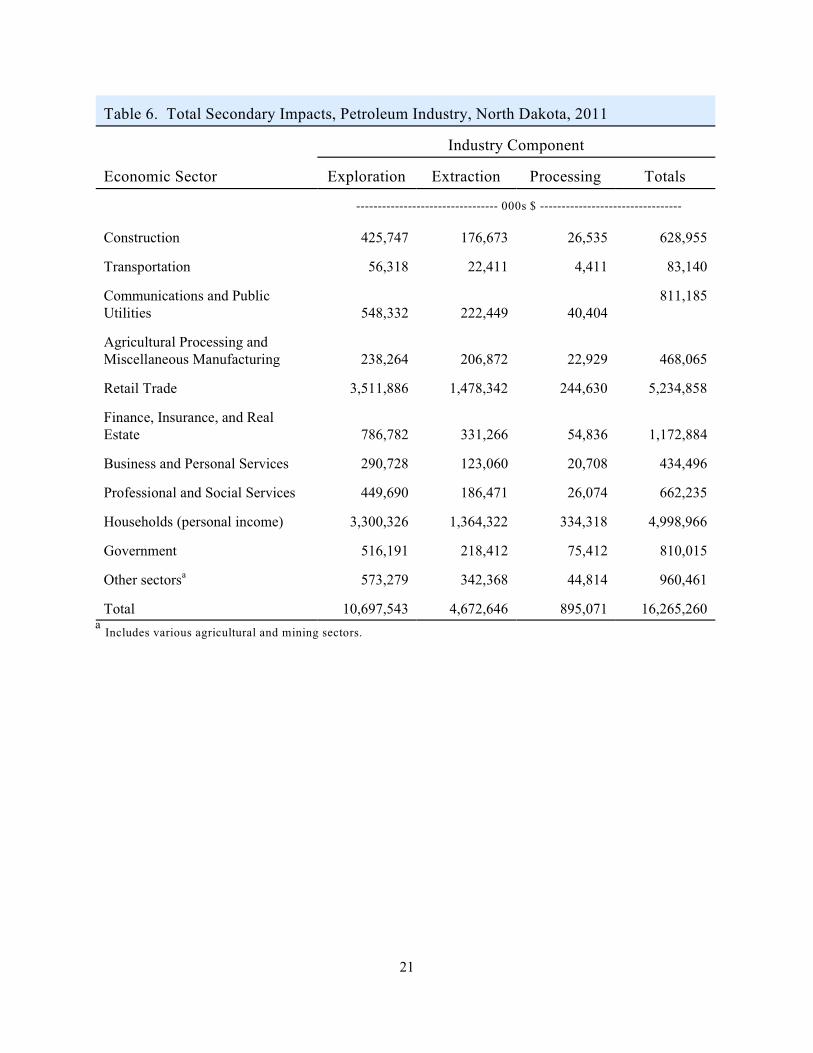
Table 6. Total Secondary Impacts, Petroleum Industry, North Dakota, 2011
Industry Component
Economic Sector Exploration Extraction Processing Totals
--------------------------------- 000s $ ---------------------------------
Construction 425,747 176,673 26,535 628,955
Transportation 56,318 22,411 4,411 83,140
Communications and PublicUtilities 548,332 222,449 40,404
811,185
Agricultural Processing andMiscellaneous Manufacturing 238,264 206,872 22,929 468,065
Retail Trade 3,511,886 1,478,342 244,630 5,234,858
Finance, Insurance, and RealEstate 786,782 331,266 54,836 1,172,884
Business and Personal Services 290,728 123,060 20,708 434,496
Professional and Social Services 449,690 186,471 26,074 662,235
Households (personal income) 3,300,326 1,364,322 334,318 4,998,966
Government 516,191 218,412 75,412 810,015
Other sectors 573,279 342,368 44,814 960,461a
Total 10,697,543 4,672,646 895,071 16,265,260
Includes various agricultural and mining sectors.a
21
Employment
The petroleum industry is responsible for creating and supporting direct andsecondary employment. Direct employment is a measure of the number of full-time jobswithin an industry. Secondary jobs are an estimate of employment outside of an industry, butemployment that is created from the industry's economy-wide economic activity.
Direct Employment
Direct employment is a term used to describe jobs that are considered to be a part ofan industry. For example, workers operating an oil drilling rig would represent directemployment in the petroleum industry. Similarly, someone who works at a natural gasprocessing plant or crude oil refinery would be considered direct employment in thepetroleum industry.
While employment figures are frequently reported by various governmental agenciesand are broken into a hierarchy of categories (e.g., North American Industry ClassificationSystem), deriving specific estimates of employment for large basic-sector industries can beproblematic. Much of the problem arises in defining the type of job, and attributing to whichindustry(s) created that employment. For example, the process of drilling an oil welltypically requires developing a road and a drilling site; work that requires heavy constructionwith earth moving or excavating equipment. Most oil companies will contract that work tolocal firms that specialize in heavy construction or excavating. The individuals performingthe road building and preparation of the drill site are likely to be employed with some type ofconstruction firm, and as a result, those jobs are typically classified and reported bygovernment agencies as construction.
Government agencies (e.g., Bureau of the Census, Bureau of Labor Statistics) thattrack employment often base the classification of those jobs on the type of activities thatgenerate the most revenue for a firm (primary activities). In this example, the primaryactivity for this firm is likely to be construction, even if the revenues for the construction firmare derived from road building and drill site preparation for an oil firm. However, in the caseof assigning which basic-sector industry created that employment, it may be more accurate tosuggest those jobs exist as a result of the petroleum industry rather than the constructionindustry. Yet, in other cases, the level of oil well drilling activity may be insufficient tosustain employment in heavy construction for an entire year. Those situations result inseasonal or part-time job creation. The challenge is to measure or estimate the total numberof full-time jobs created and sustained by the petroleum industry, even if those jobs appear tobe part of another industry or are only created for part of a year.
Four independent estimates of employment are presented is this report (Table 7). Anestimate of employment in the industry was generated from the survey data collected from oiloperators, service and support firms, and processors. Another estimate was provided by JobService North Dakota and represented employment based on North American Industry
Department of Agribusiness & Applied Economics 22
Classification System (NAICS) listings. Another estimate was generated from data obtainedfrom North Dakota Workforce Safety and Insurance. A final estimate was provided by usinga model developed by Bangsund and Hodur (2012) that uses employment coefficients fromthe Oil and Gas Division of the North Dakota Department of Mineral Resources.
Survey Data
Estimates of direct employment were generated from the survey of oil operators andprocessors, and from key parameters obtained from the survey of service and support firms. The survey of oil operators and processors specifically asked for the number of full-time jobsin North Dakota (Appendices A and B). Employment figures from the survey of oiloperators were extrapolated to state totals based on a BOE basis, while employment datafrom the survey of processors was extrapolated based on state-level statistics for thoseoperations (e.g., processing volumes). Thus, estimating full-time employment by oiloperators, pipeline firms, and processors in North Dakota was relatively straightforward.
Oil operators (firms owning or operating wells) contract much of the work ofexploration and production of oil and gas to firms that specialize in various aspects of thethose processes. While some of the work in the oil fields is performed by firms located inother states, much of the work is performed by firms located in close proximity to production. One of the difficulties of estimating employment in the service and support capacities isdetermining those jobs that are fully supported versus those jobs that are only partiallysupported by the petroleum industry. An additional complexity is to only attribute full-timeemployment to the petroleum activities located in North Dakota. For many firms located inthe oil producing region of North Dakota, the obvious possibility is that some employment bythose firms could be partially or wholly supported by petroleum activities in Montana,Canada, or possibly in other states.
The questionnaire used in the service and support survey was designed to address thedegree of job support from the petroleum industry and the level of job support attributable toonly petroleum activities in North Dakota (Appendix C). Total state employment for work inthe oil field was then estimated based dividing estimates of total spending by oil operators bythe gross revenue per full-time equivalent (FTE) jobs from the survey data.
Employment in North Dakota by oil operators in 2011 was estimated at 2,269 FTEpositions. Employment in the processing segment of the industry, which included somepipeline employment, was estimated at 850 FTE jobs. Total employment in the oil field forcontract work, which includes exploration and production segments of the industry, wasestimated at 37,737 FTE jobs. The petroleum industry , as defined and evaluated in this2
study, was estimated to create and support 40,856 FTE positions in North Dakota in 2011(Table 7).
The petroleum industry in this study did not include employment associated with transportation of2
processed petroleum products, marketing, or retail sales. In many cases, those downstream componentsof the industry generate substantial employment.
23
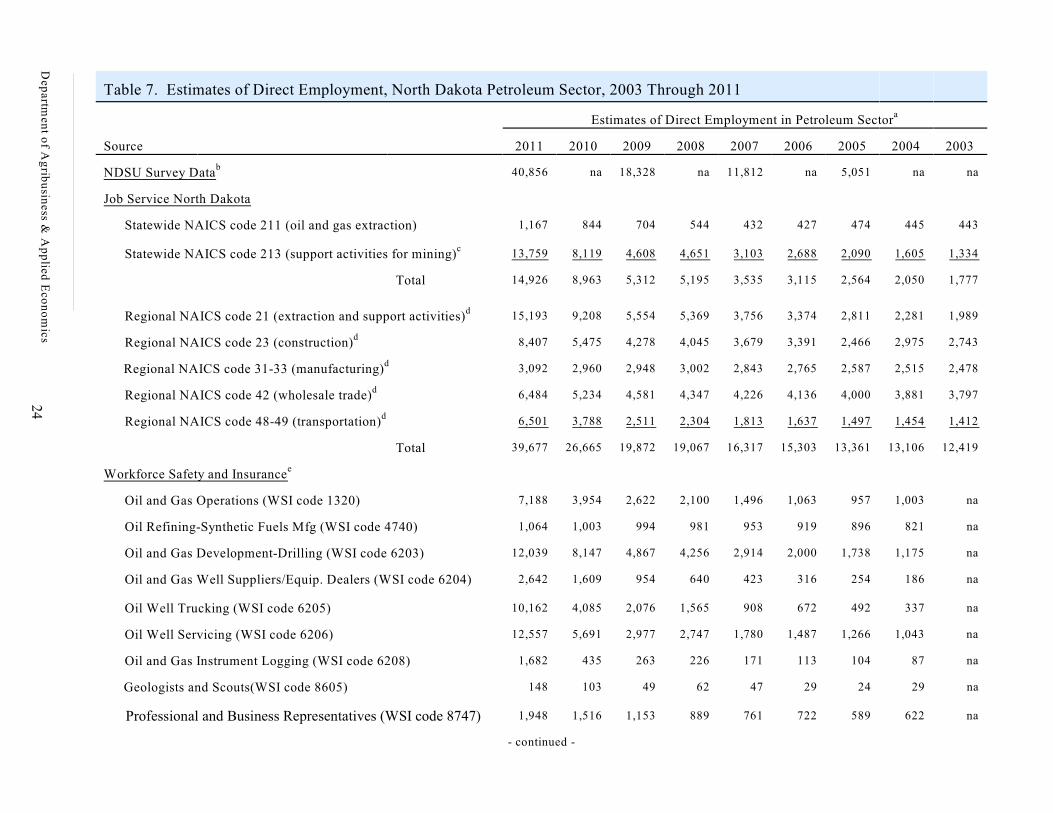
Table 7. Estimates of Direct Employment, North Dakota Petroleum Sector, 2003 Through 2011
Estimates of Direct Employment in Petroleum Sectora
Source 2011 2010 2009 2008 2007 2006 2005 2004 2003
NDSU Survey Datab
40,856 na 18,328 na 11,812 na 5,051 na na
Job Service North Dakota
Statewide NAICS code 211 (oil and gas extraction) 1,167 844 704 544 432 427 474 445 443
Statewide NAICS code 213 (support activities for mining)c
13,759 8,119 4,608 4,651 3,103 2,688 2,090 1,605 1,334
Total 14,926 8,963 5,312 5,195 3,535 3,115 2,564 2,050 1,777
Regional NAICS code 21 (extraction and support activities)d
15,193 9,208 5,554 5,369 3,756 3,374 2,811 2,281 1,989
Regional NAICS code 23 (construction)d
8,407 5,475 4,278 4,045 3,679 3,391 2,466 2,975 2,743
Regional NAICS code 31-33 (manufacturing) d
3,092 2,960 2,948 3,002 2,843 2,765 2,587 2,515 2,478
Regional NAICS code 42 (wholesale trade)d
6,484 5,234 4,581 4,347 4,226 4,136 4,000 3,881 3,797
Regional NAICS code 48-49 (transportation)d
6,501 3,788 2,511 2,304 1,813 1,637 1,497 1,454 1,412
Total 39,677 26,665 19,872 19,067 16,317 15,303 13,361 13,106 12,419
Workforce Safety and Insurancee
Oil and Gas Operations (WSI code 1320) 7,188 3,954 2,622 2,100 1,496 1,063 957 1,003 na
Oil Refining-Synthetic Fuels Mfg (WSI code 4740) 1,064 1,003 994 981 953 919 896 821 na
Oil and Gas Development-Drilling (WSI code 6203) 12,039 8,147 4,867 4,256 2,914 2,000 1,738 1,175 na
Oil and Gas Well Suppliers/Equip. Dealers (WSI code 6204) 2,642 1,609 954 640 423 316 254 186 na
Oil Well Trucking (WSI code 6205) 10,162 4,085 2,076 1,565 908 672 492 337 na
Oil Well Servicing (WSI code 6206) 12,557 5,691 2,977 2,747 1,780 1,487 1,266 1,043 na
Oil and Gas Instrument Logging (WSI code 6208) 1,682 435 263 226 171 113 104 87 na
Geologists and Scouts(WSI code 8605) 148 103 49 62 47 29 24 29 na
Professional and Business Representatives (WSI code 8747) 1,948 1,516 1,153 889 761 722 589 622 na
- continued -
Dep
artmen
t of A
grib
usin
ess & A
pp
lied E
con
om
ics24
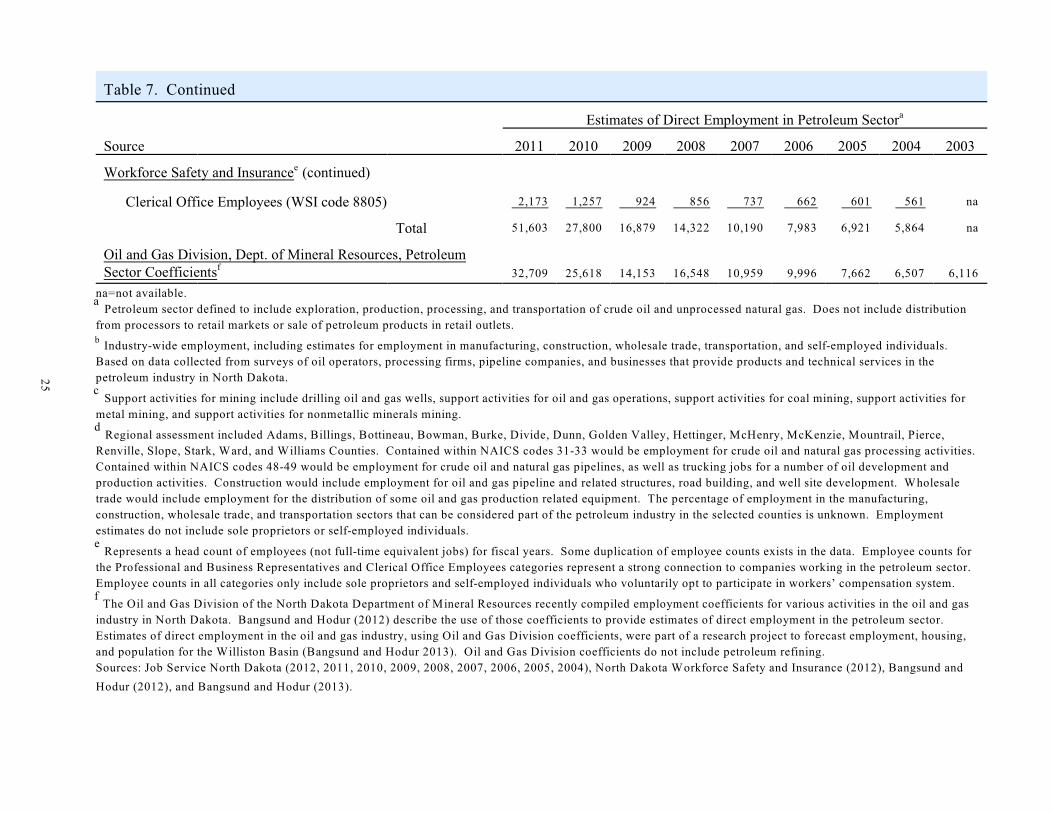
Table 7. Continued
Estimates of Direct Employment in Petroleum Sectora
Source 2011 2010 2009 2008 2007 2006 2005 2004 2003
Workforce Safety and Insurance (continued)e
Clerical Office Employees (WSI code 8805) 2,173 1,257 924 856 737 662 601 561 na
Total 51,603 27,800 16,879 14,322 10,190 7,983 6,921 5,864 na
Oil and Gas Division, Dept. of Mineral Resources, PetroleumSector Coefficientsf
32,709 25,618 14,153 16,548 10,959 9,996 7,662 6,507 6,116
na=not available.
Petroleum sector defined to include exploration, production, processing, and transportation of crude oil and unprocessed natural gas. Does not include distributiona
from processors to retail markets or sale of petroleum products in retail outlets.
Industry-wide employment, including estimates for employment in manufacturing, construction, wholesale trade, transportation, and self-employed individuals. b
Based on data collected from surveys of oil operators, processing firms, pipeline companies, and businesses that provide products and technical services in the
petroleum industry in North Dakota.
Support activities for mining include drilling oil and gas wells, support activities for oil and gas operations, support activities for coal mining, support activities forc
metal mining, and support activities for nonmetallic minerals mining.
Regional assessment included Adams, Billings, Bottineau, Bowman, Burke, Divide, Dunn, Golden Valley, Hettinger, McHenry, McKenzie, Mountrail, Pierce, d
Renville, Slope, Stark, Ward, and Williams Counties. Contained within NAICS codes 31-33 would be employment for crude oil and natural gas processing activities.
Contained within NAICS codes 48-49 would be employment for crude oil and natural gas pipelines, as well as trucking jobs for a number of oil development and
production activities. Construction would include employment for oil and gas pipeline and related structures, road building, and well site development. Wholesale
trade would include employment for the distribution of some oil and gas production related equipment. The percentage of employment in the manufacturing,
construction, wholesale trade, and transportation sectors that can be considered part of the petroleum industry in the selected counties is unknown. Employment
estimates do not include sole proprietors or self-employed individuals.
Represents a head count of employees (not full-time equivalent jobs) for fiscal years. Some duplication of employee counts exists in the data. Employee counts fore
the Professional and Business Representatives and Clerical Office Employees categories represent a strong connection to companies working in the petroleum sector.
Employee counts in all categories only include sole proprietors and self-employed individuals who voluntarily opt to participate in workers’ compensation system.
The Oil and Gas Division of the North Dakota Department of Mineral Resources recently compiled employment coefficients for various activities in the oil and gasf
industry in North Dakota. Bangsund and Hodur (2012) describe the use of those coefficients to provide estimates of direct employment in the petroleum sector.
Estimates of direct employment in the oil and gas industry, using Oil and Gas Division coefficients, were part of a research project to forecast employment, housing,
and population for the Williston Basin (Bangsund and Hodur 2013). Oil and Gas Division coefficients do not include petroleum refining.
Sources: Job Service North Dakota (2012, 2011, 2010, 2009, 2008, 2007, 2006, 2005, 2004), North Dakota Workforce Safety and Insurance (2012), Bangsund and
Hodur (2012), and Bangsund and Hodur (2013).
25
Job Service North Dakota
Job Service North Dakota reports employment and wages/salaries by county, multi-countyregion, and for the state using the North American Industry Classification System (NAICS). TheNAICS is a federal standard for measuring, collecting, and reporting business activity in theUnited States. The classification system consists of specific codes, aggregated into 20 broadindustry groupings (e.g., Utilities, Construction, Education, Health Care, Finance and Insurance,Manufacturing, Wholesale Trade).
While each broad industry grouping contains numerous specific industry/businessactivities, Job Service North Dakota reports employment and wage information for only thelargest aggregated categories in the NAICS (Job Service North Dakota 2012). The NAICS startswith various broad categories of employment by industry or sector, and then continues to refinethose categories into ever more specific and detailed categories. For example, code 21 is for AllMining, Quarrying, and Oil and Gas Extraction. Code 21 is further defined to include code 211(oil and gas extraction), 212 (mining), and 213 (support activities for mining). Within code 211,there are specific codes for oil and gas extraction (2111), which is further broken into code211111 (crude petroleum and natural gas extraction) and 211112 (natural gas liquid extraction). Similarly, code 213 (support activities for mining) is further broken into codes 213111 (drillingoil and gas wells), 213112 (support activities for oil and gas operations), 213113 (supportactivities for coal mining), 213114 (support activities for metal mining), and 213115 (supportactivities for nonmetallic minerals mining). Therefore, the broader the industrial code the lessspecific employment estimates will be for any particular business activity.
To avoid combining employment from other industries (e.g., code 21 includes oil and gasproduction and coal mining), the use of NAICS either requires using less aggregated codes (e.g.,code 2111) or requires counting employment from geographic areas that are known to onlycontain the industries in question (e.g., McKenzie County has oil and gas production but not coalmining). Since Job Service North Dakota generally reports employment using broader categoriesof the NAICS, one strategy to estimate employment for the petroleum sector would be to add upemployment from selected geographic areas in the state that have petroleum sector activities butdo not have coal sector activities. This strategy is possible because the petroleum industrygenerally operates in different counties than the coal industry. However, specific rules govern thedisclosure of employment data and county-level estimates of employment are often omitted toavoid violating disclosure rules. Therefore, only using county-level data will underestimateemployment in the petroleum sector due to reporting omissions for some counties.
An additional concern with using aggregated NAICS codes is that a number of specificbusiness activities which are part of the petroleum industry are contained in the NAICS codes forother industries. For example, code 23 (construction) contains oil and gas pipeline and relatedstructures construction (code 23712). Other examples include codes 31 through 33
Department of Agribusiness & Applied Economics 26
(manufacturing) which include codes 324110 (petroleum refineries), 324191 (petroleumlubricating oil and grease manufacturing), and 324199 (all other petroleum and coal productsmanufacturing). The same situation also exists for codes 48 and 49 (transportation andwarehousing), which include all of the activities associated with crude oil and unprocessed naturalgas pipelines. Of course, each of these aggregated NAICS codes contain employment that wouldbe classified as being part of the petroleum sector but is not listed specifically within the category. For example, some manufacturing and metal fabrication is petroleum sector based but would notbe listed with a separate NAICS code. Similarly, employment transporting fracking water andcrude oil by truck is currently measured as transportation employment but represents petroleumsector employment. Another example would include classification of construction employmentthat is used to build private roads and drill sites. Those petroleum sector jobs would not be listedseparately from overall employment in those other industries.
Job Service North Dakota does not track sole proprietors or self-employed individuals. Therefore, the number of jobs reported by industry code will not contain employment by self-employed individuals.
Job Service North Dakota can provide several estimates of employment in the petroleumsector in North Dakota (Job Service North Dakota 2012). The first figure would be a statewideestimate of employment using NAICS codes 211 (oil and gas extraction) and 213 (supportactivities for mining) (Table 7). The other would be a regional summary of jobs using code 21(all mining, quarrying, and oil and gas extraction) . Another employment estimate would actually3
represent a regional summation of jobs in both the petroleum sector-specific code 21 andemployment in related industries of manufacturing (codes 31-33), construction (code 23),wholesale trade (code 42), and transportation (code 48-49). However, not all employment inmanufacturing, construction, wholesale trade, or transportation in the oil producing regions ofNorth Dakota would qualify as petroleum sector employment. As such, actual petroleum sectoremployment would be expected to be less than the summation of regional employment in thoseindustries.
Workforce Safety and Insurance
Workforce Safety and Insurance (WSI) manages and regulates the workers’ compensationsystem in North Dakota. As part of that system, WSI tracks employees in North Dakota. Workforce Safety and Insurance uses a classification system for defining employment thatconsists of 142 categories based on the type of work activity performed. Several of thosecategories are specific to various activities in the petroleum sector. The classifications directlyattributable to the petroleum sector include Oil and Gas Operations (code 1320), Oil Refining -Synthetic Fuels Manufacturing (code 4740), Oil and Gas Development - Drilling (code 6203), Oil
Employment by more detailed NAICS codes were not available for multi-county employment estimates by Job3
Service North Dakota (2010, 2009, 2008, 2007, 2006, 2005, 2004).
27
and Gas Well Suppliers or Equipment Dealers (code 6204), Oil Well Trucking (code 6205), OilWell Servicing (code 6206), Oil and Gas Instrument Logging (6208), Geologists and Scouts(code 8605). Some petroleum sector employment can be traced through Professional andBusiness Representatives (code 8747) and Clerical Office Employees (code 8805). Otheremployment classifications contain petroleum sector employees but are not distinguished orcredited as being part of the petroleum sector.
Workforce Safety and Insurance does not provide measures of full-time employment butrather tracks the number of employees by job classification. The subtle difference betweentracking a job versus an employee is that if an employee has more than one employer during theyear that individual is counted twice. Further, if an employee works at any time during the yearthat individual is included within the WSI data even if the position or duration of work wastemporary. Therefore, the head-count data from WSI can include temporary work and caninclude duplications from those who worked for more than one employer during the year.
The WSI data has some employees placed in job classifications that are not attributable tothe petroleum sector, even if those activities occur within the petroleum sector. Examples ofthose classifications include Street and Road Construction (code 6042), Sewer-Water-Gas-Pipeline Construction (code 6301), and Trucking and Hauling - Interstate and Intrastate (code7215). Further, employment that would remain unmeasured would include employees performingrepairs, consulting, or other professional functions within the petroleum industry as thosepositions fall within other employment codes. WSI information also does not count self-employed or sole proprietors, unless they are required to report to WSI or voluntarily contributeto the workers’ compensation system.
Based on WSI data, the petroleum sector had over 51,600 employees working in thepetroleum sector during fiscal year 2011 (Table 7) (North Dakota Workforce Safety andInsurance 2012). The greatest number of employees was found in oil well servicing activities(12,557 individuals), oil well drilling activities (12,039 individuals), oil well trucking (10,162individuals), oil and gas operations (7,188 individuals), and oil and gas well suppliers (2,642individuals). Those categories collectively accounted for 86 percent of the workers in thepetroleum sector in North Dakota in fiscal year 2011.
Workforce Safety and Insurance employee data were obtained back to fiscal year 2004,which represents an approximate beginning period for the current oil shale development in thestate (Table 7) (Workforce Safety and Insurance 2012). From Fiscal Year (FY) 2004 to FY2011,the number of employees working in the petroleum sector increased by 780 percent. A regionalanalysis of employment in the core activities of the petroleum sector (NAICS codes 211 and 213)by Job Service North Dakota showed similar levels of employment change over the period; a 628percent increase from 2004 to 2011 (Table 7). By comparison, overall production of crude oil inthe state has increased by 390 percent from 2004 to 2011. It would appear that directemployment in the petroleum sector has increased slightly greater than the overall change in oil
Department of Agribusiness & Applied Economics 28
production over the period. The substantial increases in employment have resulted fromdisproportionately greater increases in drilling activities in 2011.
Oil and Gas Division Coefficients
The Oil and Gas Division of the North Dakota Department of Mineral Resources hasconducted an examination of the labor requirements for various segments of the oil and gasindustry (North Dakota Department of Mineral Resources 2012c). That effort produced details onthe amount and type of labor required for drilling, fracking, construction of oil field gatheringsystems, well operations, well maintenance, oil and gas transportation, and associated processingactivities. The coefficients are expressed as a labor requirement per unit of activity (e.g.,employment per drilling rig, service employment per well).
Using those coefficients, along with historic estimates of rig counts and operating wells,can produce estimates of employment in the petroleum sector. Bangsund and Hodur (2012)describe the use and application of those coefficients in a model that embodies the Oil and GasDivision coefficients. Output from that model shows similar trends and levels of employment asfound with estimates from Job Service North Dakota (Table 7). However, the use of Oil and GasDivision coefficients produces a lower estimate of direct employment than the methods used inthis study and provides a lower measure of employment obtained from Workforce Safety andInsurance data. Differences may be attributable to the interpretation of what constitutes directemployment in the industry. Other differences may be related to the degree of well servicingemployment in the early periods of Bakken/Three Forks wells.
This study uses a fairly broad definition of direct employment that crosses over a widerange of service and support activities in the oil fields. Some of those service and support jobs arenot likely counted in the Oil and Gas Coefficients. Also, jobs associated with crude oilprocessing are included in the survey data but not included in the Oil and Gas Divisioncoefficients. Finally, Oil and Gas Division coefficients likely underestimate the degree of wellservicing employment in the early periods of Bakken/Three Forks wells. Nevertheless, directemployment, as measured by using employment coefficients, shows similar overall rates ofchange in employment in the petroleum sector (Table 7).
Secondary Employment
Secondary employment is a term used to describe jobs that are created and supported bythe volume of business activity generated by an industry, but does not include jobs that are part ofthe industry. Direct employment and secondary employment are two distinctly differentmeasures.
29
Due to recent examinations of the rate of secondary job creation in the Williston Basin byBangsund and Hodur (2012), estimates of secondary employment for the petroleum industry inthis study were modified from the methods used in previous industry assessments. To arrive atestimates of state-level secondary job creation by the petroleum industry, the analysis was dividedinto two components. Estimates of statewide secondary job creation were developed from NorthDakota’s economic base data set (Coon et al. 2013) for a 15-year period prior to 2005. Thoseestimates were generated using traditional methods associated with productivity ratios and4
secondary business volume. Secondary business volume was generated using the North DakotaInput-Output Model with petroleum sector Sales to Final Demand from North Dakota’s economicbase data set (Coon et al. 2013). The economic base data set does not contain estimates of in-state expenditures associated with oil and gas exploration. Adjustments to employment estimateswere performed to account for the missing expenditures associated with oil exploration in thestate over the period. Further, the economic base data set assigns estimates of oil and gasroyalties and lease bonus payments to the Households sector (economy-wide personal income). The secondary job creation resulting from net in-state oil and gas royalties and in-state leasebonuses over the period also were estimated. Therefore, historic estimates of secondary jobcreation, using North Dakota’s economic base data set, were estimated using techniquesconsistent with recent economic contribution analyses (Bangsund et al. 2012; Coon et al. 2012a,2012b; Bangsund et al. 2011; Bangsund and Leistritz 2010). Estimates of secondary employmentcreated by the petroleum sector from 2000 to 2004 were averaged and represent a traditional levelof secondary job support in the North Dakota economy.
The second portion of the analysis relied on recent observations that traditional methods ofestimating secondary employment are overestimating job creation in the state (Bangsund andHodur 2012). To account for the incremental change in secondary job creation attributable to theindustry since 2005, the methods developed by Bangsund and Hodur (2012) to assignemployment coefficients to direct employment in the industry were used in this study. Estimatesof direct employment prior to 2005 were obtained from an employment model developed byBangsund and Hodur (2012) that combines historical data on drilling rigs and well counts incombination with employment coefficients from the Oil and Gas Division of the Department ofMineral Resources. Average employment prior to 2005 was subtracted from estimates of directemployment in 2005, 2007, 2009, and 2011 (years for which economic contribution analyseswere performed). The net gain in direct employment within the industry was then multiplied bysecondary job coefficients (multipliers) to estimate the incremental increase in secondary jobcreation above historical observations. The combination of the incremental change in secondaryjob creation and historical observations for secondary job creation represent a state-wide estimateof total secondary job support attributable to the industry. The industry was expected to havesupported 18,700 full-time secondary jobs in North Dakota in 2011.
A measure of the amount of business activity needed in an economic sector to support one full-time4
job.
Department of Agribusiness & Applied Economics 30
Government Revenues
Governmental revenues, usually based on tax collections, are another important measureof the economic impact of an industry on an economy. The petroleum industry in North Dakota,specifically oil and gas production, is responsible for substantial amounts of state and localgovernment revenues. One distinction is that unlike many other industries in North Dakota,severance taxes (taxes placed on the value of oil and gas removed from the ground) collect moneybased on gross revenues produced by the industry. In contrast, taxation for most other industriesis more traditional and usually limited to real property and net income. Another distinction thatmakes the petroleum industry different from other industries in the state is that governments canhold oil and gas leases and receive royalties from the value of oil and gas production. Of course,the petroleum industry also generates revenues from traditional sources, such as personal income,corporate income, sales and use, and property tax collections.
Severance taxes, sales and use taxes, personal income taxes, corporate income taxes,property taxes, royalties, lease bonuses, charitable donations, and licenses, fees, and permitscombined for $2.25 billion in government revenues that were directly attributable to thepetroleum industry in North Dakota in 2011 (Table 8). Exploration/development,extraction/production, and processing segments of the industry were responsible for about 20, 79,and 1 percent, respectively, of the total government revenues from the petroleum industry inNorth Dakota.
Severance taxes accounted for 57 percent of all government revenues from the petroleumindustry in North Dakota in 2011. The second largest source was the most common general taxes(i.e., property, personal income, sales and use, and corporate income) at 20 percent, followed byroyalties at 13 percent. The remainder of government revenues represented lease bonuses,permits/fees/licenses, and miscellaneous revenues.
In addition to the government revenues that were included as direct impacts, collectionsfrom personal income and sales and use taxes were estimated based on the secondary economicactivity generated by the petroleum industry. Secondary economic impacts in the Retail Tradesector were used to estimate revenue from sales and use taxes. Economic activity in theHouseholds sector (which represents economy-wide personal income) was used to estimatepersonal income tax collections. Total collections of personal income and sales and use taxesarising from secondary economic activity were estimated at $395 million (Table 8).
Government revenues included in the direct impacts represent revenues to countygovernments, tribal governments, and the state government. The amount of government revenuesflowing to local, state, and tribal governments was estimated to help identify the relative split inindustry revenues. North Dakota Office of State Treasurer (2012) estimated that in 2011, localgovernments (i.e., counties, cities, school districts) received distributions of state severance taxestotaling over $105 million. Total collections from state severance taxes in 2011 was estimated at
31
nearly $1.3 billion. Local governments’ share of severance taxes was just over 8 percent of totalcollections over the period and distributions of the state severance taxes to tribal governmentswere estimated at $43.9 million.
However, time periods for distributions and collections do not match. Distributions lagcollections, and therefore dividing distributions by collections in the same period is not a truerepresentation of the actual percentage of revenues that local governments can expect to receivefrom collections over any given period. Unfortunately, data to synchronize distributions from thetime periods when collections were made were not readily available.
Data from the U.S. Forest Service (2012) indicated that distributions of royalties and leasebonuses to local governments in North Dakota totaled $14.1 million in 2011. Total distributionsof royalties and lease bonuses from federal minerals to local and state governments in NorthDakota were estimated at $28.4 million (Office of Natural Resources Revenue 2012). Federalmineral royalties returned to local governments through the U.S. Forest Service primarilyrepresent revenues from acquired minerals. The Office of Natural Resources Revenue (ONRR)re-distributes revenues from federal acquired minerals and public domain minerals back to theNorth Dakota state government. ONRR distributes federal mineral royalties to tribal governmentsbut does not disclose the amount.
Given the information available, local governments were estimated to have received atleast $14.1 million of the $42.5 million in federal mineral royalties distributed to North Dakota(excluding tribal royalties). Local governments would be expected to collect property taxes foruse by county and city governments and school districts. Collections of property tax revenueattributable to the petroleum industry were estimated at $114 million.
Overall, local governments were estimated to receive $114 million in property taxes, $14.1million in federal mineral re-distributions, and $105 million in re-distributions from stateseverance taxes. Excluding licenses, permits, fees, and charitable donations, approximately 12.3percent of all government revenues estimated for the petroleum industry were received by localgovernments. Data to estimate the split in revenues for state and local governments for permits,fees, and licenses and for undetermined taxes were unavailable.
Department of Agribusiness & Applied Economics 32
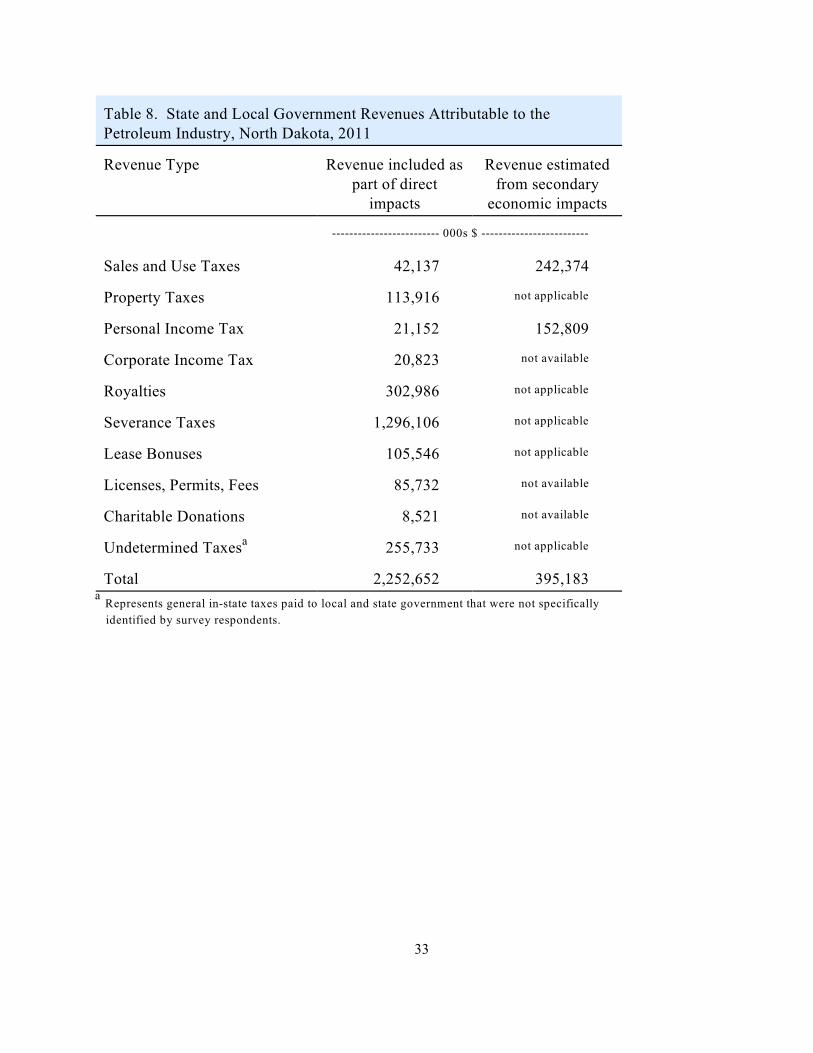
Table 8. State and Local Government Revenues Attributable to the Petroleum Industry, North Dakota, 2011
Revenue Type Revenue included aspart of direct
impacts
Revenue estimatedfrom secondary
economic impacts
------------------------- 000s $ -------------------------
Sales and Use Taxes 42,137 242,374
Property Taxes 113,916 not applicable
Personal Income Tax 21,152 152,809
Corporate Income Tax 20,823 not available
Royalties 302,986 not applicable
Severance Taxes 1,296,106 not applicable
Lease Bonuses 105,546 not applicable
Licenses, Permits, Fees 85,732 not available
Charitable Donations 8,521 not available
Undetermined Taxes 255,733a not applicable
Total 2,252,652 395,183
Represents general in-state taxes paid to local and state government that were not specificallya
identified by survey respondents.
33
Infrastructure Spending
The petroleum industry in North Dakota has been adding infrastructure to the WillistonBasin since the beginning stages of developing the Bakken/Three Forks Formations. Additionaltransportation capacity has been added to the region in the form of new export pipelines,expansions of existing crude oil pipelines, crude oil gathering systems, and crude oil rail loadingfacilities. New gas plants and expansions of existing plants have been added to the region, alongwith associated expansion and development of new collection systems to capture and transportnatural gas and natural gas liquids to processing locations. Additional infrastructure added by thepetroleum industry includes office buildings, regional transportation and distribution centers,worker housing, frac water re-cycling facilities, and general facility and building upgrades andrenovations. Capital expenditures for many forms of infrastructure have not been directlyincluded in the previous industry assessments (Bangsund and Leistritz 2007, 2009, 2010), asindustry expenditures have focused on expenditures associated with well drilling/completion, oiland gas production, transportation, and processing operations.
Separate surveys of oil operators, processors/shippers, and oil field service companiesincluded a standardized set of questions specific to various categories of infrastructuredevelopment and capital expenditures in North Dakota (Appendices A, B, and C). The surveyswere explicit in that expenditures were to represent projects in North Dakota for calendar year2011.
Information to estimate capital expenditures for infrastructure came from survey data andsecondary sources containing published estimates of project costs. Some estimates of capitalexpenditures represent discrete projects (e.g., gas plant) whereas other estimates representprojects that have less definable start and finish dates and less site-specific designations (e.g., oilfield gathering systems).
Estimating industry-wide infrastructure spending in 2011 requires addressing several keyissues. First, timing of the start and completion of project-based infrastructure (e.g., gas plant)does not necessarily coincide with the study time frame. Projects can be initiated in one year andcompleted in another (e.g., started in 2011 while completion may not occur until 2012 or later). Survey data represented expenditures made for project(s) in 2011, while various secondaryestimates of capital expenditures represent total costs for specific projects that might involvespending over extended periods. Therefore, the first task was to reconcile secondary data oninfrastructure costs with the anticipated timing of project-based expenditures. A project’s totalcost does not necessarily require all spending to occur in a single year, or occur solely in 2011.
Information was not available, on an industry-wide basis or on a project basis, todetermine what portion of capital expenditures was captured in the North Dakota economy. Forexample, a substantial portion of the cost of a new gas processing plant or pipeline represents
Department of Agribusiness & Applied Economics 34
specialized equipment. Specialized equipment is acquired from out-of-state sources as primarysuppliers are not available in North Dakota. Other studies have identified that a high proportionof specialized equipment for various types of processing facilities constructed in North Dakotaresults in economic leakage (Bangsund et al. 2012; Coon et al. 2012a; Leistritz 1995).
Two problems exist with current infrastructure spending. The portion of those capitalexpenditures captured in the North Dakota economy is unknown. Also, the distribution of in-statecapital expenditures among various economic sectors is unknown. The survey questionnaires didnot solicit information on the above issues. Cursory information on those details was obtainedfrom conversations with industry officials. For purposes of this study, it was assumed that laborrepresented two-thirds of capital expenditures while equipment/materials represented the otherone-third. Within that split, an additional assumption was made regarding the approximateportion that was retained or circulated within the North Dakota economy. About 60 percent oflabor was expected to be captured in North Dakota and 10 percent of material and equipment wascaptured in North Dakota. The adjustments resulted in about 44 percent of capital expenditurescirculating in the North Dakota economy. Leistritz (1995) found that in-state capture of labor andmaterials associated with the ProGold corn processing plant in the Red River Valley was 43percent.
Based on published estimates of project expenditures, survey data, and extrapolation ofsurvey data in combination with unpublished data, the petroleum industry was estimated to havespent between $2.5 billion to $2.7 billion on infrastructure projects in the state in 2011 (Table 9). After adjustments for economic leakage (the portion of expenditures not captured in the NorthDakota economy), it was estimated that about $1.1 billion to $1.2 billion were captured in theNorth Dakota economy (Table 9).
The gross business volume associated with infrastructure spending in North Dakota wasestimated to range from $3.4 to $3.7 billion in 2011 (Table 10). Infrastructure spending, asdefined in this report, would represent additional economic activity beyond that created by theexploration, production, transportation, and processing segments of the industry.
35
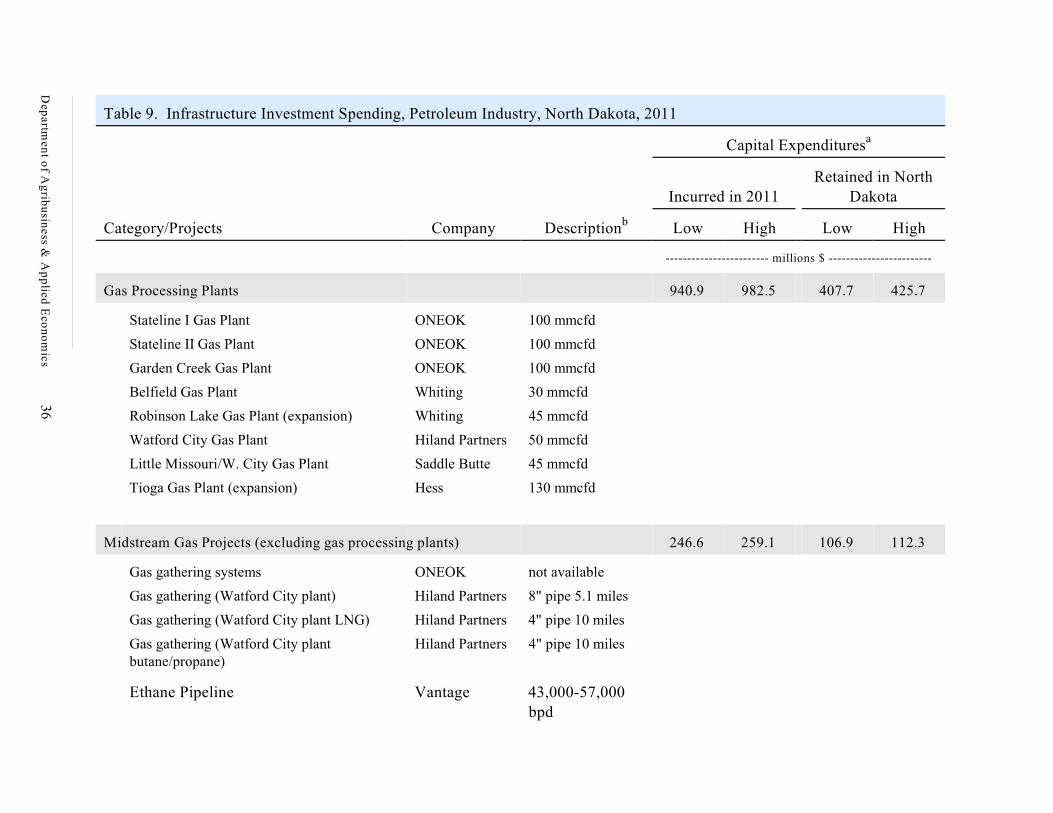
Table 9. Infrastructure Investment Spending, Petroleum Industry, North Dakota, 2011
Capital Expendituresa
Category/Projects Company Descriptionb
Incurred in 2011Retained in North
Dakota
Low High Low High
------------------------ millions $ ------------------------
Gas Processing Plants 940.9 982.5 407.7 425.7
Stateline I Gas Plant ONEOK 100 mmcfd
Stateline II Gas Plant ONEOK 100 mmcfd
Garden Creek Gas Plant ONEOK 100 mmcfd
Belfield Gas Plant Whiting 30 mmcfd
Robinson Lake Gas Plant (expansion) Whiting 45 mmcfd
Watford City Gas Plant Hiland Partners 50 mmcfd
Little Missouri/W. City Gas Plant Saddle Butte 45 mmcfd
Tioga Gas Plant (expansion) Hess 130 mmcfd
Midstream Gas Projects (excluding gas processing plants) 246.6 259.1 106.9 112.3
Gas gathering systems ONEOK not available
Gas gathering (Watford City plant) Hiland Partners 8" pipe 5.1 miles
Gas gathering (Watford City plant LNG) Hiland Partners 4" pipe 10 miles
Gas gathering (Watford City plantbutane/propane)
Hiland Partners 4" pipe 10 miles
Ethane Pipeline Vantage 43,000-57,000bpd
Dep
artmen
t of A
grib
usin
ess & A
pp
lied E
con
om
ics36
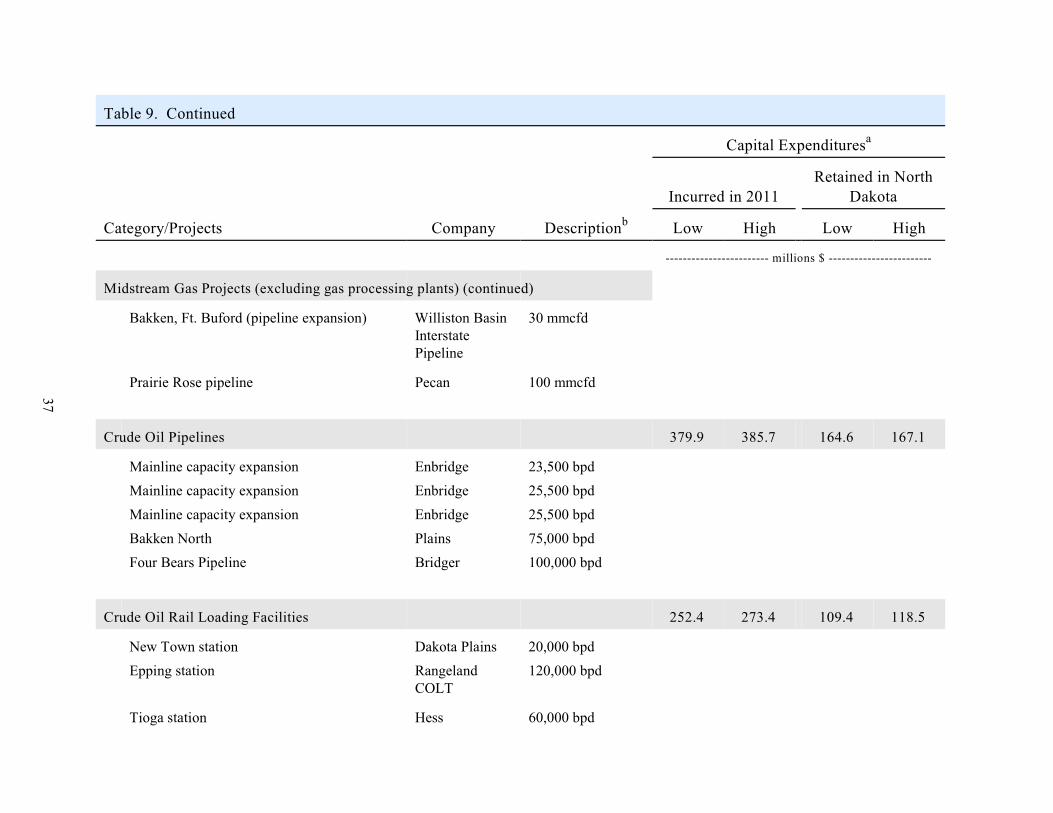
Table 9. Continued
Capital Expendituresa
Category/Projects Company Descriptionb
Incurred in 2011Retained in North
Dakota
Low High Low High
------------------------ millions $ ------------------------
Midstream Gas Projects (excluding gas processing plants) (continued)
Bakken, Ft. Buford (pipeline expansion) Williston BasinInterstatePipeline
30 mmcfd
Prairie Rose pipeline Pecan 100 mmcfd
Crude Oil Pipelines 379.9 385.7 164.6 167.1
Mainline capacity expansion Enbridge 23,500 bpd
Mainline capacity expansion Enbridge 25,500 bpd
Mainline capacity expansion Enbridge 25,500 bpd
Bakken North Plains 75,000 bpd
Four Bears Pipeline Bridger 100,000 bpd
Crude Oil Rail Loading Facilities 252.4 273.4 109.4 118.5
New Town station Dakota Plains 20,000 bpd
Epping station RangelandCOLT
120,000 bpd
Tioga station Hess 60,000 bpd
37
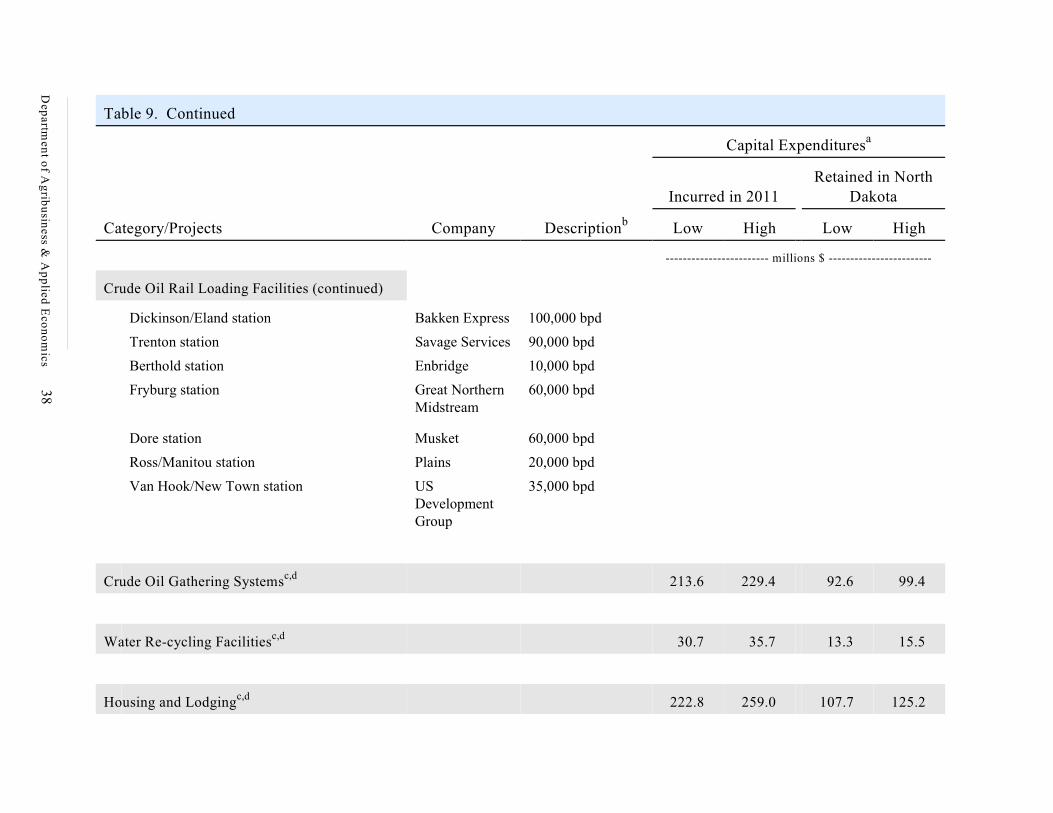
Table 9. Continued
Capital Expendituresa
Category/Projects Company Descriptionb
Incurred in 2011Retained in North
Dakota
Low High Low High
------------------------ millions $ ------------------------
Crude Oil Rail Loading Facilities (continued)
Dickinson/Eland station Bakken Express 100,000 bpd
Trenton station Savage Services 90,000 bpd
Berthold station Enbridge 10,000 bpd
Fryburg station Great NorthernMidstream
60,000 bpd
Dore station Musket 60,000 bpd
Ross/Manitou station Plains 20,000 bpd
Van Hook/New Town station USDevelopmentGroup
35,000 bpd
Crude Oil Gathering Systems 213.6 229.4 92.6 99.4c,d
Water Re-cycling Facilities 30.7 35.7 13.3 15.5c,d
Housing and Lodging 222.8 259.0 107.7 125.2c,d
Dep
artmen
t of A
grib
usin
ess & A
pp
lied E
con
om
ics3
8
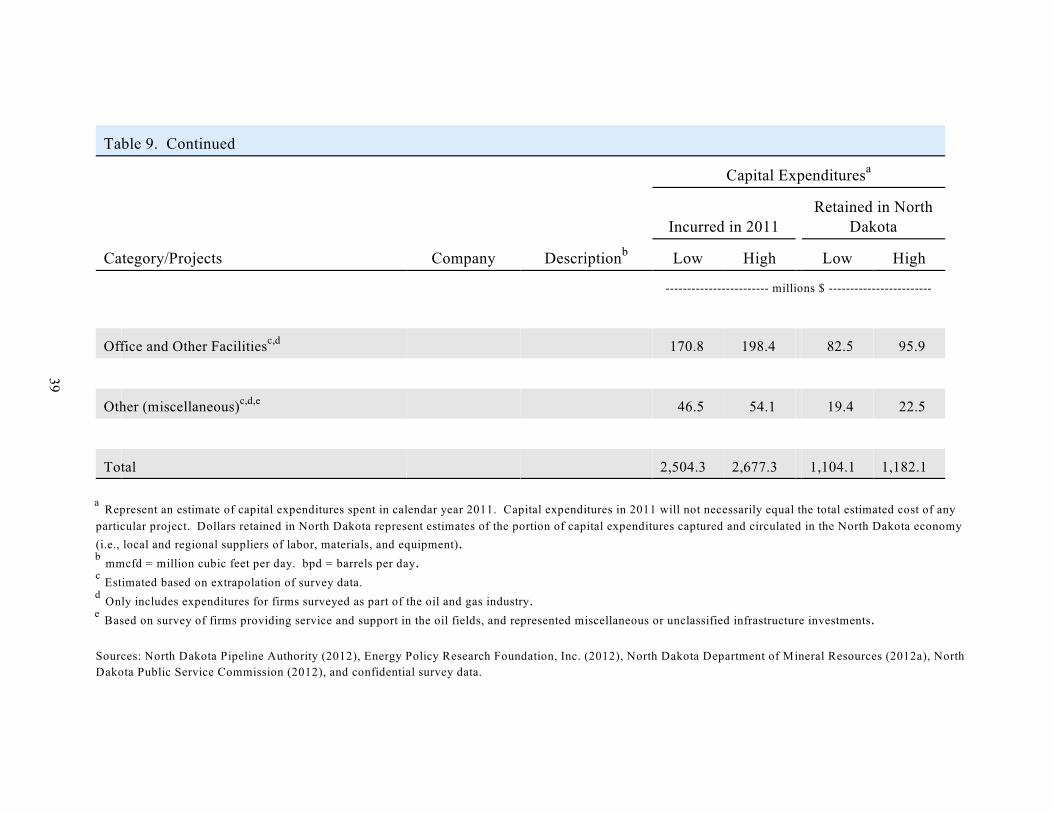
Table 9. Continued
Capital Expendituresa
Category/Projects Company Descriptionb
Incurred in 2011Retained in North
Dakota
Low High Low High
------------------------ millions $ ------------------------
Office and Other Facilities 170.8 198.4 82.5 95.9c,d
Other (miscellaneous) 46.5 54.1 19.4 22.5c,d,e
Total 2,504.3 2,677.3 1,104.1 1,182.1
Represent an estimate of capital expenditures spent in calendar year 2011. Capital expenditures in 2011 will not necessarily equal the total estimated cost of anya
particular project. Dollars retained in North Dakota represent estimates of the portion of capital expenditures captured and circulated in the North Dakota economy
(i.e., local and regional suppliers of labor, materials, and equipment). mmcfd = million cubic feet per day. bpd = barrels per day.b
Estimated based on extrapolation of survey data.c
Only includes expenditures for firms surveyed as part of the oil and gas industry.d
Based on survey of firms providing service and support in the oil fields, and represented miscellaneous or unclassified infrastructure investments.e
Sources: North Dakota Pipeline Authority (2012), Energy Policy Research Foundation, Inc. (2012), North Dakota Department of Mineral Resources (2012a), North
Dakota Public Service Commission (2012), and confidential survey data.
39
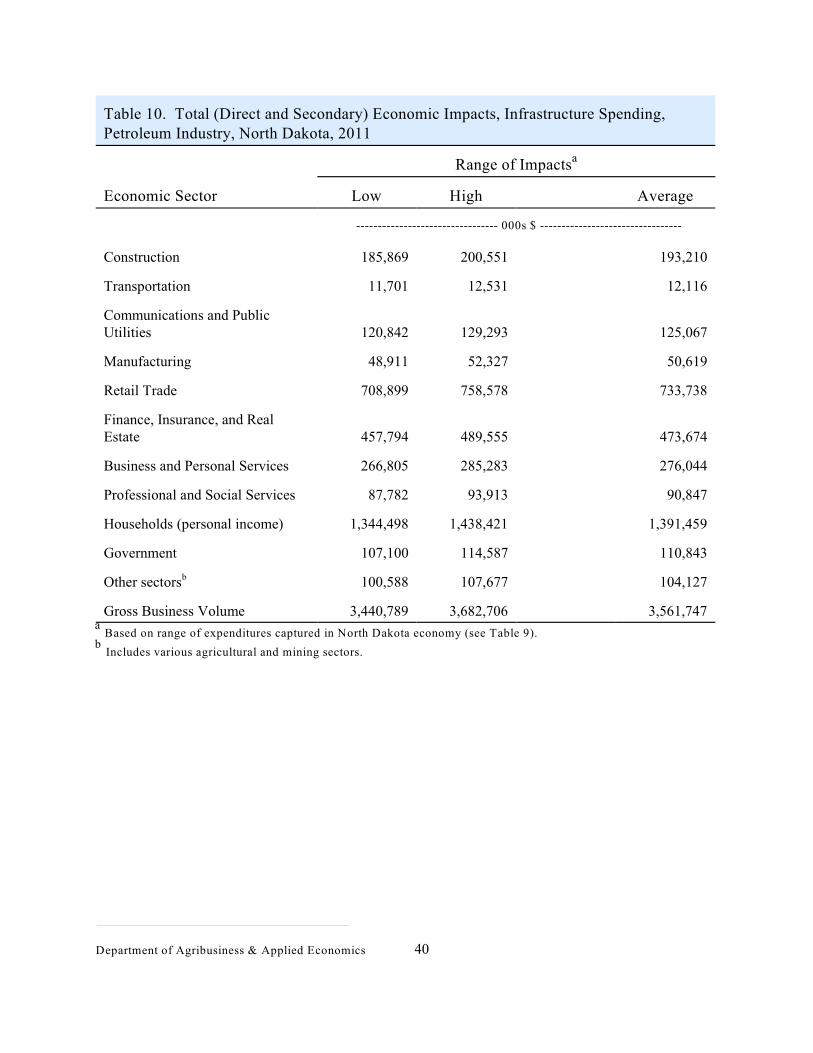
Table 10. Total (Direct and Secondary) Economic Impacts, Infrastructure Spending,Petroleum Industry, North Dakota, 2011
Range of Impactsa
Economic Sector Low High Average
--------------------------------- 000s $ ---------------------------------
Construction 185,869 200,551 193,210
Transportation 11,701 12,531 12,116
Communications and PublicUtilities 120,842 129,293 125,067
Manufacturing 48,911 52,327 50,619
Retail Trade 708,899 758,578 733,738
Finance, Insurance, and RealEstate 457,794 489,555 473,674
Business and Personal Services 266,805 285,283 276,044
Professional and Social Services 87,782 93,913 90,847
Households (personal income) 1,344,498 1,438,421 1,391,459
Government 107,100 114,587 110,843
Other sectors 100,588 107,677 104,127b
Gross Business Volume 3,440,789 3,682,706 3,561,747
Based on range of expenditures captured in North Dakota economy (see Table 9).a
Includes various agricultural and mining sectors. b
Department of Agribusiness & Applied Economics 40
Total Economic Impacts
The total economic effect of an industry on a local, state, or regional economy can bemeasured by estimating the total amount of business activity generated by that industry. Totalbusiness activity, sometimes called gross business volume, is generally defined as a combinationof direct and secondary economic impacts. Direct impacts are those changes in output,employment, or income that represent the initial or first-round effects of a project, program,policy, or activity. Secondary impacts (sometimes further categorized into indirect and inducedeffects) result from subsequent rounds of spending and respending within an economy. Thisprocess of spending and respending is sometimes termed the multiplier process, and the resultantsecondary effects are sometimes referred to as multiplier effects. Further, additional economicmeasures, such as personal income, tax revenue, and employment, are often used to measure therelative size of an industry.
The petroleum industry in North Dakota was defined to include exploration/welldevelopment, extraction/production, transportation, and processing of crude oil and natural gas. Direct impacts were based on in-state expenditures, private and public royalties, taxes, leasebonuses, and expenditures retained in North Dakota for infrastructure development. Directimpacts were allocated to various sectors of the North Dakota Input-Output Model to generateestimates of the secondary economic impacts.
The direct impact of exploration/development in 2011 was estimated at $6.1 billion. Totalsecondary economic impacts associated with well drilling and completion activities wereestimated at $10.7 billion. The in-state gross business volume of exploration activities wasestimated at $16.8 billion in 2011 (Table 11).
The direct impact of extraction/production in 2011 was estimated at $4 billion. Totalsecondary economic impacts associated with extraction and production activities were estimatedat $4.7 billion. The in-state gross business volume of oil and gas extraction was estimated at $8.6billion in 2011 (Table 11).
The transportation and processing component of the petroleum industry was estimated tohave a direct impact in North Dakota of $475 million. Total secondary economic impactsassociated with processing and transporting crude oil and natural gas were estimated at $895million. The in-state gross business volume of processing and transporting crude oil and naturalgas was estimated at $1.4 billion in 2011 (Table 11).
About $1.1 billion to $1.2 billion of infrastructure spending were captured in the NorthDakota economy after adjusting total capital expenditures for economic leakage (the portion ofexpenditures not captured in the North Dakota economy). The gross business volume associatedwith infrastructure spending in North Dakota was estimated to range from $3.4 to $3.7 billion in2011. Infrastructure spending, as defined in this report, would represent additional economicactivity beyond that created by the exploration/development, extraction/production,transportation, and processing segments of the industry.
41
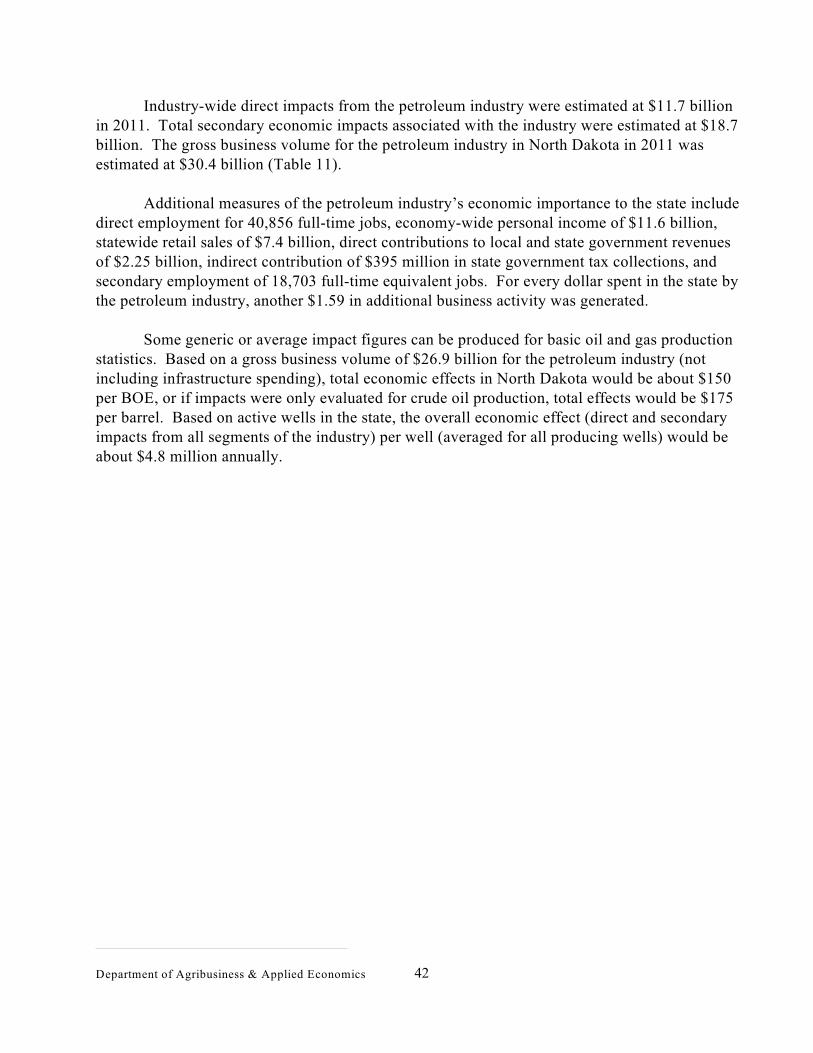
Industry-wide direct impacts from the petroleum industry were estimated at $11.7 billionin 2011. Total secondary economic impacts associated with the industry were estimated at $18.7billion. The gross business volume for the petroleum industry in North Dakota in 2011 wasestimated at $30.4 billion (Table 11).
Additional measures of the petroleum industry’s economic importance to the state includedirect employment for 40,856 full-time jobs, economy-wide personal income of $11.6 billion,statewide retail sales of $7.4 billion, direct contributions to local and state government revenuesof $2.25 billion, indirect contribution of $395 million in state government tax collections, andsecondary employment of 18,703 full-time equivalent jobs. For every dollar spent in the state bythe petroleum industry, another $1.59 in additional business activity was generated.
Some generic or average impact figures can be produced for basic oil and gas productionstatistics. Based on a gross business volume of $26.9 billion for the petroleum industry (notincluding infrastructure spending), total economic effects in North Dakota would be about $150per BOE, or if impacts were only evaluated for crude oil production, total effects would be $175per barrel. Based on active wells in the state, the overall economic effect (direct and secondaryimpacts from all segments of the industry) per well (averaged for all producing wells) would beabout $4.8 million annually.
Department of Agribusiness & Applied Economics 42
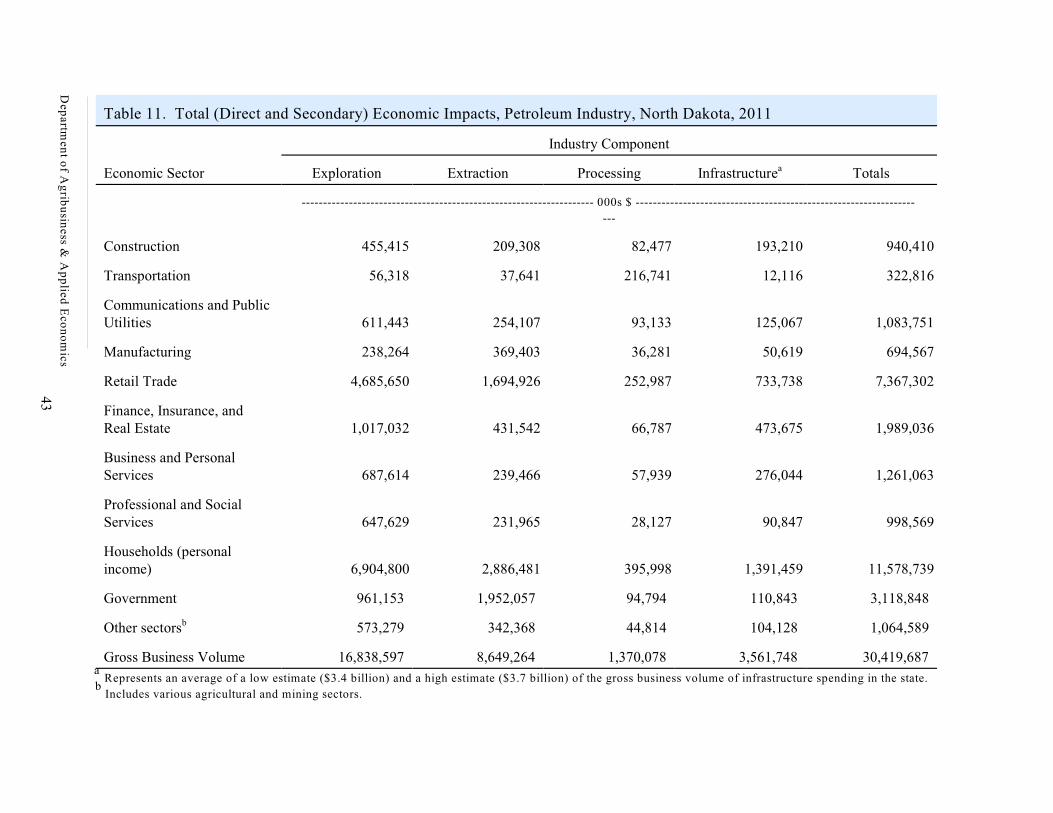
Table 11. Total (Direct and Secondary) Economic Impacts, Petroleum Industry, North Dakota, 2011
Industry Component
Economic Sector Exploration Extraction Processing Infrastructure Totalsa
-------------------------------------------------------------------- 000s $ -----------------------------------------------------------------
---
Construction 455,415 209,308 82,477 193,210 940,410
Transportation 56,318 37,641 216,741 12,116 322,816
Communications and PublicUtilities 611,443 254,107 93,133 125,067 1,083,751
Manufacturing 238,264 369,403 36,281 50,619 694,567
Retail Trade 4,685,650 1,694,926 252,987 733,738 7,367,302
Finance, Insurance, andReal Estate 1,017,032 431,542 66,787 473,675 1,989,036
Business and PersonalServices 687,614 239,466 57,939 276,044 1,261,063
Professional and SocialServices 647,629 231,965 28,127 90,847 998,569
Households (personalincome) 6,904,800 2,886,481 395,998 1,391,459 11,578,739
Government 961,153 1,952,057 94,794 110,843 3,118,848
Other sectors 573,279 342,368 44,814 104,128 1,064,589b
Gross Business Volume 16,838,597 8,649,264 1,370,078 3,561,748 30,419,687
Represents an average of a low estimate ($3.4 billion) and a high estimate ($3.7 billion) of the gross business volume of infrastructure spending in the state.a
Includes various agricultural and mining sectors. b
43
Dep
artmen
t of A
grib
usin
ess & A
pp
lied E
con
om
ics
COMPARISON OF PREVIOUS INDUSTRY ASSESSMENTS
The first comprehensive economic evaluation of the petroleum industry in North Dakotawas conducted in 2006 and was reflective of conditions present in the industry in calendar year2005 (Bangsund and Leistritz 2007). A second assessment was conducted two years later andwas reflective of conditions present in the industry during calendar year 2007 (Bangsund andLeistritz 2009). A third study was conducted in 2010 analyzing industry activity in 2009(Bangsund and Leistritz 2010). The results reported in this study were based on conditionspresent in the industry in calendar year 2011.
Comparing various production statistics between 2005, 2007, 2009, and 2011 revealed thatthe industry has dramatically increased the number of producing wells, oil and gas production,and drilling activities in the state (Table 10). Nominal oil and gas prices in 2005, 2007, and 2009were adjusted for inflation using the Gross Domestic Product-Implicit Price Deflator. Crude oilprices over the 2005 to 2009 period were similar, but prices in 2011 were considerably higherthan observed in the previous periods. Prices received for natural gas have decreased over the2005 to 2011 period. Oil production has increased over 329 percent from 35 million barrels to153 million barrels over the period. Gas production jumped from around 58 million mcf in 2005to over 155 million mcf in 2011. In addition to increases in oil and gas production,exploration/development activities in the state continued to increase as the number of wellscompleted in the state went from 240 in 2005 to 1,271 in 2011 (Table 12).
Methods and data sources between the four studies were largely unchanged, althoughrefinements in data collection and estimation techniques have been implemented since the firsteconomic assessment in 2005. In the 2007 study, a separate survey of lease/brokerage firms wasinitiated to help generate estimates of in-state lease bonuses on private land in North Dakota. Bycomparison, lease bonuses on private land in 2005 were based on information obtained from thesurvey of oil operators and data on well drilling activity. Firms providing oil field services werenot surveyed in the 2007 study, but those firms were surveyed in the 2005, 2009, and 2011studies. Several refinements were implemented in the 2011 study. Detailed data on well drillingand well completion costs were obtained from oil operators to examine economic leakageassociated with well drilling and well completion activities. Also, estimation of in-state mineralroyalty revenues was refined based on payment data obtained from oil operators in the state. Finally, the 2011 study collected survey data on infrastructure spending by the industry.
Department of Agribusiness & Applied Economics 44
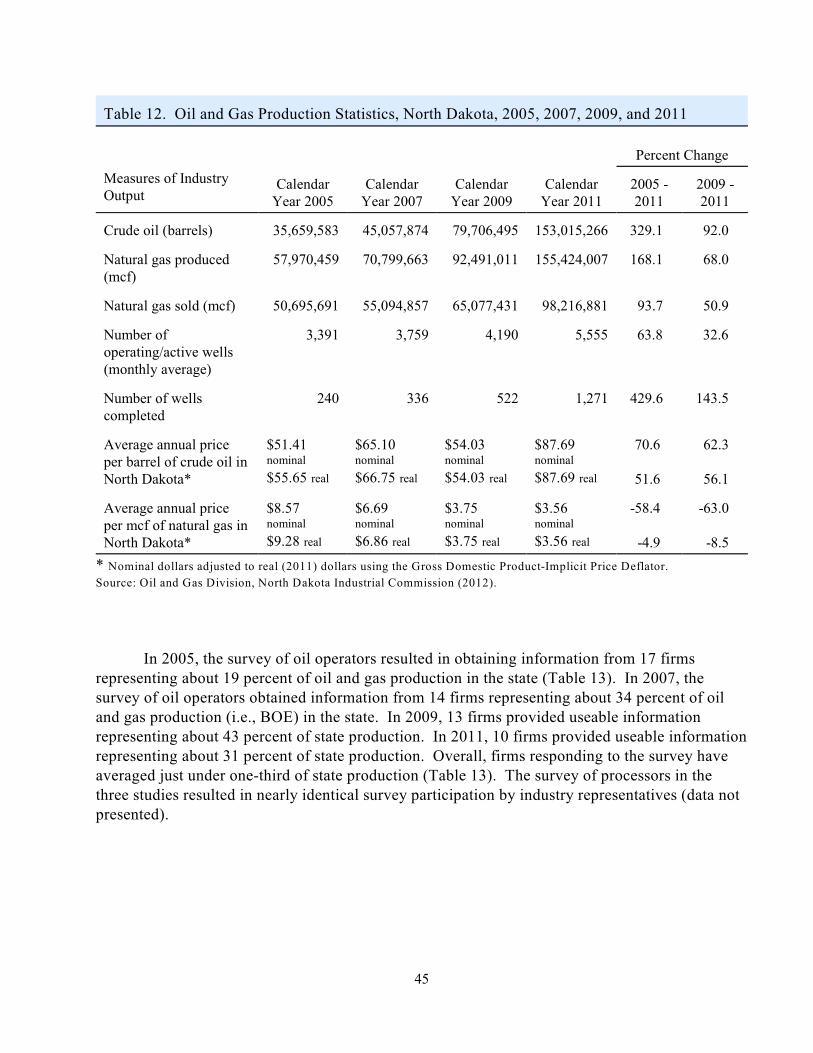
Table 12. Oil and Gas Production Statistics, North Dakota, 2005, 2007, 2009, and 2011
Measures of IndustryOutput
CalendarYear 2005
CalendarYear 2007
CalendarYear 2009
CalendarYear 2011
Percent Change
2005 -2011
2009 -2011
Crude oil (barrels) 35,659,583 45,057,874 79,706,495 153,015,266 329.1 92.0
Natural gas produced(mcf)
57,970,459 70,799,663 92,491,011 155,424,007 168.1 68.0
Natural gas sold (mcf) 50,695,691 55,094,857 65,077,431 98,216,881 93.7 50.9
Number ofoperating/active wells(monthly average)
3,391 3,759 4,190 5,555 63.8 32.6
Number of wellscompleted
240 336 522 1,271 429.6 143.5
Average annual priceper barrel of crude oil inNorth Dakota*
$51.41nominal
$55.65 real
$65.10nominal
$66.75 real
$54.03nominal
$54.03 real
$87.69nominal
$87.69 real
70.6
51.6
62.3
56.1
Average annual priceper mcf of natural gas inNorth Dakota*
$8.57nominal
$9.28 real
$6.69nominal
$6.86 real
$3.75nominal
$3.75 real
$3.56nominal
$3.56 real
-58.4
-4.9
-63.0
-8.5
* Nominal dollars adjusted to real (2011) dollars using the Gross Domestic Product-Implicit Price Deflator.
Source: Oil and Gas Division, North Dakota Industrial Commission (2012).
In 2005, the survey of oil operators resulted in obtaining information from 17 firmsrepresenting about 19 percent of oil and gas production in the state (Table 13). In 2007, thesurvey of oil operators obtained information from 14 firms representing about 34 percent of oiland gas production (i.e., BOE) in the state. In 2009, 13 firms provided useable informationrepresenting about 43 percent of state production. In 2011, 10 firms provided useable informationrepresenting about 31 percent of state production. Overall, firms responding to the survey haveaveraged just under one-third of state production (Table 13). The survey of processors in thethree studies resulted in nearly identical survey participation by industry representatives (data notpresented).
45
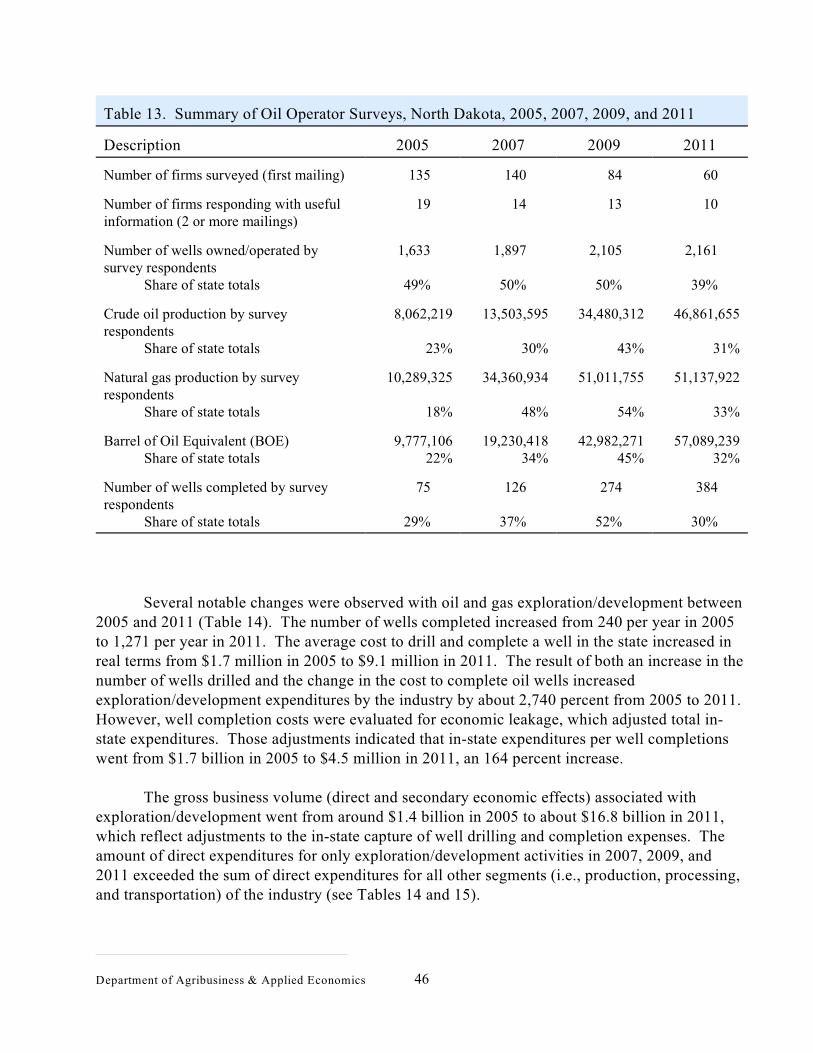
Table 13. Summary of Oil Operator Surveys, North Dakota, 2005, 2007, 2009, and 2011
Description 2005 2007 2009 2011
Number of firms surveyed (first mailing) 135 140 84 60
Number of firms responding with usefulinformation (2 or more mailings)
19 14 13 10
Number of wells owned/operated bysurvey respondents Share of state totals
1,633
49%
1,897
50%
2,105
50%
2,161
39%
Crude oil production by surveyrespondents Share of state totals
8,062,219
23%
13,503,595
30%
34,480,312
43%
46,861,655
31%
Natural gas production by surveyrespondents Share of state totals
10,289,325
18%
34,360,934
48%
51,011,755
54%
51,137,922
33%
Barrel of Oil Equivalent (BOE) Share of state totals
9,777,10622%
19,230,41834%
42,982,27145%
57,089,23932%
Number of wells completed by surveyrespondents Share of state totals
75
29%
126
37%
274
52%
384
30%
Several notable changes were observed with oil and gas exploration/development between2005 and 2011 (Table 14). The number of wells completed increased from 240 per year in 2005to 1,271 per year in 2011. The average cost to drill and complete a well in the state increased inreal terms from $1.7 million in 2005 to $9.1 million in 2011. The result of both an increase in thenumber of wells drilled and the change in the cost to complete oil wells increasedexploration/development expenditures by the industry by about 2,740 percent from 2005 to 2011. However, well completion costs were evaluated for economic leakage, which adjusted total in-state expenditures. Those adjustments indicated that in-state expenditures per well completionswent from $1.7 billion in 2005 to $4.5 million in 2011, an 164 percent increase.
The gross business volume (direct and secondary economic effects) associated withexploration/development went from around $1.4 billion in 2005 to about $16.8 billion in 2011,which reflect adjustments to the in-state capture of well drilling and completion expenses. Theamount of direct expenditures for only exploration/development activities in 2007, 2009, and2011 exceeded the sum of direct expenditures for all other segments (i.e., production, processing,and transportation) of the industry (see Tables 14 and 15).
Department of Agribusiness & Applied Economics 46
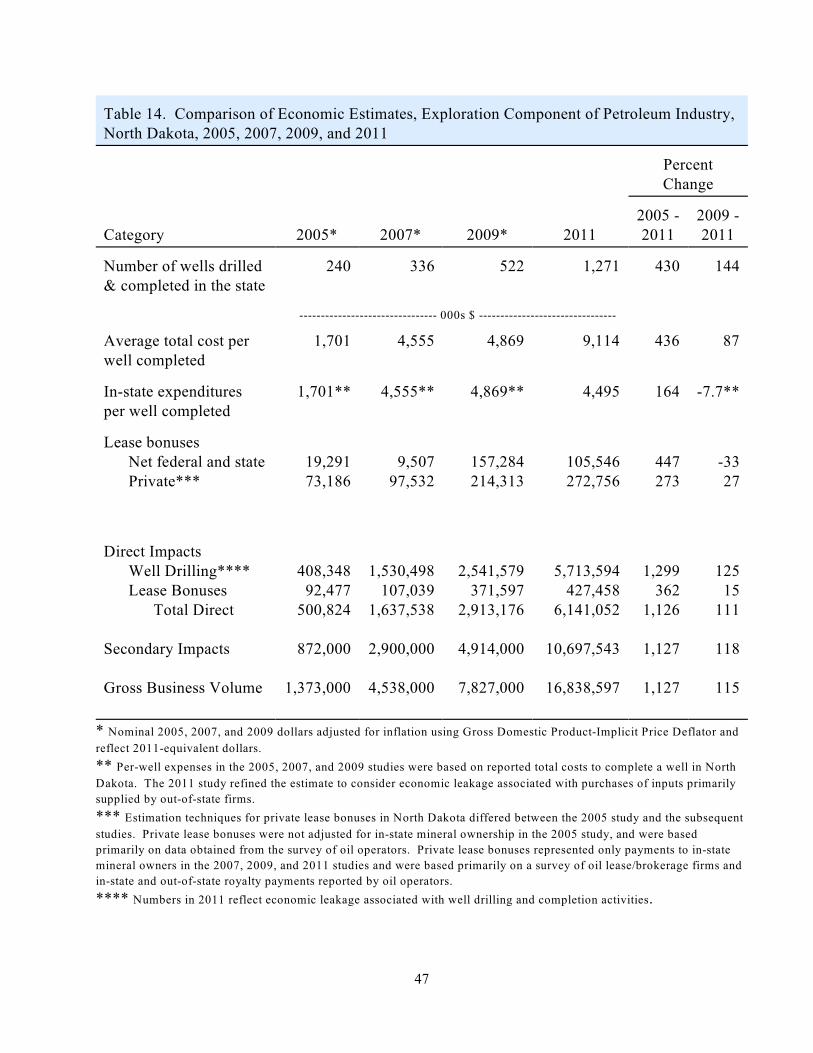
Table 14. Comparison of Economic Estimates, Exploration Component of Petroleum Industry,North Dakota, 2005, 2007, 2009, and 2011
PercentChange
Category 2005* 2007* 2009* 20112005 -2011
2009 -2011
Number of wells drilled& completed in the state
240 336 522 1,271 430 144
-------------------------------- 000s $ --------------------------------
Average total cost perwell completed
1,701 4,555 4,869 9,114 436 87
In-state expendituresper well completed
1,701** 4,555** 4,869** 4,495 164 -7.7**
Lease bonuses Net federal and state Private***
19,29173,186
9,50797,532
157,284214,313
105,546272,756
447273
-3327
Direct Impacts Well Drilling**** Lease Bonuses Total Direct
Secondary Impacts
Gross Business Volume
408,34892,477
500,824
872,000
1,373,000
1,530,498107,039
1,637,538
2,900,000
4,538,000
2,541,579371,597
2,913,176
4,914,000
7,827,000
5,713,594427,458
6,141,052
10,697,543
16,838,597
1,299362
1,126
1,127
1,127
12515
111
118
115
* Nominal 2005, 2007, and 2009 dollars adjusted for inflation using Gross Domestic Product-Implicit Price Deflator and
reflect 2011-equivalent dollars.
** Per-well expenses in the 2005, 2007, and 2009 studies were based on reported total costs to complete a well in North
Dakota. The 2011 study refined the estimate to consider economic leakage associated with purchases of inputs primarily
supplied by out-of-state firms.
*** Estimation techniques for private lease bonuses in North Dakota differed between the 2005 study and the subsequent
studies. Private lease bonuses were not adjusted for in-state mineral ownership in the 2005 study, and were based
primarily on data obtained from the survey of oil operators. Private lease bonuses represented only payments to in-state
mineral owners in the 2007, 2009, and 2011 studies and were based primarily on a survey of oil lease/brokerage firms and
in-state and out-of-state royalty payments reported by oil operators.
**** Numbers in 2011 reflect economic leakage associated with well drilling and completion activities.
47
Changes in oil and gas production have implications on the gross business volume of theindustry in the state. Based on the reported expenses associated with oil and gas production,volume of production has a greater effect than the expenses per unit of output (i.e., in-stateexpenditures per BOE) (Table 15). Also, increases in the overall royalty rates paid on mineralownership have contributed to increased royalty payments, which were considered a direct impactin the estimation of gross business volume. Likewise, collections of severance taxes, alsoconsidered a direct impact, increased substantially, reflecting an increase in the overall value ofoil and gas production in the state. From 2005 to 2011, total direct expenditures for oil and gasproduction increased by about 289 percent. As expected, the gross business volume from oilproduction also increased by a similar percentage over the period (Table 15).
The processing sector of the petroleum industry also showed substantial increase inexpenditures over the 2005 to 2011 period (Table 16). Some of the increase came fromexpansion of pipeline capacity and expansion of natural gas processing capacity in the state. Some change in expenditures was a result of greater processing volumes, pipeline shipments, andgrowth in rail shipments. The other change came from a substantial increase in transportationexpenses reported by oil operators. Overall, the change in direct expenditures in this segment ofthe industry reflected an increase in processing/transporting volumes and an increase intransportation expenses. The gross business volume for the processing and transportationcomponent of the petroleum industry increased by about 229 percent from 2005 through 2011(Table 16).
Department of Agribusiness & Applied Economics 48
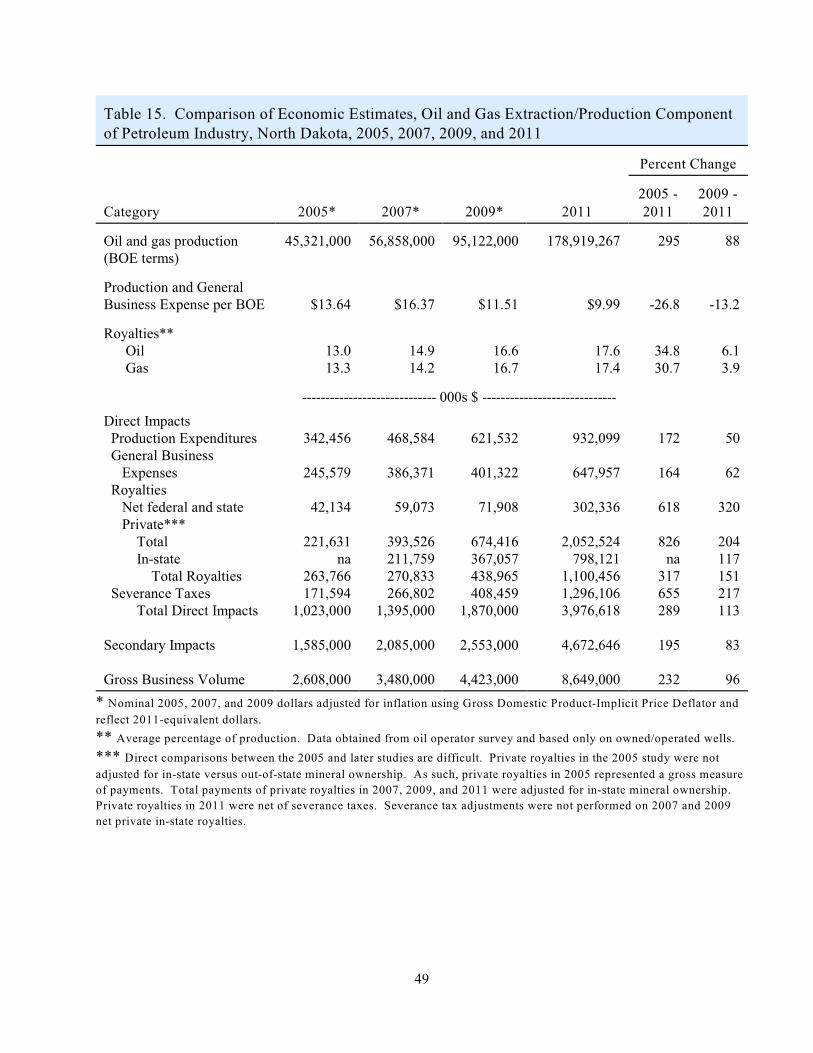
Table 15. Comparison of Economic Estimates, Oil and Gas Extraction/Production Componentof Petroleum Industry, North Dakota, 2005, 2007, 2009, and 2011
Percent Change
Category 2005* 2007* 2009* 20112005 -2011
2009 -2011
Oil and gas production(BOE terms)
45,321,000 56,858,000 95,122,000 178,919,267 295 88
Production and GeneralBusiness Expense per BOE $13.64 $16.37 $11.51 $9.99 -26.8 -13.2
Royalties** Oil Gas
13.013.3
14.914.2
16.616.7
17.617.4
34.830.7
6.13.9
----------------------------- 000s $ -----------------------------
Direct Impacts Production Expenditures General Business Expenses Royalties Net federal and state Private*** Total In-state Total Royalties Severance Taxes Total Direct Impacts
Secondary Impacts
Gross Business Volume
342,456
245,579
42,134
221,631na
263,766171,594
1,023,000
1,585,000
2,608,000
468,584
386,371
59,073
393,526211,759270,833266,802
1,395,000
2,085,000
3,480,000
621,532
401,322
71,908
674,416367,057438,965408,459
1,870,000
2,553,000
4,423,000
932,099
647,957
302,336
2,052,524798,121
1,100,4561,296,1063,976,618
4,672,646
8,649,000
172
164
618
826na
317655289
195
232
50
62
320
204117151217113
83
96
* Nominal 2005, 2007, and 2009 dollars adjusted for inflation using Gross Domestic Product-Implicit Price Deflator and
reflect 2011-equivalent dollars.
** Average percentage of production. Data obtained from oil operator survey and based only on owned/operated wells.
*** Direct comparisons between the 2005 and later studies are difficult. Private royalties in the 2005 study were not
adjusted for in-state versus out-of-state mineral ownership. As such, private royalties in 2005 represented a gross measure
of payments. Total payments of private royalties in 2007, 2009, and 2011 were adjusted for in-state mineral ownership.
Private royalties in 2011 were net of severance taxes. Severance tax adjustments were not performed on 2007 and 2009
net private in-state royalties.
49
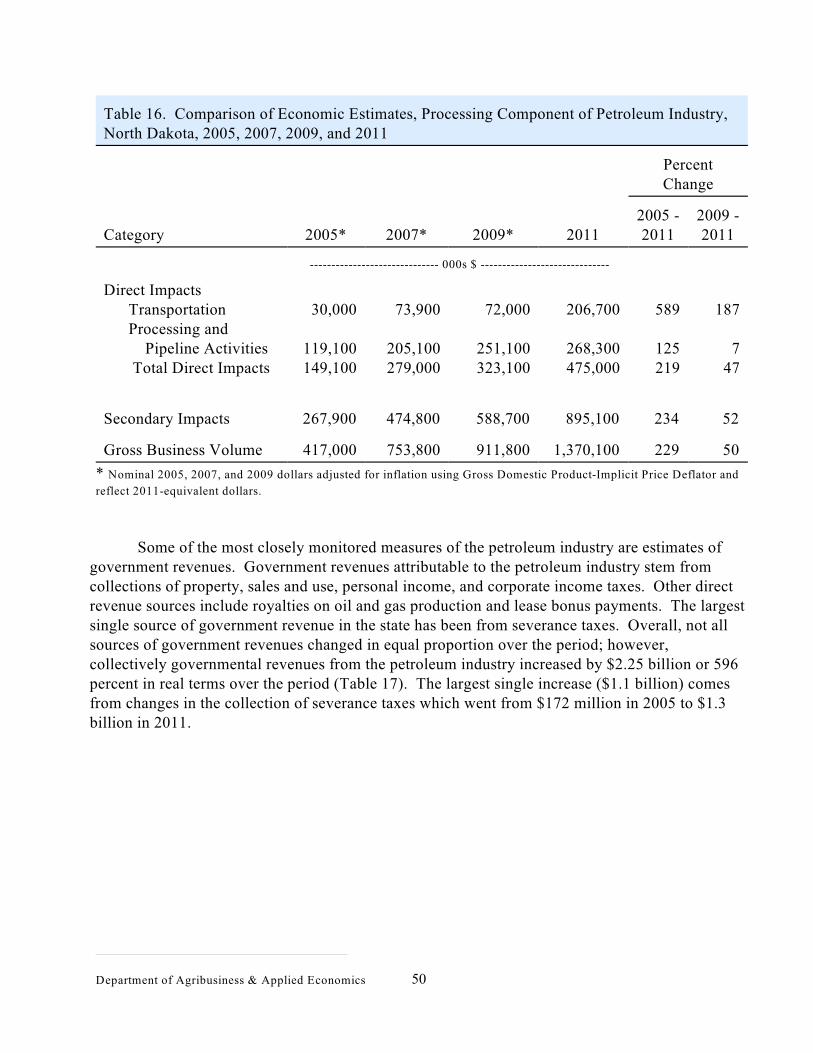
Table 16. Comparison of Economic Estimates, Processing Component of Petroleum Industry,North Dakota, 2005, 2007, 2009, and 2011
PercentChange
Category 2005* 2007* 2009* 20112005 -2011
2009 -2011
------------------------------ 000s $ ------------------------------
Direct Impacts Transportation Processing and Pipeline Activities Total Direct Impacts
30,000
119,100149,100
73,900
205,100279,000
72,000
251,100323,100
206,700
268,300475,000
589
125219
187
747
Secondary Impacts 267,900 474,800 588,700 895,100 234 52
Gross Business Volume 417,000 753,800 911,800 1,370,100 229 50
* Nominal 2005, 2007, and 2009 dollars adjusted for inflation using Gross Domestic Product-Implicit Price Deflator and
reflect 2011-equivalent dollars.
Some of the most closely monitored measures of the petroleum industry are estimates ofgovernment revenues. Government revenues attributable to the petroleum industry stem fromcollections of property, sales and use, personal income, and corporate income taxes. Other directrevenue sources include royalties on oil and gas production and lease bonus payments. The largestsingle source of government revenue in the state has been from severance taxes. Overall, not allsources of government revenues changed in equal proportion over the period; however,collectively governmental revenues from the petroleum industry increased by $2.25 billion or 596percent in real terms over the period (Table 17). The largest single increase ($1.1 billion) comesfrom changes in the collection of severance taxes which went from $172 million in 2005 to $1.3billion in 2011.
Department of Agribusiness & Applied Economics 50
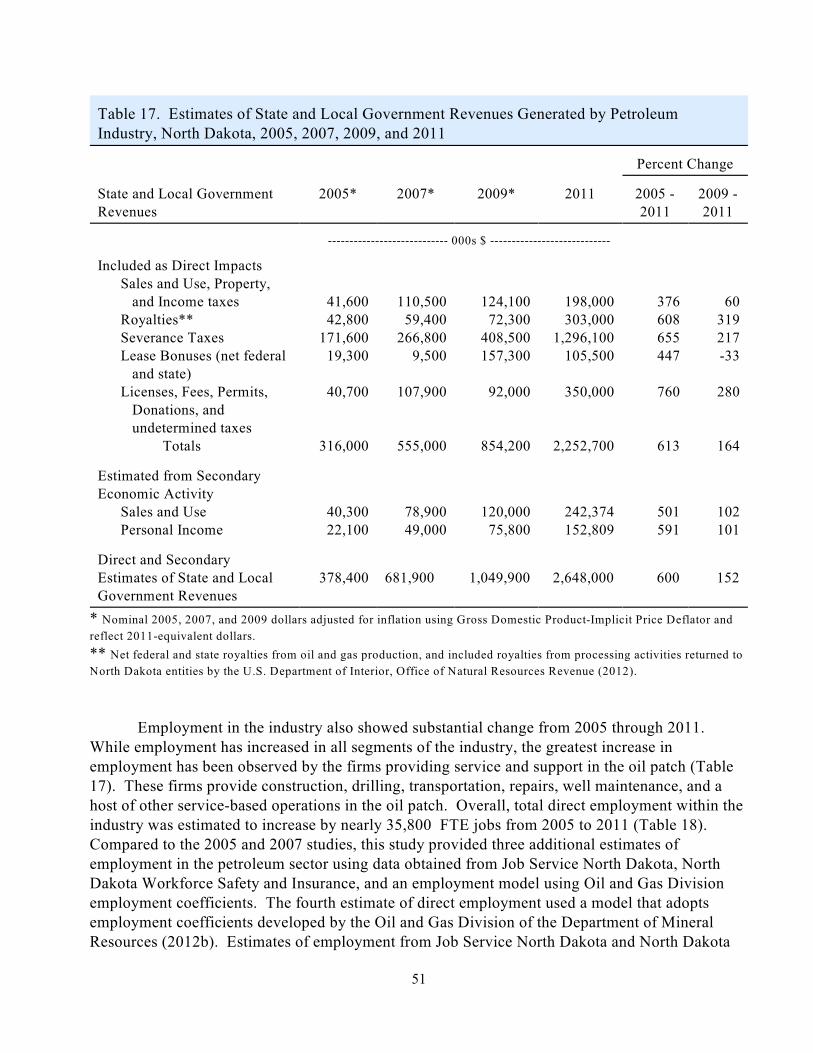
Table 17. Estimates of State and Local Government Revenues Generated by PetroleumIndustry, North Dakota, 2005, 2007, 2009, and 2011
Percent Change
State and Local GovernmentRevenues
2005* 2007* 2009* 2011 2005 -2011
2009 -2011
---------------------------- 000s $ ----------------------------
Included as Direct Impacts Sales and Use, Property, and Income taxes Royalties** Severance Taxes Lease Bonuses (net federal and state) Licenses, Fees, Permits, Donations, and undetermined taxes Totals
41,60042,800
171,60019,300
40,700
316,000
110,50059,400
266,8009,500
107,900
555,000
124,10072,300
408,500157,300
92,000
854,200
198,000303,000
1,296,100105,500
350,000
2,252,700
376608655447
760
613
60319217-33
280
164
Estimated from SecondaryEconomic Activity Sales and Use Personal Income
40,30022,100
78,90049,000
120,00075,800
242,374152,809
501591
102101
Direct and SecondaryEstimates of State and LocalGovernment Revenues
378,400 681,900 1,049,900 2,648,000 600 152
* Nominal 2005, 2007, and 2009 dollars adjusted for inflation using Gross Domestic Product-Implicit Price Deflator and
reflect 2011-equivalent dollars.
** Net federal and state royalties from oil and gas production, and included royalties from processing activities returned to
North Dakota entities by the U.S. Department of Interior, Office of Natural Resources Revenue (2012).
Employment in the industry also showed substantial change from 2005 through 2011. While employment has increased in all segments of the industry, the greatest increase inemployment has been observed by the firms providing service and support in the oil patch (Table17). These firms provide construction, drilling, transportation, repairs, well maintenance, and ahost of other service-based operations in the oil patch. Overall, total direct employment within theindustry was estimated to increase by nearly 35,800 FTE jobs from 2005 to 2011 (Table 18). Compared to the 2005 and 2007 studies, this study provided three additional estimates ofemployment in the petroleum sector using data obtained from Job Service North Dakota, NorthDakota Workforce Safety and Insurance, and an employment model using Oil and Gas Divisionemployment coefficients. The fourth estimate of direct employment used a model that adoptsemployment coefficients developed by the Oil and Gas Division of the Department of MineralResources (2012b). Estimates of employment from Job Service North Dakota and North Dakota
51
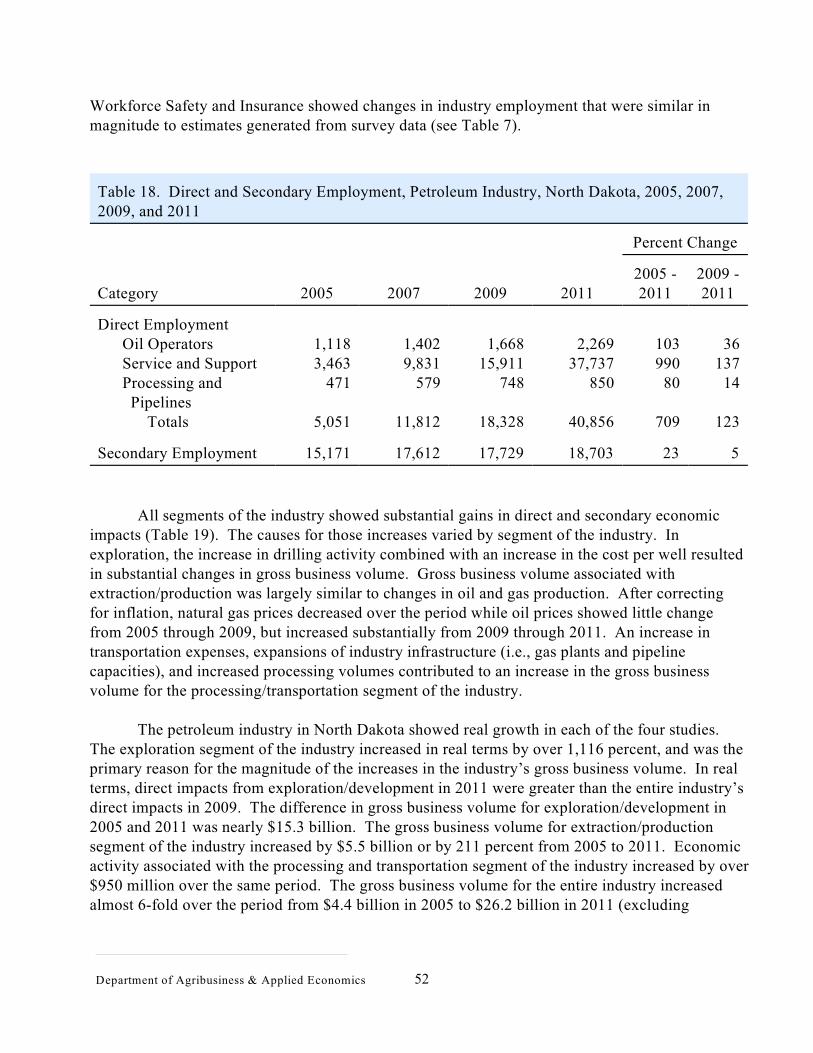
Workforce Safety and Insurance showed changes in industry employment that were similar inmagnitude to estimates generated from survey data (see Table 7).
Table 18. Direct and Secondary Employment, Petroleum Industry, North Dakota, 2005, 2007,2009, and 2011
Percent Change
Category 2005 2007 2009 20112005 -2011
2009 -2011
Direct Employment Oil Operators Service and Support Processing and Pipelines Totals
1,1183,463
471
5,051
1,4029,831
579
11,812
1,66815,911
748
18,328
2,26937,737
850
40,856
103990
80
709
36137
14
123
Secondary Employment 15,171 17,612 17,729 18,703 23 5
All segments of the industry showed substantial gains in direct and secondary economicimpacts (Table 19). The causes for those increases varied by segment of the industry. Inexploration, the increase in drilling activity combined with an increase in the cost per well resultedin substantial changes in gross business volume. Gross business volume associated withextraction/production was largely similar to changes in oil and gas production. After correctingfor inflation, natural gas prices decreased over the period while oil prices showed little changefrom 2005 through 2009, but increased substantially from 2009 through 2011. An increase intransportation expenses, expansions of industry infrastructure (i.e., gas plants and pipelinecapacities), and increased processing volumes contributed to an increase in the gross businessvolume for the processing/transportation segment of the industry.
The petroleum industry in North Dakota showed real growth in each of the four studies. The exploration segment of the industry increased in real terms by over 1,116 percent, and was theprimary reason for the magnitude of the increases in the industry’s gross business volume. In realterms, direct impacts from exploration/development in 2011 were greater than the entire industry’sdirect impacts in 2009. The difference in gross business volume for exploration/development in2005 and 2011 was nearly $15.3 billion. The gross business volume for extraction/productionsegment of the industry increased by $5.5 billion or by 211 percent from 2005 to 2011. Economicactivity associated with the processing and transportation segment of the industry increased by over$950 million over the same period. The gross business volume for the entire industry increasedalmost 6-fold over the period from $4.4 billion in 2005 to $26.2 billion in 2011 (excluding
Department of Agribusiness & Applied Economics 52
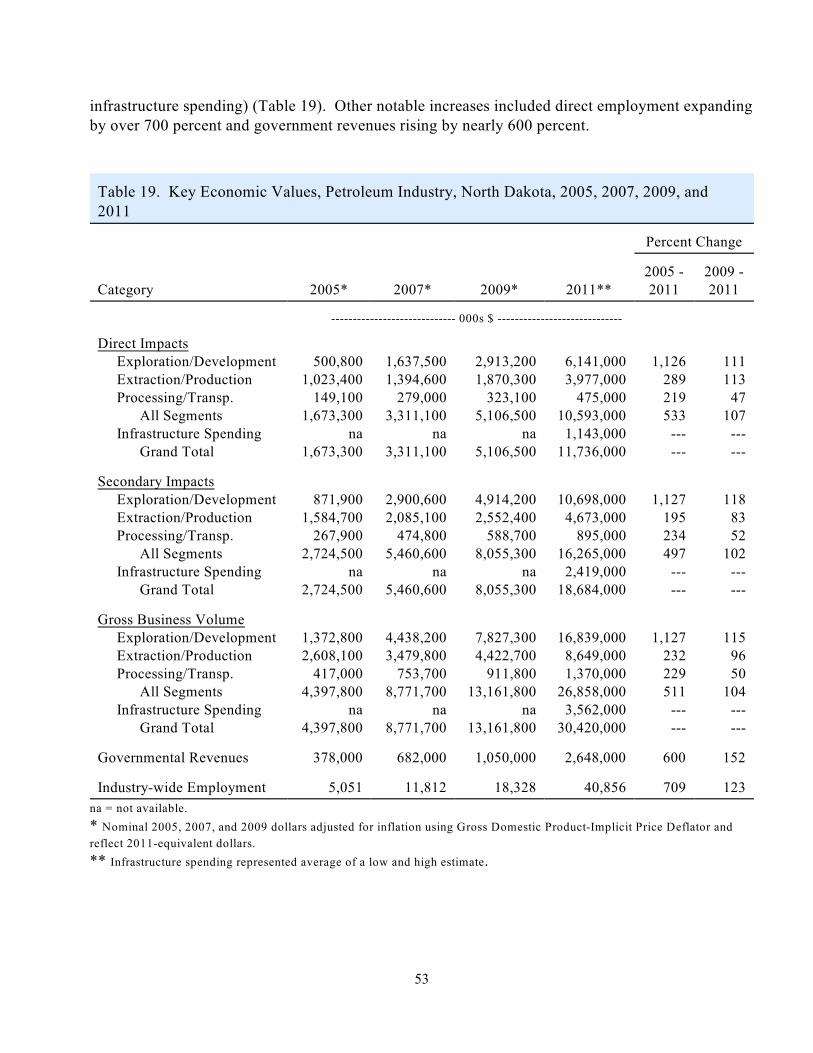
infrastructure spending) (Table 19). Other notable increases included direct employment expandingby over 700 percent and government revenues rising by nearly 600 percent.
Table 19. Key Economic Values, Petroleum Industry, North Dakota, 2005, 2007, 2009, and2011
Percent Change
Category 2005* 2007* 2009* 2011**2005 -2011
2009 -2011
----------------------------- 000s $ -----------------------------
Direct Impacts Exploration/Development Extraction/Production Processing/Transp. All Segments Infrastructure Spending Grand Total
500,8001,023,400
149,1001,673,300
na1,673,300
1,637,5001,394,600
279,0003,311,100
na3,311,100
2,913,2001,870,300
323,1005,106,500
na5,106,500
6,141,0003,977,000
475,00010,593,000
1,143,00011,736,000
1,126289219533
------
111113
47107
------
Secondary Impacts Exploration/Development Extraction/Production Processing/Transp. All Segments Infrastructure Spending Grand Total
871,9001,584,700
267,9002,724,500
na2,724,500
2,900,6002,085,100
474,8005,460,600
na5,460,600
4,914,2002,552,400
588,7008,055,300
na8,055,300
10,698,0004,673,000
895,00016,265,000
2,419,00018,684,000
1,127195234497
------
1188352
102------
Gross Business Volume Exploration/Development Extraction/Production Processing/Transp. All Segments Infrastructure Spending Grand Total
1,372,8002,608,100
417,0004,397,800
na4,397,800
4,438,2003,479,800
753,7008,771,700
na8,771,700
7,827,3004,422,700
911,80013,161,800
na13,161,800
16,839,0008,649,0001,370,000
26,858,0003,562,000
30,420,000
1,127232229511
------
1159650
104------
Governmental Revenues 378,000 682,000 1,050,000 2,648,000 600 152
Industry-wide Employment 5,051 11,812 18,328 40,856 709 123
na = not available.
* Nominal 2005, 2007, and 2009 dollars adjusted for inflation using Gross Domestic Product-Implicit Price Deflator and
reflect 2011-equivalent dollars.
** Infrastructure spending represented average of a low and high estimate.
53
SUMMARY
The purpose of this study was to estimate the economic contribution of the petroleumindustry in North Dakota in 2011. The petroleum industry was defined to includeexploration/development, extraction/production, transportation, and processing of crude oil andnatural gas. Also included in this study was an assessment of capital expenditures for infrastructureprojects. Exploration was defined to include, but not limited to, seismic testing, geologicalresearch, lease expenses, other environmental research, land survey work, excavation, roadbuilding, construction of drill site, construction and delivery of electricity, pipeline development,and all other activities associated with drilling and completing oil and/or gas wells. Extraction/production was defined to include, but not limited to, all activities associated with theremoval of crude oil and natural gas from the ground, and maintenance and periodic inspections ofequipment used to extract oil and gas, and other production related activities, such as well workovers, well idling, shutdown, and abandonment activities. Transportation was limited to themovement of oil and gas from wells to collection points, and then onto processing facilities locatedeither in-state or out-of-state. Petroleum processing in North Dakota included refining of crude oiland natural gas processing.
Due to the complexities of how the oil and gas industry is structured, and that in-state effects(i.e., first round spending or direct impacts) from the petroleum industry in any given year may notequal the market value of oil and gas production, an expenditure-based approach to measuring theeconomic size of the petroleum industry was used in this study. In this approach, only money spentin North Dakota by companies involved in the petroleum sector was included in the study andrepresented the direct impacts of the industry. In addition to in-state expenditures forexploration/development, extraction/production, transportation, and processing activities, privateand public royalties, lease bonuses, and severance taxes also were included as direct impacts. Secondary economic impacts result from the spending and respending of the direct impacts andwere estimated using the North Dakota Input-Output Model.
Three separate surveys were used to collect production, expenditure, and employment datafor the petroleum industry in North Dakota. Firms that own or operate oil wells in the state weresurveyed to obtain information on in-state expenses for oil and gas exploration, oil and gasextraction/production, general business expenses, expenditures for infrastructure projects,employment, oil and gas production, and drilling activity. A similar survey was conducted forfirms engaged in pipeline transportation of crude oil and unprocessed natural gas and includedfirms involved with processing of crude oil and natural gas in North Dakota. A third survey wasconducted to obtain expenditure patterns and capital outlays for infrastructure projects associatedwith businesses that supply services and inputs to the oil fields. A fourth survey involvedlease/brokerage firms and was used to obtain information on leasing activity in the state.
The survey of oil operators produced financial data on about 32 percent of North Dakota’soil and gas production in 2011. Also, financial data were collected on pipeline transportation, gas
Department of Agribusiness & Applied Economics 54
processing, and crude oil refining. The survey of lease/brokerage firms and data obtained from oiloperators were used to estimate leasing activity on private lands in the state. Secondary data,obtained from government agencies, were combined with survey data to estimate royalties, leasebonuses, and severance taxes. Secondary data also were used in estimating project-based capitalcosts for selected infrastructure projects in the state (e.g., gas plants, pipeline expansions).
Estimates of total in-state expenditures in 2011 for oil and gas exploration/developmentwere derived from the survey of oil operators and used with drilling statistics from the NorthDakota Department of Mineral Resources. A total of 1,271 wells were completed in 2011. Average expense per well for oil operators was estimated at $9.1 million, yielding about $11.6billion in total financial outlays for well development. Financial data on expenses for well drillingand completion were obtained from oil operators, and adjustments to the capital costs to drill andcomplete a well were performed to reflect specific inputs supplied by in-state sources. The neteffect of removing expenses for those capital outlays revealed that about 48 percent of the cost tocomplete a well in North Dakota in 2011 represented economic leakage that was not included in theindustry’s direct economic impacts. The direct impact per well completed in the state wasestimated at $4.5 million. The combination of in-state expenses for exploration and lease bonusesresulted in $6.1 billion in direct impacts in 2011. The secondary economic impacts associated withexploration activities were estimated at $10.7 billion. The in-state gross business volume (directand secondary impacts) of exploration activities was estimated at $16.8 billion in 2011 (Figure 7).
Estimates of oil and gas extraction/production expenses, general business expenses for oiloperators, private and public royalties, and state severance taxes were derived from survey data andsecondary information obtained from various government agencies. The state averaged 5,555active wells per month in 2011 that produced 153 million barrels of oil and over 155 million mcf ofnatural gas. Total direct impacts for oil and gas production were estimated at $4 billion in 2011. Total secondary economic impacts associated with oil and gas production were estimated at $4.7billion. The in-state gross business volume of oil and gas extraction/production was estimated at$8.6 billion in 2011 (Figure 7).
The processing component of the petroleum industry was estimated to have a direct impactin North Dakota of $475 million. Total secondary economic impacts associated with processingand transporting crude oil and natural gas were estimated at $895 million. The in-state grossbusiness volume of processing and transporting crude oil and natural gas was estimated at $1.4million in 2011 (Figure 7).
The petroleum industry was estimated to have spent between $2.5 billion to $2.7 billion oninfrastructure projects in the state in 2011. After adjustments for economic leakage (the portion ofexpenditures not captured in the North Dakota economy), it was estimated that about $1.1 billion to$1.2 billion were captured in the North Dakota economy. The gross business volume associatedwith infrastructure spending in North Dakota was estimated to range from $3.4 to $3.7 billion in2011. Infrastructure spending, as defined in this report, would represent additional economicactivity beyond that created by the exploration, production, transportation, and processing segmentsof the industry.
55
Industry-wide direct impacts from the petroleum industry were estimated at $10.6 billion in2011 (not including infrastructure spending). Total secondary economic impacts associated withthe industry were estimated at $16.3 billion. The gross business volume for the petroleum industryin North Dakota in 2011 was estimated at $26.9 billion (Figure 7). When including in-stateexpenditures for infrastructure projects, the petroleum industry was estimated to have $11.7 billion,$18.7 billion, and $30.4 billion in direct impacts, secondary impacts, and gross business volume,respectively.
Additional measures of the petroleum industry’s economic importance to the state includedirect employment for 40,800 full-time jobs, economy-wide personal income of $11 billion,statewide retail sales of $7.2 billion, direct contributions to local and state government revenues of$2.25 billion, indirect contribution of $395 million in state government tax collections, andsecondary employment of 18,703 full-time equivalent jobs. For every dollar spent in the state bythe petroleum industry, another $1.59 in additional business activity was generated.
A number of comparisons to information collected and estimated for 2005, 2007, and 2009was made to similar figures for 2011. While energy prices were not directly used in the study togenerate estimates of industry activity, prices directly influence some measures of industry output,such as tax collections and royalties. Oil prices increased from 2005 to 2007 in real terms by 26percent to around $65 per barrel, but decreased to 2005 levels in 2009. Prices in 2009 remainedwell below the extreme price spikes observed in 2008; however, prices in 2011 increased aboveannual values for 2005, 2007, and 2009. Gas prices, both in nominal and real terms, decreased by58 percent from 2005 to 2011. Oil production increased from 35 million barrels to 153 millionbarrels over the period. Gas production jumped from around 58 million mcf in 2005 to over 155million mcf in 2011. In addition to increases in oil and gas production, exploration/developmentactivities continued to increase as the number of wells completed in the state went from 240 in 2005to 1,271 in 2011.
Department of Agribusiness & Applied Economics 56
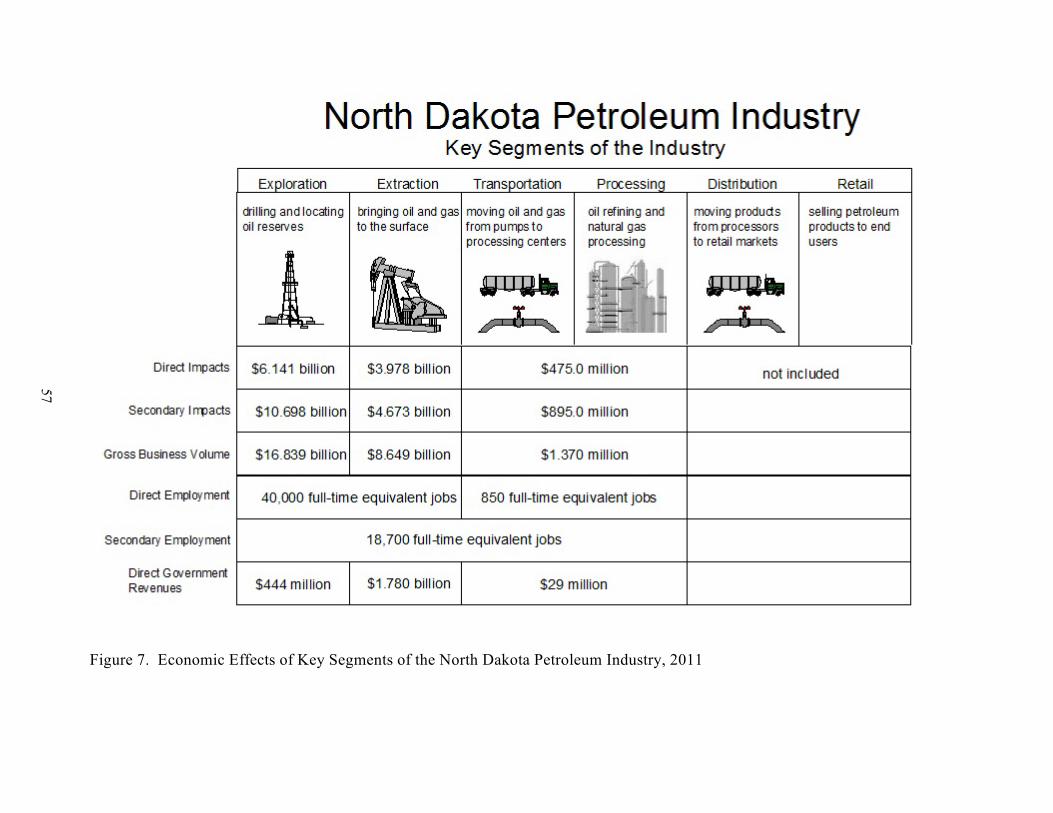
Figure 7. Economic Effects of Key Segments of the North Dakota Petroleum Industry, 2011
57
All segments of the industry showed substantial gains in direct and secondary economicimpacts over the period. In exploration, the increase in drilling activity combined with an increasein the cost per well resulted in substantial changes in gross business volume. Changes in grossbusiness volume associated with extraction/production were largely similar to changes in oil andgas production. An increase in transportation expenses, expansions of industry infrastructure (i.e.,gas plants and pipeline capacities), and increased processing volumes all contributed to an increasein the gross business volume for the processing/transportation segment of the industry.
The exploration segment of the industry increased in real terms by over 1,127 percent from2005 to 2011, and had the greatest effect on the growth in the overall gross business volume for theentire industry. In real terms, direct impacts from exploration/development in 2011 exceeded theentire industry’s direct impacts in 2009. The difference in gross business volume forexploration/development from 2005 to 2011 was nearly $15.5 billion. The gross business volumefor extraction/production segment of the industry increased by $6 billion or by 232 percent. Economic activity associated with the processing and transportation segment of the industryincreased by $953 million over the period. The gross business volume for the entire industryincreased by nearly 511 percent in real terms over the period from $4.2 billion in 2005 to $26.9billion in 2011 (Table 16). Other notable increases included direct employment expanding by 700percent and government revenues rising by 600 percent.
The petroleum industry was estimated to have spent between $2.5 billion to $2.7 billion oninfrastructure projects in the state in 2011. After adjustments for economic leakage (the portion ofexpenditures not captured in the North Dakota economy), it was estimated that about $1.1 billion to$1.2 billion were captured in the North Dakota economy. Combining exploration, production,transportation, processing, and infrastructure spending revealed the petroleum sector had a $30.4billion gross business volume in the state in 2011.
Department of Agribusiness & Applied Economics 58
CONCLUSIONS
Changes in energy prices, drilling activity, and oil and gas production in North Dakota havemade the petroleum industry the one of largest single basic-sector industries in the state. Comparisons of the industry’s economic importance in 2011 with previous estimates from 2005,2007, and 2009 reveal the industry has increased 6-fold (495 percent) in economic size in six years(i.e., 2005 to 2011). While some of that increase can be directly attributable to an increase in thenumber of producing wells, which has led to increased oil and gas production, the primary reasonfor the substantial increase has been due to expenditures for oil drilling and well completionactivities.
The economic contribution of the petroleum industry was measured based on factors presentin the industry in 2011. As such, the figures presented in this report represent a snapshot in time,and will not necessarily reflect the future economic impact of the industry. The economicimportance of the industry will increase and decrease with changes in a host of factors that affectpetroleum exploration, extraction/production, and processing levels. The fact that the economicimportance of the industry is subject to change was readily apparent when comparisons were madebetween economic output in 2005, 2007, 2009, and 2011. The gross business volume associatedwith exploration increased by over 1,100 percent in real terms over the period. A combination of asubstantial increase in the number of oil wells drilled and increases in the cost per well completedwere the reasons for the change. Other comparisons between 2005, 2007, 2009, and 2011 revealthat changes in impacts from oil and gas extraction/production more closely mirrored changes inoutput, while increases in economic activity associated with the processing sector of the industrywere tied to both increases in state oil and gas production, but also to expanded capacity of theindustry’s infrastructure, and increased transportation activity.
The industry was estimated to have capital expenditures for infrastructure-related projects inthe state ranging from $2.5 to $2.7 billion in 2011. The industry is expanding infrastructure to meetthe current and future anticipated needs associated with increased crude oil and natural gasproduction, well counts, and workforce. Considering that this study only examined one year ofcapital expenditures for petroleum-sector infrastructure, the level of investment by the industry toexpand capabilities in the Williston Basin reinforces the expected future value of developing theBakken and Three Forks Formations.
Few other basic-sector industries in North Dakota, outside of various agricultural industriesand the lignite industry, have had similar comprehensive assessments of their economic importance. The figures reported in this study are substantial, and comparisons to other basic-sector industriesmay be helpful in placing results from this study in context. The wheat industry and the coalindustry are two examples of large basic-sector industries that have had economic assessmentsperformed to measure their economic contribution to North Dakota’s economy. From 2001 through2003, the production, transportation, handling, and processing of wheat in North Dakota was
59
estimated to produce a gross business volume of $4.4 billion (in 2011 dollars) annually. In 2011,the coal industry in North Dakota was estimated to generate over $2.9 billion in gross businessvolume (Coon et al. 2012b). Estimates of the gross business volume, in real terms, for thepetroleum industry were $4.4 billion in 2005, nearly $8.8 billion in 2007, $13.2 billion in 2009, and$30.4 billion in 2011 (including infrastructure impacts). Direct employment figures for the wheatindustry would not be comparable to those in this study; however, direct employment in the coalindustry was estimated at 4,087 FTE positions, compared to around 40,800 FTE jobs in thepetroleum industry in 2011.
Several studies were released in 2012 that identified potential long-term growth in wellcounts and oil and gas production in North Dakota (Bentek Energy 2012, North Dakota Departmentof Mineral Resources 2012c, KLJ 2012 [see Bangsund and Hodur {2013} for projections from theKLJ study]). All of these independent assessments, while not necessarily agreeing on the exactpath or future size of the industry, confirm expectations that the petroleum sector in North Dakotawill continue to grow over the next two decades, and will be considerably larger (i.e., well counts,oil and gas output) in the future. This study demonstrates the economic benefits of expanding oilproduction in the state, and the economic value that oil and gas development can have on the state’seconomy. Of particular interest from a policy perspective is the potential to capture economicactivity from the anticipated growth in the development of the Bakken/Three Forks Formations. Shale oil development is now occurring in numerous locations in North America and given thatmost oil operators in the state also are active in other shale plays across the continent, the economicopportunity of developing the Bakken/Three Forks Formations in North Dakota should not be takenfor granted. North Dakota has an enormous potential for economic stability in its economy that cancome from the continued development of the oil fields in the state.
Regardless of the economic measure used, currently the petroleum industry is one of thelargest basic-sector industries in North Dakota. Considering that the industry’s direct impacts (i.e.,first round of spending) are concentrated geographically in the western portion of the state, theeconomic health of western North Dakota is perhaps tied more to the petroleum industry than anyother single industry. Yet, despite the strong influence of the petroleum industry in western NorthDakota, the magnitude of the contributions to both the state and local governments and the shearvolume of secondary economic effects in nearly all sectors of the North Dakota economy wouldsuggest that the economic effects of the industry are felt statewide. Current activity levels in thepetroleum industry clearly make it one of the key forces in the North Dakota economy.
Department of Agribusiness & Applied Economics 60
REFERENCES
Bangsund, Dean A. and Nancy M. Hodur. 2013. Williston Basin 2012: Projections of FutureEmployment and Population North Dakota Summary. Agribusiness and Applied EconomicsReport No. 704, Department of Agribusiness and Applied Economics, North Dakota StateUniversity, Fargo.
Bangsund, Dean A. and Nancy M. Hodur. 2012. Modeling Direct and Secondary Employment inthe Petroleum Sector in North Dakota. Agribusiness and Applied Economics Report No.694, Department of Agribusiness and Applied Economics, North Dakota State University,Fargo.
Bangsund, Dean A., Nancy M. Hodur, and F. Larry Leistritz. 2012. Economic Contribution of theSugarbeet Industry in Minnesota and North Dakota. Agribusiness and Applied EconomicsReport No. 688. Department of Agribusiness and Applied Economics, North Dakota StateUniversity, Fargo.
Bangsund, Dean A., Frayne Olson, and F. Larry Leistritz. 2011. Economic Contribution of theSoybean Industry to the North Dakota Economy. Agribusiness and Applied EconomicsReport No. 678. Department of Agribusiness and Applied Economics, North Dakota StateUniversity, Fargo.
Bangsund, Dean A. and F. Larry Leistritz. 2010. Economic Contribution of the PetroleumIndustry to North Dakota. Agribusiness and Applied Economics Report No. 676 & 676-S. Department of Agribusiness and Applied Economics, North Dakota State University, Fargo.
Bangsund, Dean A. and F. Larry Leistritz. 2009. Petroleum Industry’s Economic Contribution toNorth Dakota in 2007. Agribusiness and Applied Economics Report No. 639. Departmentof Agribusiness and Applied Economics, North Dakota State University, Fargo.
Bangsund, Dean A. and F. Larry Leistritz. 2007. Economic Contribution of the PetroleumIndustry to North Dakota. Agribusiness and Applied Economics Report No. 599. Department of Agribusiness and Applied Economics, North Dakota State University, Fargo.
Bangsund, Dean A. and F. Larry Leistritz. 2005. Economic Contribution of the Wheat Industry toNorth Dakota. Agribusiness and Applied Economics Report No. 554. Department ofAgribusiness and Applied Economics, North Dakota State University, Fargo.
Bangsund, Dean A. and F. Larry Leistritz. 2004. Economic Contribution of the Sugarbeet Industryin Minnesota, North Dakota, and Eastern Montana. Agribusiness and Applied EconomicsReport No. 532, Department of Agribusiness and Applied Economics, North Dakota StateUniversity, Fargo.
61
Bangsund, Dean A. and F. Larry Leistritz. 1999. Economic Contribution of the Soybean Industryin North Dakota. Agricultural Economics Report No. 416, Department of AgriculturalEconomics, North Dakota State University, Fargo.
Bangsund, Dean A. and F. Larry Leistritz. 1998. Economic Contribution of the Barley Industry inNorth Dakota, South Dakota, and Minnesota. Agricultural Economics Report No. 391,Department of Agricultural Economics, North Dakota State University, Fargo.
Bangsund, Dean A. and F. Larry Leistritz. 1998. Economic Contribution of the Sugarbeet Industryin North Dakota and Minnesota. Agricultural Economics Report No. 395. Department ofAgricultural Economics, North Dakota State University, Fargo.
Bangsund, Dean A. and F. Larry Leistritz. 1995a. Economic Contribution of the United StatesSunflower Industry. Agricultural Economics Report No. 327, Department of AgriculturalEconomics, North Dakota State University, Fargo.
Bangsund, Dean A. and F. Larry Leistritz. 1995b. Economic Contribution of the Wheat Industry tothe North Dakota Economy. Agricultural Economics Report No. 332, Department ofAgricultural Economics, North Dakota State University, Fargo.
Bentek Energy. 2012. The Williston Basin: Greasing the Gears for Growth in North Dakota. Bentek Energy, Evergreen, CO.
Bureau of Economic Analysis. 2013. Personal Income by Major Sources and Earning by Industry. Table SA05. Http://www.bea.gov. Washington, D.C.: U.S. Department of Commerce.
Coon, Randal C., Dean A. Bangsund, and Nancy M. Hodur. 2013. The Economic Base of NorthDakota in 2011. AAE 13001. Department of Agribusiness and Applied Economics, NorthDakota State University, Fargo.
Coon, Randal C., Nancy M. Hodur, and Dean A. Bangsund. 2012a. Renewable Energy Industries’Contribution to the North Dakota Economy. AAE 702. . Department of Agribusiness andApplied Economics, North Dakota State University, Fargo.
Coon, Randal C., Dean A. Bangsund, and Nancy M. Hodur. 2012b. North Dakota Lignite EnergyIndustry's Contribution to the State Economy for 2011 and Projected for 2012. AAE 12003. Department of Agribusiness and Applied Economics, North Dakota State University, Fargo.
Coon, Randal C., F. Larry Leistritz, Thor A. Hertsgaard, and Arlen G. Leholm. 1985. The NorthDakota Input-Output Model: A Tool for Analyzing Economic Linkages. AgriculturalEconomics Report No. 187, Department of Agricultural Economics, North Dakota StateUniversity, Fargo.
62
Hamm, Rita R., JoAnn M. Thompson, Randal C. Coon, and F. Larry Leistritz. 1993. TheEconomic Impact of North Dakota's Health Care Industry on the State's Economy in 1991. Agricultural Economics Report No. 296, Institute for Business and Industry Developmentand Department of Agricultural Economics, North Dakota State University, Fargo.
Energy Policy Research Foundation, Inc. 2012. Lighting Up the Prairie: EconomicConsiderations in Natural Gas Flaring. Energy Policy Research Foundation, Inc.,Washington, D.C.
Job Service North Dakota. Various years. Quarterly Census of Employment and Wages. http://www.jobsnd.com/ Job Service North Dakota, Bismarck.
KLJ. 2012. Power Forecast 2012: Williston Basin Oil and Gas Related Electrical Load GrowthForecast (PF 12). KLJ, Bismarck, ND.
Leistritz, F. Larry. 1995. Potential Local Socio-economic Impacts of Proposed ProGoldProcessing Plant. Agricultural Economics Report No. 328. Department of AgriculturalEconomics, North Dakota State University, Fargo.
Leistritz, F. Larry and Steve H. Murdock. 1981. Socioeconomic Impact of Resource Development: Methods for Assessment. Westview Press, Boulder, Colorado.
North Dakota Department of Mineral Resources. 2012a. Unpublished data on oil and gasproduction, well drilling activity, and energy prices. Oil and Gas Division, Department ofMineral Resources, North Dakota Industrial Commission, Bismarck.
North Dakota Department of Mineral Resources. 2012b. Unpublished data on 2011 wells placedinto production by first transporter. Oil and Gas Division, North Dakota Department ofMineral Resources, North Dakota Industrial Commission, Bismarck.
North Dakota Department of Mineral Resources. 2012c. Projections of Future Bakken/ThreeForks Development. Oil and Gas Division, North Dakota Department of Mineral Resources,North Dakota Industrial Commission, Bismarck.
North Dakota Office of State Tax Commissioner. 2012a. Unpublished data on state collections ofgross production tax and extraction tax. North Dakota Office of State Tax Commissioner,Bismarck, ND.
North Dakota Office of State Tax Commissioner. 2012b. Unpublished data on average monthlycrude oil prices received in North Dakota. North Dakota Office of State Tax Commissioner,Bismarck, ND.
63
North Dakota Office of State Treasurer. 2012. Tax distribution data. http://web.apps.state.nd.us/stn/inquiry/SearchSelection.aspx. North Dakota Office of StateTreasurer, Bismarck, ND.
North Dakota Pipeline Authority. 2012. Unpublished data on petroleum industry infrastructure inNorth Dakota. North Dakota Pipeline Authority, North Dakota Industrial Commission,Bismarck.
North Dakota Public Service Commission. 2012. Online data on Energy Conversion andTransmission Facility siting. http://www.psc.nd.gov/index.php (accessed December 2012). North Dakota Public Service Commission, Bismarck.
North Dakota State Land Department. 2012. Oil and gas lease statistics. http://www.land.state.nd.us/ Minerals Management Division, North Dakota State LandDepartment, Bismarck, ND.
North Dakota Workforce Safety and Insurance. 2012. Unpublished data on employee counts forselected employment classifications. North Dakota Workforce Safety and Insurance,Bismarck.
Office of Natural Resource Revenue. 2012. Mineral revenue collections and distributions. http://www.onrr.gov/ONRRWebStats/Home.aspx Office of Natural Resource Revenue, U.S.Department of the Interior, Denver, CO.
Rocky Mountain Oil Journal. 2012. 2011 North Dakota State Oil and Gas Production byOperator. Rocky Mountain Oil Journal, Denver, Co.
U.S. Department of Commerce. 2012. Implicit Price Deflators for Gross Domestic Producthttp://www.bea.gov/national/nipaweb/TableView.asp?SelectedTable=13&Freq=Qtr&FirstYear=2006&LastYear=2008 Bureau of Economic Analysis, U.S. Department of Commerce,Washington, D.C.
U.S. Department of Energy. 2012. http://www.eia.doe.gov/ Energy Information Administration,U.S. Department of Energy, Washington, D.C.
U.S. Forest Service. 2012. Unpublished data. U.S. Forest Service, U.S. Department ofAgriculture, Bismarck, ND.
64
APPENDIX A
Questionnaire, Oil Operators,North Dakota, 2011
Instructions and Guidelines for Filling Out the Questionnaire
Data provided from this survey will be used to help estimate the economiccontribution of the oil industry to the North Dakota economy. The goal is to determine howmuch money the oil industry spends in North Dakota. All expenditure data will besynthesized in a manner that only industry-wide totals will be reported. In no way will anyinformation presented in the study identify or be reflective of any single firm or operation.
The following is a list of general guidelines for the questionnaire.
1. Use information from 2011 or your most recently completed fiscal year.
2. Expenditures should be expressed in U.S. dollars.
3. If the actual amount of the expenditure is not easily determined or is not readilyknown, please provide an estimate of the expense.
4. For contractor expenditures (Part II of this questionnaire), please include allexpenditures made for services provided in North Dakota, even if the office orheadquarters of the contractor or service provider is not located in North Dakota.
4. For infrastructure expenditures (Part III of the questionnaire), include costsassociated with the various categories for 2011.
5. For general expenditures for day-to-day operations (Part IV of the questionnaire),include only how much your company paid out to entities in North Dakota.
6. If you cannot identify whether an expenditure was made in North Dakota or inanother state, indicate this on the form.
7. Definitions for some expenditure items and their corresponding StandardIndustrial Classification (SIC) code listing are included to help in determiningallocation of expenditures.
6. Please complete the survey by July 27 and mail the questionnaire in the returnth
envelope.
7. If you have questions, please contact:
Dean Bangsund
701-231-7471
Email: [email protected]
or
Dr. Nancy Hodur
701-231-7357
Email: [email protected]
Department of Agribusiness and Applied Economics
North Dakota State University
Fargo, ND 58105-5636
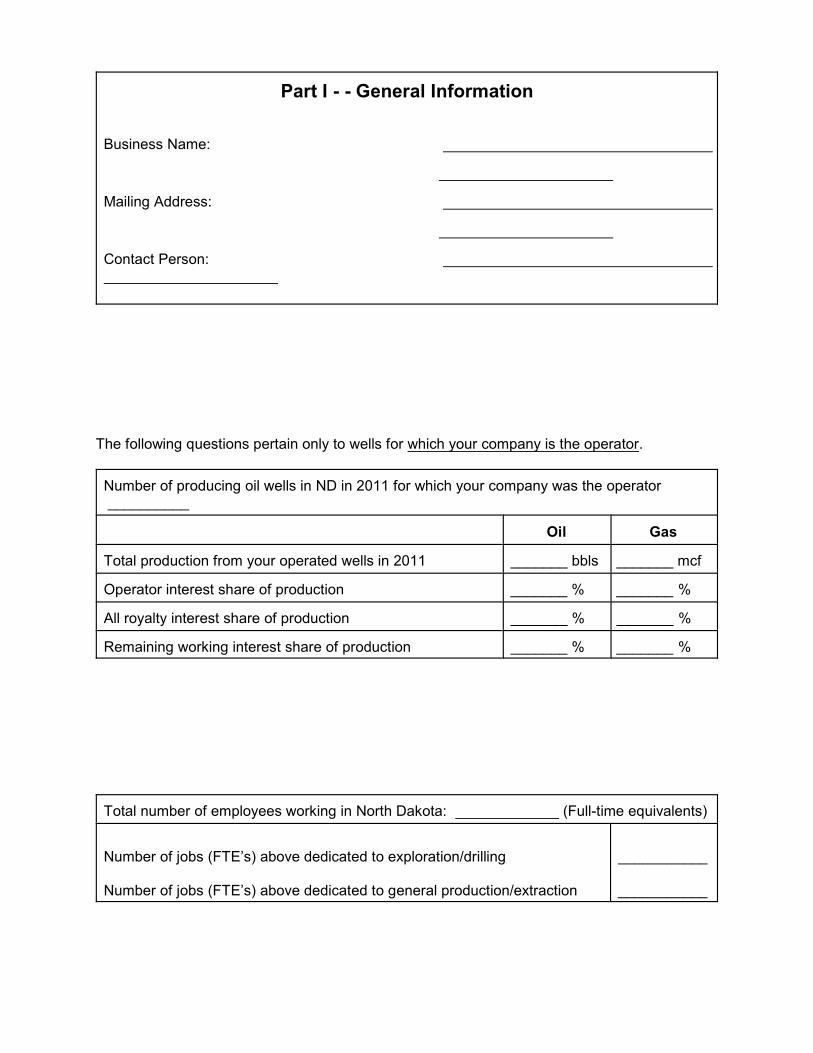
Part I - - General Information
Business Name:
Mailing Address:
Contact Person:
The following questions pertain only to wells for which your company is the operator.
Number of producing oil wells in ND in 2011 for which your company was the operator __________
Oil Gas
Total production from your operated wells in 2011 _______ bbls _______ mcf
Operator interest share of production _______ % _______ %
All royalty interest share of production _______ % _______ %
Remaining working interest share of production _______ % _______ %
Total number of employees working in North Dakota: (Full-time equivalents)
Number of jobs (FTE’s) above dedicated to exploration/drilling
Number of jobs (FTE’s) above dedicated to general production/extraction
___________
___________
Part II. Payments made to Contractors, Sub-contractors, andConsultants
The following instructions pertain to Part II of the Questionnaire.
1) Only report contracted expenses for wells in North Dakota forwhich your company serves as the operator even if yourcompany’s stake in those wells is small. Do not includeexpenses for wells for which your company only has aworking interest share–those expenses will be reported byother oil operators.
2) Please include the total cost for the contracted service forthose wells. The total cost will include your company’s shareof the costs as well as the costs billed to the working interest holders on the well.
3) Please indicate expenses for producing wells, wells currentlybeing drilled, and wells that were drilled, but never used.
4) Only include contracted expenses for the last year.
5) Please include all expenditures made for services provided inNorth Dakota, even if the office or headquarters of thecontractor or service provider is not located in North Dakota.
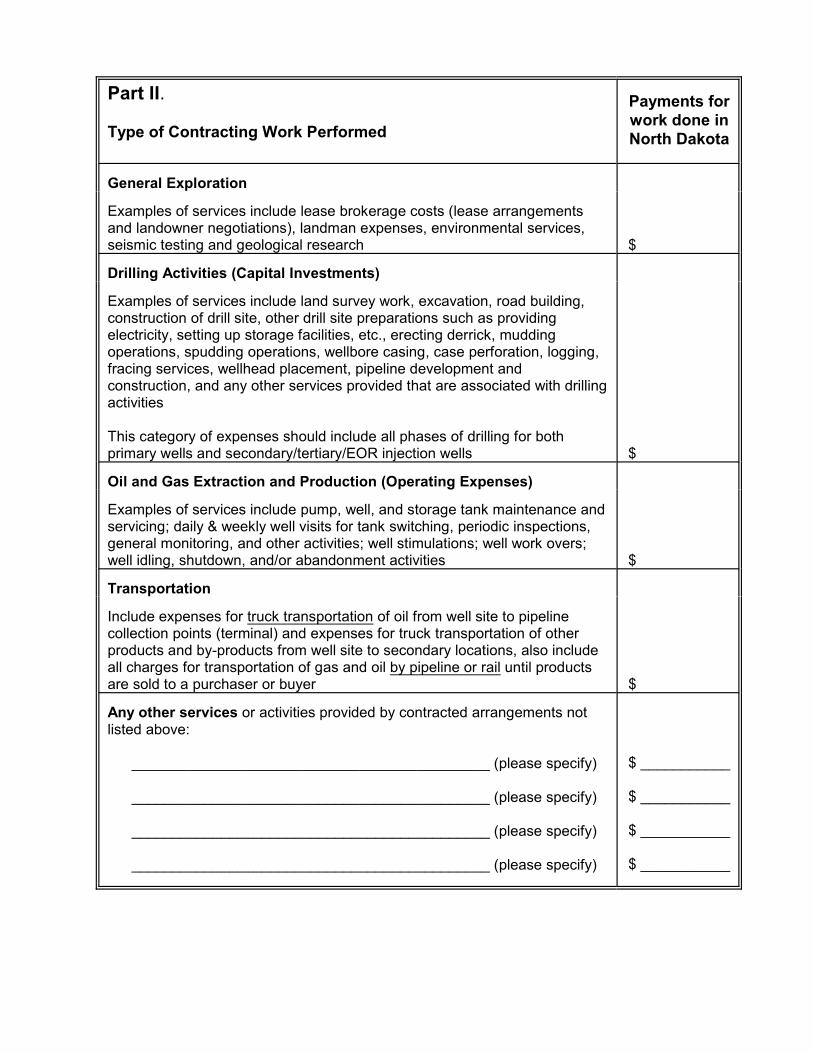
Part II.
Type of Contracting Work Performed
Payments forwork done inNorth Dakota
General Exploration
Examples of services include lease brokerage costs (lease arrangementsand landowner negotiations), landman expenses, environmental services,seismic testing and geological research $
Drilling Activities (Capital Investments)
Examples of services include land survey work, excavation, road building,construction of drill site, other drill site preparations such as providingelectricity, setting up storage facilities, etc., erecting derrick, muddingoperations, spudding operations, wellbore casing, case perforation, logging,fracing services, wellhead placement, pipeline development andconstruction, and any other services provided that are associated with drillingactivities
This category of expenses should include all phases of drilling for bothprimary wells and secondary/tertiary/EOR injection wells $
Oil and Gas Extraction and Production (Operating Expenses)
Examples of services include pump, well, and storage tank maintenance andservicing; daily & weekly well visits for tank switching, periodic inspections,general monitoring, and other activities; well stimulations; well work overs;well idling, shutdown, and/or abandonment activities $
Transportation
Include expenses for truck transportation of oil from well site to pipelinecollection points (terminal) and expenses for truck transportation of otherproducts and by-products from well site to secondary locations, also includeall charges for transportation of gas and oil by pipeline or rail until productsare sold to a purchaser or buyer $
Any other services or activities provided by contracted arrangements notlisted above:
____________________________________________ (please specify)
____________________________________________ (please specify)
____________________________________________ (please specify)
____________________________________________ (please specify)
$ ___________
$ ___________
$ ___________
$ ___________
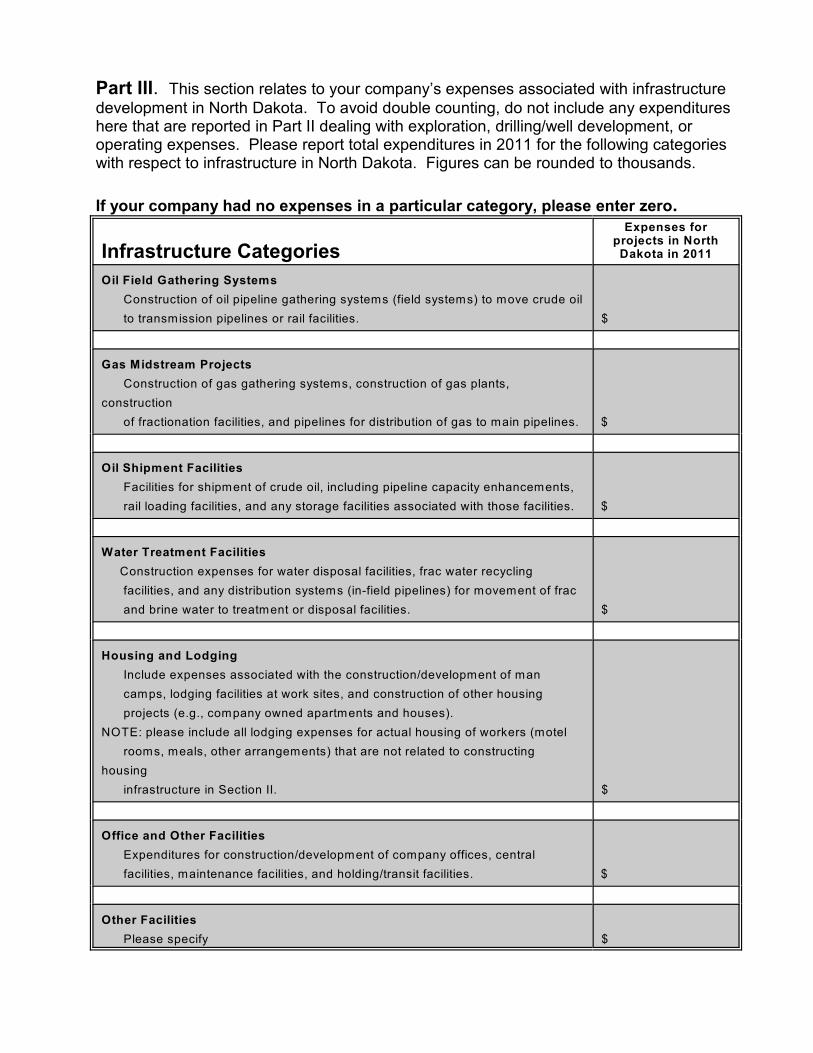
Part III. This section relates to your company’s expenses associated with infrastructuredevelopment in North Dakota. To avoid double counting, do not include any expenditureshere that are reported in Part II dealing with exploration, drilling/well development, oroperating expenses. Please report total expenditures in 2011 for the following categorieswith respect to infrastructure in North Dakota. Figures can be rounded to thousands.
If your company had no expenses in a particular category, please enter zero.
Infrastructure Categories
Expenses forprojects in North
Dakota in 2011
Oil Field Gathering Systems
Construction of oil pipeline gathering systems (field systems) to move crude oil
to transmission pipelines or rail facilities. $
Gas Midstream Projects
Construction of gas gathering systems, construction of gas plants,
construction
of fractionation facilities, and pipelines for distribution of gas to main pipelines. $
Oil Shipment Facilities
Facilities for shipment of crude oil, including pipeline capacity enhancements,
rail loading facilities, and any storage facilities associated with those facilities. $
Water Treatment Facilities
Construction expenses for water disposal facilities, frac water recycling
facilities, and any distribution systems (in-field pipelines) for movement of frac
and brine water to treatment or disposal facilities. $
Housing and Lodging
Include expenses associated with the construction/development of man
camps, lodging facilities at work sites, and construction of other housing
projects (e.g., company owned apartments and houses).
NOTE: please include all lodging expenses for actual housing of workers (motel
rooms, meals, other arrangements) that are not related to constructing
housing
infrastructure in Section II. $
Office and Other Facilities
Expenditures for construction/development of company offices, central
facilities, maintenance facilities, and holding/transit facilities. $
Other Facilities
Please specify $
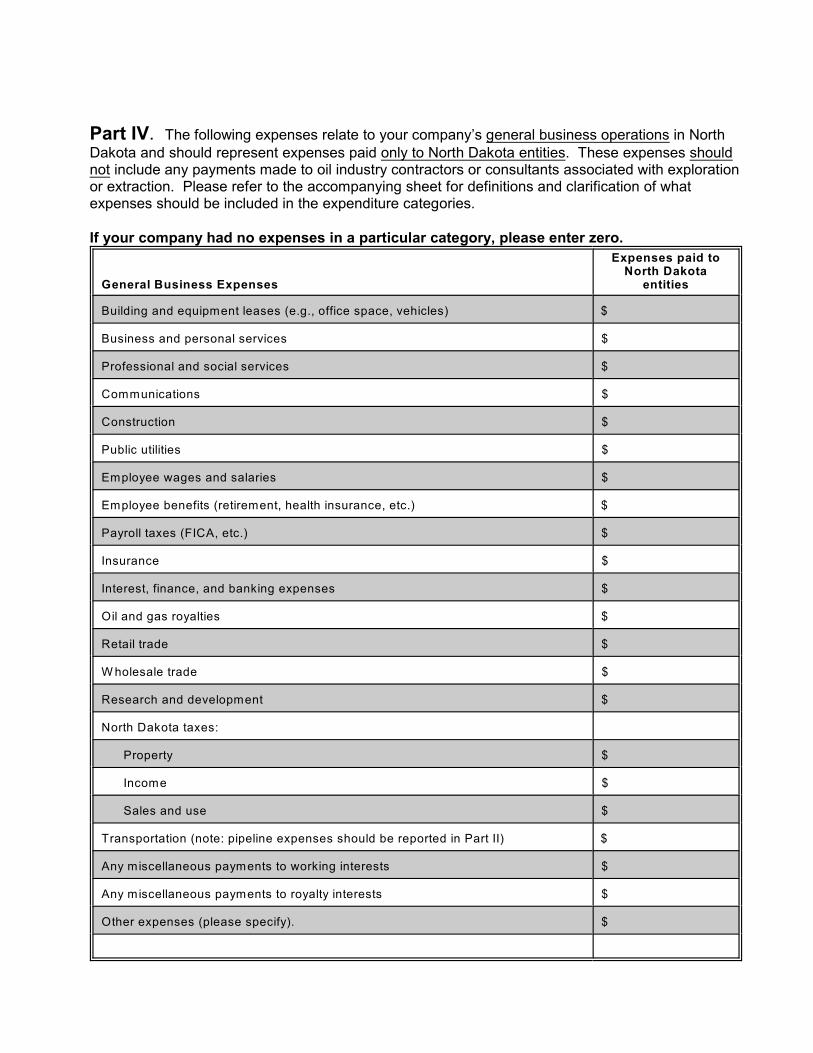
Part IV. The following expenses relate to your company’s general business operations in NorthDakota and should represent expenses paid only to North Dakota entities. These expenses shouldnot include any payments made to oil industry contractors or consultants associated with explorationor extraction. Please refer to the accompanying sheet for definitions and clarification of whatexpenses should be included in the expenditure categories.
If your company had no expenses in a particular category, please enter zero.
General Business Expenses
Expenses paid toNorth Dakota
entities
Building and equipment leases (e.g., office space, vehicles) $
Business and personal services $
Professional and social services $
Communications $
Construction $
Public utilities $
Employee wages and salaries $
Employee benefits (retirement, health insurance, etc.) $
Payroll taxes (FICA, etc.) $
Insurance $
Interest, finance, and banking expenses $
Oil and gas royalties $
Retail trade $
W holesale trade $
Research and development $
North Dakota taxes:
Property $
Income $
Sales and use $
Transportation (note: pipeline expenses should be reported in Part II) $
Any miscellaneous payments to working interests $
Any miscellaneous payments to royalty interests $
Other expenses (please specify). $
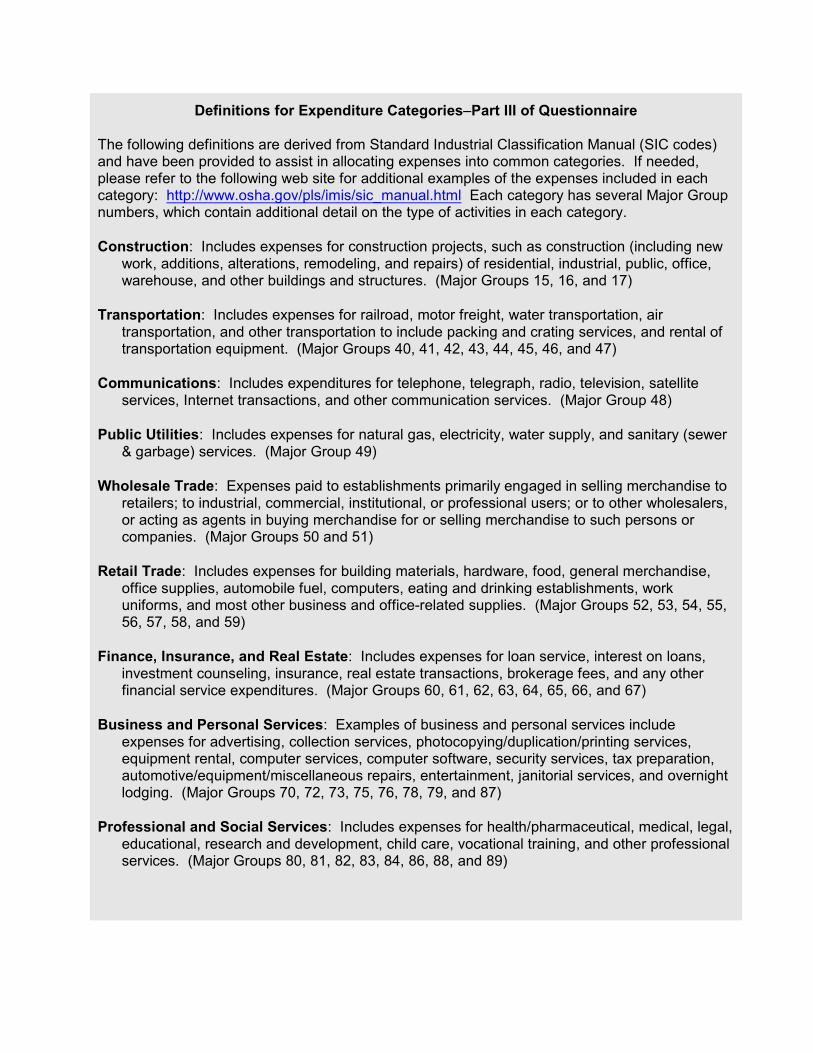
Definitions for Expenditure Categories–Part III of Questionnaire
The following definitions are derived from Standard Industrial Classification Manual (SIC codes)and have been provided to assist in allocating expenses into common categories. If needed,please refer to the following web site for additional examples of the expenses included in eachcategory: http://www.osha.gov/pls/imis/sic_manual.html Each category has several Major Groupnumbers, which contain additional detail on the type of activities in each category.
Construction: Includes expenses for construction projects, such as construction (including newwork, additions, alterations, remodeling, and repairs) of residential, industrial, public, office,warehouse, and other buildings and structures. (Major Groups 15, 16, and 17)
Transportation: Includes expenses for railroad, motor freight, water transportation, airtransportation, and other transportation to include packing and crating services, and rental oftransportation equipment. (Major Groups 40, 41, 42, 43, 44, 45, 46, and 47)
Communications: Includes expenditures for telephone, telegraph, radio, television, satelliteservices, Internet transactions, and other communication services. (Major Group 48)
Public Utilities: Includes expenses for natural gas, electricity, water supply, and sanitary (sewer& garbage) services. (Major Group 49)
Wholesale Trade: Expenses paid to establishments primarily engaged in selling merchandise toretailers; to industrial, commercial, institutional, or professional users; or to other wholesalers,or acting as agents in buying merchandise for or selling merchandise to such persons orcompanies. (Major Groups 50 and 51)
Retail Trade: Includes expenses for building materials, hardware, food, general merchandise,office supplies, automobile fuel, computers, eating and drinking establishments, workuniforms, and most other business and office-related supplies. (Major Groups 52, 53, 54, 55,56, 57, 58, and 59)
Finance, Insurance, and Real Estate: Includes expenses for loan service, interest on loans,investment counseling, insurance, real estate transactions, brokerage fees, and any otherfinancial service expenditures. (Major Groups 60, 61, 62, 63, 64, 65, 66, and 67)
Business and Personal Services: Examples of business and personal services includeexpenses for advertising, collection services, photocopying/duplication/printing services,equipment rental, computer services, computer software, security services, tax preparation,automotive/equipment/miscellaneous repairs, entertainment, janitorial services, and overnightlodging. (Major Groups 70, 72, 73, 75, 76, 78, 79, and 87)
Professional and Social Services: Includes expenses for health/pharmaceutical, medical, legal,educational, research and development, child care, vocational training, and other professionalservices. (Major Groups 80, 81, 82, 83, 84, 86, 88, and 89)
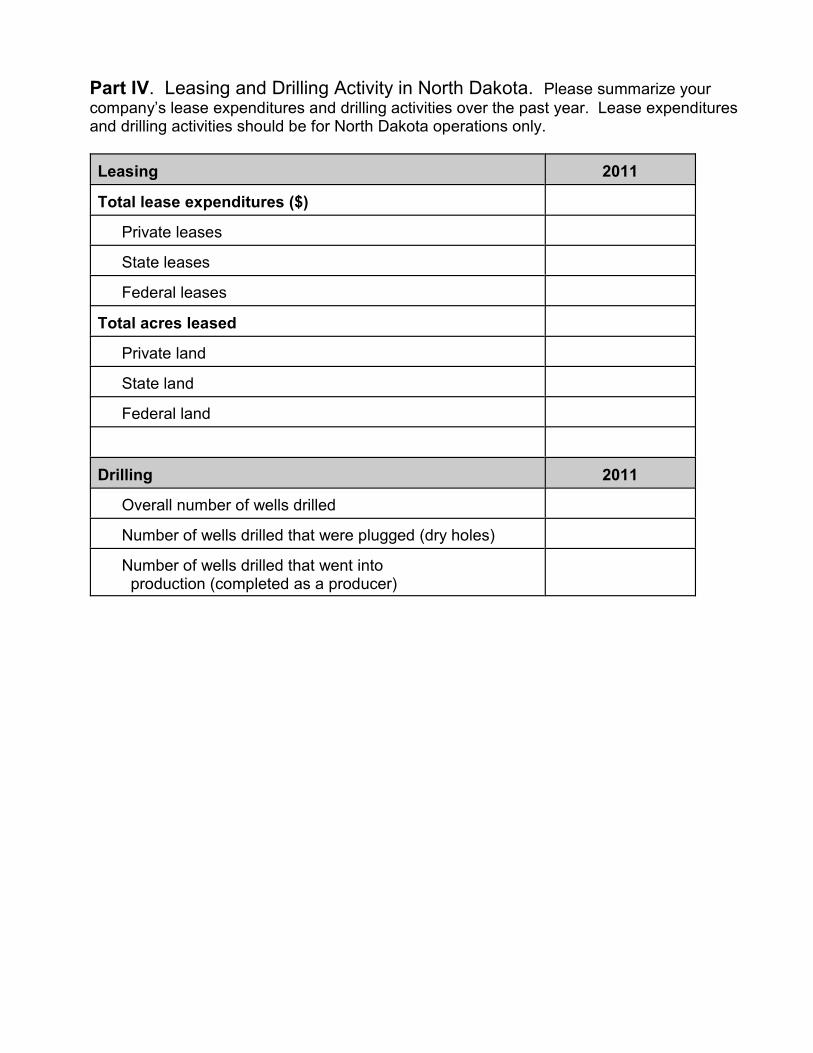
Part IV. Leasing and Drilling Activity in North Dakota. Please summarize yourcompany’s lease expenditures and drilling activities over the past year. Lease expendituresand drilling activities should be for North Dakota operations only.
Leasing 2011
Total lease expenditures ($)
Private leases
State leases
Federal leases
Total acres leased
Private land
State land
Federal land
Drilling 2011
Overall number of wells drilled
Number of wells drilled that were plugged (dry holes)
Number of wells drilled that went into production (completed as a producer)
Part V. List of Contractors/Venders. Please provide the name and mailingaddress of all companies that your firm has contracted with over the last year to performwork in the oil fields in North Dakota. Please include all companies even if they do not havea North Dakota address. If a computer listing is not available, please use the followingspace to provide the information.
Name of Company Address (street, city, state, zip)
Please add sheets or attach printouts as needed.
Thank You for completing this questionnaire!
Please return the questionnaire in the postpaid envelope.
If you would like a copy of the study results mailed to you, make sure you have
provided a mailing address in Part I of the questionnaire. Otherwise, you may
contact Edie Watts in the Department of Agribusiness and Applied Economics at
North Dakota State University for more information on our departmental reports.
Phone (701)231-7441, fax (701)231-7400, email: [email protected] or
visit our departmental listing of research reports on the internet at
http://ageconsearch.umn.edu/
Study results should be available at the end of 2012.
APPENDIX B
Questionnaire, Processors,North Dakota, 2011
Instructions and Guidelines for Filling Out the Questionnaire
Data provided from this survey will be used to help estimate the economic contribution of the oilindustry to the North Dakota economy. The goal is to determine how much money the oil industryspends in North Dakota. All expenditure data will be synthesized in a manner that only industry-widetotals will be reported. In no way will any information presented in the study identify or be reflective ofany single firm or operation.
The following is a list of general guidelines for the questionnaire.
1. Use information from 2011 or your most recently completed fiscal year.
2. Expenditures should be expressed in U.S. dollars.
3. If the actual amount of the expenditure is not easily determined or is not readily known, pleaseprovide an estimate of the expense.
4. Only include expenditures made to businesses, governments, or individuals in North Dakota.
5. If you cannot identify whether an expenditure was made in North Dakota or in another state,indicate this on the form.
6. Definitions for some expenditure items and their corresponding Standard IndustrialClassification (SIC) code listing are included to help in determining allocation of expenditures.
7. We would prefer to have the questionnaire completed and returned by August 28, 2012.
If you have questions, please contact:
Dean Bangsund701-231-7471Email: [email protected]. Nancy Hodur701-231-7357Email: [email protected] of Agribusiness and Applied EconomicsNorth Dakota State UniversityFargo, ND 58105-5636
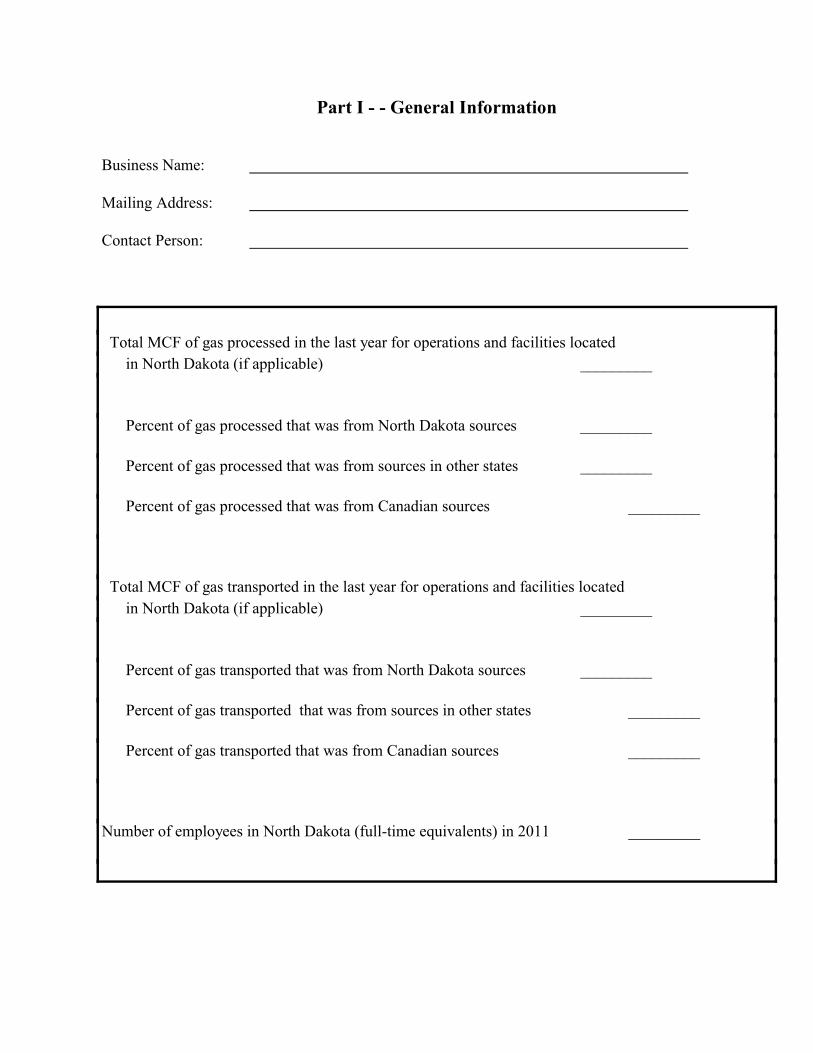
Part I - - General Information
Business Name:
Mailing Address:
Contact Person:
Total MCF of gas processed in the last year for operations and facilities located
in North Dakota (if applicable) _________
Percent of gas processed that was from North Dakota sources _________
Percent of gas processed that was from sources in other states _________
Percent of gas processed that was from Canadian sources _________
Total MCF of gas transported in the last year for operations and facilities located
in North Dakota (if applicable) _________
Percent of gas transported that was from North Dakota sources _________
Percent of gas transported that was from sources in other states _________
Percent of gas transported that was from Canadian sources _________
Number of employees in North Dakota (full-time equivalents) in 2011 _________
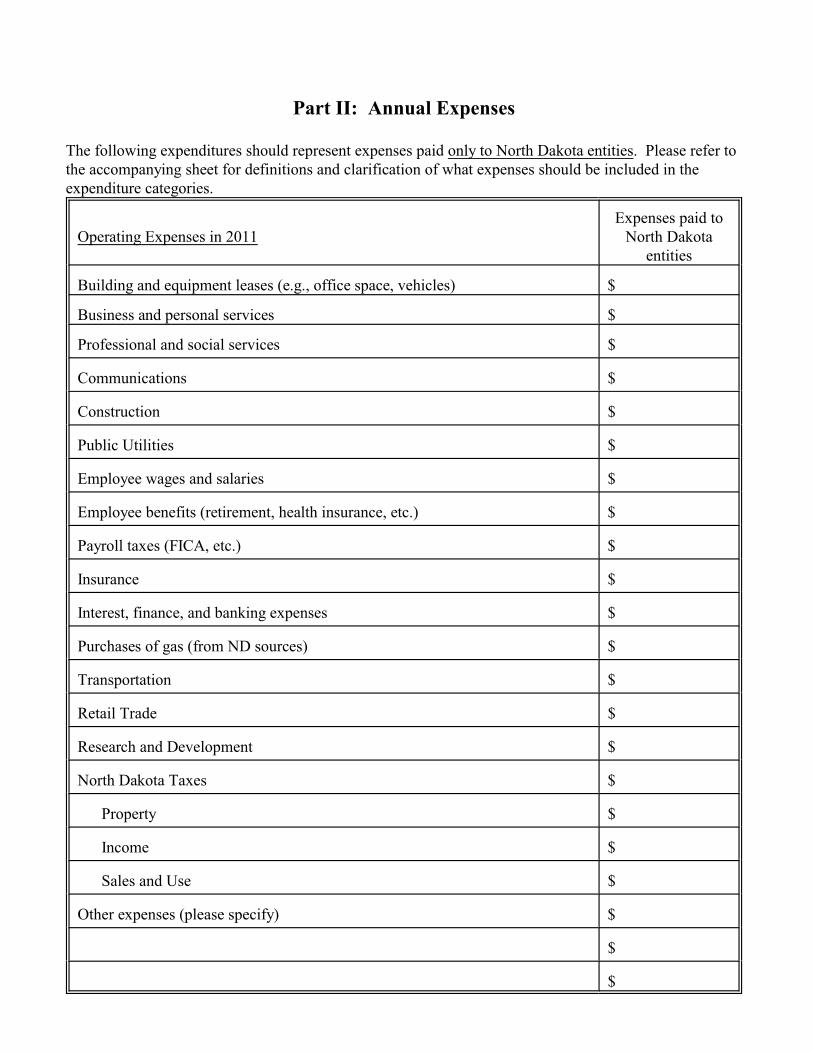
Part II: Annual Expenses
The following expenditures should represent expenses paid only to North Dakota entities. Please refer tothe accompanying sheet for definitions and clarification of what expenses should be included in theexpenditure categories.
Operating Expenses in 2011Expenses paid to
North Dakotaentities
Building and equipment leases (e.g., office space, vehicles) $
Business and personal services $
Professional and social services $
Communications $
Construction $
Public Utilities $
Employee wages and salaries $
Employee benefits (retirement, health insurance, etc.) $
Payroll taxes (FICA, etc.) $
Insurance $
Interest, finance, and banking expenses $
Purchases of gas (from ND sources) $
Transportation $
Retail Trade $
Research and Development $
North Dakota Taxes $
Property $
Income $
Sales and Use $
Other expenses (please specify) $
$
$
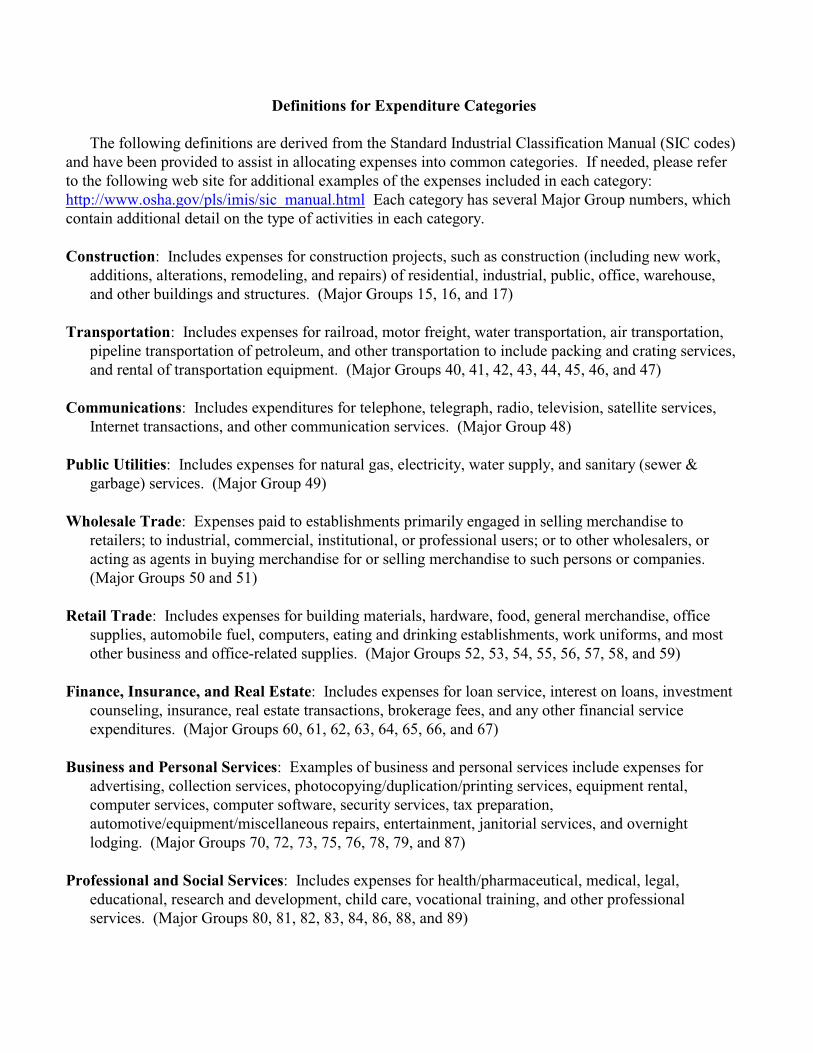
Definitions for Expenditure Categories
The following definitions are derived from the Standard Industrial Classification Manual (SIC codes)and have been provided to assist in allocating expenses into common categories. If needed, please referto the following web site for additional examples of the expenses included in each category: http://www.osha.gov/pls/imis/sic_manual.html Each category has several Major Group numbers, whichcontain additional detail on the type of activities in each category.
Construction: Includes expenses for construction projects, such as construction (including new work,additions, alterations, remodeling, and repairs) of residential, industrial, public, office, warehouse,and other buildings and structures. (Major Groups 15, 16, and 17)
Transportation: Includes expenses for railroad, motor freight, water transportation, air transportation,pipeline transportation of petroleum, and other transportation to include packing and crating services,and rental of transportation equipment. (Major Groups 40, 41, 42, 43, 44, 45, 46, and 47)
Communications: Includes expenditures for telephone, telegraph, radio, television, satellite services,Internet transactions, and other communication services. (Major Group 48)
Public Utilities: Includes expenses for natural gas, electricity, water supply, and sanitary (sewer &garbage) services. (Major Group 49)
Wholesale Trade: Expenses paid to establishments primarily engaged in selling merchandise toretailers; to industrial, commercial, institutional, or professional users; or to other wholesalers, oracting as agents in buying merchandise for or selling merchandise to such persons or companies. (Major Groups 50 and 51)
Retail Trade: Includes expenses for building materials, hardware, food, general merchandise, officesupplies, automobile fuel, computers, eating and drinking establishments, work uniforms, and mostother business and office-related supplies. (Major Groups 52, 53, 54, 55, 56, 57, 58, and 59)
Finance, Insurance, and Real Estate: Includes expenses for loan service, interest on loans, investmentcounseling, insurance, real estate transactions, brokerage fees, and any other financial serviceexpenditures. (Major Groups 60, 61, 62, 63, 64, 65, 66, and 67)
Business and Personal Services: Examples of business and personal services include expenses foradvertising, collection services, photocopying/duplication/printing services, equipment rental,computer services, computer software, security services, tax preparation,automotive/equipment/miscellaneous repairs, entertainment, janitorial services, and overnightlodging. (Major Groups 70, 72, 73, 75, 76, 78, 79, and 87)
Professional and Social Services: Includes expenses for health/pharmaceutical, medical, legal,educational, research and development, child care, vocational training, and other professionalservices. (Major Groups 80, 81, 82, 83, 84, 86, 88, and 89)
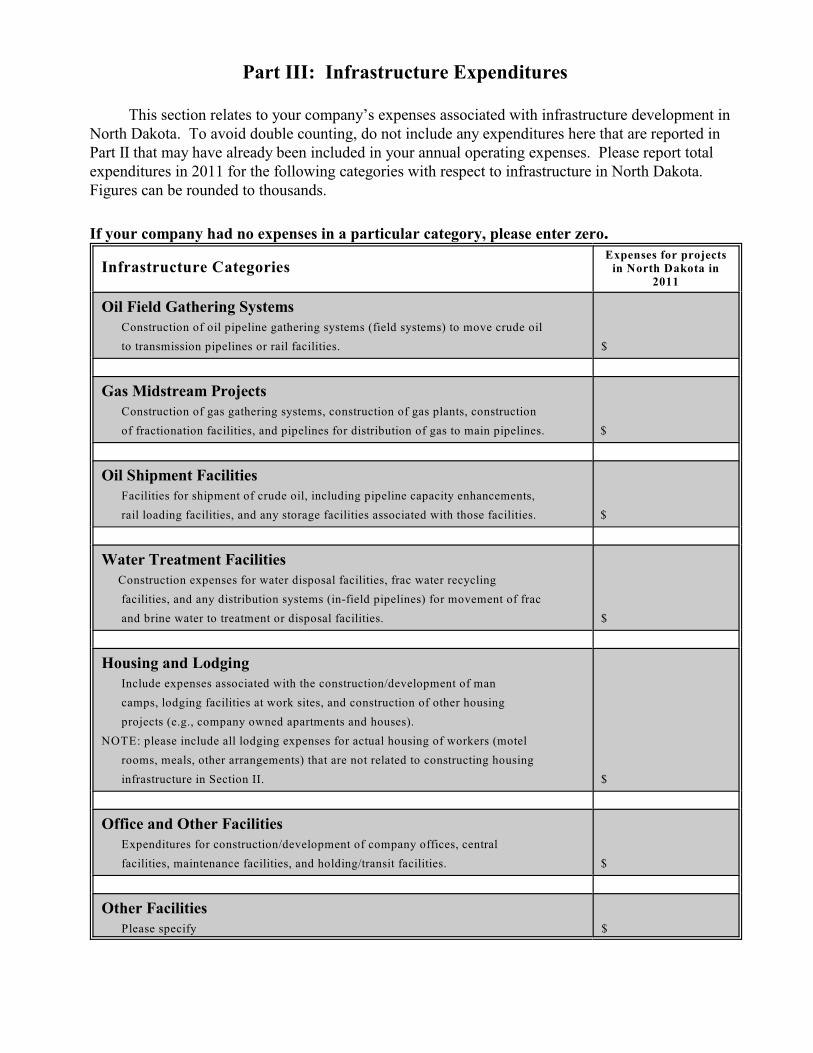
Part III: Infrastructure Expenditures
This section relates to your company’s expenses associated with infrastructure development inNorth Dakota. To avoid double counting, do not include any expenditures here that are reported inPart II that may have already been included in your annual operating expenses. Please report totalexpenditures in 2011 for the following categories with respect to infrastructure in North Dakota. Figures can be rounded to thousands.
If your company had no expenses in a particular category, please enter zero.
Infrastructure CategoriesExpenses for projects
in North Dakota in2011
Oil Field Gathering Systems Construction of oil pipeline gathering systems (field systems) to move crude oil
to transmission pipelines or rail facilities. $
Gas Midstream Projects Construction of gas gathering systems, construction of gas plants, construction
of fractionation facilities, and pipelines for distribution of gas to main pipelines. $
Oil Shipment Facilities Facilities for shipment of crude oil, including pipeline capacity enhancements,
rail loading facilities, and any storage facilities associated with those facilities. $
Water Treatment Facilities Construction expenses for water disposal facilities, frac water recycling
facilities, and any distribution systems (in-field pipelines) for movement of frac
and brine water to treatment or disposal facilities. $
Housing and Lodging Include expenses associated with the construction/development of man
camps, lodging facilities at work sites, and construction of other housing
projects (e.g., company owned apartments and houses).
NOTE: please include all lodging expenses for actual housing of workers (motel
rooms, meals, other arrangements) that are not related to constructing housing
infrastructure in Section II. $
Office and Other Facilities Expenditures for construction/development of company offices, central
facilities, maintenance facilities, and holding/transit facilities. $
Other Facilities Please specify $

Thank You for completing this questionnaire!
Please return the questionnaire in the postpaid envelope.
If you would like a copy of the study results mailed to you, make sure you haveprovided a mailing address in Part I of the questionnaire. Otherwise, you maycontact Edie Watts in the Department of Agribusiness and Applied Economics atNorth Dakota State University for more information on our departmental reports.Phone 701-231 7441, fax 701-231-7400, email: [email protected] orvisit our departmental listing of research reports on the internet athttp://agecon.lib.umn.edu
Study results should be available in the fall of 2012.

APPENDIX C
Questionnaire, Service and Support Firms,North Dakota, 2011
Contribution of the Petroleum Industryto the North Dakota Economy
Survey of Firms ProvidingService and Support in the
North Dakota Petroleum Industry
Department of Agribusiness and Applied Economics
North Dakota State University
and
North Dakota Petroleum Council
Instructions and Guidelines for Filling Out the Questionnaire
Data provided from this survey will be used to help estimate the economic contribution of theoil and gas industry to the North Dakota economy. The goal is to determine how much money isspent in North Dakota. All expenditure data will be synthesized in a manner that only industry-wide totals will be reported. In no way will any information presented in the study identify or bereflective of any single firm or operation.
The following is a list of general guidelines for the questionnaire.
1. Use information for activities in 2011.
2. If you are unsure of a specific figure please use your best estimate. Remember, your bestestimate is going to be better than our best guess!!
3. When answering questions pertaining to spending patterns, please remember that we areonly interested in information on expenditures made to businesses, governments, orindividuals in North Dakota.
4. If you cannot determine if a particular expense was incurred in North Dakota or if theexpense was made to another company or individual in a different state, please indicatethis on the form.
5. Please return the questionnaire by September 30, 2012.
6. If you have questions, please contact:
Dean Bangsund701-231-7471Email: [email protected]
or
Nancy Hodur701-231-7357Email: [email protected] of Agribusiness and Applied EconomicsNorth Dakota State UniversityFargo, ND 58108-6050
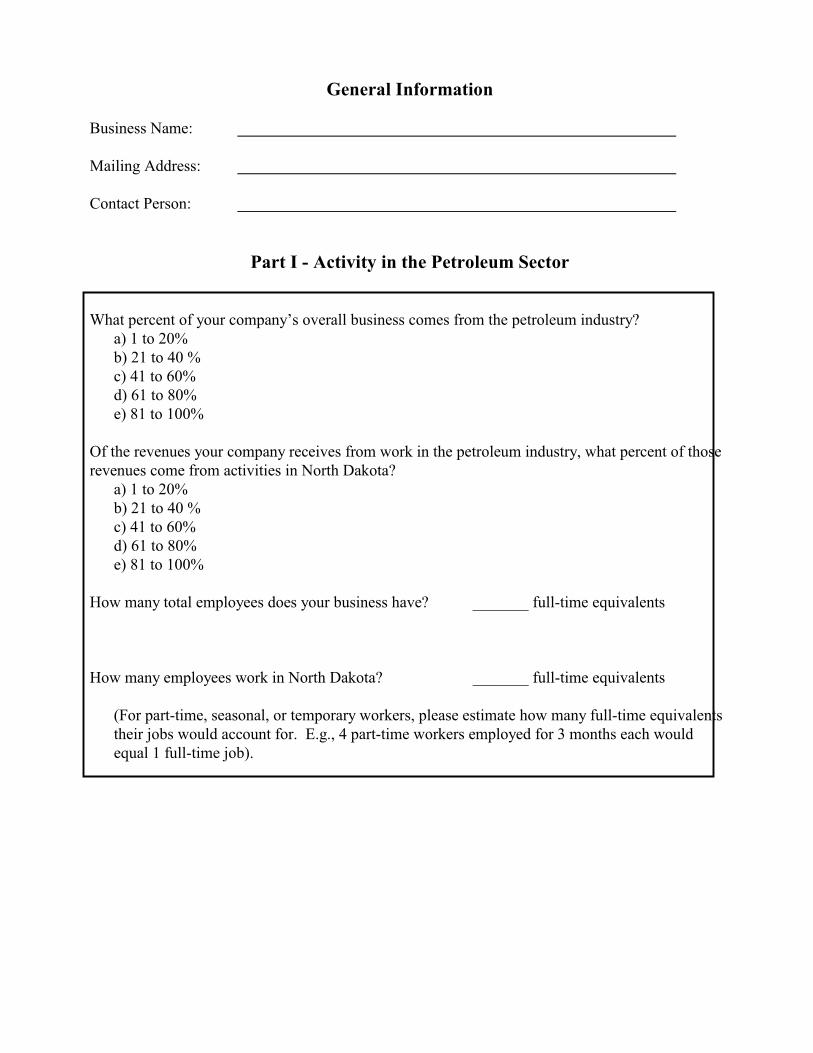
General Information
Business Name:
Mailing Address:
Contact Person:
Part I - Activity in the Petroleum Sector
What percent of your company’s overall business comes from the petroleum industry?a) 1 to 20%b) 21 to 40 %c) 41 to 60%d) 61 to 80%e) 81 to 100%
Of the revenues your company receives from work in the petroleum industry, what percent of thoserevenues come from activities in North Dakota?
a) 1 to 20%b) 21 to 40 %c) 41 to 60%d) 61 to 80%e) 81 to 100%
How many total employees does your business have? _______ full-time equivalents
How many employees work in North Dakota? _______ full-time equivalents
(For part-time, seasonal, or temporary workers, please estimate how many full-time equivalentstheir jobs would account for. E.g., 4 part-time workers employed for 3 months each wouldequal 1 full-time job).
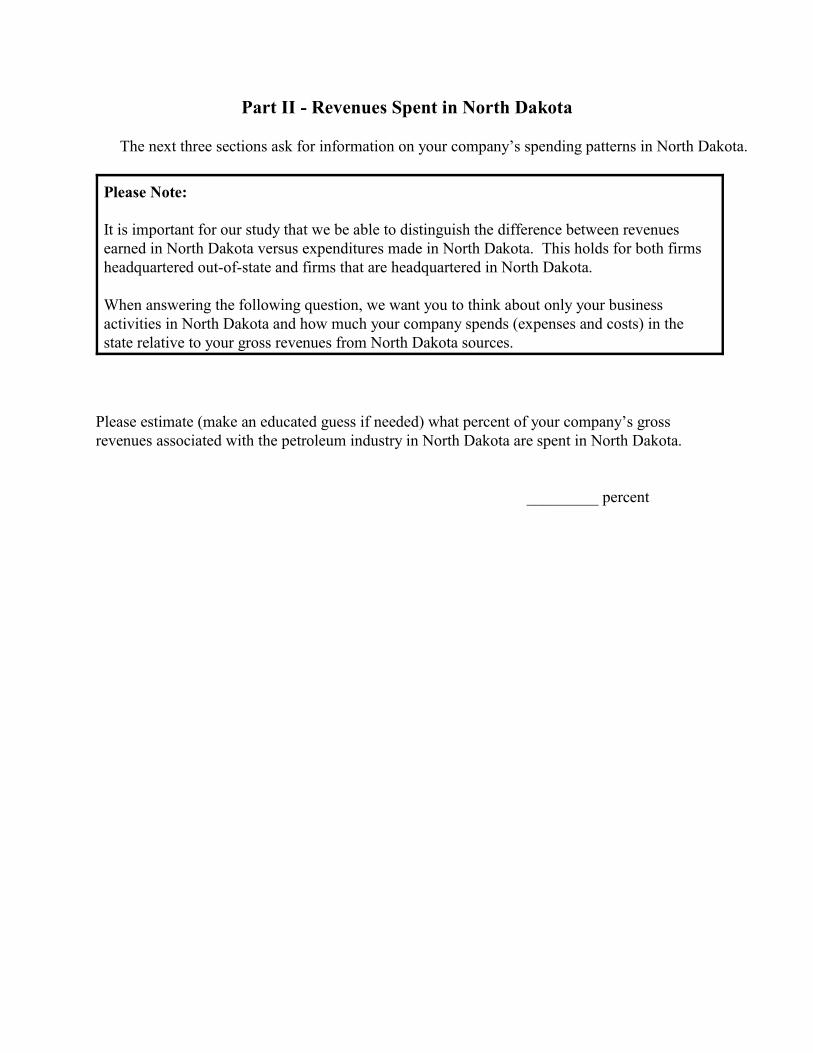
Part II - Revenues Spent in North Dakota
The next three sections ask for information on your company’s spending patterns in North Dakota.
Please Note:
It is important for our study that we be able to distinguish the difference between revenuesearned in North Dakota versus expenditures made in North Dakota. This holds for both firmsheadquartered out-of-state and firms that are headquartered in North Dakota.
When answering the following question, we want you to think about only your businessactivities in North Dakota and how much your company spends (expenses and costs) in thestate relative to your gross revenues from North Dakota sources.
Please estimate (make an educated guess if needed) what percent of your company’s grossrevenues associated with the petroleum industry in North Dakota are spent in North Dakota.
_________ percent
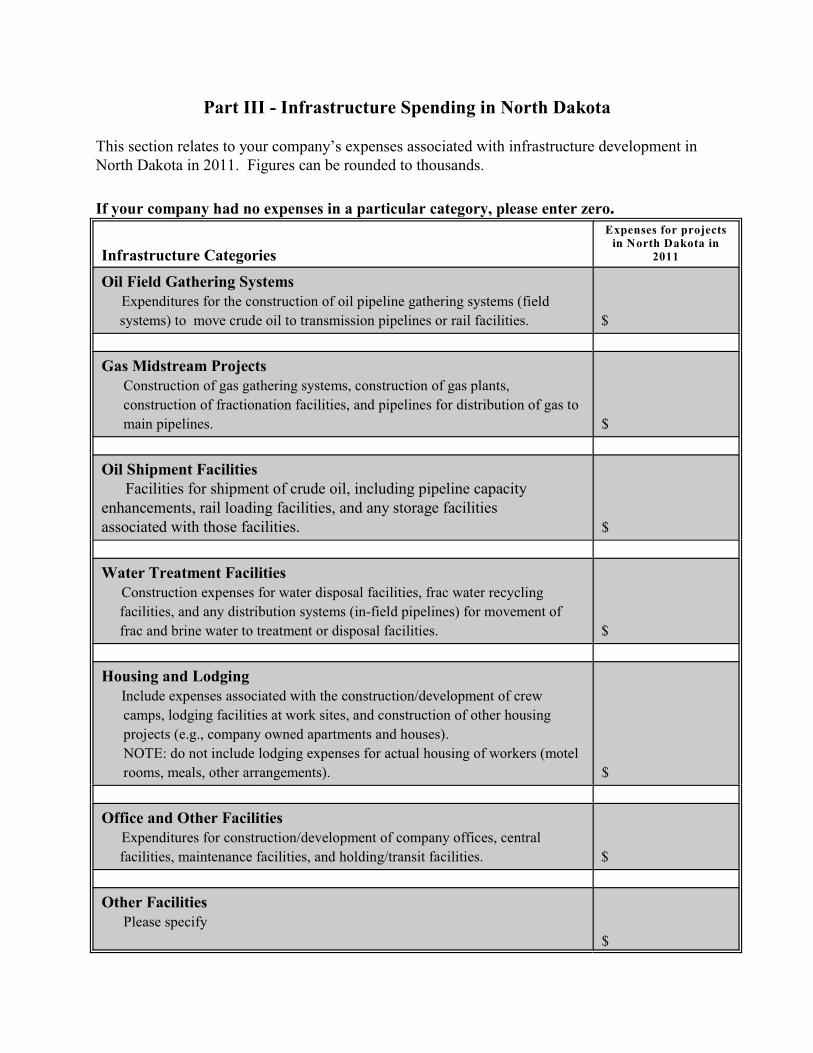
Part III - Infrastructure Spending in North Dakota
This section relates to your company’s expenses associated with infrastructure development inNorth Dakota in 2011. Figures can be rounded to thousands.
If your company had no expenses in a particular category, please enter zero.
Infrastructure Categories
Expenses for projectsin North Dakota in
2011
Oil Field Gathering Systems Expenditures for the construction of oil pipeline gathering systems (field
systems) to move crude oil to transmission pipelines or rail facilities. $
Gas Midstream Projects Construction of gas gathering systems, construction of gas plants,
construction of fractionation facilities, and pipelines for distribution of gas to
main pipelines. $
Oil Shipment Facilities Facilities for shipment of crude oil, including pipeline capacity enhancements, rail loading facilities, and any storage facilities associated with those facilities. $
Water Treatment Facilities Construction expenses for water disposal facilities, frac water recycling
facilities, and any distribution systems (in-field pipelines) for movement of
frac and brine water to treatment or disposal facilities. $
Housing and Lodging Include expenses associated with the construction/development of crew
camps, lodging facilities at work sites, and construction of other housing
projects (e.g., company owned apartments and houses).
NOTE: do not include lodging expenses for actual housing of workers (motel
rooms, meals, other arrangements). $
Office and Other Facilities Expenditures for construction/development of company offices, central
facilities, maintenance facilities, and holding/transit facilities. $
Other Facilities Please specify
$
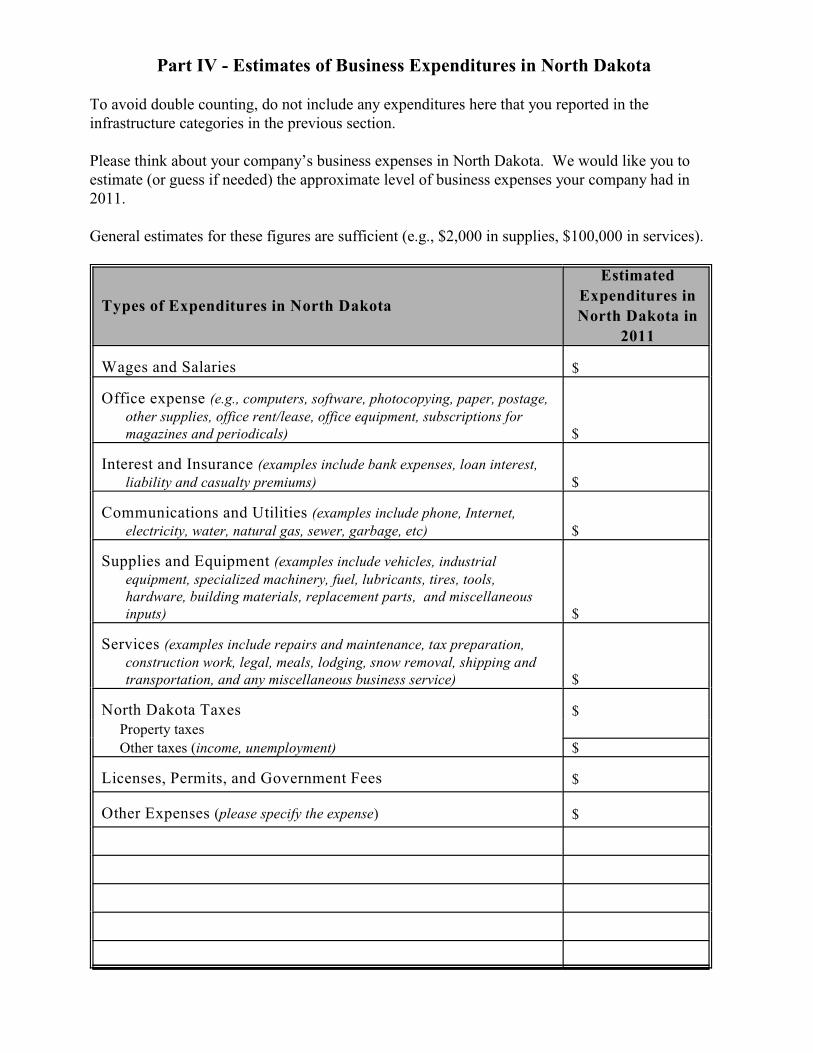
Part IV - Estimates of Business Expenditures in North Dakota
To avoid double counting, do not include any expenditures here that you reported in theinfrastructure categories in the previous section.
Please think about your company’s business expenses in North Dakota. We would like you toestimate (or guess if needed) the approximate level of business expenses your company had in 2011.
General estimates for these figures are sufficient (e.g., $2,000 in supplies, $100,000 in services).
Types of Expenditures in North Dakota
Estimated
Expenditures in
North Dakota in
2011
Wages and Salaries $
Office expense (e.g., computers, software, photocopying, paper, postage,other supplies, office rent/lease, office equipment, subscriptions formagazines and periodicals) $
Interest and Insurance (examples include bank expenses, loan interest,liability and casualty premiums) $
Communications and Utilities (examples include phone, Internet,electricity, water, natural gas, sewer, garbage, etc) $
Supplies and Equipment (examples include vehicles, industrialequipment, specialized machinery, fuel, lubricants, tires, tools,hardware, building materials, replacement parts, and miscellaneousinputs) $
Services (examples include repairs and maintenance, tax preparation,construction work, legal, meals, lodging, snow removal, shipping andtransportation, and any miscellaneous business service) $
North Dakota Taxes $
Property taxes
Other taxes (income, unemployment) $
Licenses, Permits, and Government Fees $
Other Expenses (please specify the expense) $
Thank You for completing this questionnaire!
Please return the questionnaire in the postpaid envelope.
If you would like a copy of the study results mailed to you, make sure you haveprovided a mailing address in Part I of the questionnaire. Otherwise, you maycontact Edie Watts in the Department of Agribusiness and Applied Economics atNorth Dakota State University for more information on our departmental reports.Phone 701-231 7441, fax 701-231-7400, email: [email protected] orvisit our departmental listing of research reports on the internet athttp://agecon.lib.umn.edu
Study results should be available in December of 2012.
APPENDIX D
Questionnaire, Leasing/Brokerage Firms,North Dakota, 2011
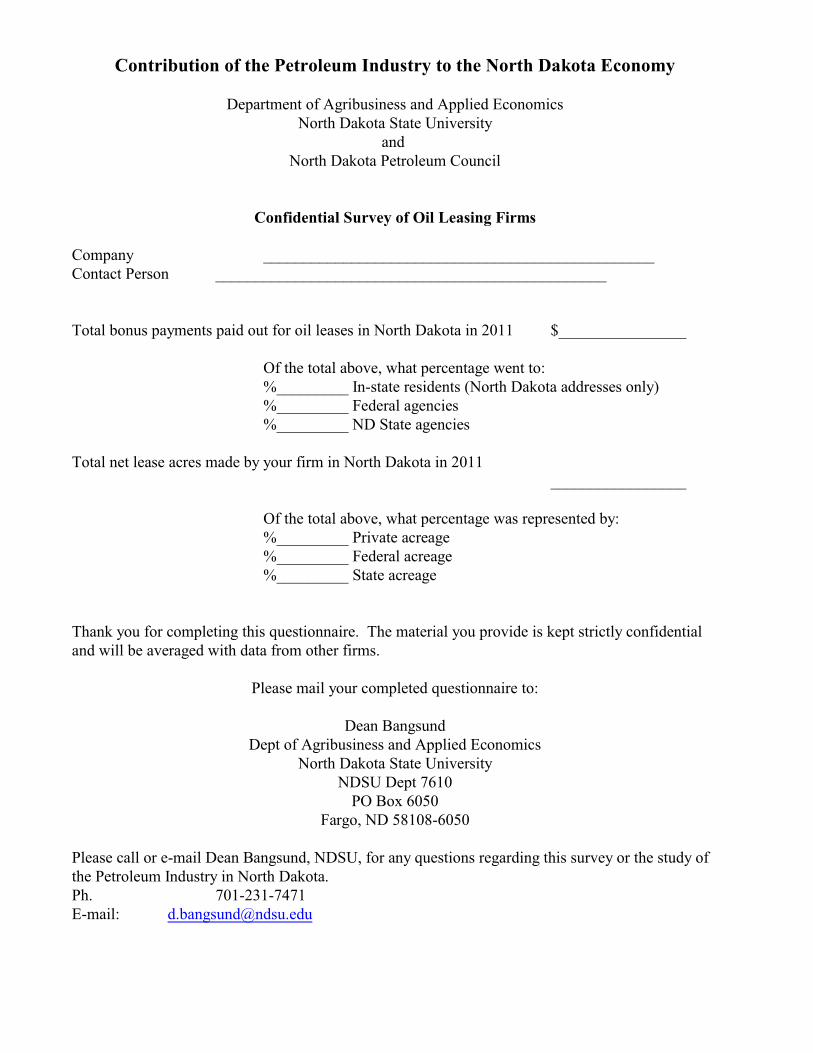
Contribution of the Petroleum Industry to the North Dakota Economy
Department of Agribusiness and Applied EconomicsNorth Dakota State University
and North Dakota Petroleum Council
Confidential Survey of Oil Leasing Firms
Company _________________________________________________Contact Person _________________________________________________
Total bonus payments paid out for oil leases in North Dakota in 2011 $________________
Of the total above, what percentage went to:%_________ In-state residents (North Dakota addresses only)%_________ Federal agencies%_________ ND State agencies
Total net lease acres made by your firm in North Dakota in 2011_________________
Of the total above, what percentage was represented by:%_________ Private acreage%_________ Federal acreage%_________ State acreage
Thank you for completing this questionnaire. The material you provide is kept strictly confidentialand will be averaged with data from other firms.
Please mail your completed questionnaire to:
Dean BangsundDept of Agribusiness and Applied Economics
North Dakota State UniversityNDSU Dept 7610
PO Box 6050Fargo, ND 58108-6050
Please call or e-mail Dean Bangsund, NDSU, for any questions regarding this survey or the study ofthe Petroleum Industry in North Dakota.Ph. 701-231-7471E-mail: [email protected]