petroleum and petroleum productsaevnmont.free.fr/sach-books/petrochemistry/handbook of... ·...
TRANSCRIPT
CHAPTER
2
PETROLEUM AND PETROLEUM PRODUCTS
2.1. PETROLEUM
Petroleum is a naturally occurring mixture of hydrocarbons, generally in aliquid state, that may also include compounds of sulfur, nitrogen, oxygen,metals, and other elements (ASTM D-4175). Consequently, it is not sur-prising that petroleum can vary in composition properties and produce widevariations in refining behavior as well as product properties.
Petroleum being processed in refineries is becoming increasingly heavier(higher amounts of residuum) and higher sulfur content) (Speight, 1999,and references cited therein). Market demand (market pull) dictates thatresidua must be upgraded to higher-value products (Speight and Ozum,2002). In short, the value of petroleum depends on its quality for refiningand whether or not a product slate can be obtained to fit market demand.
Thus process units in a refinery require analytical test methods that canadequately evaluate feedstocks and monitor product quality. In addition,the high sulfur content of petroleum and regulations limiting the maximumsulfur content of fuels makes sulfur removal a priority in refinery process-ing. Here again, analytical methodology is key to the successful determina-tion of the sulfur compound types present and their subsequent removal.
Upgrading residua involves processing (usually conversion) into a moresalable, higher-valued product. Improved characterization methods are necessary for process design, crude oil evaluation, and operational control.Definition of the boiling range and the hydrocarbon type distribution inheavy distillates and in residua is increasingly important. Feedstock analy-sis to provide a quantitative boiling range distribution (that accounts fornoneluting components) as well as the distribution of hydrocarbon types ingas oil and higher-boiling materials is important in evaluating feedstocksfor further processing.
Sulfur reduction processes are sensitive to both amount and structure of the sulfur compounds being removed. Tests that can provide informa-tion about both of these factors are becoming increasingly important, andanalytical tests that provide information about other constituents of inter-est (e.g., nitrogen, organometallic constituents) are also valuable and beingused for characterization.
29
But before delving into the detailed aspects of petroleum product analy-sis, it is necessary to understand the nature and character of petroleum aswell as the methods used to produce petroleum products. This will presentto the reader the background that is necessary to understand petroleumand the processes used to convert it to products. The details of the chem-istry are not presented here and can be found elsewhere (Speight, 1999,2000; Speight and Ozum, 2002).
Thus it is the intent of this chapter to present an overview with somedegree of detail of the character of petroleum and the methods used toproduce products.The character of petroleum will be presented, for the pur-poses of this chapter, by application of various analytical methods.
Sections relating to natural gas (a constituents of petroleum), natural gasliquids, and natural gasoline are also included.
2.1.1. Definitions
Petroleum (also called crude oil) is a naturally mixture of hydrocarbons,generally in the liquid state, that may also include compounds of sulfur,nitrogen, oxygen, and metals and other elements (ASTM D-4175; Speight,2001 and references cited therein). Inorganic sediment and water may alsobe present. Thus, for the purposes of this text, a petroleum product is anyproduct that is manufactured during petroleum refining and, as a conse-quence, petrochemical products are not included in this definition or in thistext.
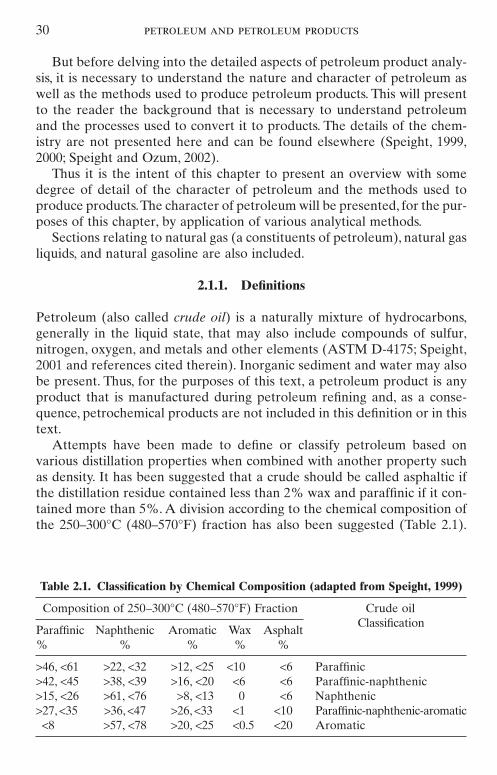
Attempts have been made to define or classify petroleum based onvarious distillation properties when combined with another property suchas density. It has been suggested that a crude should be called asphaltic ifthe distillation residue contained less than 2% wax and paraffinic if it con-tained more than 5%. A division according to the chemical composition ofthe 250–300°C (480–570°F) fraction has also been suggested (Table 2.1).
30 petroleum and petroleum products
Table 2.1. Classification by Chemical Composition (adapted from Speight, 1999)
Composition of 250–300°C (480–570°F) Fraction Crude oil
Paraffinic Naphthenic Aromatic Wax AsphaltClassification
% % % % %
>46, <61 >22, <32 >12, <25 <10 <6 Paraffinic>42, <45 >38, <39 >16, <20 <6 <6 Paraffinic-naphthenic>15, <26 >61, <76 >8, <13 0 <6 Naphthenic>27, <35 >36, <47 >26, <33 <1 <10 Paraffinic-naphthenic-aromatic
<8 >57, <78 >20, <25 <0.5 <20 Aromatic
Difficulties arise in using such a classification in that in the fractions boilingabove 200°C (390°F) the molecules can no longer be placed in one groupbecause most of them are of a typically mixed nature. Purely naphthenic oraromatic molecules occur very seldom; cyclic compounds generally containparaffinic side chains and often even aromatic and naphthenic rings side byside. More direct chemical information is often desirable and can be sup-plied by means of the correlation index (CI).
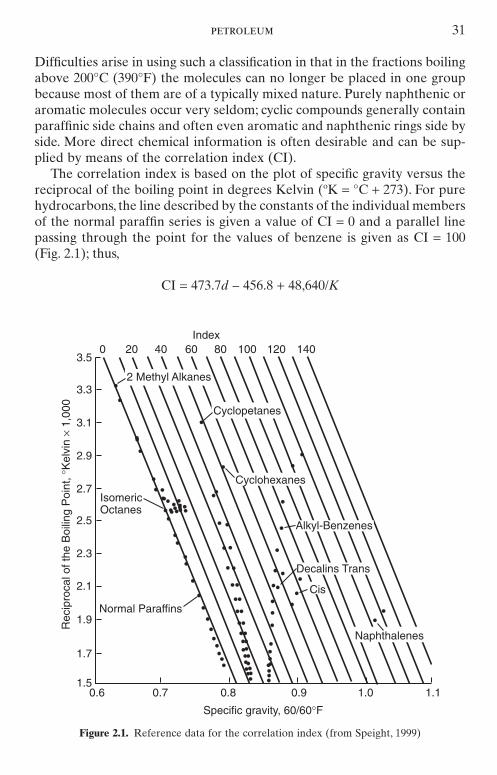
The correlation index is based on the plot of specific gravity versus thereciprocal of the boiling point in degrees Kelvin (oK = °C + 273). For purehydrocarbons, the line described by the constants of the individual membersof the normal paraffin series is given a value of CI = 0 and a parallel linepassing through the point for the values of benzene is given as CI = 100(Fig. 2.1); thus,
CI = 473.7d – 456.8 + 48,640/K
petroleum 31
••••
•••
••
•••
••
•••••••
••••••••••• ••
• •
• ••••••••••••••••••••••••• ••
••••••••• •
•
••
•• •••••
•
••
•
•
•••
••
•
•
Alkyl-Benzenes
Decalins Trans
Naphthalenes
Cis
Normal Paraffins
IsomericOctanes
Cyclohexanes
Cyclopetanes
2 Methyl Alkanes
0 20 40 60 80 100 120 140Index
3.5
3.3
3.1
2.9
2.7
2.5
2.3
2.1
1.9
1.7
1.50.6 0.7 0.8 0.9 1.0 1.1
Specific gravity, 60/60°F
Rec
ipro
cal o
f the
Boi
ling
Poi
nt, °
Kel
vin
× 1,
000
Figure 2.1. Reference data for the correlation index (from Speight, 1999)
where d is the specific gravity and K is the average boiling point of thepetroleum fraction as determined by the standard distillation method(ASTM D-86, ASTM D-1160).
Values for the index between 0 and 15 indicate a predominance of par-affinic hydrocarbons in the fraction. A value from 15 to 50 indicates pre-dominance of either naphthenes or mixtures of paraffins, naphthenes, andaromatics. An index value above 50 indicates a predominance of aromaticspecies. However, it cannot be forgotten that the data used to determinethe correlation index are average for the fraction of feedstock under studyand may not truly represent all constituents of the feedstock, especiallythose at both ends of a range of physical and chemical properties.
Thus, because of the use of average data and the output of a value thatfalls within a broad range, it is questionable whether or not this correlationindex offers realistic or reliable information. As the complexity of feed-stocks increases from petroleum to heavy oil and beyond to tar sandbitumen, especially with the considerable overlap of compound types, theremust be serious questions about the reliability of the number derived bythis method.
Another derived number, the UOP characterization factor, is also awidely used method for defining petroleum; the Characterization Factor isderived from the formula:
K = 3√T—
B/d
where TB is the average boiling point in degrees Rankine (°F + 460) and dis the specific gravity (60°/60°F). This factor has been shown to be additiveon a weight basis. It was originally devised to show the thermal crackingcharacteristics of heavy oil. Thus, highly paraffinic oils have K = ~12.5–13.0and cyclic (naphthenic) oils have K = ~10.5–12.5.
Again, because of the use of average data and the output of a value thatfalls (in this case) within a narrow range, it is questionable whether or notthis characterization factor offers realistic or reliable information. Deter-mining whether or not a feedstock is paraffinic is one issue, but one mustask whether there is a real difference between feedstocks when the char-acterization factor is 12.4 or 12.5 or even between feedstocks having char-acterization factors of 12.4 and 13.0. As the complexity of feedstocksincreases from petroleum to heavy oil and beyond to tar sand bitumen,especially with the considerable overlap of compound types, there must be serious questions about the reliability of the number derived by thismethod.
The underlying premise for these methods of definition or classificationis uniformity of the molecular nature of the feedstocks. This is not in fact
32 petroleum and petroleum products
the case, and when blends are employed as refinery feedstocks, the methodsdo not take into account any potential interactions between the constituentsof each member of the blend.
The most adequate definitions of petroleum come from legal documents,where petroleum is defined directly or by inference (Speight, 1999, 2000).
2.1.2. Composition
In all of these attempts at a definition or classification of petroleum, it mustbe remembered that petroleum exhibits wide variations in composition andproperties, and these variations not only occur in petroleum from differentfields but may also be manifested in petroleum taken from different pro-duction depths in the same well. The mixture of hydrocarbons is highlycomplex. Paraffinic, naphthenic, and aromatic structures can occur in thesame molecule, and the complexity increases with boiling range of thepetroleum fraction. In addition, petroleum varies in physical appearancefrom a light-colored liquid to the more viscous heavy oil. The near-solid orsolid bitumen that occurs in tar sand deposits is different from petroleumand heavy oil, as evidenced by the respective methods of recovery (Speight,1999, 2000).
Elemental analysis of petroleum shows that the major constituents arecarbon and hydrogen with smaller amounts of sulfur (0.1–8% w/w), nitro-gen (0.1–1.0% w/w), and oxygen (0.1–3% w/w), and trace elements such asvanadium, nickel, iron, and copper present at the part per million (ppm)level. Of the non-hydrocarbon (heteroelements) elements, sulfur is the mostabundant and often considered the most important by refiners. However,nitrogen and the trace metals also have deleterious effects on refinery cat-alysts and should not be discounted because of relative abundance. Processunits with, for example, a capacity of 50,000bbl/day that are in operationcontinuously can soon reflect the presence of the trace elements. The effectof oxygen, which also has an effect on refining catalysts, has received some-what less study than the other heteroelements but remains equally impor-tant in refining.
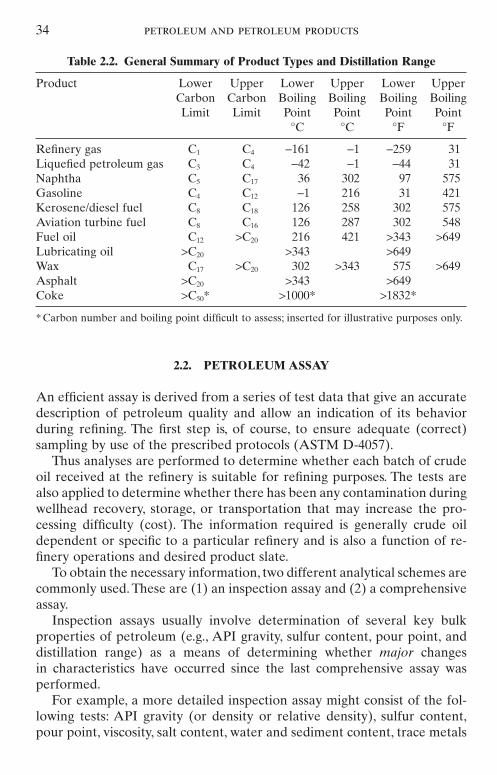
Petroleum suitability for refining (to produce a slate of predeterminedproducts) (Table 2.2) is determined by application of a series of analyticalmethods (Speight, 2001) that provide information that is sufficient to assessthe potential quality of the petroleum as a feedstock and also to indicatewhether any difficulties might arise in handling, refining, or transportation.Such information may be obtained either by (1) a preliminary assay ofpetroleum or (2) a full assay of petroleum that involves presentation of atrue boiling point curve and the analysis of fractions throughout the fullrange of petroleum.
petroleum 33
2.2. PETROLEUM ASSAY
An efficient assay is derived from a series of test data that give an accuratedescription of petroleum quality and allow an indication of its behaviorduring refining. The first step is, of course, to ensure adequate (correct) sampling by use of the prescribed protocols (ASTM D-4057).
Thus analyses are performed to determine whether each batch of crudeoil received at the refinery is suitable for refining purposes. The tests arealso applied to determine whether there has been any contamination duringwellhead recovery, storage, or transportation that may increase the pro-cessing difficulty (cost). The information required is generally crude oildependent or specific to a particular refinery and is also a function of re-finery operations and desired product slate.
To obtain the necessary information, two different analytical schemes arecommonly used. These are (1) an inspection assay and (2) a comprehensiveassay.
Inspection assays usually involve determination of several key bulkproperties of petroleum (e.g., API gravity, sulfur content, pour point, anddistillation range) as a means of determining whether major changes in characteristics have occurred since the last comprehensive assay was performed.
For example, a more detailed inspection assay might consist of the fol-lowing tests: API gravity (or density or relative density), sulfur content,pour point, viscosity, salt content, water and sediment content, trace metals
34 petroleum and petroleum products
Table 2.2. General Summary of Product Types and Distillation Range
Product Lower Upper Lower Upper Lower UpperCarbon Carbon Boiling Boiling Boiling BoilingLimit Limit Point Point Point Point
°C °C °F °F
Refinery gas C1 C4 -161 -1 -259 31Liquefied petroleum gas C3 C4 -42 -1 -44 31Naphtha C5 C17 36 302 97 575Gasoline C4 C12 -1 216 31 421Kerosene/diesel fuel C8 C18 126 258 302 575Aviation turbine fuel C8 C16 126 287 302 548Fuel oil C12 >C20 216 421 >343 >649Lubricating oil >C20 >343 >649Wax C17 >C20 302 >343 575 >649Asphalt >C20 >343 >649Coke >C50* >1000* >1832*
* Carbon number and boiling point difficult to assess; inserted for illustrative purposes only.
(or organic halides).The results from these tests with the archived data froma comprehensive assay provide an estimate of any changes that haveoccurred in the crude oil that may be critical to refinery operations. Inspec-tion assays are routinely performed on all crude oils received at a refinery.
On the other hand, the comprehensive (or full) assay is more complex(as well as time-consuming and costly) and is usually only performed onlywhen a new field comes on stream, or when the inspection assay indicatesthat significant changes in the composition of the crude oil have occurred.Except for these circumstances, a comprehensive assay of a particular crudeoil stream may not (unfortunately) be updated for several years.
In this section, as in others throughout this book, no preference is givento any particular tests. All lists of tests are alphabetical.
2.2.1. Carbon Residue, Asphaltene Content
The carbon residues of petroleum and petroleum products serve as an indi-cation of the propensity of the sample to form carbonaceous deposits(thermal coke) under the influence of heat.
Tests for Conradson carbon residue (ASTM D-189, IP 13), Ramsbottomcarbon residue (ASTM D-524, IP 14), the microcarbon carbon residue(ASTM D4530, IP 398), and asphaltene content (ASTM D-893, ASTM D-2006, ASTM D-2007, ASTM D-3279, ASTM D-4124, ASTM D-6560, IP143) are sometimes included in inspection data on petroleum.The data givean indication of the amount of coke that will be formed during thermalprocesses as well as an indication of the amount of high-boiling constituentsin petroleum.
The determination of the carbon residue of petroleum or a petroleumproduct is applicable to relatively nonvolatile samples that decompose ondistillation at atmospheric pressure. Samples that contain ash-forming con-stituents will have an erroneously high carbon residue, depending on theamount of ash formed. All three methods are applicable to relatively non-volatile petroleum products that partially decompose on distillation atatmospheric pressure. Crude oils having a low carbon residue may be dis-tilled to a specified residue with the carbon residue test of choice thenapplied to that residue.
In the Conradson carbon residue test (ASTM D-189, IP 13), a weighedquantity of sample is placed in a crucible and subjected to destructive dis-tillation for a fixed period of severe heating. At the end of the specifiedheating period, the test crucible containing the carbonaceous residue iscooled in a desiccator and weighed and the residue is reported as a per-centage (% w/w) of the original sample (Conradson carbon residue).
In the Ramsbottom carbon residue test (ASTM Test Method D524, IP14), the sample is weighed into a glass bulb that has a capillary opening and
petroleum assay 35
is placed into a furnace (at 550°C, 1022°F). The volatile matter is distilledfrom the bulb and the nonvolatile matter that remains in the bulb decom-poses to form thermal coke. After a specified heating period, the bulb isremoved from the bath, cooled in a desiccator, and weighed to report theresidue (Ramsbottom carbon residue) as a percentage (% w/w) of the orig-inal sample.
In the microcarbon residue test (ASTM D4530, IP 398), a weighed quan-tity of the sample placed in a glass vial is heated to 500°C (932°F) under aninert (nitrogen) atmosphere in a controlled manner for a specific time andthe carbonaceous residue [carbon residue (micro)] is reported as a per-centage (% w/w) of the original sample.
The data produced by the microcarbon test (ASTM D4530, IP 398) areequivalent to those by the Conradson carbon residue method (ASTM D-189 IP 13). However, this microcarbon test method offers better control oftest conditions and requires a smaller sample. Up to 12 samples can be runsimultaneously. This test method is applicable to petroleum and to petro-leum products that partially decompose on distillation at atmospheric pres-sure and is applicable to a variety of samples that generate a range of yields(0.01% w/w to 30% w/w) of thermal coke.
As noted, in any of the carbon residue tests, ash-forming constituents(ASTM D-482) or nonvolatile additives present in the sample will beincluded in the total carbon residue reported, leading to higher carbonresidue values and erroneous conclusions about the coke-forming propen-sity of the sample.
The asphaltene fraction (ASTM D-893, ASTM D-2006, ASTM D-2007,ASTM D-3279, ASTM D-4124, ASTM D-6560, IP 143) is the highest-molecular-weight, most complex fraction in petroleum. The asphaltenecontent gives an indication of the amount of coke that can be expectedduring processing (Speight, 1999; Speight, 2001, Speight and Ozum 2002).
In any of the methods for the determination of the asphaltene content,the crude oil or product (such as asphalt) is mixed with a large excess(usually >30 volumes hydrocarbon per volume of sample) of low-boilinghydrocarbon such as n-pentane or n-heptane. For an extremely viscoussample, a solvent such as toluene may be used before the addition of thelow-boiling hydrocarbon but an additional amount of the hydrocarbon(usually >30 volumes hydrocarbon per volume of solvent) must be addedto compensate for the presence of the solvent. After a specified time, theinsoluble material (the asphaltene fraction) is separated (by filtration) anddried. The yield is reported as percentage (% w/w) of the original sample.
It must be recognized that, in any of these tests, different hydrocarbons(such as n-pentane or n-heptane) will give different yields of the asphal-tene fraction and if the presence of the solvent is not compensated for byuse of additional hydrocarbon the yield will be erroneous. In addition, if the
36 petroleum and petroleum products
hydrocarbon is not present in large excess, the yields of the asphaltene frac-tion will vary and will be erroneous (Speight, 1999).
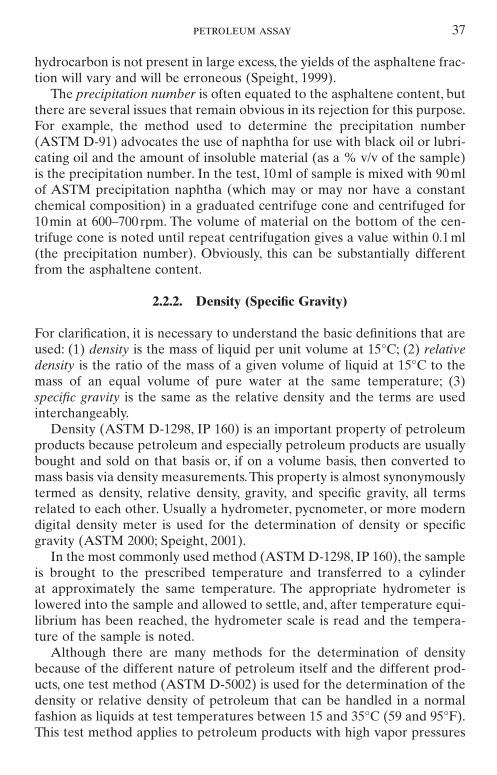
The precipitation number is often equated to the asphaltene content, butthere are several issues that remain obvious in its rejection for this purpose.For example, the method used to determine the precipitation number(ASTM D-91) advocates the use of naphtha for use with black oil or lubri-cating oil and the amount of insoluble material (as a % v/v of the sample)is the precipitation number. In the test, 10ml of sample is mixed with 90mlof ASTM precipitation naphtha (which may or may nor have a constantchemical composition) in a graduated centrifuge cone and centrifuged for10min at 600–700rpm. The volume of material on the bottom of the cen-trifuge cone is noted until repeat centrifugation gives a value within 0.1ml(the precipitation number). Obviously, this can be substantially differentfrom the asphaltene content.
2.2.2. Density (Specific Gravity)
For clarification, it is necessary to understand the basic definitions that areused: (1) density is the mass of liquid per unit volume at 15°C; (2) relativedensity is the ratio of the mass of a given volume of liquid at 15°C to themass of an equal volume of pure water at the same temperature; (3) specific gravity is the same as the relative density and the terms are usedinterchangeably.
Density (ASTM D-1298, IP 160) is an important property of petroleumproducts because petroleum and especially petroleum products are usuallybought and sold on that basis or, if on a volume basis, then converted tomass basis via density measurements.This property is almost synonymouslytermed as density, relative density, gravity, and specific gravity, all termsrelated to each other. Usually a hydrometer, pycnometer, or more moderndigital density meter is used for the determination of density or specificgravity (ASTM 2000; Speight, 2001).
In the most commonly used method (ASTM D-1298, IP 160), the sampleis brought to the prescribed temperature and transferred to a cylinder at approximately the same temperature. The appropriate hydrometer islowered into the sample and allowed to settle, and, after temperature equi-librium has been reached, the hydrometer scale is read and the tempera-ture of the sample is noted.
Although there are many methods for the determination of densitybecause of the different nature of petroleum itself and the different prod-ucts, one test method (ASTM D-5002) is used for the determination of thedensity or relative density of petroleum that can be handled in a normalfashion as liquids at test temperatures between 15 and 35°C (59 and 95°F).This test method applies to petroleum products with high vapor pressures
petroleum assay 37
provided appropriate precautions are taken to prevent vapor loss duringtransfer of the sample to the density analyzer. In the method, approximately 0.7ml of crude oil sample is introduced into an oscillating sample tube andthe change in oscillating frequency caused by the change in mass of the tubeis used in conjunction with calibration data to determine the density of the sample.
Another test determines density and specific gravity by means of a digitaldensimeter (ASTM D-4052, IP 365). In the test, a small volume (approxi-mately 0.7ml) of liquid sample is introduced into an oscillating sample tubeand the change in oscillating frequency caused by the change in the massof the tube is used in conjunction with calibration data to determine thedensity of the sample. The test is usually applied to petroleum, petroleumdistillates, and petroleum products that are liquids at temperatures between15 and 35°C (59 and 95°F) and have vapor pressures below 600mmHg and viscosities below about 15,000cSt at the temperature of the test. How-ever, the method should not be applied to samples so dark in color that the absence of air bubbles in the sample cell cannot be established with certainty.
Accurate determination of the density or specific gravity of crude oil isnecessary for the conversion of measured volumes to volumes at the stan-dard temperature of 15.56°C (60°F) (ASTM D-1250, IP 200, PetroleumMeasurement Tables). The specific gravity is also a factor reflecting thequality of crude oils.
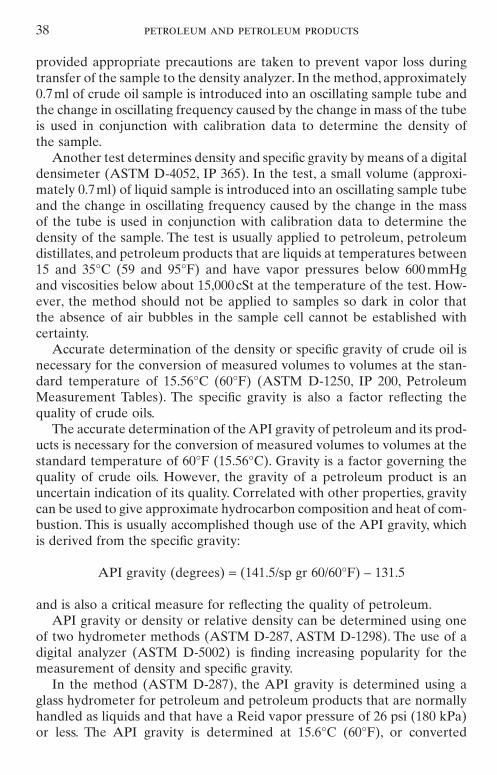
The accurate determination of the API gravity of petroleum and its prod-ucts is necessary for the conversion of measured volumes to volumes at thestandard temperature of 60°F (15.56°C). Gravity is a factor governing thequality of crude oils. However, the gravity of a petroleum product is anuncertain indication of its quality. Correlated with other properties, gravitycan be used to give approximate hydrocarbon composition and heat of com-bustion. This is usually accomplished though use of the API gravity, whichis derived from the specific gravity:
API gravity (degrees) = (141.5/sp gr 60/60°F) – 131.5
and is also a critical measure for reflecting the quality of petroleum.API gravity or density or relative density can be determined using one
of two hydrometer methods (ASTM D-287, ASTM D-1298). The use of adigital analyzer (ASTM D-5002) is finding increasing popularity for themeasurement of density and specific gravity.
In the method (ASTM D-287), the API gravity is determined using aglass hydrometer for petroleum and petroleum products that are normallyhandled as liquids and that have a Reid vapor pressure of 26 psi (180 kPa)or less. The API gravity is determined at 15.6°C (60°F), or converted
38 petroleum and petroleum products
to values at 60°F, by means of standard tables. These tables are not appli-cable to non-hydrocarbons or essentially pure hydrocarbons such as thearomatics.
This test method is based on the principle that the gravity of a liquidvaries directly with the depth of immersion of a body floating in it. The APIgravity is determined with an hydrometer by observing the freely floatingAPI hydrometer and noting the graduation nearest to the apparent inter-section of the horizontal plane surface of the liquid with the vertical scaleof the hydrometer after temperature equilibrium has been reached. Thetemperature of the sample is determined with a standard test thermometerthat is immersed in the sample or with the thermometer that is an integralpart of the hydrometer (thermohydrometer).
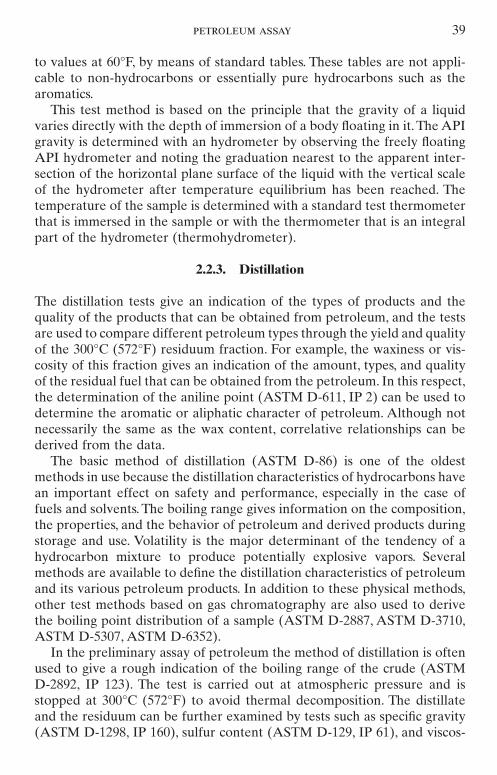
2.2.3. Distillation
The distillation tests give an indication of the types of products and thequality of the products that can be obtained from petroleum, and the testsare used to compare different petroleum types through the yield and qualityof the 300°C (572°F) residuum fraction. For example, the waxiness or vis-cosity of this fraction gives an indication of the amount, types, and qualityof the residual fuel that can be obtained from the petroleum. In this respect,the determination of the aniline point (ASTM D-611, IP 2) can be used todetermine the aromatic or aliphatic character of petroleum. Although notnecessarily the same as the wax content, correlative relationships can bederived from the data.
The basic method of distillation (ASTM D-86) is one of the oldestmethods in use because the distillation characteristics of hydrocarbons havean important effect on safety and performance, especially in the case offuels and solvents. The boiling range gives information on the composition,the properties, and the behavior of petroleum and derived products duringstorage and use. Volatility is the major determinant of the tendency of ahydrocarbon mixture to produce potentially explosive vapors. Severalmethods are available to define the distillation characteristics of petroleumand its various petroleum products. In addition to these physical methods,other test methods based on gas chromatography are also used to derivethe boiling point distribution of a sample (ASTM D-2887, ASTM D-3710,ASTM D-5307, ASTM D-6352).
In the preliminary assay of petroleum the method of distillation is oftenused to give a rough indication of the boiling range of the crude (ASTMD-2892, IP 123). The test is carried out at atmospheric pressure and isstopped at 300°C (572°F) to avoid thermal decomposition. The distillateand the residuum can be further examined by tests such as specific gravity(ASTM D-1298, IP 160), sulfur content (ASTM D-129, IP 61), and viscos-
petroleum assay 39
ity (ASTM D-445, IP 71). In fact, the use of a method (ASTM D-2569)developed for the determining the distillation characteristics of pitch allowsfurther examination of residua.
In addition to the whole crude oil tests performed as part of the inspec-tion assay, a comprehensive or full assay requires that the crude be frac-tionally distilled and the fractions characterized by the relevant tests.Fractionation of the crude oil begins with a true boiling point (TBP) dis-tillation using a fractionating column with an efficiency of 14–18 theor-etical plates and operated at a reflux ratio of 5 : 1 (ASTM D-2892). The TBP distillation may be used for all fractions up to a maximum cut pointof about 350°C atmospheric equivalent temperature (AET), but a low residence time in the still (or reduced pressure) is needed to minimizecracking.
It is often useful to extend the boiling point data to higher temperaturesthan are possible in the fractionating distillation method previously de-scribed, and for this purpose a vacuum distillation in a simple still with no fractionating column (ASTM D-1160) can be carried out. This distilla-tion, which is done under fractionating conditions equivalent to one theo-retical plate, allows the boiling point data to be extended to about 600°C(1112°F) with many crude oils. This method gives useful comparative andreproducible results that are often accurate enough for refinery purposes,provided significant cracking does not occur.
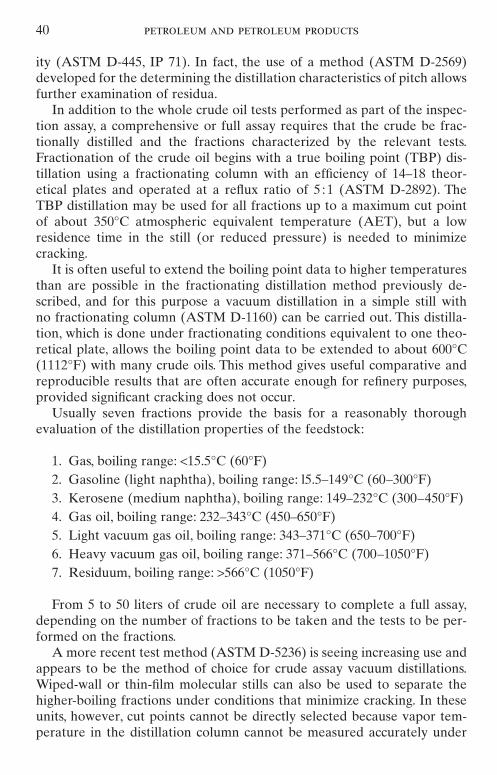
Usually seven fractions provide the basis for a reasonably thorough evaluation of the distillation properties of the feedstock:
1. Gas, boiling range: <15.5°C (60°F)2. Gasoline (light naphtha), boiling range: l5.5–149°C (60–300°F)3. Kerosene (medium naphtha), boiling range: 149–232°C (300–450°F)4. Gas oil, boiling range: 232–343°C (450–650°F)5. Light vacuum gas oil, boiling range: 343–371°C (650–700°F)6. Heavy vacuum gas oil, boiling range: 371–566°C (700–1050°F)7. Residuum, boiling range: >566°C (1050°F)
From 5 to 50 liters of crude oil are necessary to complete a full assay,depending on the number of fractions to be taken and the tests to be per-formed on the fractions.
A more recent test method (ASTM D-5236) is seeing increasing use andappears to be the method of choice for crude assay vacuum distillations.Wiped-wall or thin-film molecular stills can also be used to separate thehigher-boiling fractions under conditions that minimize cracking. In theseunits, however, cut points cannot be directly selected because vapor tem-perature in the distillation column cannot be measured accurately under
40 petroleum and petroleum products
operating conditions. Instead, the wall (film) temperature, pressure, andfeed rate that will produce a fraction with a given end point are determinedfrom in-house correlations developed by matching yields between thewiped-wall distillation and the conventional distillation (ASTM D-l160,ASTM D-5236). And wiped-wall stills are often used because they allowhigher end points and can easily provide sufficient quantities of the frac-tions for characterization purposes.
2.2.4. Light Hydrocarbons
The amount of the individual light hydrocarbons in petroleum (methane tobutane or pentane) is often included as part of the preliminary assay.
Although one of the more conventional distillation procedures might beused, the determination of light hydrocarbons in petroleum is best is carriedout with a gas chromatographic method (ASTM D-2427).
2.2.5. Metallic Constituents
Petroleum, as recovered from the reservoir, contains metallic constituentsbut also picks up metallic constituents during recovery, transportation, andstorage. Even trace amounts of these metals can be deleterious to refiningprocesses, especially processes in which catalysts are used. Trace compo-nents, such as metallic constituents, can also produce adverse effects inrefining either (1) by causing corrosion or (2) by affecting the quality ofrefined products.
Hence, it is important to have test methods that can determine metals,both at trace levels and at major concentrations. Thus test methods haveevolved that are used for the determination of specific metals as well as themultielement methods of determination using techniques such as atomicabsorption spectrometry, inductively coupled plasma atomic emission spec-trometry, and X-ray fluorescence spectroscopy.
Nickel and vanadium along with iron and sodium (from the brine) arethe major metallic constituents of crude oil.These metals can be determinedby atomic absorption spectrophotometric methods (ASTM D-5863, IP 285,IP 288, IP 465), wavelength-dispersive X-ray fluorescence spectrometry (IP433), and inductively coupled plasma emission spectrometry (ICPES).Several other analytical methods are available for the routine determina-tion of trace elements in crude oil, some of which allow direct aspiration ofthe samples (diluted in a solvent) instead of time-consuming sample prepa-ration procedures such as wet ashing (acid decomposition) or flame or dryashing (removal of volatile/combustible constituents) (ASTM D-5863).Among the techniques used for trace element determinations are conduc-tivity (IP 265), flameless and flame atomic absorption (AA) spectropho-
petroleum assay 41
tometry (ASTM D-2788, ASTM D-5863), and inductively coupled argonplasma (ICP) spectrophotometry (ASTM D-5708).
Inductively coupled argon plasma emission spectrophotometry (ASTMD-5708) has an advantage over atomic absorption spectrophotometry(ASTM D-4628, ASTM D-5863) because it can provide more complete ele-mental composition data than the atomic absorption method. Flame emis-sion spectroscopy is often used successfully in conjunction with atomicabsorption spectrophotometry (ASTM D-3605). X-ray fluorescence spec-trophotometry (ASTM D-4927,ASTM D-6443) is also sometimes used, butmatrix effects can be a problem.
The method to be used for the determination of metallic constituents inpetroleum is often a matter of individual preference.
2.2.6. Salt Content
The salt content of crude oil is highly variable and results principally fromproduction practices used in the field and, to a lesser extent, from its handling aboard the tankers bringing it to terminals. The bulk of the saltpresent will be dissolved in coexisting water and can be removed indesalters, but small amounts of salt may be dissolved in the crude oil itself.Salt may be derived from reservoir or formation waters or from otherwaters used in secondary recovery operations.Aboard tankers, ballast waterof varying salinity may also be a source of salt contamination.
Salt in crude oil may be deleterious in several ways. Even in small con-centrations, salts will accumulate in stills, heaters, and exchangers, lead-ing to fouling that requires expensive cleanup. More importantly, duringflash vaporization of crude oil certain metallic salts can be hydrolyzed tohydrochloric acid according to the following reactions:
2NaCl + H2O Æ 2 HCl + Na2O
MgCl2 + H2O Æ 2 HCl + MgO
The hydrochloric acid evolved is extremely corrosive, necessitating theinjection of a basic compound, such as ammonia, into the overhead lines tominimize corrosion damage. Salts and evolved acids can also contaminateboth overhead and residual products, and certain metallic salts can de-activate catalysts.
Thus knowledge of the content of salt in crude oil is important in decid-ing whether and to what extent the crude oil needs desalting.
The salt content is determined by potentiometric titration in a non-aqueous solution in which the conductivity of a solution of crude oil in apolar solvent is compared with that of a series of standard salt solutions in
42 petroleum and petroleum products
the same solvent (ASTM D-3230). In this method, the sample is dissolvedin a mixed solvent and placed in a test cell consisting of a beaker and twoparallel stainless steel plates. An alternating voltage is passed through theplates, and the salt content is obtained by reference to a calibration curveof the relationship of salt content of known mixtures to the current.
It is necessary, however, to use other methods, such as atomic absorp-tion, inductively coupled argon plasma emission spectrophotometry, andion chromatography to determine the composition of the salts present. Amethod involving application of extraction and volumetric titration is alsoused (IP 77).
2.2.7. Sulfur Content
Sulfur is present in petroleum as sulfides, thiophenes, benzothiophenes, anddibenzothiophenes. In most cases, the presence of sulfur is detrimental to theprocessing because sulfur can act as catalytic poisons during processing.
The sulfur content of petroleum is an important property and varieswidely within the rough limits 0.1% w/w to 3.0% w/w, and a sulfur contentup to 8.0% w/w has been noted for tar sand bitumen. Compounds con-taining this element are among the most undesirable constituents of pe-troleum because they can give rise to plant corrosion and atmosphericpollution. Petroleum can evolve hydrogen sulfide during distillation as wellas low-boiling sulfur compounds.
Hydrogen sulfide may be evolved during the distillation process eitherfrom free hydrogen sulfide in the feedstocks or because of low-temperaturethermal decomposition of sulfur compounds; the latter is less likely thanthe former. Generally, however, the sulfur compounds concentrate in thedistillation residue (Speight, 2000), the volatile sulfur compounds in the distillates being removed by such processes as hydrofining and caustic wash-ing (Speight, 1999). The sulfur content of fuels obtained from petroleumresidua and the atmospheric pollution arising from the use of these fuels isan important factor in petroleum utilization, so that the increasing insis-tence on a low-sulfur-content fuel oil has increased the value of low-sulfurpetroleum.
Sulfur compounds contribute to corrosion of refinery equipment and poi-soning of catalysts, cause corrosiveness in refined products, and contributeto environmental pollution as a result of the combustion of fuel products.Sulfur compounds may be present throughout the boiling range of crude oilsalthough, as a rule, they are more abundant in the higher-boiling fractions.In some crude oils, thermally labile sulfur compounds can decompose onheating to produce hydrogen sulfide, which is corrosive and toxic.
A considerable number of tests are available to estimate the sulfur inpetroleum or to study its effect on various products. Hydrogen sulfide dis-
petroleum assay 43
solved in petroleum is normally determined by absorption of the hydrogensulfide in a suitable solution that is subsequently analyzed chemically(Doctor method) (ASTM, D-4952, IP 30) or by the formation of cadmiumsulfate (IP 103).
The Doctor test measures the amount of sulfur available to react withmetallic surfaces at the temperature of the test. The rates of reaction aremetal type-, temperature-, and time dependent. In the test, a sample istreated with copper powder at 149°C or 300°F. The copper powder is filtered from the mixture. Active sulfur is calculated from the differencebetween the sulfur contents of the sample (ASTM D-129) before and aftertreatment with copper.
Sulfur that is chemically combined as an organic constituent of crude isusually estimated by oxidizing a sample in a bomb and converting the sulfurcompounds to barium sulfate that is determined gravimetrically (ASTM D-129, IP 61). This method is applicable to any sample of sufficiently lowvolatility (e.g., a residuum or tar sand bitumen) that can be weighed accu-rately in an open sample boat and that contains at least 0.1% sulfur. In thismethod, the sample is oxidized by combustion in a pressure vessel (bomb)containing oxygen under pressure. The sulfur in the sample is converted to sulfate and from the bomb washings is gravimetrically determined asbarium sulfate. However, the method is not applicable to samples contain-ing elements that give residues, other than barium sulfate, that are inso-luble in dilute hydrochloric acid and would interfere in the precipitationstep. In addition, the method is also subject to inaccuracies that arise frominterference by the sediment inherently present in petroleum.
Until recently, one of the most widely used methods for determinationof total sulfur content has been combustion of a sample in oxygen toconvert the sulfur to sulfur dioxide, which is collected and subsequentlytitrated iodometrically or detected by nondispersive infrared (ASTM D-1552). This method is particularly applicable to heavier oil and fractionssuch as residua that boil above 177°C (350°F) and contain more than 0.06%w/w sulfur. In addition, the sulfur content of petroleum coke containing upto 8% w/w sulfur can be determined.
In the iodate detection system, the sample is burned in a stream ofoxygen at a sufficiently high temperature to convert the sulfur to sulfurdioxide.The combustion products are passed into an absorber that containsan acidic solution of potassium iodide and starch indicator. A faint bluecolor is developed in the absorber solution by the addition of standardpotassium iodate solution and as combustion proceeds, bleaching the bluecolor, more iodate is added. From the amount of standard iodate consumedduring the combustion, the sulfur content of the sample is calculated.
In the infrared detection system, the sample is weighed into a specialceramic boat that is then placed into a combustion furnace at 1371°C
44 petroleum and petroleum products
(2500°F) in an oxygen atmosphere. Moisture and dust are removed withtraps, and the sulfur dioxide is measured with an infrared detector.
The lamp combustion method (ASTM D-1266, IP 107) and the Wickbold combustion method (IP 243) are used for the determination of sulfur in petroleum and as trace quantities of total sulfur in petroleumproducts and are related to various other methods (ASTM D-2384, ASTMD-2784, ASTM D-2785, ASTM D-4045)
In the lamp method (ASTM D-1266, IP 107), a sample is burned in aclosed system using a suitable lamp and an artificial atmosphere composedof 70% carbon dioxide and 30% oxygen to prevent formation of nitrogenoxides.The sulfur oxides are absorbed and oxidized to sulfuric acid (H2SO4)by means of hydrogen peroxide (H2O2) solution that is then flushed withair to remove dissolved carbon dioxide. Sulfur as sulfate in the absorbentis determined acidimetrically by titration with standard sodium hydroxide(NaOH) solution. Alternatively, the sample can be burned in air and thesulfur as sulfate in the absorbent determined gravimetrically as bariumsulfate (BaSO4) after precipitation. If the sulfur content of the sample isless than 0.01% w/w, it is necessary to determine sulfur in the absorber solu-tion turbidimetrically as barium sulfate.
The older, classic techniques for sulfur determination are being sup-planted by two instrumental methods (ASTM D-2622,ASTM D-4294,IP 447).
In the first method (ASTM D-2622), the sample is placed in an X-raybeam, and the peak intensity of the sulfur Ka line at 5.373Å is measured.The background intensity, measured at 5.190Å, is subtracted from the peakintensity, and the resultant net counting rate is then compared with a pre-viously prepared calibration curve or equation to obtain the sulfur con-centration in % w/w.
The second method (ASTM D-4294, IP 477) uses energy-dispersive X-ray fluorescence spectroscopy, has slightly better repeatability and repro-ducibility than the high-temperature method, and is adaptable to fieldapplications but can be affected by some commonly present interferencessuch as halides. In this method, the sample is placed in a beam emitted froman X-ray source. The resultant excited characteristic X radiation is meas-ured, and the accumulated count is compared with counts from previouslyprepared calibration standard to obtain the sulfur concentration. Twogroups of calibration standards are required to span the concentrationrange, one standard ranges from 0.015% to 0.1% w/w sulfur and the otherfrom 0.1% to 5.0% w/w sulfur.
2.2.8. Viscosity and Pour Point
Viscosity and pour point determinations are performed principally to ascer-tain the handling (flow) characteristics of petroleum at low temperatures.
petroleum assay 45
There are, however, some general relationships of crude oil compositionthat can be derived from pour point and viscosity data. Commonly, thelower the pour point of a crude oil the more aromatic it is, and the higherthe pour point the more paraffinic it is.
Viscosity is usually determined at different temperatures (e.g., 25°C/77°F,and 100°C/212°F) by measuring the time for a volume of liquid to flowunder gravity through a calibrated glass capillary viscometer (ASTM D-445).
In the test, the time for a fixed volume of liquid to flow under gravitythrough the capillary of a calibrated viscometer under a reproducibledriving head and at a closely controlled temperature is measured in seconds.The kinematic viscosity is the product of the measured flow time and thecalibration constant of the viscometer. Conversion of the kinematic viscos-ity in centistokes (cSt) at any temperature to Saybolt Universal viscosity inSaybolt Universal seconds (SUS) at the same temperature and for con-verting kinematic viscosity in centistokes at 122 and 210°F to Saybolt Furolviscosity in Saybolt Furol seconds (SFS) at the same temperatures (ASTMD-2161) is avaibale through formulae.
The viscosity index (ASTM D-2270, IP 226) is a widely used measure of the variation in kinematic viscosity due to changes in the temperature ofpetroleum between 40°C and 100°C (104°F and 212°F). For crude oils ofsimilar kinematic viscosity, the higher the viscosity index the smaller is theeffect of temperature on its kinematic viscosity. The accuracy of the calcu-lated viscosity index is dependent only on the accuracy of the original vis-cosity determination.
The pour point of petroleum is an index of the lowest temperature atwhich the crude oil will flow under specified conditions. The maximum andminimum pour point temperatures provide a temperature window wherepetroleum, depending on its thermal history, might appear in the liquid aswell as the solid state. The pour point data can be used to supplement othermeasurements of cold flow behavior, and the data are particularly usefulfor the screening of the effect of wax interaction modifiers on the flowbehavior of petroleum.
In the original (and still widely used) test for pour point (ASTM D-97,IP 15), a sample is cooled at a specified rate and examined at intervals of3°C (5.4°F) for flow characteristics. The lowest temperature at which themovement of the oil is observed is recorded as the pour point.
A later test method (ASTM D-5853) covers two procedures for thedetermination of the pour point of crude oils down to –36°C. One methodprovides a measure of the maximum (upper) pour point temperature. Thesecond method measures the minimum (lower) pour point temperature. Inthese methods, the test specimen is cooled (after preliminary heating) at aspecified rate and examined at intervals of 3°C (5.4°F) for flow character-
46 petroleum and petroleum products
istics. Again, the lowest temperature at which movement of the test speci-men is observed is recorded as the pour point.
In any determination of the pour point, petroleum that contains wax pro-duces an irregular flow behavior when the wax begins to separate. Suchpetroleum possesses viscosity relationships that are difficult to predict inpipeline operation. In addition, some waxy petroleum is sensitive to heattreatment that can also affect the viscosity characteristics. This complexbehavior limits the value of viscosity and pour point tests on waxy petro-leum. However, laboratory pumpability tests (ASTM D-3245, IP 230) areavailable that give an estimate of minimum handling temperature andminimum line or storage temperature.
2.2.9. Water and Sediment
Considerable importance is attached to the presence of water or sedimentin petroleum because they lead to difficulties in the refinery, for example,corrosion of equipment, uneven running on the distillation unit, blockagesin heat exchangers, and adverse effects on product quality.
The water and sediment content of crude oil, like salt, results from pro-duction and transportation practices. Water, with its dissolved salts, mayoccur as easily removable suspended droplets or as an emulsion. The sedi-ment dispersed in crude oil may be comprised of inorganic minerals fromthe production horizon or from drilling fluids and scale and rust frompipelines and tanks used for oil transportation and storage. Usually wateris present in far greater amounts than sediment, but, collectively, it isunusual for them to exceed 1% of the crude oil on a delivered basis. Likesalt, water and sediment can foul heaters, stills, and exchangers and can con-tribute to corrosion and to deleterious product quality. Also, water and sediment are principal components of the sludge that accumulates instorage tanks and must be disposed of periodically in an environmentallyacceptable manner. Knowledge of the water and sediment content is alsoimportant in accurately determining net volumes of crude oil in sales,taxation, exchanges, and custody transfers.
The sediment consists of finely divided solids that may be drilling mudor sand or scale picked up during the transport of the oil or may consist ofchlorides derived from evaporation of brine droplets in the oil. The solidsmay be dispersed in the oil or carried in water droplets. Sediment in petro-leum can lead to serious plugging of equipment, corrosion due to chloridedecomposition, and a lowering of residual fuel quality.
Water may be found in the crude either in an emulsified form or in largedroplets and can cause flooding of distillation units and excessive accumu-lation of sludge in tanks. Refiners generally limit the quantity, and althoughsteps are normally taken at the oil field to reduce the water content as much
petroleum assay 47
as possible, water may be introduced later during shipment. In any form,water and sediment are highly undesirable in a refinery feedstock, and therelevant tests involving distillation (ASTM D-95, ASTM D-4006, IP 74, IP358), centrifuging (ASTM D-96, ASTM D-4007), extraction (ASTM D-473,IP 53), and the Karl Fischer titration (ASTM D-4377, ASTM D-4928, IP356, IP 386, IP 438, IP 439) are regarded as important in petroleum qualityexaminations.
Before the assay it is sometimes necessary to separate the water from apetroleum sample. Certain types of petroleum, notably heavy oil, often formpersistent emulsions that are difficult to separate. On the other hand, intesting wax-bearing petroleum for sediment and water care must be takento ensure that wax suspended in the sample is brought into solution beforethe test; otherwise it will be recorded as sediment.
The Karl Fischer test method (ASTM D-1364,ASTM D-6304) covers thedirect determination of water in petroleum. In the test, the sample injec-tion in the titration vessel can be performed on a volumetric or gravimetricbasis.Viscous samples can be analyzed with a water vaporizer accessory thatheats the sample in the evaporation chamber, and the vaporized water iscarried into the Karl Fischer titration cell by a dry, inert carrier gas.
Water and sediment in petroleum can be determined simultaneously(ASTM D-96, ASTM D-4007, IP 359) by the centrifuge method. Knownvolumes of petroleum and solvent are placed in a centrifuge tube andheated to 60°C (140°F). After centrifugation, the volume of the sediment-and-water layer at the bottom of the tube is read. For petroleum that con-tains wax, a temperature of 71°C (160°F) or higher may be required tocompletely melt the wax crystals so that they are not measured as sediment.
Sediment is also determined by an extraction method (ASTM D-473, IP53) or by membrane filtration (ASTM D-4807). In the former method(ASTM D-473, IP 53), an oil sample contained in a refractory thimble isextracted with hot toluene until the residue reaches a constant mass. In thelatter test, the sample is dissolved in hot toluene and filtered under vacuumthrough a 0.45-mm-porosity membrane filter. The filter with residue iswashed, dried, and weighed.
2.2.10. Wax Content
Petroleum with a high wax content presents difficulties in handling andpumping as well as producing distillate and residual fuels of high pour pointand lubricating oils that are costly to dewax.
All the standard methods for the determination of wax involve precipi-tating the wax from solvents such as methylene chloride or acetone underspecified conditions of solvent-to-oil ratio and temperature. Measurementssuch as these give comparative results that are often useful in characteriz-
48 petroleum and petroleum products
ing the wax content of petroleum or for investigating factors involved inflow problems.
On the other hand, the wax appearance point (ASTM D-3117) may bedetermined by cooling of a sample under prescribed conditions with stir-ring. The temperature at which the wax first appears is the wax appearancepoint.
2.2.11. Other Tests
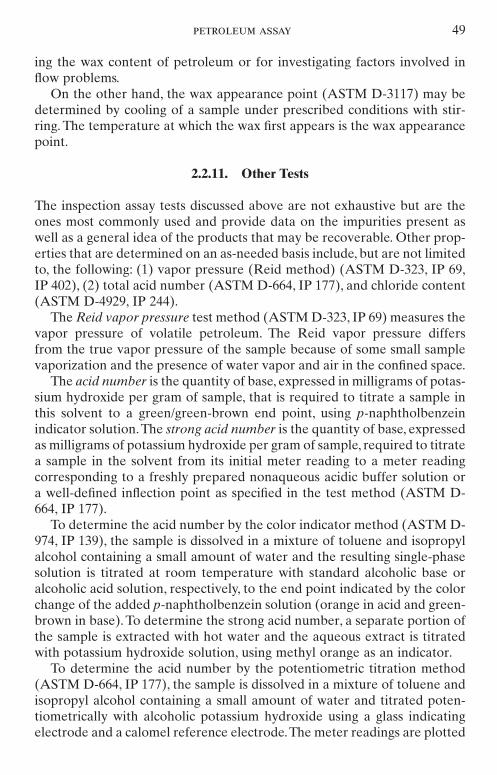
The inspection assay tests discussed above are not exhaustive but are theones most commonly used and provide data on the impurities present aswell as a general idea of the products that may be recoverable. Other prop-erties that are determined on an as-needed basis include, but are not limitedto, the following: (1) vapor pressure (Reid method) (ASTM D-323, IP 69,IP 402), (2) total acid number (ASTM D-664, IP 177), and chloride content(ASTM D-4929, IP 244).
The Reid vapor pressure test method (ASTM D-323, IP 69) measures thevapor pressure of volatile petroleum. The Reid vapor pressure differs from the true vapor pressure of the sample because of some small samplevaporization and the presence of water vapor and air in the confined space.
The acid number is the quantity of base, expressed in milligrams of potas-sium hydroxide per gram of sample, that is required to titrate a sample inthis solvent to a green/green-brown end point, using p-naphtholbenzeinindicator solution.The strong acid number is the quantity of base, expressedas milligrams of potassium hydroxide per gram of sample, required to titratea sample in the solvent from its initial meter reading to a meter readingcorresponding to a freshly prepared nonaqueous acidic buffer solution ora well-defined inflection point as specified in the test method (ASTM D-664, IP 177).
To determine the acid number by the color indicator method (ASTM D-974, IP 139), the sample is dissolved in a mixture of toluene and isopropylalcohol containing a small amount of water and the resulting single-phasesolution is titrated at room temperature with standard alcoholic base oralcoholic acid solution, respectively, to the end point indicated by the colorchange of the added p-naphtholbenzein solution (orange in acid and green-brown in base). To determine the strong acid number, a separate portion ofthe sample is extracted with hot water and the aqueous extract is titratedwith potassium hydroxide solution, using methyl orange as an indicator.
To determine the acid number by the potentiometric titration method(ASTM D-664, IP 177), the sample is dissolved in a mixture of toluene andisopropyl alcohol containing a small amount of water and titrated poten-tiometrically with alcoholic potassium hydroxide using a glass indicatingelectrode and a calomel reference electrode.The meter readings are plotted
petroleum assay 49
manually or automatically against the respective volumes of titrating solu-tion, and the end points are taken only at well-defined inflections in theresulting curve. When no definite inflections are obtained, end points aretaken at meter readings corresponding to those found for freshly preparednonaqueous acidic and basic buffer solutions.
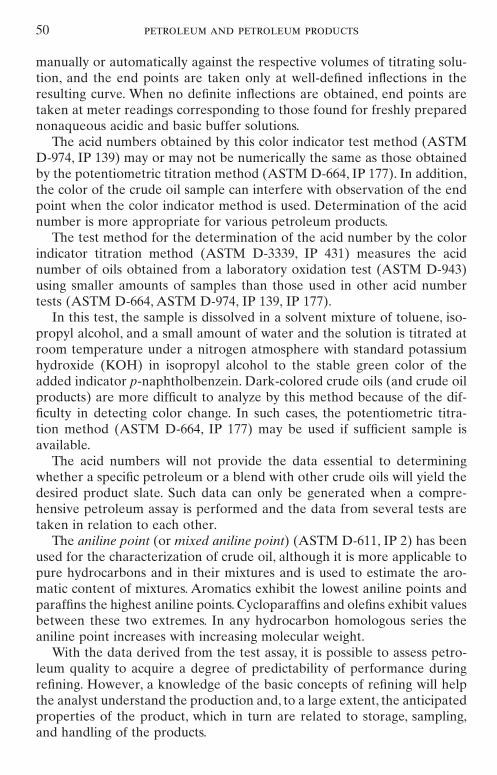
The acid numbers obtained by this color indicator test method (ASTMD-974, IP 139) may or may not be numerically the same as those obtainedby the potentiometric titration method (ASTM D-664, IP 177). In addition,the color of the crude oil sample can interfere with observation of the endpoint when the color indicator method is used. Determination of the acidnumber is more appropriate for various petroleum products.
The test method for the determination of the acid number by the colorindicator titration method (ASTM D-3339, IP 431) measures the acidnumber of oils obtained from a laboratory oxidation test (ASTM D-943)using smaller amounts of samples than those used in other acid numbertests (ASTM D-664, ASTM D-974, IP 139, IP 177).
In this test, the sample is dissolved in a solvent mixture of toluene, iso-propyl alcohol, and a small amount of water and the solution is titrated atroom temperature under a nitrogen atmosphere with standard potassiumhydroxide (KOH) in isopropyl alcohol to the stable green color of theadded indicator p-naphtholbenzein. Dark-colored crude oils (and crude oilproducts) are more difficult to analyze by this method because of the dif-ficulty in detecting color change. In such cases, the potentiometric titra-tion method (ASTM D-664, IP 177) may be used if sufficient sample isavailable.
The acid numbers will not provide the data essential to determiningwhether a specific petroleum or a blend with other crude oils will yield thedesired product slate. Such data can only be generated when a compre-hensive petroleum assay is performed and the data from several tests aretaken in relation to each other.
The aniline point (or mixed aniline point) (ASTM D-611, IP 2) has beenused for the characterization of crude oil, although it is more applicable topure hydrocarbons and in their mixtures and is used to estimate the aro-matic content of mixtures. Aromatics exhibit the lowest aniline points andparaffins the highest aniline points. Cycloparaffins and olefins exhibit valuesbetween these two extremes. In any hydrocarbon homologous series theaniline point increases with increasing molecular weight.
With the data derived from the test assay, it is possible to assess petro-leum quality to acquire a degree of predictability of performance duringrefining. However, a knowledge of the basic concepts of refining will helpthe analyst understand the production and, to a large extent, the anticipatedproperties of the product, which in turn are related to storage, sampling,and handling of the products.
50 petroleum and petroleum products
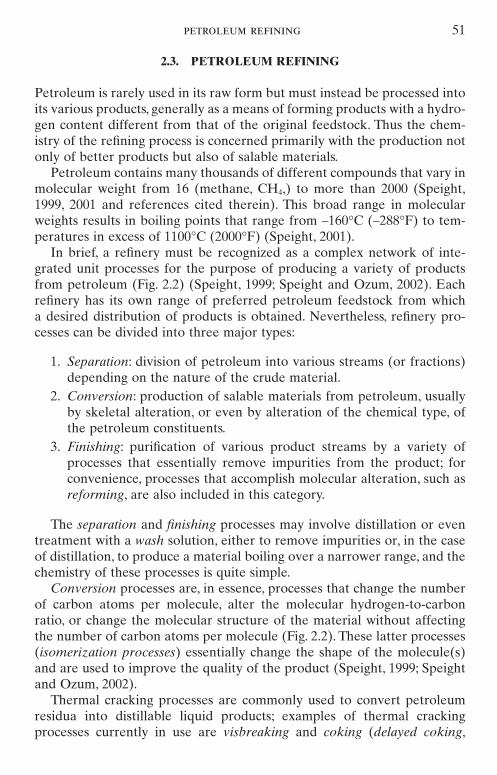
2.3. PETROLEUM REFINING
Petroleum is rarely used in its raw form but must instead be processed intoits various products, generally as a means of forming products with a hydro-gen content different from that of the original feedstock. Thus the chem-istry of the refining process is concerned primarily with the production notonly of better products but also of salable materials.
Petroleum contains many thousands of different compounds that vary inmolecular weight from 16 (methane, CH4,) to more than 2000 (Speight,1999, 2001 and references cited therein). This broad range in molecularweights results in boiling points that range from –160∞C (–288∞F) to tem-peratures in excess of 1100°C (2000∞F) (Speight, 2001).
In brief, a refinery must be recognized as a complex network of inte-grated unit processes for the purpose of producing a variety of productsfrom petroleum (Fig. 2.2) (Speight, 1999; Speight and Ozum, 2002). Eachrefinery has its own range of preferred petroleum feedstock from which a desired distribution of products is obtained. Nevertheless, refinery pro-cesses can be divided into three major types:
1. Separation: division of petroleum into various streams (or fractions)depending on the nature of the crude material.
2. Conversion: production of salable materials from petroleum, usuallyby skeletal alteration, or even by alteration of the chemical type, ofthe petroleum constituents.
3. Finishing: purification of various product streams by a variety ofprocesses that essentially remove impurities from the product; forconvenience, processes that accomplish molecular alteration, such asreforming, are also included in this category.
The separation and finishing processes may involve distillation or eventreatment with a wash solution, either to remove impurities or, in the caseof distillation, to produce a material boiling over a narrower range, and thechemistry of these processes is quite simple.
Conversion processes are, in essence, processes that change the numberof carbon atoms per molecule, alter the molecular hydrogen-to-carbonratio, or change the molecular structure of the material without affectingthe number of carbon atoms per molecule (Fig. 2.2). These latter processes(isomerization processes) essentially change the shape of the molecule(s)and are used to improve the quality of the product (Speight, 1999; Speightand Ozum, 2002).
Thermal cracking processes are commonly used to convert petroleumresidua into distillable liquid products; examples of thermal crackingprocesses currently in use are visbreaking and coking (delayed coking,
petroleum refining 51
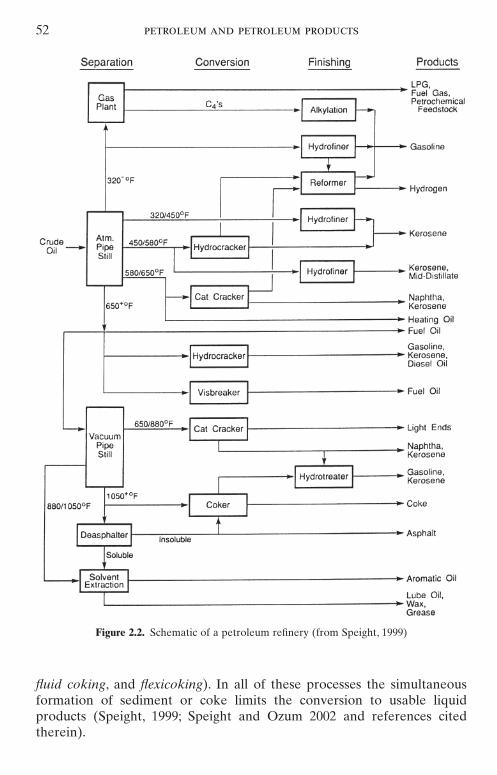
fluid coking, and flexicoking). In all of these processes the simultaneousformation of sediment or coke limits the conversion to usable liquid products (Speight, 1999; Speight and Ozum 2002 and references citedtherein).
52 petroleum and petroleum products
Figure 2.2. Schematic of a petroleum refinery (from Speight, 1999)
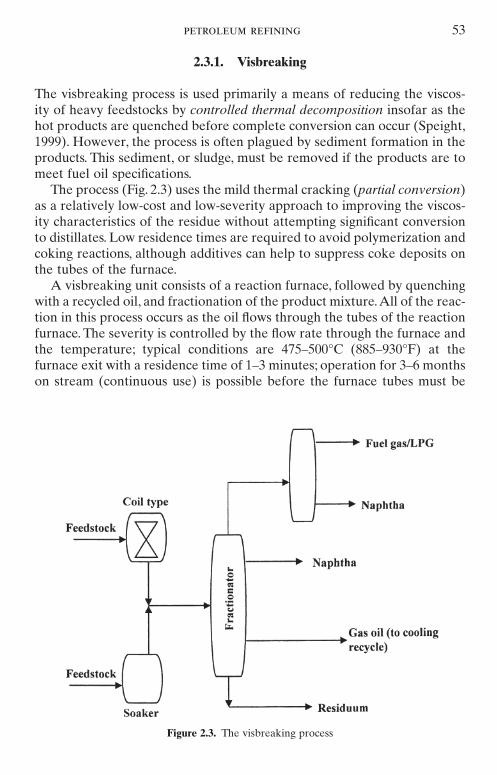
2.3.1. Visbreaking
The visbreaking process is used primarily a means of reducing the viscos-ity of heavy feedstocks by controlled thermal decomposition insofar as thehot products are quenched before complete conversion can occur (Speight,1999). However, the process is often plagued by sediment formation in theproducts. This sediment, or sludge, must be removed if the products are tomeet fuel oil specifications.
The process (Fig. 2.3) uses the mild thermal cracking (partial conversion)as a relatively low-cost and low-severity approach to improving the viscos-ity characteristics of the residue without attempting significant conversionto distillates. Low residence times are required to avoid polymerization andcoking reactions, although additives can help to suppress coke deposits onthe tubes of the furnace.
A visbreaking unit consists of a reaction furnace, followed by quenchingwith a recycled oil, and fractionation of the product mixture.All of the reac-tion in this process occurs as the oil flows through the tubes of the reactionfurnace. The severity is controlled by the flow rate through the furnace andthe temperature; typical conditions are 475–500°C (885–930°F) at thefurnace exit with a residence time of 1–3 minutes; operation for 3–6 monthson stream (continuous use) is possible before the furnace tubes must be
petroleum refining 53
Figure 2.3. The visbreaking process
cleaned and the coke removed. The operating pressure in the furnace tubescan range from 0.7 to 5 MPa depending on the degree of vaporization andthe residence time desired. For a given furnace tube volume, a lower oper-ating pressure will reduce the actual residence time of the liquid phase.
2.3.2. Coking
Coking, as the term is used in the petroleum industry, is a process for con-verting nondistillable fractions (residua) of petroleum to lower-boilingproducts and coke. Coking is often used in preference to catalytic crackingbecause of the presence of metals and nitrogen components that poison catalysts (Speight and Ozum, 2002).
There are several coking processes: delayed coking, fluid coking, and flexicoking as well as several other variations.
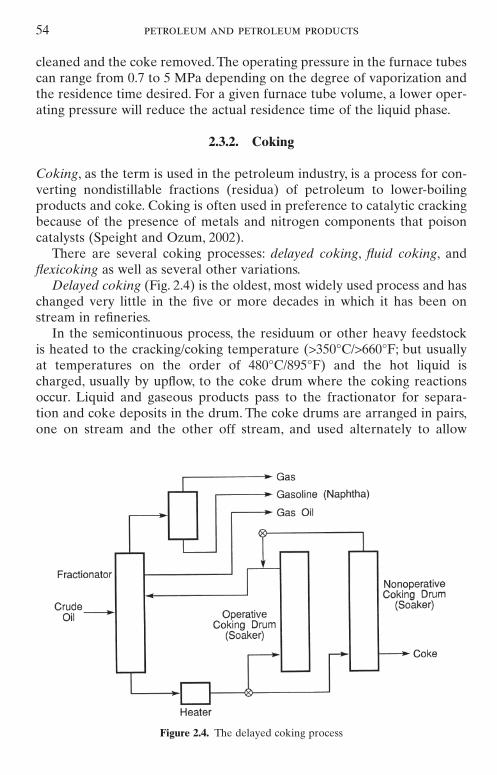
Delayed coking (Fig. 2.4) is the oldest, most widely used process and haschanged very little in the five or more decades in which it has been onstream in refineries.
In the semicontinuous process, the residuum or other heavy feedstockis heated to the cracking/coking temperature (>350°C/>660°F; but usuallyat temperatures on the order of 480°C/895°F) and the hot liquid ischarged, usually by upflow, to the coke drum where the coking reactionsoccur. Liquid and gaseous products pass to the fractionator for separa-tion and coke deposits in the drum. The coke drums are arranged in pairs,one on stream and the other off stream, and used alternately to allow
54 petroleum and petroleum products
Figure 2.4. The delayed coking process
continuous processing. The process can be operated on a cycle, typically24–48 hours.
The overhead oil is fractionated into fuel gas (ethane and lower-molecular-weight gases), propane-propylene, butane-butene, naphtha, lightgas oil, and heavy gas oil. Yields and product quality vary widely becauseof the broad range of feedstock types charged to delayed coking. The function of the coke drum is to provide the residence time required for thecoking reactions and to accumulate the coke. Hydraulic cutters are used toremove coke from the drum.
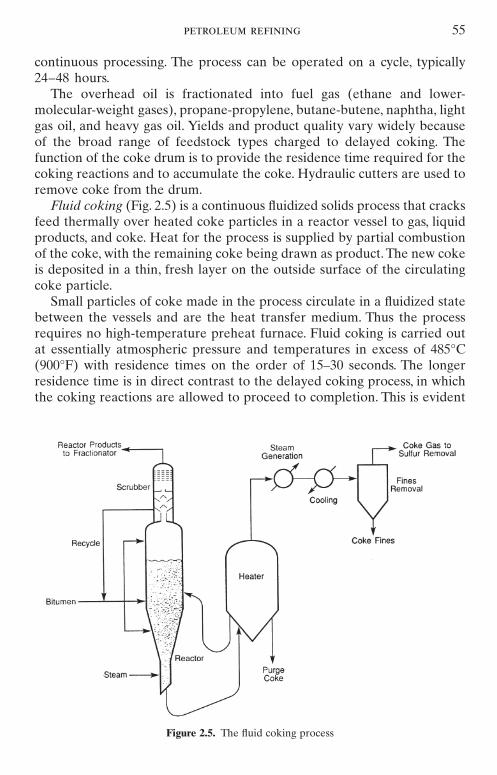
Fluid coking (Fig. 2.5) is a continuous fluidized solids process that cracksfeed thermally over heated coke particles in a reactor vessel to gas, liquidproducts, and coke. Heat for the process is supplied by partial combustionof the coke, with the remaining coke being drawn as product. The new cokeis deposited in a thin, fresh layer on the outside surface of the circulatingcoke particle.
Small particles of coke made in the process circulate in a fluidized statebetween the vessels and are the heat transfer medium. Thus the processrequires no high-temperature preheat furnace. Fluid coking is carried outat essentially atmospheric pressure and temperatures in excess of 485°C(900°F) with residence times on the order of 15–30 seconds. The longer residence time is in direct contrast to the delayed coking process, in whichthe coking reactions are allowed to proceed to completion. This is evident
petroleum refining 55
Figure 2.5. The fluid coking process
from the somewhat higher liquid yields observed in many fluid cokingprocesses. However, the products from a fluid coker may be somewhat moreolefinic and slightly less desirable for downstream processing. The flexicok-ing process is a modification of the fluid coking process that includes a gasi-fier adjoining the burner/regenerator to convert excess coke to a clean fuelgas with a heating value of about 90 Btu/ft3. The coke gasification can becontrolled to burn about 95% of the coke to maximize production of cokegas or to operate at a reduced level to produce both gas and a coke. Thisflexibility permits adjustment for coke market conditions over a consider-able range of feedstock properties.
The liquid products from the coker can, after cleanup via commerciallyavailable hydrodesulfurization technology (Speight, 2001), provide low-sulfur liquid fuels (less than 0.2% w/w sulfur). Coker naphtha has a boilingrange up to 220°C (430°F), are olefinic, and must be upgraded by hydrogenprocessing for removal of olefins, sulfur, and nitrogen. They are then usedconventionally for reforming to gasoline or chemicals feedstock. Middledistillates, boiling in the range of 220–360°C (430–680°F), are also hydro-gen treated for improved storage stability, sulfur removal, and nitrogenreduction. They can then be used as precursors to gasoline, diesel fuel, orfuel oil. The gas oil boiling up to 510°C (950°F) is usually low in metals andmay be used as the feedstock for fluid catalytic cracking.
Another major application for the coking processes is in upgradingheavy (high viscosity), low-value petroleum into lighter products.
Petroleum coke is used principally as a fuel or, after calcining, for carbonelectrodes. The feedstock from which the coke is produced controls thecoke properties, especially sulfur, nitrogen, and metal content. A concen-tration effect tends to deposit the majority of the sulfur, nitrogen, andmetals in the coke. Cokes exceeding about 2.5% sulfur content and 200 ppmvanadium are mainly used, environmental regulations permitting, for fuelor fuel additives. The properties of coke for non-fuel use include a lowsulfur, metal, and ash content as well as a definable physical structure.
2.3.3. Hydroprocessing
Hydroprocessing is the conversion of various feedstocks using the physicalaspects of temperature, residence time, and the presence of hydrogen underpressure. Hydroprocessing is more conveniently subdivided into hydrotreat-ing and hydrocracking.
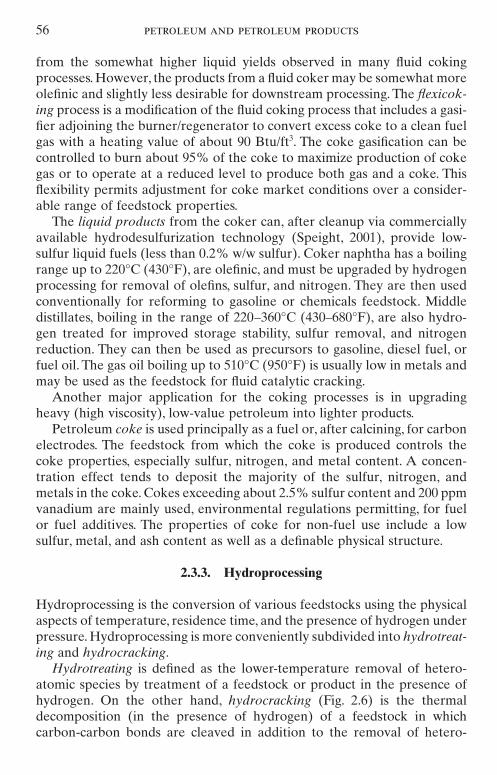
Hydrotreating is defined as the lower-temperature removal of hetero-atomic species by treatment of a feedstock or product in the presence ofhydrogen. On the other hand, hydrocracking (Fig. 2.6) is the thermaldecomposition (in the presence of hydrogen) of a feedstock in whichcarbon-carbon bonds are cleaved in addition to the removal of hetero-
56 petroleum and petroleum products
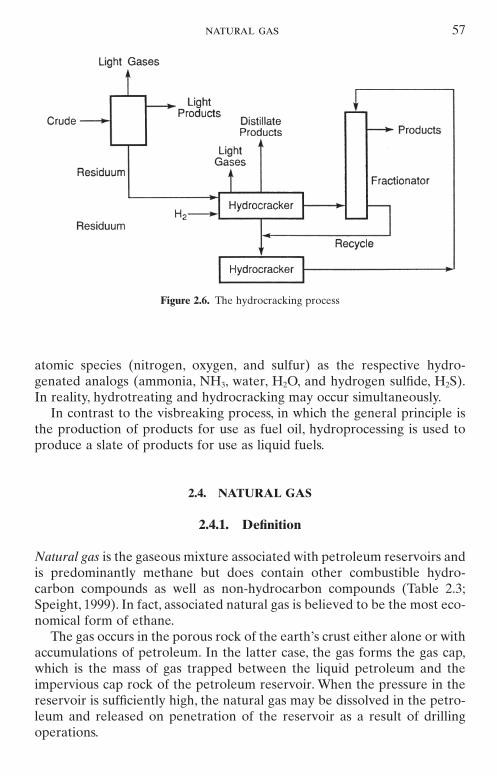
atomic species (nitrogen, oxygen, and sulfur) as the respective hydro-genated analogs (ammonia, NH3, water, H2O, and hydrogen sulfide, H2S).In reality, hydrotreating and hydrocracking may occur simultaneously.
In contrast to the visbreaking process, in which the general principle isthe production of products for use as fuel oil, hydroprocessing is used toproduce a slate of products for use as liquid fuels.
2.4. NATURAL GAS
2.4.1. Definition
Natural gas is the gaseous mixture associated with petroleum reservoirs andis predominantly methane but does contain other combustible hydro-carbon compounds as well as non-hydrocarbon compounds (Table 2.3;Speight, 1999). In fact, associated natural gas is believed to be the most eco-nomical form of ethane.
The gas occurs in the porous rock of the earth’s crust either alone or withaccumulations of petroleum. In the latter case, the gas forms the gas cap,which is the mass of gas trapped between the liquid petroleum and theimpervious cap rock of the petroleum reservoir. When the pressure in thereservoir is sufficiently high, the natural gas may be dissolved in the petro-leum and released on penetration of the reservoir as a result of drillingoperations.
natural gas 57
Figure 2.6. The hydrocracking process
The principal types of gaseous fuels are oil (distillation) gas, reformednatural gas, and reformed propane or liquefied petroleum gas (LPG). Mixedgas is a gas prepared by adding natural gas or LPG to a manufactured gas,giving a product of better utility and higher heat content or Btu value.
Liquefied petroleum gas (LPG) is the term applied to certain specifichydrocarbons and their mixtures, which exist in the gaseous state underatmospheric ambient conditions but can be converted to the liquid stateunder conditions of moderate pressure at ambient temperature.
Thus LPG is a hydrocarbon mixture containing propane (CH3CH2CH3),butane (CH3CH2CH2CH3), iso-butane [CH3CH(CH3)CH3] and to a lesserextent propylene (CH3CH:CH2), or butylene (CH3CH2CH:CH2). The mostcommon commercial products are propane, butane, or some mixture of thetwo and are generally extracted from natural gas or crude petroleum.Propylene and butylenes result from the cracking of other hydrocarbons ina petroleum refinery and are two important chemical feedstocks.
2.4.2. Composition
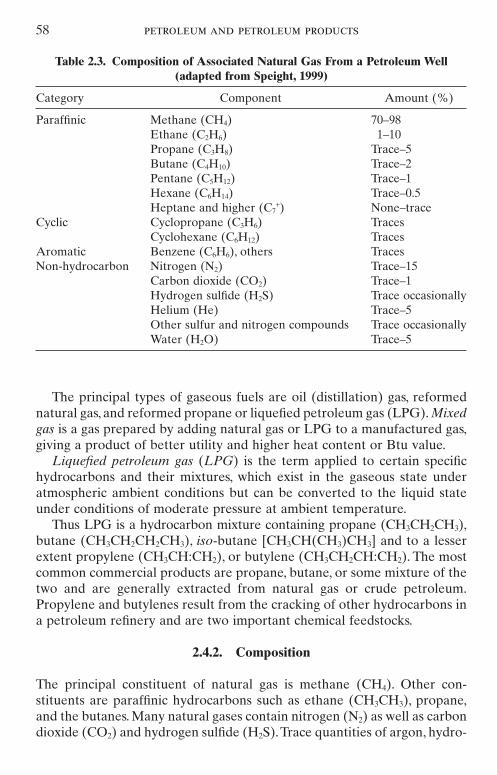
The principal constituent of natural gas is methane (CH4). Other con-stituents are paraffinic hydrocarbons such as ethane (CH3CH3), propane,and the butanes. Many natural gases contain nitrogen (N2) as well as carbondioxide (CO2) and hydrogen sulfide (H2S).Trace quantities of argon, hydro-
58 petroleum and petroleum products
Table 2.3. Composition of Associated Natural Gas From a Petroleum Well(adapted from Speight, 1999)
Category Component Amount (%)
Paraffinic Methane (CH4) 70–98Ethane (C2H6) 1–10Propane (C3H8) Trace–5Butane (C4H10) Trace–2Pentane (C5H12) Trace–1Hexane (C6H14) Trace–0.5Heptane and higher (C7
+) None–traceCyclic Cyclopropane (C3H6) Traces
Cyclohexane (C6H12) TracesAromatic Benzene (C6H6), others TracesNon-hydrocarbon Nitrogen (N2) Trace–15
Carbon dioxide (CO2) Trace–1Hydrogen sulfide (H2S) Trace occasionallyHelium (He) Trace–5Other sulfur and nitrogen compounds Trace occasionallyWater (H2O) Trace–5
gen, and helium may also be present. Generally, the hydrocarbons havinga higher molecular weight than methane, carbon dioxide, and hydrogensulfide are removed from natural gas before its use as a fuel. Gases pro-duced in a refinery contain methane, ethane, ethylene, propylene, hydrogen,carbon monoxide, carbon dioxide, and nitrogen, with low concentrations ofwater vapor, oxygen, and other gases.
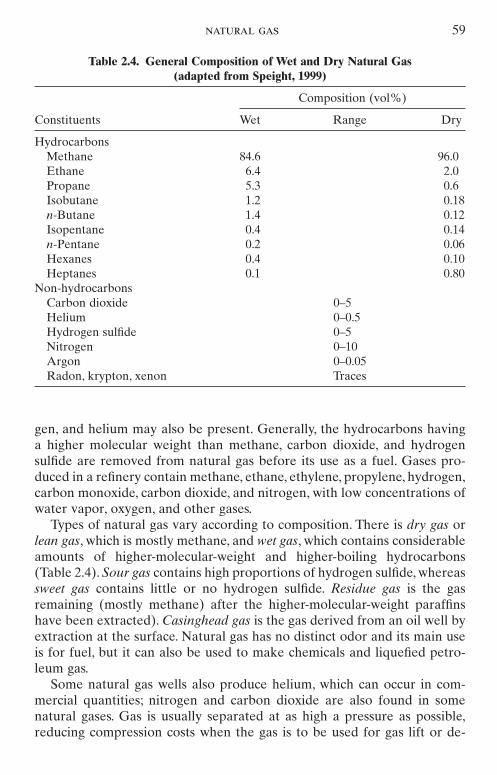
Types of natural gas vary according to composition. There is dry gas orlean gas, which is mostly methane, and wet gas, which contains considerableamounts of higher-molecular-weight and higher-boiling hydrocarbons(Table 2.4). Sour gas contains high proportions of hydrogen sulfide, whereassweet gas contains little or no hydrogen sulfide. Residue gas is the gasremaining (mostly methane) after the higher-molecular-weight paraffinshave been extracted). Casinghead gas is the gas derived from an oil well byextraction at the surface. Natural gas has no distinct odor and its main useis for fuel, but it can also be used to make chemicals and liquefied petro-leum gas.
Some natural gas wells also produce helium, which can occur in com-mercial quantities; nitrogen and carbon dioxide are also found in somenatural gases. Gas is usually separated at as high a pressure as possible,reducing compression costs when the gas is to be used for gas lift or de-
natural gas 59
Table 2.4. General Composition of Wet and Dry Natural Gas (adapted from Speight, 1999)
Composition (vol%)
Constituents Wet Range Dry
HydrocarbonsMethane 84.6 96.0Ethane 6.4 2.0Propane 5.3 0.6Isobutane 1.2 0.18n-Butane 1.4 0.12Isopentane 0.4 0.14n-Pentane 0.2 0.06Hexanes 0.4 0.10Heptanes 0.1 0.80
Non-hydrocarbonsCarbon dioxide 0–5Helium 0–0.5Hydrogen sulfide 0–5Nitrogen 0–10Argon 0–0.05Radon, krypton, xenon Traces
livered to a pipeline. After gas removal, lighter hydrocarbons and hydro-gen sulfide are removed as necessary to obtain a petroleum of suitablevapor pressure for transport yet retaining most of the natural gasoline constituents.
In addition to composition and thermal content (Btu/scf, Btu/ft3), naturalgas can also be characterized on the basis of the mode of the natural gasfound in reservoirs where there is no or, at best only minimal amounts of,petroleum.
Thus there is nonassociated natural gas, which is found in reservoirs inwhich there is no, or at best only minimal amounts of, petroleum. Nonas-sociated gas is usually richer in methane but is markedly leaner in terms ofthe higher-molecular-weight hydrocarbons and condensate. Conversely,there is also associated natural gas (dissolved natural gas) that occurs eitheras free gas or as gas in solution in the petroleum. The gas that occurs as asolution with the crude petroleum is dissolved gas, whereas the gas thatexists in contact with the crude petroleum (gas cap) is associated gas. Asso-ciated gas is usually leaner in methane than the nonassociated gas but isricher in the higher-molecular-weight constituents.
The most preferred type of natural gas is the nonassociated gas. Such gascan be produced at high pressure, whereas associated or dissolved gas mustbe separated from petroleum at lower separator pressures, which usuallyinvolves increased expenditure for compression. Thus it is not surprisingthat such gas (under conditions that are not economically favorable) isoften flared or vented.
As with petroleum, natural gas from different wells varies widely in com-position and analyses (Speight, 1990 and references cited therein; Speight,1993 and references cited therein; Speight, 1999), and the proportion of non-hydrocarbon constituents can vary over a very wide range. Thus a particu-lar natural gas field could require production, processing, and handlingprotocols different from those used for gas from another field.
The non-hydrocarbon constituents of natural gas can be classified as twotypes of materials: (1) diluents, such as nitrogen, carbon dioxide, and watervapors, and (2) contaminants, such as hydrogen sulfide and/or other sulfurcompounds.
The diluents are noncombustible gases that reduce the heating value ofthe gas and are on occasion used as fillers when it is necessary to reducethe heat content of the gas. On the other hand, the contaminants are detri-mental to production and transportation equipment in addition to beingobnoxious pollutants. Thus the primary reason for gas refining is to removethe unwanted constituents of natural gas and to separate the gas into itsvarious constituents. The processes are analogous to the distillation unit ina refinery where the feedstock is separated into its various constituent frac-tions before further processing to products.
60 petroleum and petroleum products
The major diluents or contaminants of natural gas are:
1. Acid gas, which is predominantly hydrogen sulfide, although carbondioxide does occur to a lesser extent;
2. Water,which includes all entrained free water or water in condensed forms;3. Liquids in the gas, such as higher-boiling hydrocarbons as well as
pump lubricating oil, scrubber oil, and, on occasion, methanol; and 4. Any solid matter that may be present, such as fine silica (sand) and
scaling from the pipe.
2.4.3. Properties and Test Methods
The composition of natural and process gases can vary so widely that nosingle set of specifications can possibly cover all of the tests necessary todefine the specifications. The requirements are usually based on perform-ances in burners and equipment, on minimum heat content, and onmaximum sulfur content.
Because natural gas as delivered to pipelines has practically no odor, theaddition of an odorant is required by most regulations so that the presenceof the gas can be detected readily in case of accidents and leaks. This odor-ization is provided by the addition of trace amounts of some organic sulfurcompounds to the gas before it reaches the consumer.The standard require-ment is that a user will be able to detect the presence of the gas by odorwhen the concentration reaches 1% of gas in air. Because the lower limitof flammability of natural gas is approximately 5%, this 1% requirement is essentially equivalent to one-fifth the lower limit of flammability. Thecombustion of these trace amounts of odorant does not create any seriousproblems of sulfur content or toxicity.
The different methods for measuring gas composition include absorption,distillation, combustion, mass spectroscopy, infrared spectroscopy, and gaschromatography (ASTM D-2163, ASTM D-2650, and ASTM D-4424).Absorption methods involve absorbing individual constituents one at a timein suitable solvents and recording of contraction in volume measured. Dis-tillation methods depend on the separation of constituents by fractional dis-tillation and measurement of the volumes distilled. In combustion methods,certain combustible elements are caused to burn to carbon dioxide andwater and the volume changes are used to calculate composition. Infraredspectroscopy is useful in particular applications.For the most accurate analy-ses, mass spectroscopy and gas chromatography are the preferred methods.
The specific gravity of product gases, including LPG, may be determinedconveniently by a number of methods and a variety of instruments (ASTMD-1070, ASTM D-4891).
natural gas 61
The heat value of gases is generally determined at constant pressure ina flow calorimeter in which the heat released by the combustion of a defi-nite quantity of gas is absorbed by a measured quantity of water or air. Acontinuous recording calorimeter is available for measuring heat values ofnatural gases (ASTM D-1826).
The lower and upper limits of flammability indicate the percentage ofcombustible gas in air below which and above which flame will not propa-gate. When flame is initiated in mixtures having compositions within theselimits it will propagate, and therefore the mixtures are flammable.A knowl-edge of flammable limits and their use in establishing safe practices in handling gaseous fuels is important, for example, when purging equipmentused in gas service, in controlling factory or mine atmospheres, or in handling liquefied gases.
Many factors enter into the experimental determination of flammablelimits of gas mixtures, including the diameter and length of the tube orvessel used for the test, the temperature and pressure of the gases, and thedirection of flame propagation—upward or downward. For these and otherreasons, great care must be used in the application of the data. In moni-toring closed spaces where small amounts of gases enter the atmosphere,often the maximum concentration of the combustible gas is limited to one-fifth of the concentration of the gas at the lower limit of flammability of thegas-air mixture.
2.5. NATURAL GAS LIQUIDS AND NATURAL GASOLINE
Natural gas liquids are products other than methane from natural gas:ethane, butane, iso-butane, and propane. Natural gasoline may also beincluded in this group.
Natural gas liquids are, in fact, separate and distinct hydrocarbons con-tained within some streams of natural gas. Streams that contain commer-cial quantities of natural gas liquids are called wet gas, and those with littleor no liquids present are known as dry gas (see above).
Chemical manufacturers use ethane in making ethylene, an importantpetrochemical. Butane and propane, and mixtures of the two, are classifiedas liquefied petroleum gas (LPG), which is used chiefly as a heating fuel inindustry and in homes. Pentane, hexane, and heptane are called naturalgasoline or condensate and are used for blending with refinery gasoline.
The extraction of natural gas liquids from natural gas is achieved by theapplication of refining techniques that result in fractionation of the naturalgas into its hydrocarbon constituents. There are two main methods of pro-ducing natural gas liquids: (1) condensation and (2) absorption. In conden-sation, natural gas is chilled until it becomes a liquid from which the natural
62 petroleum and petroleum products
gas liquids are extracted. In absorption, processors mix gas with an oil thatabsorbs light hydrocarbons and the natural gas liquids are distilled from theoil.
Another product is gas condensate, which contains relatively highamounts of the higher-molecular-weight liquid hydrocarbons. These hydro-carbons may occur in the gas phase in the reservoir.
Normally the gas in a gas cap contains methane and other hydrocarbonsthat may be separated out by compressing the gas. A well-known exampleis natural gasoline, which was formerly referred to as casinghead gasolineor natural gas gasoline. However, at high pressures such as those existing inthe deeper fields, the density of the gas increases and the density of the oildecreases until they form a single phase in the reservoir.
Wet natural gas contains natural gasoline in vapor form.The wet gas, alsoknown as casinghead gas, is chiefly a mixture of methane, ethane, and thevolatile hydrocarbons propane, butane, pentane (C5H12), hexane (C6H14),and heptane (C7H16). The latter three hydrocarbons form the main con-stituents of natural gasoline, which is recovered in refineries in liquid formmainly by absorption or compression processes. Pentane, hexane, andheptane are liquids under normal atmospheric conditions and are the chiefcomponents of ordinary refinery gasoline.
Natural gasoline is used as blending stock for refinery gasoline and maybe cracked to produce lower-boiling products, such as ethylene, propylene,and butylene. Caution should be taken not to confuse natural gasoline withstraight-run gasoline (often also incorrectly referred to as natural gasoline),which is the gasoline distilled unchanged from petroleum.
The various tests that are applied to specifications for this group of low-boiling liquids will be referenced in the chapters dealing with liquefiedpetroleum gas (Chapter 3), naphtha (Chapter 4), and gasoline (Chapter 5).
2.6. PETROLEUM CHARACTER AND BEHAVIOR
The data derived from any one or more of the analytical techniques givean indication of the characteristics of petroleum and an indication of themethods of feedstock processing as well as for the predictability of productyields and properties (Dolbear et al., 1987; Adler and Hall, 1988; Wallaceand Carrigy, 1988; Al-Besharah et al., 1989; Speight, 1999, 2000, 2001 andreferences cited therein).
The most promising means of predictability of feedstock behavior duringprocessing and predictability of product yields and properties has arisenfrom the concept of feedstock mapping (Speight, 2001). In such procedures,properties of feedstock are mapped to show characteristics that are in visualform rather than in tabular form. In this manner the visual characteristics
petroleum character and behavior 63
of the feedstock are used to evaluate and predict the behavior of the feed-stock in various refining scenarios. Whether or not such methods willreplace the simpler form of property correlations remains to be determined.It is more than likely that both will continue to be used in a complemen-tary fashion for some time to come. However, there is also the need to recognize that what is adequate for one refinery and one feedstock (or feed-stock blend provided that the blend composition does not change signifi-cantly) will not be suitable for a different refinery with a different feedstock(or feedstock blend).
One of the most effective means of feedstock mapping has arisen thoughthe use of a multidisciplinary approach that involves use of all of the nec-essary properties of a feedstock. However, it must be recognized that suchmaps do not give any indication of the complex interactions that occurbetween, for example, such fractions as the asphaltenes and resins (Kootsand Speight, 1975; Speight, 1994), but it does allow predictions of feedstockbehavior. It must also be recognized that such a representation varies fordifferent feedstocks.
More recent work related to feedstock mapping has involved the devel-opment of a different type of compositional map using the molecular weightdistribution and the molecular type distribution as coordinates. Such a mapcan provide insights into many separation and conversion processes usedin petroleum refining (Speight, 2001).
Thus a feedstock map can be used to show where a particular physicalor chemical property tends to concentrate on the map. For example, thecoke-forming propensity, that is, the amount of the carbon residue, is shownfor various regions on the map for a sample of atmospheric residuum (Fig. 2.7; Long and Speight, 1998). In addition, a feedstock map can be veryuseful for predicting the effectiveness of various types of separations pro-cesses as applied to petroleum (Fig. 2.8; Speight, 2001).
In contrast to the cut lines generated by separation processes, conver-sion processes move materials in the composition from one molecular typeto another. For example, reforming converts saturates to aromatics andhydrogenation converts aromatic molecules to saturated molecules andpolar aromatic molecules to either aromatic molecules or saturated mole-cules (Fig. 2.9; Speight, 2001). The processes illustrated are reforming,hydrogenation, hydrotreating, hydrocracking, visbreaking, and heat soak-ing. The arrows go from the material converted to what it is converted to.Hydrotreating removes nitrogen and sulfur compounds from polar aro-matics without much change in molecular weight. Hydrocracking convertspolar species to aromatics while at the same time reducing molecularweight. Visbreaking and heat soaking primarily lower or raise the molecu-lar weight of the polar species in the composition map. Thus visbreaking isused to lower the viscosity of heavy oils, whereas heat soaking is a coking
64 petroleum and petroleum products
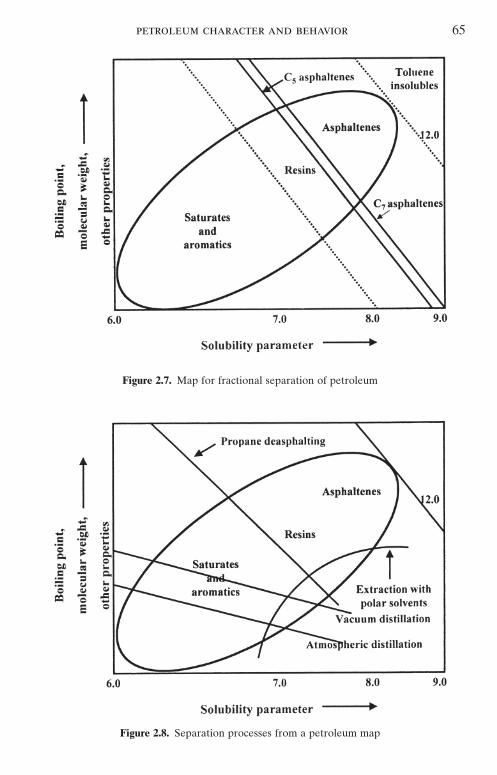
petroleum character and behavior 65
Figure 2.7. Map for fractional separation of petroleum
Figure 2.8. Separation processes from a petroleum map
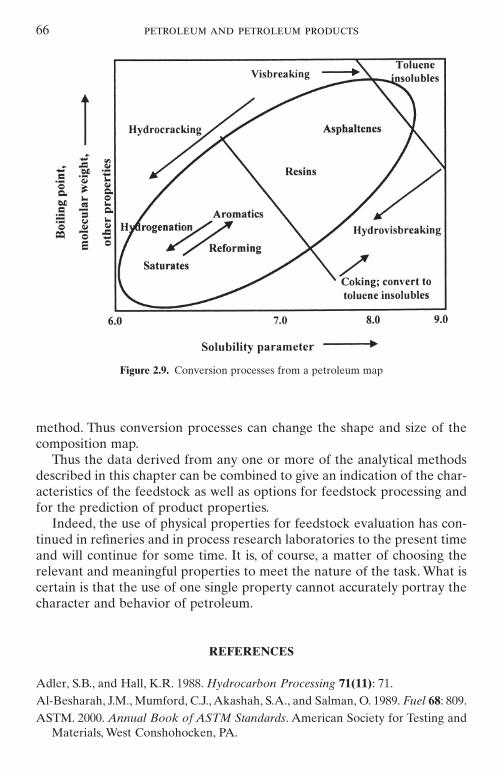
method. Thus conversion processes can change the shape and size of thecomposition map.
Thus the data derived from any one or more of the analytical methodsdescribed in this chapter can be combined to give an indication of the char-acteristics of the feedstock as well as options for feedstock processing andfor the prediction of product properties.
Indeed, the use of physical properties for feedstock evaluation has con-tinued in refineries and in process research laboratories to the present timeand will continue for some time. It is, of course, a matter of choosing therelevant and meaningful properties to meet the nature of the task. What iscertain is that the use of one single property cannot accurately portray thecharacter and behavior of petroleum.
REFERENCES
Adler, S.B., and Hall, K.R. 1988. Hydrocarbon Processing 71(11): 71.Al-Besharah, J.M., Mumford, C.J., Akashah, S.A., and Salman, O. 1989. Fuel 68: 809.ASTM. 2000. Annual Book of ASTM Standards. American Society for Testing and
Materials, West Conshohocken, PA.
66 petroleum and petroleum products
Figure 2.9. Conversion processes from a petroleum map
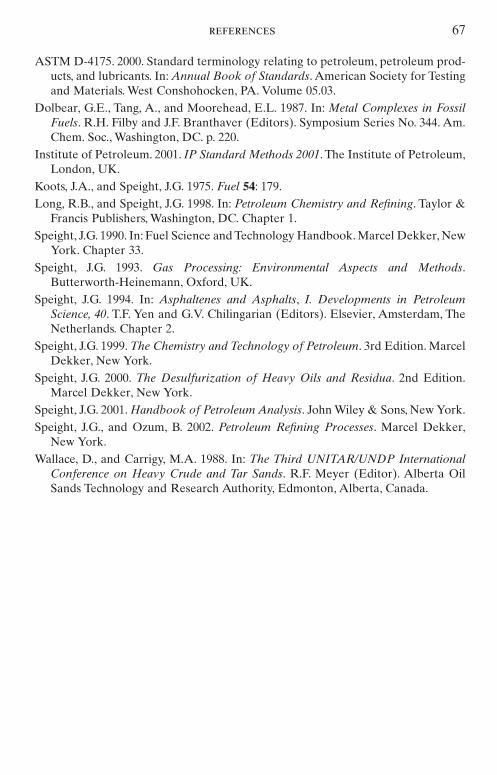
ASTM D-4175. 2000. Standard terminology relating to petroleum, petroleum prod-ucts, and lubricants. In: Annual Book of Standards. American Society for Testingand Materials. West Conshohocken, PA. Volume 05.03.
Dolbear, G.E., Tang, A., and Moorehead, E.L. 1987. In: Metal Complexes in FossilFuels. R.H. Filby and J.F. Branthaver (Editors). Symposium Series No. 344. Am.Chem. Soc., Washington, DC. p. 220.
Institute of Petroleum. 2001. IP Standard Methods 2001. The Institute of Petroleum,London, UK.
Koots, J.A., and Speight, J.G. 1975. Fuel 54: 179.Long, R.B., and Speight, J.G. 1998. In: Petroleum Chemistry and Refining. Taylor &
Francis Publishers, Washington, DC. Chapter 1.Speight, J.G. 1990. In: Fuel Science and Technology Handbook. Marcel Dekker, New
York. Chapter 33.Speight, J.G. 1993. Gas Processing: Environmental Aspects and Methods.
Butterworth-Heinemann, Oxford, UK.Speight, J.G. 1994. In: Asphaltenes and Asphalts, I. Developments in Petroleum
Science, 40. T.F. Yen and G.V. Chilingarian (Editors). Elsevier, Amsterdam, TheNetherlands. Chapter 2.
Speight, J.G. 1999. The Chemistry and Technology of Petroleum. 3rd Edition. MarcelDekker, New York.
Speight, J.G. 2000. The Desulfurization of Heavy Oils and Residua. 2nd Edition.Marcel Dekker, New York.
Speight, J.G. 2001. Handbook of Petroleum Analysis. John Wiley & Sons, New York.Speight, J.G., and Ozum, B. 2002. Petroleum Refining Processes. Marcel Dekker,
New York.Wallace, D., and Carrigy, M.A. 1988. In: The Third UNITAR/UNDP International
Conference on Heavy Crude and Tar Sands. R.F. Meyer (Editor). Alberta OilSands Technology and Research Authority, Edmonton, Alberta, Canada.
references 67