permanent deformation - roadex network
TRANSCRIPT

THIS PROJECT IS BEING PART- FINANCED BY THE EUROPEAN UNION European Regional Development Fund
PERMANENT DEFORMATION
Andrew Dawson Pauli Kolisoja

PERMANENT DEFORMATION
REPORT ON TASK 2.1
October 2004
ANDREW DAWSON
UNIVERSITY OF NOTTINGHAM
PAULI KOLISOJA
TAMPERE UNIVERSITY OF TECHNOLOGY


PREFACE
This is the final report of the Phase 2:1 study of the Roadex II project, a technical transnational cooperation project between the Highland Council, the Western Isles Council, and Forest Enterprise from Scotland; the Northern Region (formerly Troms District) of the Norwegian Public Roads Administration and the Norwegian Road Haulage Association; the Northern Region of the Swedish Road Administration; and from Finland the Regions of Central Finland and Lapland of the Finnish Road Administration, as well as Metsähallitus Region of Eastern Lapland, the Forestry Centre of Lapland (Lapin Metsäkeskus), Stora Enso Metsä, and Metsäliitto, Procurement Area of Northern Finland. The Roadex project is partly financed by the Interreg IIIB Northern Periphery Programme. The lead partner in the project is the Highland Council from Scotland and project consultant is Roadscanners Oy from Finland. Roadex II project Chairman is Ron Munro from the Highland Council and project manager is Timo Saarenketo from Roadscanners.
The report was prepared by Andrew Dawson of the Nottingham Centre for Pavement Engineering at the University of Nottingham, UK (working under sub-contract to Highland Regional Council, Scotland) with much assistance from Pauli Kolisoja of the Tampere University of Technology, Finland (working under sub-contract to Roadscanners Oy) both of whom are members of the Roadex II Road Condition Working Team. The input of Timo Saarenketo in editing the report is gratefully acknowledged.
The authors would like to thank Nuutti Vuorimies, Riccardo Isola and Greg Arnold from their research teams in performing much of the study and for assisting with production of figures, and would like to Wave Tyrrell of Forest Enterprise, Scotland and Siggurdur Erlingsson of the University of Iceland for several of the photographs and figures.
Finally the authors would like to acknowledge the Roadex II Steering Committee for its encouragement and valuable guidance in this work
Copyright ©2004 Roadex II Project All rights reserved. Roadex II Lead Partner: The Highland Council, Transport, Environmental & Community Service, HQ, Glenurquhart Road, Inverness IV3 5NX Scotland, Project co-ordinator: Mr. Richard Evans.

CONTENTS
1 INTRODUCTION .......................................................................................................................11
2 RUTTING....................................................................................................................................12
2.1 GENERAL ............................................................................................................................12
2.2 MODE 0.................................................................................................................................13
2.3 MODE 1.................................................................................................................................14
2.4 MODE 2.................................................................................................................................15
2.5 MODE 3.................................................................................................................................17
2.6 COMBINED MODES............................................................................................................17
3 GRANULAR PAVEMENT LAYERS ..........................................................................................18
4 CLIMATIC EFFECTS ................................................................................................................20
4.1 RAINFALL ...........................................................................................................................20
4.2 FROST ..................................................................................................................................20
5 LABORATORY AND ANALYTICAL STUDY...........................................................................21
5.1 STUDY METHODS...............................................................................................................21
6 TESTING.....................................................................................................................................22
6.1 MATERIALS ........................................................................................................................22
6.2 TEST METHODS..................................................................................................................23
7 PAVEMENT ANALYSIS ............................................................................................................27
8 RESULTS ....................................................................................................................................28
8.1 STIFFNESS BEHAVIOUR....................................................................................................28
8.2 PLASTIC BEHAVIOUR .......................................................................................................29
8.3 RESULTS OF ANALYSIS.....................................................................................................34
9 DISCUSSION AND CONCLUSIONS..........................................................................................39
10 PAVEMENT REHABILITATION ............................................................................................43

11 CONCLUDING REMARKS......................................................................................................44
12 REFERENCES ..........................................................................................................................45
APPENDIX 1 – STRESS PLOTS....................................................................................................46

Roadex II The Northern Periphery Page 8

Roadex II The Northern Periphery Page 9
ABSTRACT
The goal for the Roadex II Phase 2:1 was to study the problem of rutting in low-volume thinly sealed or unsealed pavements and to propose improved ways of designing, assessing and maintaining these types of pavements. The report is laid out in eleven sections, but these fall into three parts.
The first part of the report gives an explanation of why rutting is undesirable and then describes the types and causes of distress seen in this kind of pavement. It explains the likely causes of the different types of rutting and aims to do so in a manner which can be readily understood without resort to advanced computational or theoretical background. Many illustrations are provided to assist with this explanation. This part also discusses the cause and distress associated with spring thaw weakening which is a major problem in many of the study areas.
The second part of the document reports on the results obtained from the programme of laboratory testing. This programme concentrated on repeated load triaxial testing of aggregates from Scotland, Norway and Finland. Several different test procedures were applied in order to assess the materials in a variety of ways and to provide data for the work described in next part of the report. The second part gives some interpretation of the data collected and also describes computational work which modelled pavement response using data from the laboratory testing programme.
The third part of the report provides a design and assessment strategy for implementation by road engineers. It lays out the steps to be taken to ensure that the pavement will not undergo undue rutting. A method is presented which uses readily available insitu testing devices and chart-based interpretation so that both the assessment and computations should be within the ability of hard-pressed local engineers with limited budgets.
Finally, some suggestions are made for further refinement and validation of the procedures proposed. KEY WORDS: Rutting, Pavement Design, Aggregate Assessment, Stress Analysis, Unbound Granular Material, Roadex.

Roadex II The Northern Periphery Page 10

Roadex II The Northern Periphery
Page 11
1 Introduction In the study areas of the Northern Periphery, unsealed or thinly-sealed road pavements are very common. Typically, these road structures are constructed from one, or more, layers of crushed stone aggregate laid on top of the subgrade (Figure 1). The surface of these pavements is usually provided by the aggregate compacted to a smooth finish or by a thin bituminous seal into which stones of a uniform size are rolled. Thus, in either case, the aggregate layers provide the chief structural capability of the pavement. Compacted aggregate is a flexible material. Therefore, if it is too weak, it tends to deform plastically, a little bit of plastic deformation occurring under the passage of each vehicle axle load. Cumulatively this deformation is seen as rutting. In unsealed or thinly sealed pavements, this type of behaviour is a feature of every layer and is greater if the applied stress level, due to traffic, is higher.
Figure 1. Cross sectional view of a thinly sealed pavement. (Layer boundaries picked out by spray paint) (photo: courtesy S Erlingsson)

Roadex II The Northern Periphery
Page 12
2 Rutting 2.1 GENERAL Rutting is highly undesirable in a pavement for several reasons as illustrated in Figure 2. Rutting gives problems to users by increasing the consumption of fuel and the risk of skidding (on water or on ice) – e.g. Figure 3. It also gives problems to the owner as ruts encourage water to soak into the pavement instead of draining off the surface. Water that enters the pavement in this way may collect in a ‘buried’ rut in the subgrade (see Figure 2) and/or reduce the load carrying capacity of the granular layers. The last of these is discussed further in this report. Furthermore, rutting of the aggregate and/or subgrade layers can lead to failure of the upper asphaltic layers (Figure 2.3). Less directly, rutting is usually not uniform along the length of the road so unevenness arises leading to user discomfort. Ponding in a rut allows water into the pavement prematurely causings its loss of performance. Skid resistance due to aquaplaning and due to ice, when frozen, may result. Rutting may also be induced at subgrade level allowing water to pond there causing (hidden) deterioration of the subgrade. More friction is developed against the side of the tyre leading to higher rates of fuel consumption and tyre wear. Rutting can occur for a number of reasons. Fundamentally there are four contributory mechanisms, which are here labeled as Modes 0, 1, 2 and 3. Each is now considered.
Figure 2. Reasons why rutting is undesirable.
Figure 3. Water collecting in a wheel track of a thinly sealed pavement.
Figure 4. Rutting of a lower layers leads to distress in asphalt layers.

Roadex II The Northern Periphery
Page 13
2.2 MODE 0 Compaction of non-saturated materials in the pavements can be a contributor to rutting (Figure 5). Normally compaction prior to trafficking is considered sufficient to prevent further compaction under trafficking. Furthermore this mode is self-stabilising - i.e. compaction under trafficking hinders further compaction (Figure 6). It also causes the material to stiffen and hence to spread load better. Better load spreading leads to a reduced stress on the subgrade, thereby reducing the amount and risk of rutting at that level. Rutting of this type is seen as a narrow depression relative to the original surface (Figure 5). The material affected is mostly near the wheel. Thus, for these reasons, a limited amount of rutting by this mode is beneficial. Good compaction minimises the amount of rutting observed. In regions affected by frost penetration every winter, the frost, in combination with moisture, causes heaving (usually concentrated in the subgrade) and, hence, de-compaction of the aggregate layers. Thus, in the spring, when the frozen aggregate and subgrade thaws, compaction becomes possible allowing rutting of the Mode 0 type to develop. The natural variability of the subgrade leads to variable heave along the length of the pavement and, as a consequence, variable rutting. Shear deformations (discussed below as Mode 1) may be associated with this Spring-thaw phenomenon as the loosened aggregate will be significantly weaker than in its compacted condition. This can lead to unacceptably large ruts after several years of Spring-thaw.
Figure 5. Mode 0 Rutting – compaction of granular layers alone.
Figure 6. Permanent strain development for a crushed granodiorite.
AggregateSoilAggregateSoil
0 20000 40000 60000 80000 100000
Perm
anen
t str
ain
[%]
0
0,1
0,08
0,06
0,04
0,02
Number of load cycles, N
Roadex II The Northern Periphery
Page 14
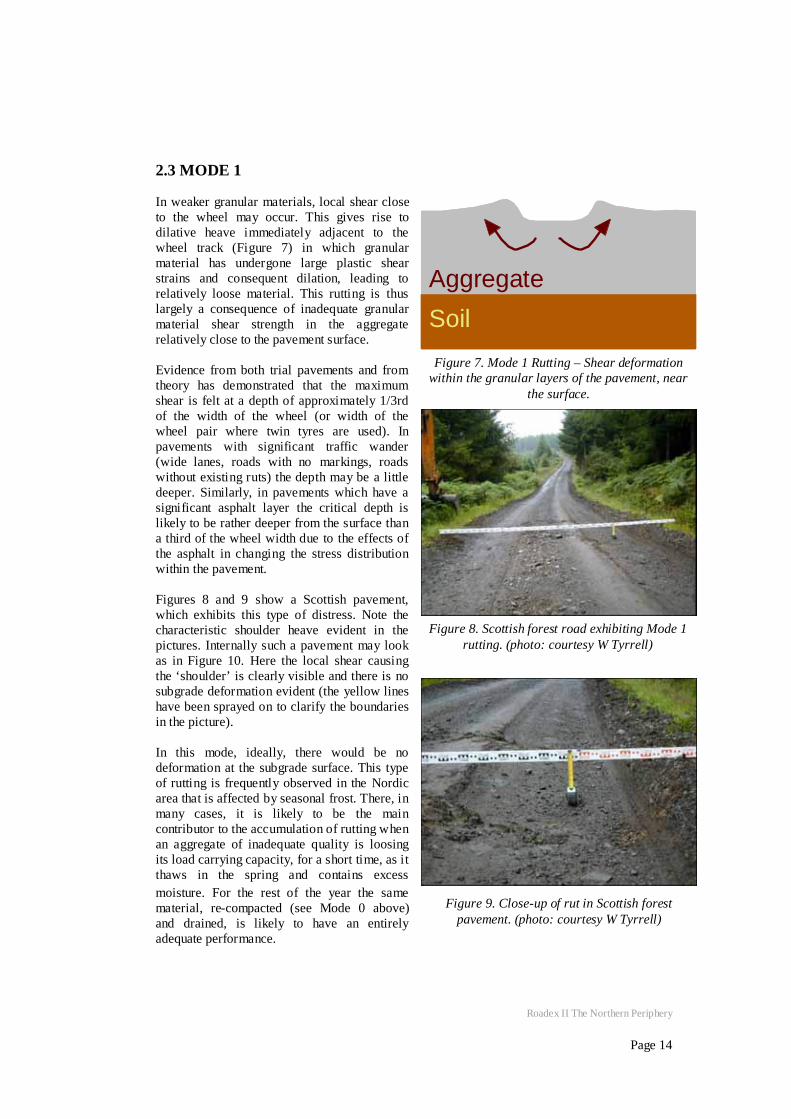
2.3 MODE 1 In weaker granular materials, local shear close to the wheel may occur. This gives rise to dilative heave immediately adjacent to the wheel track (Figure 7) in which granular material has undergone large plastic shear strains and consequent dilation, leading to relatively loose material. This rutting is thus largely a consequence of inadequate granular material shear strength in the aggregate relatively close to the pavement surface. Evidence from both trial pavements and from theory has demonstrated that the maximum shear is felt at a depth of approximately 1/3rd of the width of the wheel (or width of the wheel pair where twin tyres are used). In pavements with significant traffic wander (wide lanes, roads with no markings, roads without existing ruts) the depth may be a little deeper. Similarly, in pavements which have a significant asphalt layer the critical depth is likely to be rather deeper from the surface than a third of the wheel width due to the effects of the asphalt in changing the stress distribution within the pavement. Figures 8 and 9 show a Scottish pavement, which exhibits this type of distress. Note the characteristic shoulder heave evident in the pictures. Internally such a pavement may look as in Figure 10. Here the local shear causing the ‘shoulder’ is clearly visible and there is no subgrade deformation evident (the yellow lines have been sprayed on to clarify the boundaries in the picture). In this mode, ideally, there would be no deformation at the subgrade surface. This type of rutting is frequently observed in the Nordic area that is affected by seasonal frost. There, in many cases, it is likely to be the main contributor to the accumulation of rutting when an aggregate of inadequate quality is loosing its load carrying capacity, for a short time, as it thaws in the spring and contains excess moisture. For the rest of the year the same material, re-compacted (see Mode 0 above) and drained, is likely to have an entirely adequate performance.
Figure 7. Mode 1 Rutting – Shear deformation within the granular layers of the pavement, near
the surface.
Figure 8. Scottish forest road exhibiting Mode 1 rutting. (photo: courtesy W Tyrrell)
Figure 9. Close-up of rut in Scottish forest pavement. (photo: courtesy W Tyrrell)
AggregateSoilAggregateSoil

Roadex II The Northern Periphery
Page 15
The only remedy for such rutting is to improve the aggregate or by reducing the tyre imposed stresses. Subgrade treatment will have no effect on this mode of rutting. The granular material may be improved by compaction (within limits), by stabilisation (see Task 2.2), by the use of a geosynthetic reinforcement or by improving the conditions which control its behaviour – e.g. by drainage. If none of these is effective, the aggregate may have to be replaced.
2.4 MODE 2 When aggregate quality is better, then the pavement as a whole may rut. Idealised, this can be viewed as the subgrade deforming with the granular layer(s) deflecting bodily on it (i.e. without any thinning) – see Figure 11. The surface deflection pattern is of a broad rut with slight heave remote from the wheel (as it is the displacement of the soil which causes this). An extreme example of this type of failure can be seen in Figure 12. In this case the surface rut has been repeatedly infilled, but rutting at the subgrade surface has continued with aggregate following this. The subgrade has had to squeeze upwards between the wheel tracks and in the margin – a very advanced example of the rotational shear within the subgrade, which is shown by the arrows in Figure 11. In regions affected by deep seasonal frost, the spring thaw problem discussed above can lead to Mode 2 rutting of the subgrade. In such situations excess Mode 2 rutting may be seen only in the spring when subgrades are softened for a few weeks by excess moisture consequent upon thawing. Figure 13 shows a Ground Penetrating Radar (GPR) record and interpretation while figure 14 shows a series of consecutive GPR profiles of the same narrow low volume road, on which traffic tends to use more or less the same wheel paths in both directions (each profile is plotted against its own datum in order to keep the figures close
Figure 10. The pavement of Figures 2.8 & 2.9 seen in cross-section. (Layer boundaries picked out by
spray-paint) (photo: courtesy W Tyrrell)
Figure 11. Mode 2 rutting – Shear deformation within the subgrade with the granular layer
following the subgrade.
Figure 12. An advanced case of Mode 2 rutting seen in an exhumed pavement with a very weak
subgrade. (photo: courtesy W Tyrrell)
Aggregate
Soil
Aggregate
Soil

Roadex II The Northern Periphery
Page 16
together). Although continual grading keeps the road surface (the red lines) reasonably level, the deformation of the layer boundaries at the bottom of the unbound wearing course (indicated in the figure by yellow lines) and, particularly, at the base/sub-base course boundary (brown line) and at the top of the embankment (green lines) is very evident. In this case all the layers show some rutting with as much as 0.6m of rutting being observed at the top of the subgrade (green line).
Figure 13. A GPR record from Kemijärvi, near Rovaniemi Finland.
Road Surface
Bottom of Surface Layer
Base/sub-base interface
Top of embankment Dep
th re
lativ
e to
laye
r dat
um (m
)
Distance across pavement (m)
Figure 14. Mode 2 rutting at Kemijärvi, near Rovaniemi, Finland showing depth of interfaces as revealed by Ground Penetrating Radar.

Roadex II The Northern Periphery
Page 17
2.5 MODE 3 Particle damage (e.g. attrition or abrasion, perhaps by studded tyres) can be a contributor to the same surface manifestation as seen in Mode 0 rutting (Figure 15) though, of course, the mechanism is very different.
2.6 COMBINED MODES In practice rutting will be a combination of the above mechanisms. Data from some trial pavements in Scotland showed, on exhumation, both the thinning of the granular layer (Mode 1) and depression of the subgrade (Mode 2) – see Figure 15. The localised heave (or ‘shoulder’) close to the wheel path is clearly visible as is a reduced deformation of the subgrade compared to the surface depression.
It is expected, and to some extent observed, that Mode 1 will be more evident with canalised trafficking (e.g. as is the case with many forest roads) where wheel wander is not available to displace-back, and generally compact, aggregate (Mode 0). Conversely, Mode 2 is expected to be more evident under wandering traffic with Mode 0 more likely to make a contribution in this case as the "kneading action" of a wandering tyre is more effective in achieving compaction.
Figure 15. Rut observed on exhumation.
50
100
350
450
-0.8 0 0.8
Pavement surface
Subgrade surface
Original
Final
Original
FinalLe
vel a
bove
dat
um (m
m)
Distance from wheel path (m)
50
100
350
450
-0.8 0 0.8
Pavement surface
Subgrade surface
Original
Final
Original
FinalLe
vel a
bove
dat
um (m
m)
Distance from wheel path (m)

Roadex II The Northern Periphery
Page 18
3 Granular Pavement Layers The structural layers of the pavements addressed by this document are almost invariably formed of compacted, granular material. This will have been sourced either from alluvial or glacial sand and gravel deposits or from rock quarries (Figures 16 – 19) and then fully or partially crushed. In either event the long distances to established, commercial, aggregate production centres will often mean that there is pressure to source aggregate locally in order to reduce costs. In such circumstances the material used may be less than ideal.
Because aggregate is a geotechnical material it suffers the same limitations as other soils – in particular it is weakened by excess water in the voids between the stone particles. Under traffic loading the water becomes pressurised and this pressure in the pores between aggregate pieces opposes the stress, which is pushing the stones together (Figure 20). Thus the contact stresses between particles are not as large as they might be. In turn, this means that inter-particle friction is less than desirable meaning that the frictional strength and resistance to deformation is reduced from appropriate levels. In effect, the water in the pores can turn a good quality granular material into a poor one.
Figure 17. Metamorphic crushed rock quarry (greywacke-shale) at Balunton, Scotland. (photo:
courtesy W Tyrrell)
Figure 16. Glacial gravels being excavated from an esker deposit, Sweden.
Figure 18. Alluvial gravel after partial crushing. Figure 19. Partially crushed alluvial gravel in an unsealed pavement.

Roadex II The Northern Periphery
Page 19
σ
σ
σ
σ
σ
σ
σ
σ
σ
σ
σ
σ
External stress applied to a granular
assembly The same assembly split and balanced by
inter-particle forces
σ
σ
σ
σ
water
= u
pressure in pores
σ
σ
σ
σ
water
= u
pressure in pores
σ
σ
+ water pressure
σ
σ
+ water pressure
External stress applied to a granular assembly with water in pores
The same assembly split and balanced by internal water pressure and smaller inter-
particle forces
Figure 20. The importance of low pore water pressure to ensure good inter-particle stresses and, hence, good frictional characteristics.
A further concern comes from the size of particles, which make up the aggregate. If stones are large then the pores between them also tend to be large. Water drains easily in this case and, hence, the resistance to rutting, even in moderately wet conditions, will usually be quite good. On the other hand, fine-grained aggregates tend to hold water (even sucking water into their pores due to capillary effects) and, thus, are frequently poor performers in wet weather and, especially, during the thawing period after seasonal frost.

Roadex II The Northern Periphery
Page 20
4 Climatic Effects In the Northern Periphery area climate has a significant effect on most aspects of construction. Road pavements are no exception to this rule. There are two main effects of concern:
4.1 RAINFALL Rain will tend to enter the pavement construction. In finer grained aggregates the capillary suction effects will help to draw water into the construction. The effect may be a little less pronounced when the surface is sealed with a bituminous layer, but they easily crack and let water in. It is impossible to avoid this problem entirely but coarse aggregate, good cross-falls (>4%) and a sealed surface (or an unsealed surface with a compacted fine aggregate to provide a partial seal) will all assist in limiting the ingress of rainwater. Operating drains are also important. Most pavements are built with some kind of drainage, perhaps in the form of a lateral ditch. However, limited budgets mean that maintenance may not take place so that, in time, drainage no longer takes place as intended. There is, almost certainly, an “out-of-sight, out-of-mind” aspect to this lack of ongoing attention. 4.2 FROST Cold weather will cause water in the pavement to freeze. As the frozen front moves downwards in the pavement due to a long, cold period, suctions are established which sucks water towards the freezing front. By this means excess water collects in the pavement as ice. When thawing commences in the spring, this water tends to be trapped in the pores of the aggregate and cannot leave as the pavement’s drainage system remains frozen. Once again a possible remedy is a coarser aggregate in which suction is less easily developed. In particular, a coarse aggregate layer at the bottom of the granular layers can act as a capillary break, cutting off the supply of water to the freezing front. In both cases the problem is excess water causing frictional strength to decrease (Figure 20) and, hence, for rutting to occur more quickly and/or more severely. Figure 21 shows temperature, rainfall and internally available moisture in a pavement construction. The effect of freezing and the high moisture immediately after thawing is apparent. The effect of heavy rainstorms can also be seen in some temporary increases in pavement moisture. The higher fines content of the sub-base can also be seen to lead to higher moisture content throughout and a greater ‘reluctance’ to drain after high moisture content occurs.
Figure 21.Environmental data for a pavement section over a period of 14 months showing free gravimetric moisture content, as
indicated by TDR sensors, at three depths together with the precipitation. [COURAGE, 1999]
0
5
10
15
J J A S O N D J F M A M J J A
Gra
vim
etric
moi
stur
e co
nten
t [%
]
0
10
20
30
40
Pre
cipi
tatio
n [m
m]
precipitation Base at 15 cm beneath surface Subbase at 25 cm beneath surface Subbase at 45 cm beneath surface
Heavy rain leads to wetting of sub-base
Spring-thaw excess moisture in lower sub-base
Progressive thawing with depth
Subbase (45cm)
Subbase (25cm)
Base
Rainfall/ Snow
Short-term surface thaws, near surface only, during winter
{
Lower layers continuously frozen n.b. wettest at bottom of
subbase due to vertical drainage and in base due to retention by finer grading
Month

Roadex II The Northern Periphery
Page 21
5 Laboratory and Analytical Study
For the reasons given above it was decided to assess two aggregates at differing grain sizes and differing moisture conditions. The results were used to calculate the stress conditions in the pavement under typical truck traffic and this enabled an assessment of the likelihood of rutting to be estimated. The aim of the study is to provide advice to road owners on the maintenance and material selection practices which can give rise to poorly performing pavements and those which can give rise to better performance. A simple means of evaluating the likelihood of excessive permanent deformation is aimed for. By this means owners will have an outline approach for assessing existing pavements, for strengthening design, for dimensioning public low volume and private forest road pavements and a means of setting appropriate load limits when pavements are in poor condition. 5.1 STUDY METHODS The principle study method involved:
a) the repeated stressing of cylindrical specimens of compacted aggregate (prepared at a variety of conditions) in triaxial apparatuses (Figures 22 – 24),
b) interpretation of the results of stage a) in a manner which could be used in an advanced Finite Element computer programme to compute the stresses in pavements constructed of the aggregates tested in stage a),
c) deducing those parts of the pavement structure, and the amount of the pavement structure, which would deform plastically, thereby giving rise to rutting,
d) relating the results from simple assessment methods to those from triaxial tests to determine material potential without resorting to advanced laboratory tests,
e) drawing general conclusions and advice from the study.

Roadex II The Northern Periphery
Page 22
6 Testing 6.1 MATERIALS Two aggregates were tested specifically for the purposes of this project. One was a moderate quality metamorphic aggregate from Scotland - known as “Quarriebraes” aggregate, after its source. The other was a higher quality Norwegian crushed gravel aggregate from Troms. In addition the authors have drawn on data from several other aggregates from Scotland, N. Ireland, Germany, Finland and Sweden, especially those from the site of the environmental pavement condition station (‘Percostation’) at Koskenkylä near to the town of Rovaniemi in Northern Finland. Together, the data covers a wide range of geological origins, grain size, stone quality, shape, etc. The majority of materials from which the conclusions of this report derive have a crushed rock origin, but some sand and gravel type aggregate has also been studied. The aggregates have been tested at a range of moisture contents and some were tested after freezing and thawing. Also, the aggregates have been studied at different grain size distributions. In some cases (see Table 1), fine subgrade soil has been deliberately mixed with the aggregate to simulate the contamination of aggregates which can occur in practice for several reasons (degradation of the coarse aggregate due to freeze-thaw, studded tyre damage and crushing and wear due to the impact of heavy traffic; intrusion of subgrade fines due to a pumping action caused by the passage of vehicles when the subgrade-aggregate boundary is wet; fines entering through the surface or margins of the pavement from wash-off of surrounding soil).
Material Description Code Moisture Content (%)
Fines Content (%)
Quarriebraes Dry Qa 3.5 5.12 Quarriebraes Wet Qb 7.8 3.53 Quarriebraes Saturated, High Fines Qc 11.0 8.24 Koskenkylä Base, Dry Ka 1.6 13.3 Koskenkylä Base, Wet Kb 5.2 13.3 Koskenkylä Base, After Thaw Kc 8.8 13.3 Koskenkylä SubBase, Dry Kd 2.0 19.1 Koskenkylä SubBase, Wet Ke 5.1 19.1 Koskenkylä SubBase, After Thaw Kf 9.7 19.1
Table 1. Aggregate Results used in the Analysis.

Roadex II The Northern Periphery
Page 23
6.2 TEST METHODS The most common test used was the repeated load triaxial test. An illustrative cross-section of this is shown in Figure 22, a photograph of the Nottingham University equipment is shown in Figure 23 and of the Tampere University of Technology equipment in Figure 24. Specimens with diameters of 150mm, 200mm and 300mm and with heights of twice this dimension were subjected to a wide variety of loadings. The cell (or ‘confining’ pressure) is kept constant during pulsing or ramping of the axial load (except see iv. below). The test programmes included:
Cell Pressure Sensor
Axial Load Sensor
LVDT for Axial Strain
Radial Strain Gauge Hoop Specimen
Cycled Axial Load Cycled Cell Fluid Pressure
Base
Top Platen
with Screw Fixing
Membrane
Sealing Ring
Bushing
Pressure Chamber
Embedded Stud
Figure 22. Repeated Load Triaxial Test Equipment (Line drawing of University of Nottingham
equipment, 150 mm diameter specimen).
Figure 23. Specimen ready for testing in University of Nottingham triaxial apparatus.

Roadex II The Northern Periphery
Page 24
a) Single “ramp” loading tests – the so-called
Monotonic Failure tests. These tests give a measurement of the maximum static load that can be placed on an aggregate, in the presence of a fixed amount of confinement.
b) Modulus assessment tests in which a range
of stresses is used. Approximately 100 cycles of each of a series of stresses pulses are applied in sequence. The pulses are chosen to simulate the stress pulses experienced in a pavement due to trafficking. The stiffness properties of the aggregate are then deduced to be variable and to depend on the stress level applicable at any particular stage.
c) Plastic strain (the strain responsible for
rutting) tests in which a loading pulse simulative of that experienced somewhere in a pavement is repeated a large number of times (e.g. 80 000 times) and the strain recorded. Alternatively, an indefinite number of repetitions of the axial stress may be applied only being stopped when the plastic deformation, accumulated incrementally under each pulse, becomes excessive.
d) Multistage tests in which a low stress pulse is applied, say, 1000 times. The axial repeated
stress is then applied at an increased magnitude, on the same specimen, perhaps increasing the confining stress before doing so. This allows a picture of plastic deformation to be gained without resorting to lots of specimens, as would be necessary if plastic strain tests as listed under point iii, were used. The disadvantage is, of course, that the results under the later stages may be ‘distorted’ due to behaviour under earlier stressing. Figure 25 gives an example of this type of loading.
Figure 24. Repeated Load Triaxial Test Facility at Tampere University of Technology for 200 &
300 mm diameter specimens

Roadex II The Northern Periphery
Page 25
0
1
2
3
4
0 100000 200000 300000 Load Cycles
Perm
anen
t Str
ain
(%)
2a 2b 2c
2d
2e
2f
Test
p (kPa)
q (kPa)
Cell (kPa)
2a
250
402
116 2b
252
457
100
2c
253
511
83 2d
252
555
67
2e
253
607
51 2f
252
658
33
Figure 25. Cumulative plastic deformation (strain) under series of increasing axial load pulses
and decreasing confining pressures, 5000 load cycles applied at each stress state In addition to these, a wide range of other testing was performed including: • Compaction studies to determine the best conditions at which to perform the triaxial tests
and, also, to allow the effects of inadequate compaction to be investigated. • Grading analyses to assist in defining the particle sizes before and after contamination. The
grading results for the two aggregates are shown in Figures 26 and 27.
0%10%20%30%40%50%
60%70%80%90%
100%
0.01 0.10 1.00 10.00 100.00
Particle size (mm)
Prop
ortio
n pa
ssin
g gi
ven
size
Figure 26. Grading of Scottish Quarriebraes material (without added fines).

Roadex II The Northern Periphery
Page 26
0%10%20%30%40%50%60%70%80%90%
100%
0.01 0.10 1.00 10.00 100.00
Particle size (mm)
Prop
ortio
n pa
ssin
g gi
ven
size
Upper base layerLower base layerSub-base
Figure 27. Grading of Finnish Koskenkylä material.
Dielectric assessments (e.g. by Tube suction, Percostation or Percometer methods) which, in effect, measure the free water in the aggregate. These tests were shown to give an indirect indication of mechanical performance – see Figure 28. In this figure dielectric values >8 indicate concern with values >10 being definitely associated with poor resistance to permanent deformation. More usually, test limits of >9 and >16 are set (Saarenketo, et al. 1998) when assessment is made on small specimens because these have higher moisture contents at the surface than for larger specimens or in-situ.
0.0
1.0
2.0
3.0
0 5 10 15 20
Dielectric value of sample surface
Perm
anen
t axi
al s
train
, %
measured
sample failed
Figure 28. Permanent axial strains of specimens as a function of the dielectric value of the specimen’s top surface. Values of permanent axial strain > 2% indicate early failure of the
permanent deformation test.
Roadex II The Northern Periphery
Page 27
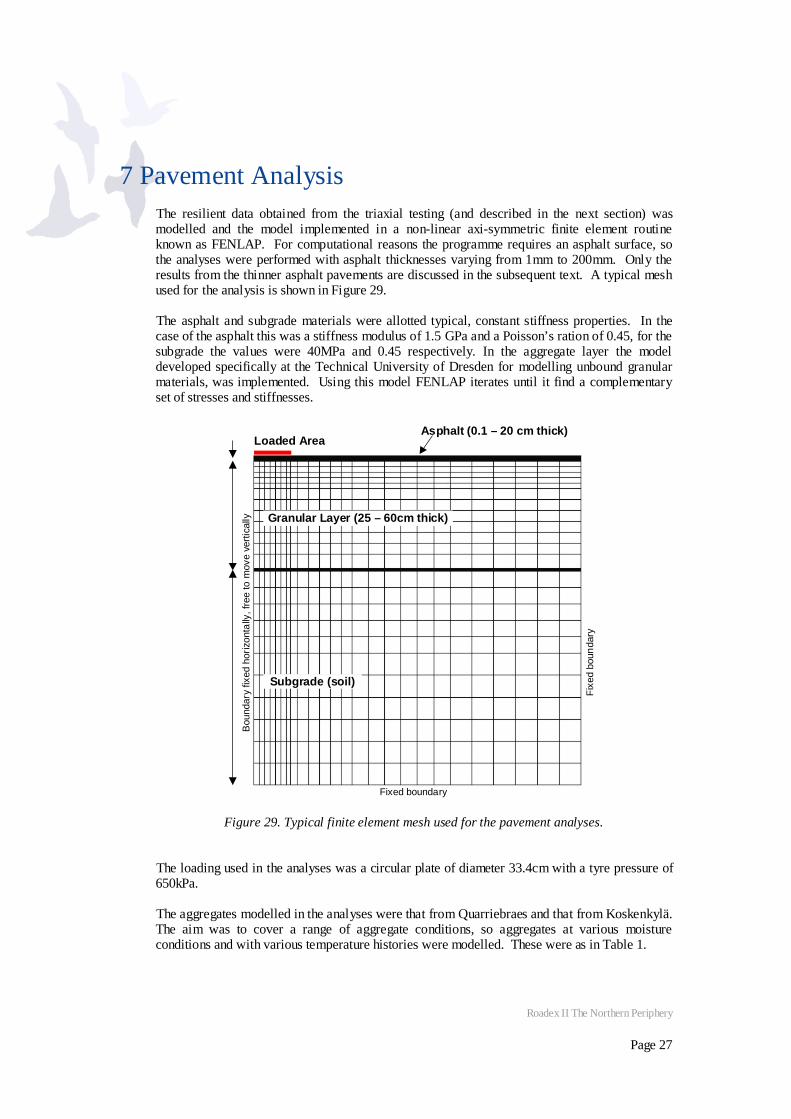
7 Pavement Analysis The resilient data obtained from the triaxial testing (and described in the next section) was modelled and the model implemented in a non-linear axi-symmetric finite element routine known as FENLAP. For computational reasons the programme requires an asphalt surface, so the analyses were performed with asphalt thicknesses varying from 1mm to 200mm. Only the results from the thinner asphalt pavements are discussed in the subsequent text. A typical mesh used for the analysis is shown in Figure 29. The asphalt and subgrade materials were allotted typical, constant stiffness properties. In the case of the asphalt this was a stiffness modulus of 1.5 GPa and a Poisson’s ration of 0.45, for the subgrade the values were 40MPa and 0.45 respectively. In the aggregate layer the model developed specifically at the Technical University of Dresden for modelling unbound granular materials, was implemented. Using this model FENLAP iterates until it find a complementary set of stresses and stiffnesses.
Loaded Area
Subgrade (soil)
Asphalt (0.1 – 20 cm thick)
Granular Layer (25 – 60cm thick)
Fixe
d bo
unda
ry
Bou
ndar
y fix
ed h
oriz
onta
lly, f
ree
to m
ove
verti
cally
Fixed boundary
Figure 29. Typical finite element mesh used for the pavement analyses.
The loading used in the analyses was a circular plate of diameter 33.4cm with a tyre pressure of 650kPa. The aggregates modelled in the analyses were that from Quarriebraes and that from Koskenkylä. The aim was to cover a range of aggregate conditions, so aggregates at various moisture conditions and with various temperature histories were modelled. These were as in Table 1.

Roadex II The Northern Periphery
Page 28
8 Results 8.1 STIFFNESS BEHAVIOUR The triaxial testing showed a very clear change in mechanical behaviour with added fines and extra moisture. Figure 30 shows the reduced stiffness modulus, Mr, as a consequence of these two factors for some of the Quarriebraes aggregate. In the laboratory the moisture conditions are generally set by the tester – thus the results in this figure are largely the consequence of the water condition. As more water is put into the specimen the stiffness reduces. In practice this means that the aggregate layers of the pavement won’t spread the load so well. This means that the stresses on the subgrade will be greater (this is discussed in more detail when the analytical work is described below). The horizontal axis in Figure 30 shows θ where θ is the total stress (summed from the stresses acting in three directions at right angles to each other), i.e. θ = σ1 + σ2 + σ3 . Two other stress parameters are used in this report. They are p (the mean normal stress) which is defined as θ/3 (i.e. it is the average value of the three normal stresses applied), and q, the deviatoric stress (a measure of the shear stress applied). Simply stated, q = σ1 - σ3 .
0
50
100
150
200
250
300
0 100 200 300 400 500 600 700 800 θ (kPa)
Mr (
MPa
)
w=11%, fines=8.2%
w=7.8%, fines=3.5%
w=3.5%, fines=??%
Figure 30. Modulus (Mr) related to stress level of testing, for a variety of test conditions (Quarriebraes aggregate). w= moisture content.
However, the results of Figure 30 are representative of likely in-situ conditions as shown by Figure 31. Here specimens were compacted and brought to a rather dry condition. They were then stood in water for 1 week and allowed to absorb water to satisfy the suction demand caused by the soil’s capillarity. Under this regime much higher water contents result in finer grained aggregates. In Figure 31 voids ratio is a measure of the volume of the pore space. This will be smallest when the pores between the large stones are most filled with fine particles. Thus the figure shows that, when there are less fines in a specimen, less free water will be held in the aggregate (and the dielectric value reduces). Hence the stiffness values (Mr) in Figure 31 should be towards the upper line for low-fines grading distributions and the lower line is, indeed, representative of high fines aggregates in equilibrium with supplies of water from the environment.

Roadex II The Northern Periphery
Page 29
0
5
10
15
20
25
30
0.10 0.15 0.20 0.25 0.30 0.35 0.40 0.45 0.50 Voids ratio
Die
lect
ric v
alue
(TS-
test
) Gravel
Rock
Boundaries as discussed in Section 6.2
Unacceptable Marginal Acceptable
Figure 31. Dielectric values of the tested aggregates as a function of voids ratio. Comparing Figures 31 and 28 it is tentatively suggested that a void ratio greater than 0.33 is required to guarantee that excess moisture won’t be held by capillary forces in a granular material and that a void ratio of 0.24 or less is likely to be associated with excess plastic deformation. That is, rutting will be experienced too rapidly, in-situ, by typical granular base layers with such small pore space if water is made available to them (from rainfall, Spring thaw or malfunctioning drains). Before leaving Figure 30, we should notice, also, that the curves indicate how the value of stiffness modulus, Mr, changes with different θ. Thus, this figure shows that, as the stress on the aggregate rises so does the stiffness but that the rate of increase slows with additional stress. This feature is replicated by the analysis as discussed below (see Figure 38 and associated text).
8.2 PLASTIC BEHAVIOUR Under many cycles of repeated loading as experienced by a pavement during trafficking, plastic deformation builds incrementally. Figure 32 shows the types of response seen. Range A behaviour is the desirable one, deformation takes place initially but finally stops.
The amount of deformation to which Range A type behaviour finally stabilises is very dependent on the amount of water in the aggregate. Figure 33 shows the amount of deformation that will have occurred once stabilisation has been reached. The data are for several aggregates, with different fines contents, with changing water content (n.b. in this graph, to ease interpretation, Range A has been assumed even though some of the wetter specimens may be in Range B).
Figure 32. Indicative permanent strain behaviour.
Perm
anen
t str
ain
Range A
Range B
Range C
Number of load cycles

Roadex II The Northern Periphery
Page 30
0
100
200
300
0 20 40 60 80 100 Relative Moisture Content (% of optimum value)
Perm
anen
t Str
ain
Ass
ympt
ote
x
10-4
(m/m
)
Gneiss, Central Grading Gneiss, Coarse Grading Gneiss, Fine Grading Limestone, Central Grading Limestone, Coarse Grading Limestone, Fine Grading Granite, Central Grading Granite, Coarse Grading Granite, Fine Grading
Figure 33. Permanent strain rate as a function of moisture content for 9 granular materials. Analysis of granular pavements by computational methods and by observation shows that few, if any, aggregates can provide Range A behaviour (see Figure 32) directly under trafficking. Range B behaviour is likely for a well-behaved unsealed or thinly sealed pavement. Range A behaviour may be achieved under a thicker asphalt (e.g. > 80mm). The aim of the engineer with an unsealed or thinly sealed pavement should be, therefore, to obtain Range B type behaviour, not Range C which leads to rapid collapse of the pavement. Furthermore the engineer needs to keep the slope of the Range B line as shallow as possible, thereby prolonging the pavement’s life. Equation 1 gives a simple model of plastic deformation development (which may be broadly applicable to Range B behaviour):
bp Na ⋅=ε Eqn. 1
Here, the total plastic accumulated strain, εp, is controlled by the number of load applications (or passages of a standard axle over the pavement), N, and two material parameters, a and b. From the test data collected, Equation 1 was fitted to the results, using the assumption that a = 100. Hence, it was possible to derive the parameter b as a function of the magnitude of the stress applied to the aggregate. This is given in Figure 34 where the stress ratio q/p is a measure of how close to static failure conditions is the stress applied to the aggregate (values of q/p of around 2 are typical for aggregate at static failure). This particular data refers to a Finnish aggregate with a fines content of 10.7%, which had been subjected to a freeze-thaw cycle prior to testing under repeated loading.

Roadex II The Northern Periphery
Page 31
0
0.1
0.2
0.3
0.4
0.5
0.6
0.7
0 0.5 1 1.5 2
Actual value
Fitting curve 0
0.1
0.2
0.3
0.4
0.5
0.6
0.7
0 0.5 1 1.5 2 Stress ratio q/p
Para
met
er b
Actual value
Fitting curve
Figure 34. Values of permanent deformation equation (Eqn. 1) parameter b as a function of stress applied.
From this, and other, data it appears that a value of b=0.15 is generally acceptable but that higher values of b are usually associated with excessive and/or rapid plastic deformation. Further data of this kind are presented in Table 2. The first four specimens were subjected to monotonic failure testing, while the last four, made as far as possible to replicate the first four specimens were subjected to a series of repeated loads. The results of the failure testing (first four lines) are presented as q/p values. The plastic deformation data was fitted to the model of Equation 1, above, and the value of the parameter b determined. The value of q/p when b=0.15 has then been estimated – the rate of plastic deformation build-up and, hence, rutting should then not be excessive. The value of (q/p)b=0.15/(q/p)failure = qb=0.15/qfailure is listed in the last column.
Material Description Code Moisture Content
(%)
Fines Content
(%)
q/p at failure
q/p for b=0.15
in Eqn. 1
% of q/p at failure
Quarriebraes Moist Q1f 4.0 4.4 1.65 Quarriebraes Saturated Q2f 14.0 2.5 1.65 Quarriebraes Moist, High Fines Q3f 5.7 15.3 0.76 Quarriebraes Saturated, High Fines Q4f 15.1 11.6 0.45 Quarriebraes Moist Q1m 3.7 4.7 1.1 67 Quarriebraes Saturated Q2m 16.1 2.7 1.1 67 Quarriebraes Moist, High Fines Q3m 5.1 13.2 0.55 72 Quarriebraes Saturated, High Fines Q4m 16.6 12.0 0.25 56
Table 2. Stress sensitivity of Quarriebraes materials.
Roadex II The Northern Periphery
Page 32
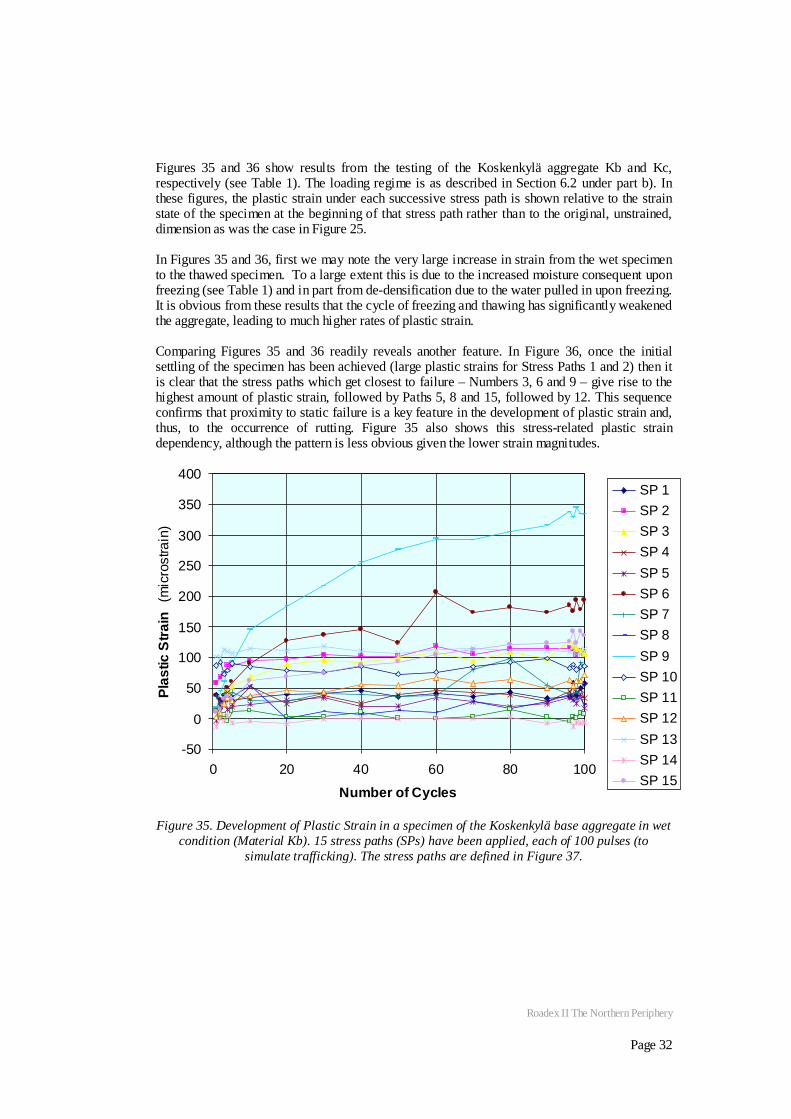
Figures 35 and 36 show results from the testing of the Koskenkylä aggregate Kb and Kc, respectively (see Table 1). The loading regime is as described in Section 6.2 under part b). In these figures, the plastic strain under each successive stress path is shown relative to the strain state of the specimen at the beginning of that stress path rather than to the original, unstrained, dimension as was the case in Figure 25. In Figures 35 and 36, first we may note the very large increase in strain from the wet specimen to the thawed specimen. To a large extent this is due to the increased moisture consequent upon freezing (see Table 1) and in part from de-densification due to the water pulled in upon freezing. It is obvious from these results that the cycle of freezing and thawing has significantly weakened the aggregate, leading to much higher rates of plastic strain. Comparing Figures 35 and 36 readily reveals another feature. In Figure 36, once the initial settling of the specimen has been achieved (large plastic strains for Stress Paths 1 and 2) then it is clear that the stress paths which get closest to failure – Numbers 3, 6 and 9 – give rise to the highest amount of plastic strain, followed by Paths 5, 8 and 15, followed by 12. This sequence confirms that proximity to static failure is a key feature in the development of plastic strain and, thus, to the occurrence of rutting. Figure 35 also shows this stress-related plastic strain dependency, although the pattern is less obvious given the lower strain magnitudes.
-50
0
50
100
150
200
250
300
350
400
0 20 40 60 80 100
Number of Cycles
Plas
tic S
train
(m
icro
stra
in)
SP 1SP 2SP 3SP 4SP 5SP 6SP 7SP 8SP 9SP 10SP 11SP 12SP 13SP 14SP 15
Figure 35. Development of Plastic Strain in a specimen of the Koskenkylä base aggregate in wet condition (Material Kb). 15 stress paths (SPs) have been applied, each of 100 pulses (to
simulate trafficking). The stress paths are defined in Figure 37.

Roadex II The Northern Periphery
Page 33
-500
500
1500
2500
3500
0 20 40 60 80 100
Number of Cycles
Pla
stic
stra
in
(mic
rost
rain
)SP 1SP 2SP 3SP 4SP 5SP 6SP 7SP 8SP 9SP 10SP 11SP 12SP 13SP 14SP 15
Figure 36. Development of Plastic Strain in a specimen of the Koskenkylä base aggregate after thawing (Material Kc). 15 stress paths (SPs) have been applied, each of 100 pulses (to simulate
trafficking). The stress paths are defined in Figure 37.
For the Quarriebraes material, similar results were obtained (although there were no freeze-thaw tests on this material). Figure 38 shows contours of plastic strain per cycle of loading together with the static failure envelope for the Qc material (Saturated, with high fines). Once again it can be readily seen that the plastic strain will be greater as the stress approaches the failure condition.
In summary, it has been found from both materials studied in detail in this investigation, and drawing on information available from other sources, that the amount of plastic strain in an aggregate increases: • When the aggregate gets wetter, • When the aggregate has been frozen
and then is thawed. • When the stress applied gets closer to
the static failure stress condition. The loss of quality upon freezing appears to be mostly due to increased water content caused by suctions developed during freezing and only a little by de-densification due to ice formation. Thus, if both the freezing layer is non frost-susceptible, and the layer beneath is also non frost-susceptible, then little reduction in performance should be expected in the pavement.
Figure 37. Stress paths used for data presented in Figs 8.6 and 8.7. The stresses q and p are, respectively the ‘deviatoric’ (i.e.
shear) stress and the average stress (=1/3rd of θ = σ1 + σ2 + σ3).
0
50
100
150
200
250
300
0 50 100 150 200 250 300 p (kPa)
q (k
Pa)
12
3
45
6
7
8
9
10
11
12
14
13
15
Approximate position of failure condition

Roadex II The Northern Periphery
Page 34
0
100
200
300
0 100 200 300 p (kPa)
q (k
Pa)
0,001<dε/dN<0,004
0,004<dε/dN<0,016
dε/dN>0,016
Contours of dε/dN
Stress limit for failure
Figure 38. Plastic strain rate information obtained from test on Quarriebraes Qc material (saturated, high fines).
It is less clear whether the fines added always have a direct effect on increasing plastic strain (though sometimes they do), but they certainly have a secondary effect, allowing the aggregate to hold more water. This ability to hold water, due to capillary suction, is undesirably exploited on freezing because cryo-suction effects, which act at the freezing front, are able to pull in more and more water if it available at the edge or bottom of an aggregate layer. In the case of the tests on the Quarriebraes aggregate, it is clear that there was a loss of strength (and hence more rutting and more likelihood of excess rutting) when the fines content became excessive. The specimens with 16% fines showed behaviour indicating that the coarse aggregate was, at this composition, ‘floating’ in a matrix of finer particles. Thus the coarse aggregate particles are no longer in intimate contact and much of the inter-connected ‘skeleton’, which provides a key element of strength in compacted aggregates, has been lost. Therefore, for design purposes, taking into account the various findings given above, it would be sensible to ensure that the stress experienced by the pavement doesn’t exceed a certain fraction of the failure stress. Previous researchers have suggested a ratio of q/qf =0.7 – i.e. the deviatoric (or shear) stress applied, q, is limited to 70% of that needed to induce static failure, qf, under, in other respects, the same conditions. The data obtained here suggests that this may, indeed, be a sensible determination. However, the materials tested in this project suggest that this limit should be set at 50-55% when the aggregate is very wet and fines prevent rapid drainage, or during spring thaw conditions, if the amount of rutting is to be kept small (see, for example, Figs 35 – 37). The Tube Suction results suggest that a dielectric value of <9; or a void ratio of >0.33 in a compacted aggregate are required to ensure that rutting is limited in magnitude (though the data on which to base this recommendation is limited at present).
8.3 RESULTS OF ANALYSIS From the analysis of the pavements it is possible to compute the stresses within them. Because the aggregate has a modulus which depends on the stress it experiences and the stress in turn depends, in part, on the modulus, it follows that an iterative analysis is needed. Once a converged solution has been found the value of stiffness and stress are in harmony within the aggregate. In the analyses performed here, the subgrade and asphalt layers were treated as having constant stiffness moduli with the aggregate having a stress-dependent modulus, a sample of which has been illustrated in Figure 30.

Roadex II The Northern Periphery
Page 35
Observations on Aggregate Modulus Figure 39 illustrates the non-linearity of the modulus as found in the granular layers. It can be seen that, for the pavements represented by this plot (the thicknesses of asphalt are as shown, the aggregate is the Scottish Quarriebraes material with moderate fines in a ‘dry’ condition) that the stiffness values computed by the program fairly closely follow the k-θ relationship established from the laboratory repeated load triaxial testing. Small exceptions are at rather low mean stresses, p, where the stiffness tends to be a little lower than would be predicted by slavish use of the model and a little higher than would be expected at mid-range values of p. This difference can mostly be attributed to the different model implemented in the analysis. It is interesting to note that the actual stresses experienced in the pavement can be quite a lot higher than those obtained from the laboratory testing (compare Figure 39 with Figure 30). It can also be seen in Figure 39 that only in the thinnest pavements are the highest values of p and, hence of modulus, Mr, discovered. This is to be expected as the thicker asphalts effectively spread the stresses from the wheel loading and, thus, the maximum stress on the top of the granular layer reduces as the asphalt thickens.
0
50
100
150
200
250
300
350
0 200 400 600 800 p (kPa)
M r
(MP
a)
1mm 1cm 2cm 4cm 10cm 20cm k-θ Model
Asp
halt
thic
knes
s
Figure 39. Non-linear modulus value (Mr) of the Quarriebraes Qa aggregate as a function of mean normal stress, p, in the analysed pavements (which used the Dresden model) and as
defined by the “k-θ” model from laboratory tests. Observations on Rutting in the Aggregate Layer (Mode 1) Figure 40 shows the vertical and horizontal stresses in pavements containing the ‘saturated’ (moisture content is 11%) high fines, Quarriebraes aggregate base in their granular layers. The rapid diminution of both vertical stress and horizontal stress is evident. Note also how the increase of the asphalt above 4 cm thickness significantly reduces the vertical stress – because it is then that the asphalt begins to act as a beam in bending taking a far greater role in load spreading than it did when thinner. Whether this boundary in behaviour is exactly located at 4cm is, however, somewhat open to conjecture. Nevertheless, the principle is clear: Asphalt needs to be greater than a threshold thickness if it is going to achieve effective load spreading and significantly reduce stress on the lower aggregate base layers.

Roadex II The Northern Periphery
Page 36
0
0.1
0.2
0.3
0.4
0.5
0 200 400 600 800Vertical Stress (kPa)
Dep
th (m
)
0
0.1
0.2
0.3
0.4
0.5
0 200 400 600 800Lateral Stress (kPa)
Figure 40. Variation of vertical and horizontal stress in the granular layer of pavements with various thicknesses of asphalt. Aggregate is Scottish Quarriebraes material in ‘saturated’, high
fines condition (Qc). Figure 41 presents the value of shear stress at a depth into the aggregate layer of around 1/3rd of the width of the loaded area (that would be approximately 10cm or greater beneath the pavement’s surface), for the pavements with a 1mm, 1cm and 2cm thick asphalt covers. These depths have been chosen in line with the explanation given above in Section 2 (where Mode 1 rutting is described).
0
50
100
150
200
250
300
0 50 100 150 200 250 300 350
p (kPa)
q (k
Pa)
1mm
2cm 1cm
Failure Line
Figure 41. Stress condition at depths of 10, 12.5, 15, 20 and 25cm beneath the top of the asphalt.
[Asphalt is 1mm, 1cm or 2cm thick as shown, so depth into aggregate varies with asphalt thickness. Stress at shallowest point on right, deepest point to right]. Data is for the
Quarriebraes saturated high fines mix. (Compare with Figure 38).

Roadex II The Northern Periphery
Page 37
The figure shows that, in general, the thickest asphalt cover leads to the lowest stresses in the aggregate, although this is not always the case as a thinner asphalt not only changes the stress but also, thereby, the modulus which in turn leads to different stresses. Thus the relative stress seen in the aggregate as the asphalt cover changes is also affected by the material’s stiffness characteristics. Figure 41 also shows that the material is closest to static failure at a depth of 10cm or 15cm into the pavement (around 9 and 14cm respectively into the aggregate). It is this stress condition that the designer needs to keep away from the failure line in order to reduce the onset of rutting within the aggregate layer. This might be achieved by moving the failure line (e.g. by improving the granular material by, for example, drainage) or by placing more asphalt to move the aggregate stress condition lower. This depth of maximum shear loading is entirely in-line with that which simple theory predicts. Boussinesq’s theory for elastic foundations (comprising one material of infinite depth) predicts that maximum shear will take place at a depth of between 1/3rd and a half of the width of the loaded area. For the analysis performed here that should be at a depth of between 11cm and 17cm in an un-sealed pavement – which is exactly the depth shown in Figure 41. A slightly greater depth would be expected for asphalted pavements as the asphalt will act as a partial load spreader making the area loaded effectively a little wider. Interpreting this data in a q/qf manner, as above at the end of Section 8.2, maximum values of the q/qf failure ratios for the Quarriebraes dry moderate fines aggregate are between approximately 65% (2cm asphalt) and 80% (1cm asphalt). These values indicate that these pavements may be expected to experience premature rutting under trafficking. It is known that the Quarriebraes material does show rutting, particularly in wet weather and this gives some explanation as to why this should be. Given the in-situ experience perhaps a 75-80% q/qf criterion would be appropriate for this material.
Observations on Rutting in the Subgrade (Mode 2) As the aggregate layer is thickened, so the stress on the subgrade reduces. Figure 42 shows this reduction. The highly stressed zone at the top left of both parts of the figure indicates the high stress in the aggregate just under the wheel load. As can be seen, there is far more opportunity for the stress to decrease by the start of the subgrade when 400mm of aggregate is used (right figure) than when only 300mm is used (left figure).
A B
400m
m 300m
m
top of subgrade
Figure 42. Vertical stress due to traffic (material self-weight stresses are excluded) in the aggregate layer. Note the lighter blue (higher stress) at B than at A. The right figure shows a 300mm thick aggregate pavement, the left figure shows a 400mm thick aggregate pavement.
Both comprise Koskenkylä wet, Kb, aggregate. The bottom of the figure represents the top of the subgrade.

Roadex II The Northern Periphery
Page 38
Analyses were performed with varying thicknesses of the aggregate with an arbitrary target vertical stress of the subgrade set as 70kPa. In reality the subgrade would rut, or not, depending on the shear stress relative to its shear strength in much the same way as was discussed for the aggregate. However, as this analysis included only a very simple subgrade model and as no definitive testing was performed on subgrade materials, it is only important that some reference permissible stress is used to compare the ability of the aggregate to spread load. On this basis the thicknesses of the different aggregates to achieve the arbitrary 70kPa vertical stress were computed and are shown in Table 3.
It is immediately apparent that the reduction in moisture and in fines causes an improved material, which can therefore be used more thinly to achieve the same load spreading.
Material Description Code Moisture Content
(%)
Fines Content
(%)
Thickness (cm) required to keep vertical stress on
subgrade < 70kPa
Quarriebraes Dry Qa 3.5 5.12 49 Quarriebraes Wet Qb 7.8 3.53 56 Quarriebraes Saturated, High Fines Qc 11.0 8.24 57 Koskenkylä Base, Dry Ka 26 Koskenkylä Base, Wet Kb 40 Koskenkylä Base, After Thaw Kc 48 Koskenkylä SubBase, Dry Kd 26 Koskenkylä SubBase, Wet Ke 45 Koskenkylä SubBase, After Thaw Kf 50
Table 3. Aggregate thickness needed to protect subgrade

Roadex II The Northern Periphery
Page 39
9 Discussion and Conclusions This project has clearly shown the sensitivity of a pavement to the moisture content of the granular material that makes up the pavement’s base layer(s). On the basis of the work performed in this project and taking into account the work performed by the authors and others in previous and associated studies (e.g. Brown and Dawson, 1992) it would be sensible to ensure that the stress experienced by the aggregate layers in a pavement doesn’t exceed a certain fraction of the failure stress. A ratio of q/qf =70% is suggested for many conditions. However, the materials tested in this project suggest that this limit should be set at 50-55% when the aggregate is very wet and fines prevent rapid drainage, or during spring thaw conditions, if the amount of rutting is to be kept small. At present repeated load triaxial testing would be needed to confirm that the 70% or 50-55% thresholds applied for materials not previously assessed, but assessment could, in future, be achieved by a source-characterization programme rather than a project-specific one. To prevent rutting in practice, the following strategy is proposed:
i. Ensure that compacted aggregate layers have a void ratio of greater than 0.24 (or, if possible, 0.33)
ii. Check that the tube suction measured dielectric value of the surface of the compacted aggregate is less than 10, preferably less than 9, after drying the specimen at 40-50oC and then letting it adsorb water from the base of the specimen. The value of 9 is recommended here, rather than the value 8 as presented earlier (e.g. Fig. 28), because in the taller triaxial specimen the ‘water table’ is further away from the measurement sensor than in the tube suction test specimen, therefore a dryer result (lower dielectric value) is expected as a function of the test rather than as a function of the material.
iii. If the material satisfies point i, but not point ii, then it should be noted that this source should be processed to produce extra low fines in future or treated as follows.
iv. If the desired dielectric value cannot be obtained then use the material with special water protection provision. This should comprise a capillary break beneath the aggregate layer in seasonally affected frost areas and, if at all possible, a sealed surface in all locations. This sealed surface should extend beyond the carriageway to maximise the width of sealed shoulders (though full structural capacity is not required there) as research elsewhere (COURAGE, 1999) has indicated the significant benefit of keeping the wetting path as long as possible.
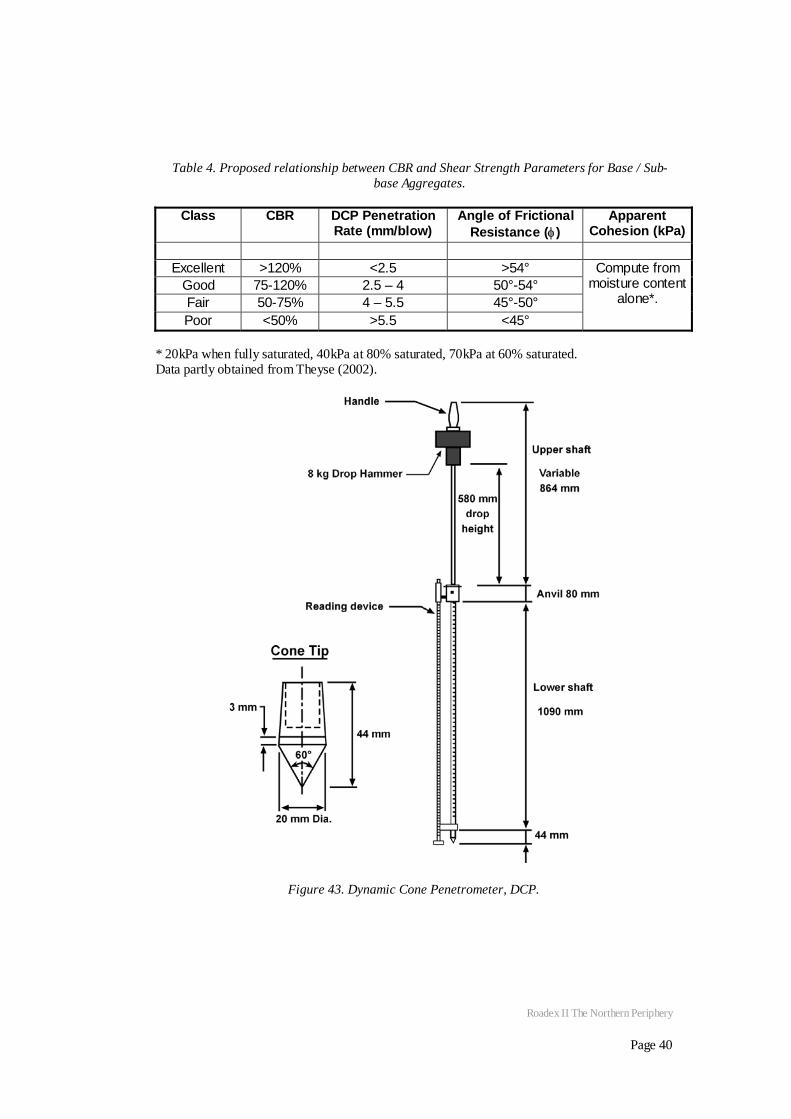
v. Assess the strength of the aggregate in a wet condition in-situ. This can be achieved by wetting the aggregate in a compacted area (part of the carriageway under construction or, better, a pre-construction trial) and then using the Dynamic Cone Penetrometer (DCP) – see Figure 43. [The DCP has been found to provide a rapid strength determination of aggregate layers and established correlations, Figure 44, are available to allow estimates of strength to be made from the DCP’s results]. The DCP is only usable with reliability if the maximum particle size is less than 40mm. For coarser aggregates (e.g. as often used on forest pavements) there is no simple means of assessing the strength. The DCP results must then be converted to a conventional strength assessment in terms of angle of frictional resistance (ϕ) or to a line on a p-q plot as, for example, in Figure 41. In the absence of a fully quantitative relationship, a classification approach is suggested – see Table 4.
Roadex II The Northern Periphery
Page 40
Table 4. Proposed relationship between CBR and Shear Strength Parameters for Base / Sub-base Aggregates.
Class CBR DCP Penetration
Rate (mm/blow) Angle of Frictional
Resistance (φ) Apparent
Cohesion (kPa)
Excellent >120% <2.5 >54° Good 75-120% 2.5 – 4 50°-54° Fair 50-75% 4 – 5.5 45°-50° Poor <50% >5.5 <45°
Compute from moisture content
alone*.
* 20kPa when fully saturated, 40kPa at 80% saturated, 70kPa at 60% saturated. Data partly obtained from Theyse (2002).
Figure 43. Dynamic Cone Penetrometer, DCP.

Roadex II The Northern Periphery
Page 41
Figure 44. Converting from DCP penetration rate (PI) to CBR value or to Unconfined Compressive Strength.
vi. Design lines are now plotted at 70% and 55% of this limiting value – as in the sample shown in Figure 45.
Failure Condition qf q
p
0.7 qf 0.55 qf
Figure 45. Sample design graph.
vii. Use Boussinesq theory to predict the magnitude of the combination of shear and mean
stress for the traffic of concern which most nearly approaches the boundary lines set in Step vi. This will require a knowledge of :
• The traffic imposed stress • The wheel print
but not of the stiffness of the layer as this is not part of Boussinesq’s requirements. The values may be computed from the figures in the Appendix.
viii. Plot this computed stress on the version of Figure 45, which was previously drawn. Check that the stress condition is not too high.

Roadex II The Northern Periphery
Page 42
ix. If the stress is too great then either replace or treat the aggregate, or add a covering layer. If aggregate treatment is proposed, go to Step i. If added thickness will be the solution then Step vii can be used to predict the new stress state. Some allowance can be made for the extra load spreading effects of an asphaltic layer. It is suggested that asphalt thickness, for the purpose of the Boussinesq calculation can be treated as 1.5 times as thick as it is actually intended to be when the thickness is less than 60mm and 2 times as thick when the asphalt is thicker than this.
x. Having designed the aggregate and any overlying layers to prevent Mode 1 rutting, the aggregate thickness must be designed to prevent Mode 2 rutting. The minimum thickness required can be calculated using a layered elastic analysis will be required to compute the thickness. Such computational tools are readily available (e.g. the public domain program ELSYM5). The input data for this, however, is a little more difficult to assess. Poisson’s ratio values may be assumed (0.35 for aggregate and 0.45 for subgrade soils are typical values). Stiffness modulus values will be needed. The simplest means of collecting such data would be by use of a lightweight falling weight device (e.g. the Prima device) on trial constructions. The results of the linear elastic layered analysis will be an imposed stress on the subgrade.
xi. The computed vertical stress on the subgrade should be kept to a figure less than 2 times the unconfined strength. The value of the unconfined strength may be determined in several ways. One of the simplest (but not necessarily the most reliable) is to use the DCP-UCS relationship given in Figure 44. The UCS is twice the undrained strength (Cu). Alternatively, specimens may be tested in a laboratory by conventional geotechnical means. However, allowance must be made to ensure that the subgrade is in its worst condition which can be expected during the pavement life. Thus it may be sensible to test an artificially wetted subgrade prior to construction or to test at a time of spring thaw. The measured unconfined strength should be increased somewhat to allow for the confining effect which will be provided by the completed pavement construction which will ultimately lie on top of the subgrade. This allowance can be made using standard geotechnical bearing capacity depth factors.
xii. The computations in Step x are now repeated until the imposed stress onto the subgrade is less than the strength limit described in Step xi.
xiii. In areas affected by seasonal frost Steps x to xii may not be sufficient. There the depth of aggregate placed to prevent excessive damage – especially unevenness – will almost invariably be greater than that required to ensure structural acceptability. For such pavements the minimum thicknesses in Table 5 are suggested (or greater thicknesses if required by Steps x – xii). These dimensions are based on the observations at the test sections (e.g. Figure 14 and the calculations from Table 3).
Table 5. Minimum aggregate thickness in seasonal frost areas.
Subgrade Soil Type Minimum thickness (mm) Not frost susceptible As Steps x - xii Moderately susceptible Greatest of Steps x - xii or 400mm Highly susceptible Greatest of Steps x - xii or 650mm
Increasing aggregate thicknesses above those given in Table 5 will help to reduce the development of roughness associated with uneven subgrade frost heave. This should be considered for more heavily trafficked pavements and/or those carrying high-speed traffic. The above procedure does not specifically address durability of aggregate particles. It is assumed that aggregates with very weak stones are not being considered, having been excluded by prior durability assessment using conventional particle durability tests.

Roadex II The Northern Periphery
Page 43
10 Pavement Rehabilitation The thrust of this study, and this report, has been concerning pavement design. However, we recognise that many engineers will be more concerned with the maintenance and rehabilitation of their existing pavements. In principle, the same techniques as described here may be used to assess in-situ pavements. Instead of building a trial pavement to obtain DCP data, the existing pavement may be assessed and its performance predicted in the same manner as given. Samples will need to be retrieved from the pavement in order to perform Tube Suction measurements and, if desired, to perform triaxial testing. However, for the most part the Steps described in the previous section may be performed and the required thickness ascertained. If the design thickness is too small then the overlaying to produce the required thickness will be indicated. In general, it will be necessary for the engineer to ensure that a representative material is sampled from the road and tested both in the laboratory and in-situ. This will not necessarily be an easy task as segregation of unsealed pavement aggregate due to trafficking and re-profiling will often give a-typical gradings across the pavement whilst frost, pumping and rutting disturbance may all cause uneven distribution of fines through the depth of the pavement. In such circumstances it is usually prudent to use a finer than average grading as the test material as it is the performance of the poorest material which will most control the overall pavement performance.

Roadex II The Northern Periphery
Page 44
11 Concluding Remarks The work reported here and the recommendations which flow from this work are, necessarily, incomplete. The authors have endeavoured to use the data arising from the study together with published information and their own data from other projects to propose a best method of design. However there are several uncertainties and experience is required to determine the reliability of the approach suggested. In particular the accuracy of the numerical values suggested need greater validation than has been possible in this project. The Tube Suction test may also be used to assess the sensitivity of the aggregate’s behaviour to the moisture condition, thereby giving a means of predicting how the qf response might change with (e.g.) spring thaw. It may be used for simple laboratory studies a priori or for in-situ assessments to establish the current condition of an unsealed pavement. The issue of fines in an aggregate doesn’t appear to have been completely resolved. Where sufficient fines are present, either initially or after trafficking, the granular layer will hold water and the value of qf will significantly reduce thereby promoting significant in-aggregate rutting. Simple permeability testing might be the quickest and easiest way to determine the acceptable amount of fines that can be held in the aggregate without preventing drainage, especially if the retained moisture after permeability testing is measured. This should be investigated in the future. There is some evidence from this study that higher fines, irrespective of the moisture, lowers qf, but only strength testing on a range of materials and a range of fines can help with this aspect. The use of the DCP in-situ will assist with this. Thickness design can use the type of assessments reported here and the simplified Boussinesq design approach suggested as a practical expedience, but a non-linear stiffness analysis is needed to do this meaningfully, thereby requiring more sophisticated testing than is normally or cheaply available. In principle, this should be for both granular layer materials and for the subgrade. In areas where frost is not a great issue (in coastal areas and parts of Scotland) and the aggregate quality reasonable the aggregate thickness will be selected so as not to allow the subgrade to rut (Mode2 rutting). In such circumstances a full non-linear analysis may be necessary or, at minimum a layered analysis with a mean stiffness value determined from laboratory (or perhaps in-situ) testing. Otherwise the stress applied to the subgrade cannot be determined with any accuracy so the required thickness to reduce the stress imposed by traffic, through the granular layers, to an acceptable level cannot be estimated. However, where deep seasonal frost is of importance, the depth of aggregate placed to prevent excessive damage – especially unevenness – will almost invariably be greater than that required to ensure structural acceptability. For such pavements minimum thicknesses are suggested based on the computed and observed thicknesses which are successful, but it is recognised that these suggestions are made on the basis of rather limited data. This is an area for further study. If an overlying asphalt is to be dimensioned, once again, a non-linear analysis is warranted. However, a conservative analysis may be available if a notional, uniform, stiffness for the aggregate is adopted. Then the thickness of asphalt required to reduce the stress near the top of the aggregate to an acceptable level (according to the 70% or 50-55% of qf discussed above) can be estimated. A problem with this is that the sensitivity to conservative assumptions isn’t known and this could deliver artificially thick asphalt layers. Again, this is an area for future study.

Roadex II The Northern Periphery
Page 45
12 References Ayers, M.E., Thompson, M.R. and Uzarski., D.R., 1989, "Rapid Shear Strength Evaluation of In Situ Granular Materials", Transportation Research Record 1227, pp134-146. Brown, S.F. and Dawson, A.R., 1992, “Two-stage approach to asphalt pavement design”, Proc. 7th Int’l. Conf. Asphalt Pavements, Nottingham, June, Vol. 1, pp. 16-34. COURAGE, 1999, “Construction with unbound road aggregates in Europe”, final report to European Union, University of Nottingham. (see www.nott.ac.uk/courage). Saarenketo, Timo; Scullion, Tom and Kolisoja, Pauli 1998. ”Moisture Susceptibility and Electrical Properties of Base Course Aggregates”. Proceedings of BCRA’98, July 6-8, Trondheim, Norway, Volume 3, pp. 1401-1410. Theyse, H, 2002, “Stiffness, strength and performance of unbound aggregate material: Application of South African HVS and laboratory results to California flexible pavements”, Univ. of California, Pavement Research Center, 86pp.

Roadex II The Northern Periphery
Page 46
Appendix 1 – Stress Plots A stress analysis program was used to compute the stresses in a semi-infinite layer of constant modulus and Poisson’s Ratio of 0.35 for a surface load applied over a circular area of radius 1m. Stress evaluations were made at a grid spacing of 0.1m horizontally and vertically over a radius and to a depth of 3m. A selection of the results has been plotted as Figures A1 and A2. The first figure (Fig. A1) plots values of mean normal stress, p, normalised with respect to the surface loading. The second (Fig. A2) plots the deviatoric stress. Again, q is shown normalised with respect to the applied surface load. In each case the coloured zones are at 0.1 intervals.
Figure A1 Non-dimensional values of p Figure A2 Non-dimensional values of q
0
0.2
0.4
0.6
0.8
1.0
1.2
1.4
1.6
1.8
0 0.2 0.4 0.6 0.8 1.0 1.2
Radius (m) Radius (m)
Dep
th (
m)
0.1 0.2
0.4
0.6
0.8
1.0
1.2
1.4
1.6
1.8
Dep
th (
m)
0 0.2 0.4 0.6 0.8 1.0 1.2 1.4
0.1
0.2
0.3
0.4 0.5
0.6
0.7
0.6
0.5
0.4
0.3
0.625
Contours shows fraction of applied surface stress at intervals of 0.1 (p) and 0 .05 (q).

Roadex II The Northern Periphery
Page 47

Roadex II The Northern Periphery
Page 48
Roadex Publications ROADEX II
ROADEX II - Focusing on Low Volume Roads in the Northern Periphery DVD
User Perspective to ROADEX II Test Areas’ Road Network Service Level
Permanent deformation
New material treatment techniques
Managing spring thaw weakening on low volume roads
Socio-economic impacts of road conditions on low volume roads
Dealing with bearing capacity problems on low volume roads constructed on peat
Drainage on low traffic volume roads
Environmental guidelines
Environmental guidelines, pocket book
Road management policies for low volume roads – some proposals
Structural Innovations
Monitoring, communication and information systems & tools for focusing actions
ROADEX I
Roadex Multi-media CD-ROM
Road Condition Management of Low Traffic Volume Roads in the Northern Periphery
Winter Maintenance Practice in the Northern Periphery,
Generation of ‘Snow Smoke’ behind Heavy Vehicles
Copyright © 2005 Roadex II Northern Periphery. All rights reserved.
Roadex II Lead Partner: The Highland Council, Transport, Environmental & Community Service, HQ,
Glenurquhart Road,
Inverness IV3 5NX Scotland.