research article evaluation of permanent deformation of
TRANSCRIPT

Research ArticleEvaluation of Permanent Deformation ofUnmodified and Rubber-Reinforced SMA Asphalt MixturesUsing Dynamic Creep Test
Herda Yati Katman,1,2 Mohd Rasdan Ibrahim,1 Mohamed Rehan Karim,1
Nuha Salim Mashaan,1 and Suhana Koting1
1Department of Civil Engineering, Centre for Transportation Engineering, University of Malaya, 50603 Kuala Lumpur, Malaysia2College of Engineering, Universiti Tenaga Nasional, 43000 Selangor, Malaysia
Correspondence should be addressed to Herda Yati Katman; [email protected]
Received 9 December 2014; Accepted 27 January 2015
Academic Editor: Krystyn Van Vliet
Copyright © 2015 Herda Yati Katman et al. This is an open access article distributed under the Creative Commons AttributionLicense, which permits unrestricted use, distribution, and reproduction in any medium, provided the original work is properlycited.
This paper presents the evaluation of permanent deformation of rubber-reinforced SMA asphalt mixtures by using dynamiccreep test. The effect of trans-polyoctenamer as a cross-linking agent in permanent deformation of rubberized mixtures was alsoevaluated. Dynamic creep test was conducted at different stress levels (200 kPa, 400 kPa) and temperatures (40∘C, 50∘C). Permanentdeformation parameters such as dynamic creep curve, ultimate strain, and creep strain slope (CSS) were used to analyse the results.Finally, the creep behaviour of the specimens was estimated by the Zhou three-stage creep model. The results show that crumbrubber and trans-polyoctenamer significantly affected the parameters especially at high stress and temperatures. Consistent findingswere observed for all permanent deformation parameters. Moreover, based on Zhou model, it was concluded that resistance topermanent deformation was improved by application of crumb rubber and trans-polyoctenamer.
1. Introduction
Mechanical behaviour of asphalt highly depends on ambi-ent temperature due to its viscoelastic properties. Asphaltbecomes softer and less viscous as temperature increases. Onaccount of that, asphalt binder becomes more susceptible toadopt permanent deformation and thus accelerates rutting inwheel tracks. Moreover, stress induced by loading is anothermain parameter that leads to permanent deformation inasphalt pavement.
Rutting is observed as the main distress mechanism typ-ically occurring in countries with high pavement in-servicetemperature like Malaysia. Malaysia essentially experiencestropical weather with the mean annual air temperatureof 28∘C and maximum air temperature of 45∘C and themaximum average air temperature during the hottest 7-dayperiod (over the pavement design life) being 38∘C [1]. Roadpavement temperature in Malaysia on the other hand rangesfrom 20∘C in the early hours of the day to as high as 60∘C
in midday during a hot day. In addition, overloaded vehiclesare very common users of Malaysian roads. In 2008, 27% or270,000 out of the onemillion registered commercial vehicleson the roads in the country were commonly overloaded.Overloading of such with high environmental temperaturecould cause great damage to pavements and therefore dete-riorate pavement performance faster than planned.
Incorporating waste tyre in the pavement can be usedto tackle some of the pavement problems as shown bymany research studies [2–4]. Due to the benefits offered bycrumb rubber, many research works have been implementedon the effects of chemical additives to further increasethe performance of rubberized binder. Recent studies haveshown that the properties of rubberized binder can beimproved by adding substances such as chemical stabilizer, anactivation agent, and polymers in which the main function isto activate the rubber asphalt interaction and improve cross-linking. For instance, incorporating trans-polyoctenamer torubberized binder improves the elastic responses at high
Hindawi Publishing CorporationAdvances in Materials Science and EngineeringVolume 2015, Article ID 247149, 11 pageshttp://dx.doi.org/10.1155/2015/247149

2 Advances in Materials Science and Engineering
+
+
+
Cyclooctene (COE)1,5-Cyclooctadiene(COD)
Cat.
Cat.
1,3-Butadiene
Cat.
n
(CH2)6(CH2)6
(CH2)6 (CH2)6
(CH2)6(CH2)6
(CH2)6 (CH2)6
(CH2)6(CH2)6
Figure 1: Synthesis of trans-polyoctenamer [22].
temperatures and reduced creep stiffness at low temperatures[5]. Therefore this modification reduces the risk of crackingat low temperatures and rutting at high temperatures.
Trans-polyoctenamer is a kind of polymer with a doublebond structure, in which the main task is to cross-link thesulphur of the asphaltene and the sulphur on the surfaceof the crumb rubber to form a ring and mesh composedof chain polymers [6]; thus, it prevents the sinking of therubber particles by increasing the viscosity. Evonik DegussaGmbH [7], explained that trans-polyoctenamer chemically
bonds to the crumb rubber during its blending and convertsthe thermoplastic asphalt to a thermoset polymer that canhelp reduce cracking and rutting. Trans-polyoctenamer isstructured of cyclooctene which is synthesized from 1,3-butadiene via 1,5-cyclooctadiene. Cyclooctene is polymer-ized to polyoctenamer that produces both linear and cyclicmacromolecules.Themolecular formula of polyoctenamer is–(C4H7=C4H7)– 𝑛 and its synthesis is shown in Figure 1.
Dynamic creep test performed using such well recog-nized apparatus like the Universal Testing Machine (UTM),
Advances in Materials Science and Engineering 3
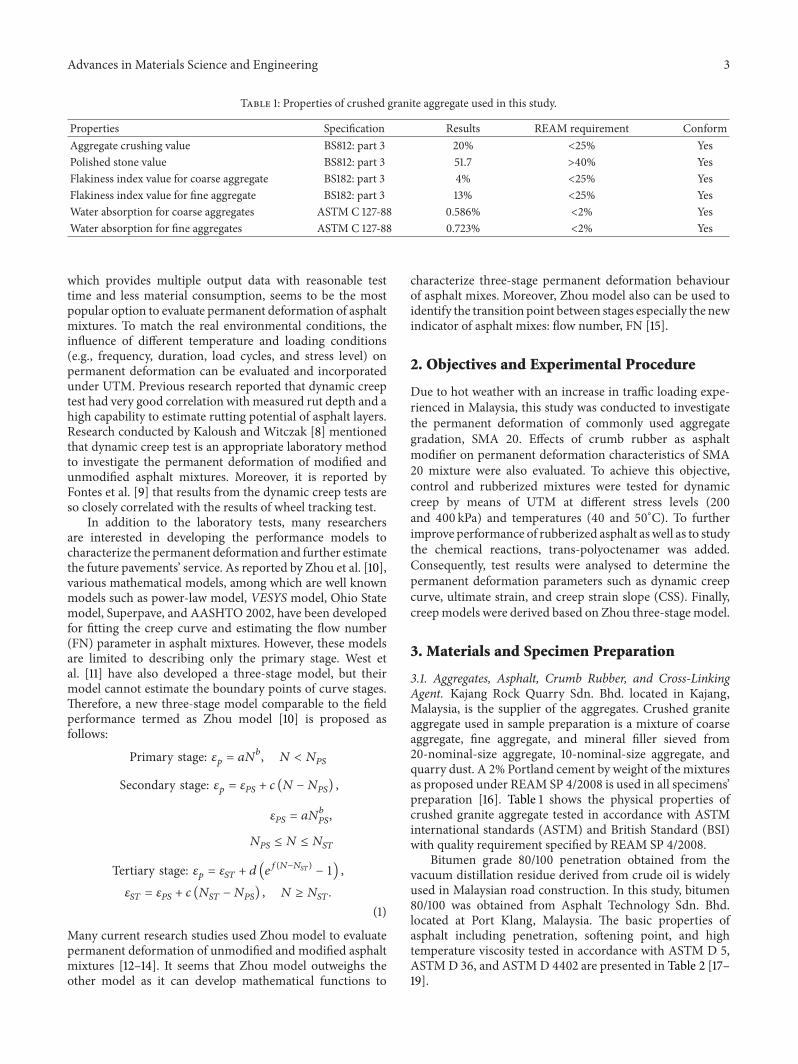
Table 1: Properties of crushed granite aggregate used in this study.
Properties Specification Results REAM requirement ConformAggregate crushing value BS812: part 3 20% <25% YesPolished stone value BS812: part 3 51.7 >40% YesFlakiness index value for coarse aggregate BS182: part 3 4% <25% YesFlakiness index value for fine aggregate BS182: part 3 13% <25% YesWater absorption for coarse aggregates ASTM C 127-88 0.586% <2% YesWater absorption for fine aggregates ASTM C 127-88 0.723% <2% Yes
which provides multiple output data with reasonable testtime and less material consumption, seems to be the mostpopular option to evaluate permanent deformation of asphaltmixtures. To match the real environmental conditions, theinfluence of different temperature and loading conditions(e.g., frequency, duration, load cycles, and stress level) onpermanent deformation can be evaluated and incorporatedunder UTM. Previous research reported that dynamic creeptest had very good correlation with measured rut depth and ahigh capability to estimate rutting potential of asphalt layers.Research conducted by Kaloush and Witczak [8] mentionedthat dynamic creep test is an appropriate laboratory methodto investigate the permanent deformation of modified andunmodified asphalt mixtures. Moreover, it is reported byFontes et al. [9] that results from the dynamic creep tests areso closely correlated with the results of wheel tracking test.
In addition to the laboratory tests, many researchersare interested in developing the performance models tocharacterize the permanent deformation and further estimatethe future pavements’ service. As reported by Zhou et al. [10],various mathematical models, among which are well knownmodels such as power-law model, VESYS model, Ohio Statemodel, Superpave, and AASHTO 2002, have been developedfor fitting the creep curve and estimating the flow number(FN) parameter in asphalt mixtures. However, these modelsare limited to describing only the primary stage. West etal. [11] have also developed a three-stage model, but theirmodel cannot estimate the boundary points of curve stages.Therefore, a new three-stage model comparable to the fieldperformance termed as Zhou model [10] is proposed asfollows:
Primary stage: 𝜀𝑝= 𝑎𝑁𝑏
, 𝑁 < 𝑁𝑃𝑆
Secondary stage: 𝜀𝑝= 𝜀𝑃𝑆+ 𝑐 (𝑁 − 𝑁
𝑃𝑆) ,
𝜀𝑃𝑆= 𝑎𝑁𝑏
𝑃𝑆
,
𝑁𝑃𝑆≤ 𝑁 ≤ 𝑁
𝑆𝑇
Tertiary stage: 𝜀𝑝= 𝜀𝑆𝑇+ 𝑑 (𝑒
𝑓(𝑁−𝑁𝑆𝑇)
− 1) ,
𝜀𝑆𝑇= 𝜀𝑃𝑆+ 𝑐 (𝑁
𝑆𝑇− 𝑁𝑃𝑆) , 𝑁 ≥ 𝑁
𝑆𝑇.
(1)
Many current research studies used Zhou model to evaluatepermanent deformation of unmodified and modified asphaltmixtures [12–14]. It seems that Zhou model outweighs theother model as it can develop mathematical functions to
characterize three-stage permanent deformation behaviourof asphalt mixes. Moreover, Zhou model also can be used toidentify the transition point between stages especially the newindicator of asphalt mixes: flow number, FN [15].
2. Objectives and Experimental Procedure
Due to hot weather with an increase in traffic loading expe-rienced in Malaysia, this study was conducted to investigatethe permanent deformation of commonly used aggregategradation, SMA 20. Effects of crumb rubber as asphaltmodifier on permanent deformation characteristics of SMA20 mixture were also evaluated. To achieve this objective,control and rubberized mixtures were tested for dynamiccreep by means of UTM at different stress levels (200and 400 kPa) and temperatures (40 and 50∘C). To furtherimprove performance of rubberized asphalt as well as to studythe chemical reactions, trans-polyoctenamer was added.Consequently, test results were analysed to determine thepermanent deformation parameters such as dynamic creepcurve, ultimate strain, and creep strain slope (CSS). Finally,creepmodels were derived based on Zhou three-stagemodel.
3. Materials and Specimen Preparation
3.1. Aggregates, Asphalt, Crumb Rubber, and Cross-LinkingAgent. Kajang Rock Quarry Sdn. Bhd. located in Kajang,Malaysia, is the supplier of the aggregates. Crushed graniteaggregate used in sample preparation is a mixture of coarseaggregate, fine aggregate, and mineral filler sieved from20-nominal-size aggregate, 10-nominal-size aggregate, andquarry dust. A 2% Portland cement by weight of the mixturesas proposed under REAM SP 4/2008 is used in all specimens’preparation [16]. Table 1 shows the physical properties ofcrushed granite aggregate tested in accordance with ASTMinternational standards (ASTM) and British Standard (BSI)with quality requirement specified by REAM SP 4/2008.
Bitumen grade 80/100 penetration obtained from thevacuum distillation residue derived from crude oil is widelyused in Malaysian road construction. In this study, bitumen80/100 was obtained from Asphalt Technology Sdn. Bhd.located at Port Klang, Malaysia. The basic properties ofasphalt including penetration, softening point, and hightemperature viscosity tested in accordance with ASTM D 5,ASTMD 36, and ASTMD 4402 are presented in Table 2 [17–19].

4 Advances in Materials Science and Engineering
Table 2: Basic properties of asphalt and rubberized asphalt.
Properties Control asphalt Rubberized asphalt80/100 pen 12R 12R 4.5V
Penetration (25∘C, 100 g, 5 s) (0.01mm) (ASTM D 5) 95.00 67.50 66.29Softening point (ring and ball) (∘C) (ASTM D 36) 44.25 51.00 53.00Viscosity at 135∘C (mPa s) (ASTM D 4402) 375.25 807.80 997.80
Table 3: Specification of crumb rubber used in this study.
Chemical and physical properties Rubber size30mesh
Acetone extract (ISO 1407), % 10 ± 3Ash content (ISO), % 8 ± 3Carbon black (ISO 1408), % 30 ± 5Rubber hydrocarbon (RHC), % 52 ± 5Passing (ASTM D5644), % >90Heat loss (ASTM D1509), % <1Metal content (ASTM D5603), % <1Fiber content (ASTM D5603), % <3
In order to investigate the effect of the crumb rubber onrutting resistance of SMA20mixtures, crumb rubber sized 30mesh (0.60mm) supplied by Rubplast Sdn. Bhd. was used inthis study. Twelve percent (12%) of crumb rubber by weightof bitumen 80/100 penetration was used in preparation ofrubberized bitumen. Table 3 shows the chemical and physicalproperties of crumb rubber.
Trans-polyoctenamer bought from Evonik DegussaGmbH,Germany,with the trademarkVestenamerwas chosenas a cross-link dispersant, which, along with crumb rubber,might improve the binder performance. The recommendeddosage, 4.5% by weight of crumb rubber, was incorporatedinto rubberized bitumen [20–22]. Table 4 shows the chemicaland physical properties of trans-polyoctenamer, respectively.
3.2. Mix Design
3.2.1. Preparation of Rubberized Asphalt. Rubberized asphaltwas prepared by adding crumb rubber sized 30 mesh(0.60mm) to 80/100 pen asphalt cement. In this study,rubberized asphalt was prepared with 12% crumb rubber(12R) and 12% crumb rubber with 4.5% trans-polyoctenamer(12R 4.5V). The mixing was done using propeller mixerat speed of 200 rpm for 45 minutes and mixing temper-ature was maintained at 180∘C. Crumb rubber and trans-polyoctenamer were added simultaneously at the beginningof the mixing. For all types of rubberized asphalt, amountof crumb rubber is calculated by weight of the asphalt, whileamount of trans-polyoctenamer is calculated by weight of thecrumb rubber.
The laboratory produced rubberized asphalt was givenidentification names. Table 5 presents the binder ID with thematrix for three types of binders developed and evaluated inthis study. Control sample designated as control was preparedwith bitumen 80/100 penetration. 12R stands for rubberized
0
20
40
60
80
100
0 0 1 10 100
Cum
ulat
ive %
pas
sing
Size (mm)
Mid-ptLower limitUpper limit
Figure 2: SMA 20 aggregate gradation.
asphalt prepared with 12% of crumb rubber (by weight of80/100 penetration bitumen), whereas 12R 4.5V is rubberizedasphalt prepared with 12% crumb rubber (by weight ofbitumen 80/100 penetration) and 4.5% trans-polyoctenamer(by weight of crumb rubber).
3.2.2. Preparation of Specimen. In this study SMA 20 aggre-gate gradation as shown in Figure 2 was used in preparationof all specimens. Optimum asphalt content determined byMarshall method was used. It was determined that optimumasphalt content for control specimen is 5.0%, whereas 5.5%is the optimum asphalt content for specimens prepared with12R and 12R 4.5V binder. Table 6 shows the mix design ofspecimens evaluated in this study. The same designationswere also used in specimen prepared from the respectivebinders.
Each specimen comprised 1100 g of aggregates and 2% ofPortland cement by weight of the mix. Aggregate and cementwere heated in the oven for one hour at 150∘C. Aggregate wasthen transferred to the pan and heated at higher temperatureof 170∘C. The rubberized asphalt (12R and 12R 4.5V) atoptimum content was added to the aggregate and mixed at170∘C until all aggregates were fully coated with the binder.Mixture was then transferred to the Marshall mould and wasspaded 15 times around the parameter and 10 times over theinterior. Mixture was compacted by applying 50 blows forboth sides with the Marshall compactor when temperaturereached 140∘C. After compaction, the mould was removedfrom the base-plate; the specimen was cured for 24 hours inthe mould at room temperature before extruding it by means
Advances in Materials Science and Engineering 5
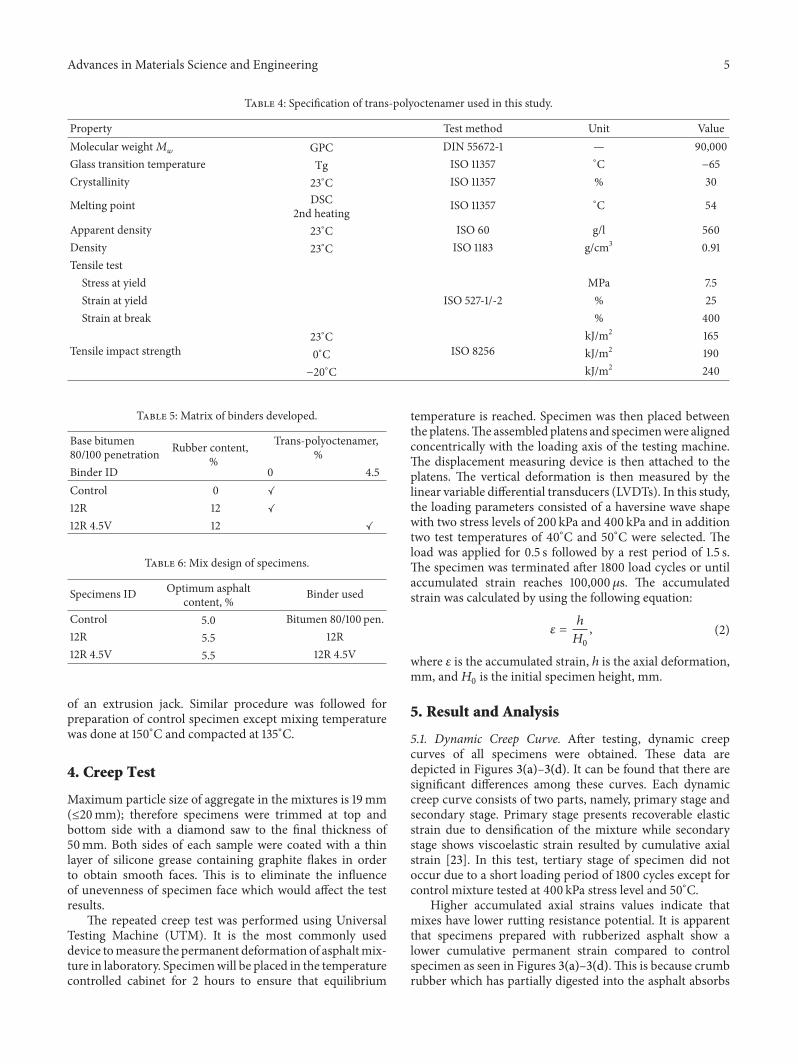
Table 4: Specification of trans-polyoctenamer used in this study.
Property Test method Unit ValueMolecular weight𝑀
𝑤GPC DIN 55672-1 — 90,000
Glass transition temperature Tg ISO 11357 ∘C −65Crystallinity 23∘C ISO 11357 % 30
Melting point DSC2nd heating ISO 11357 ∘C 54
Apparent density 23∘C ISO 60 g/l 560Density 23∘C ISO 1183 g/cm3 0.91Tensile test
Stress at yield MPa 7.5Strain at yield ISO 527-1/-2 % 25Strain at break % 400
Tensile impact strength23∘C
ISO 8256kJ/m2 165
0∘C kJ/m2 190−20∘C kJ/m2 240
Table 5: Matrix of binders developed.
Base bitumen80/100 penetration Rubber content,
%
Trans-polyoctenamer,%
Binder ID 0 4.5Control 0 ✓
12R 12 ✓
12R 4.5V 12 ✓
Table 6: Mix design of specimens.
Specimens ID Optimum asphaltcontent, % Binder used
Control 5.0 Bitumen 80/100 pen.12R 5.5 12R12R 4.5V 5.5 12R 4.5V
of an extrusion jack. Similar procedure was followed forpreparation of control specimen except mixing temperaturewas done at 150∘C and compacted at 135∘C.
4. Creep Test
Maximum particle size of aggregate in the mixtures is 19mm(≤20mm); therefore specimens were trimmed at top andbottom side with a diamond saw to the final thickness of50mm. Both sides of each sample were coated with a thinlayer of silicone grease containing graphite flakes in orderto obtain smooth faces. This is to eliminate the influenceof unevenness of specimen face which would affect the testresults.
The repeated creep test was performed using UniversalTesting Machine (UTM). It is the most commonly useddevice tomeasure the permanent deformation of asphaltmix-ture in laboratory. Specimenwill be placed in the temperaturecontrolled cabinet for 2 hours to ensure that equilibrium
temperature is reached. Specimen was then placed betweenthe platens.The assembled platens and specimenwere alignedconcentrically with the loading axis of the testing machine.The displacement measuring device is then attached to theplatens. The vertical deformation is then measured by thelinear variable differential transducers (LVDTs). In this study,the loading parameters consisted of a haversine wave shapewith two stress levels of 200 kPa and 400 kPa and in additiontwo test temperatures of 40∘C and 50∘C were selected. Theload was applied for 0.5 s followed by a rest period of 1.5 s.The specimen was terminated after 1800 load cycles or untilaccumulated strain reaches 100,000 𝜇s. The accumulatedstrain was calculated by using the following equation:
𝜀 =
ℎ
𝐻0
, (2)
where 𝜀 is the accumulated strain, ℎ is the axial deformation,mm, and𝐻
0is the initial specimen height, mm.
5. Result and Analysis
5.1. Dynamic Creep Curve. After testing, dynamic creepcurves of all specimens were obtained. These data aredepicted in Figures 3(a)–3(d). It can be found that there aresignificant differences among these curves. Each dynamiccreep curve consists of two parts, namely, primary stage andsecondary stage. Primary stage presents recoverable elasticstrain due to densification of the mixture while secondarystage shows viscoelastic strain resulted by cumulative axialstrain [23]. In this test, tertiary stage of specimen did notoccur due to a short loading period of 1800 cycles except forcontrol mixture tested at 400 kPa stress level and 50∘C.
Higher accumulated axial strains values indicate thatmixes have lower rutting resistance potential. It is apparentthat specimens prepared with rubberized asphalt show alower cumulative permanent strain compared to controlspecimen as seen in Figures 3(a)–3(d).This is because crumbrubber which has partially digested into the asphalt absorbs

6 Advances in Materials Science and Engineering
0
5000
10000
15000
20000
25000
0 500 1000 1500 2000Load cycle
Cum
ulat
ive p
erm
anen
t str
ain
(𝜇s)
(a)
0
5000
10000
15000
20000
25000
30000
35000
0 500 1000 1500 2000Load cycle
Cum
ulat
ive p
erm
anen
t str
ain
(𝜇s)
(b)
0
5000
10000
15000
20000
25000
30000
35000
40000
45000
50000
0 500 1000 1500 2000Load cycle
Cum
ulat
ive p
erm
anen
t str
ain
(𝜇s)
Control
12R 4.5V12R
(c)
Control
0
10000
20000
30000
40000
50000
60000
70000
80000
90000
100000
0 500 1000 1500 2000Load cycle
Cum
ulat
ive p
erm
anen
t str
ain
(𝜇s)
12R 4.5V12R
(d)
Figure 3: Cumulative permanent strain versus load cycle for control and rubberized mixtures tested at (a) 200 kPa at 40∘C, (b) 200 kPa at50∘C, (c) 400 kPa at 40∘C, and (d) 400 kPa at 50∘C.
the aromatic oils from the asphalt into the rubber’s polymerchains. It implies the formation of gel-like material thatresults in higher viscosity and elasticity of the asphalt. Suchinteractions improve the binder networking and allow greaterfilm thickness surrounding the aggregate in the mixture.This will reinforce the aggregate bonding of the mixturesthus resulting in higher strength. Furthermore, the crumbrubber which is not digested in the asphalt will maintain theirintegrity, interweave together, and form a three-directionalnetwork when distributed uniformly in the mixtures. Thisspatial reinforcing network could reinforce the mixtures andresist damage propagation.
As can be seen in Figures 3(a)–3(d), incorporating trans-polyoctenamer as a cross-link dispersant agent in preparationof rubberized binder indicates a significant enhancementin the behaviour of mixtures as showed by 12R 4.5V mix-tures. This implies that trans-polyoctenamer improves the
rheological properties of rubberized binder by activating thecrumb rubber and asphalt to form a chemical reaction. Thereaction permits cross-linking with the sulfur associated withthe asphaltenes andmaltenes in the asphalt to create amacro-polymer network. Finally, a uniform, low tack, rubber-likecomposite is produced which is capable of improving therutting resistance of the mixtures [24].
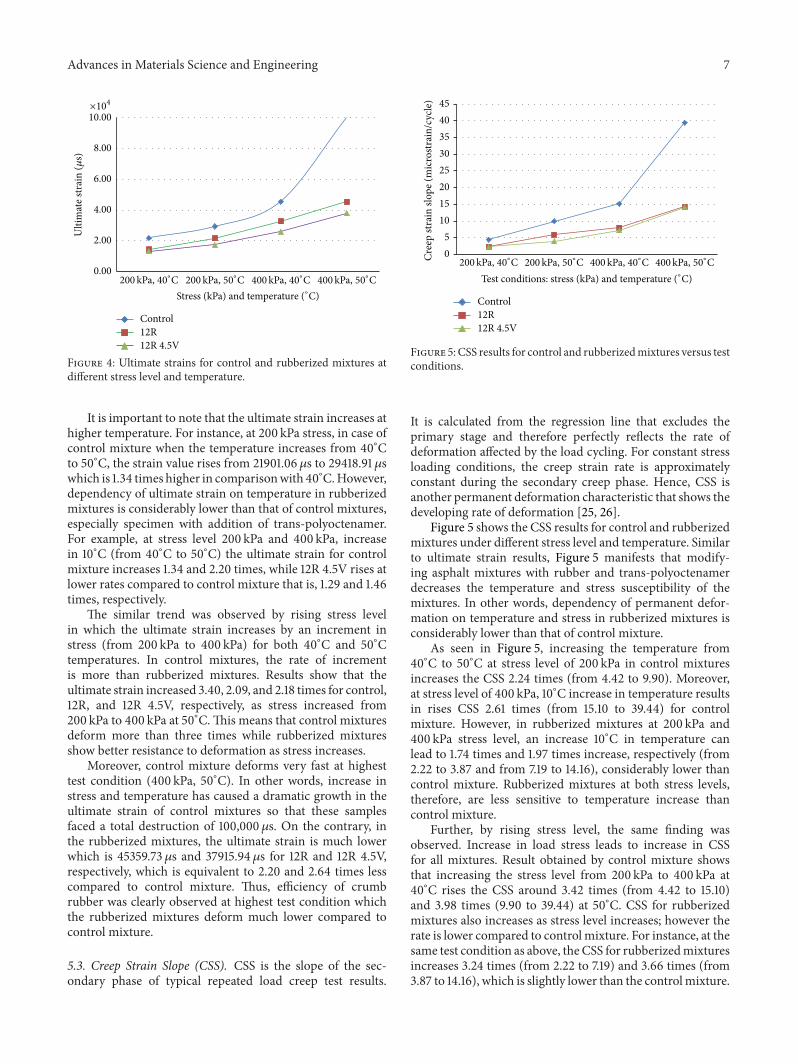
5.2. Ultimate Strain. Results of ultimate strain after 1800load cycles are illustrated in Figure 4. As can be seen in thefigure, the ultimate strain of rubberized mixtures improvesremarkably compared to the control mixtures. In all test con-ditions, specimens prepared with 12R 4.5V show the lowestultimate strain followed by 12R and controlmixture. It impliesthat incorporating crumb rubber and trans-polyoctenamerin asphalt provides significant impact on susceptibility ofmixtures to permanent deformation.
Advances in Materials Science and Engineering 7
0.00
2.00
4.00
6.00
8.00
10.00
Control
Ulti
mat
e str
ain
(𝜇s)
12R 4.5V12R
Stress (kPa) and temperature (∘C)
×104
200 kPa, 40∘C 200 kPa, 50∘C 400kPa, 40∘C 400kPa, 50∘C
Figure 4: Ultimate strains for control and rubberized mixtures atdifferent stress level and temperature.
It is important to note that the ultimate strain increases athigher temperature. For instance, at 200 kPa stress, in case ofcontrol mixture when the temperature increases from 40∘Cto 50∘C, the strain value rises from 21901.06𝜇s to 29418.91 𝜇swhich is 1.34 times higher in comparisonwith 40∘C.However,dependency of ultimate strain on temperature in rubberizedmixtures is considerably lower than that of control mixtures,especially specimen with addition of trans-polyoctenamer.For example, at stress level 200 kPa and 400 kPa, increasein 10∘C (from 40∘C to 50∘C) the ultimate strain for controlmixture increases 1.34 and 2.20 times, while 12R 4.5V rises atlower rates compared to control mixture that is, 1.29 and 1.46times, respectively.
The similar trend was observed by rising stress levelin which the ultimate strain increases by an increment instress (from 200 kPa to 400 kPa) for both 40∘C and 50∘Ctemperatures. In control mixtures, the rate of incrementis more than rubberized mixtures. Results show that theultimate strain increased 3.40, 2.09, and 2.18 times for control,12R, and 12R 4.5V, respectively, as stress increased from200 kPa to 400 kPa at 50∘C.This means that control mixturesdeform more than three times while rubberized mixturesshow better resistance to deformation as stress increases.
Moreover, control mixture deforms very fast at highesttest condition (400 kPa, 50∘C). In other words, increase instress and temperature has caused a dramatic growth in theultimate strain of control mixtures so that these samplesfaced a total destruction of 100,000𝜇s. On the contrary, inthe rubberized mixtures, the ultimate strain is much lowerwhich is 45359.73 𝜇s and 37915.94 𝜇s for 12R and 12R 4.5V,respectively, which is equivalent to 2.20 and 2.64 times lesscompared to control mixture. Thus, efficiency of crumbrubber was clearly observed at highest test condition whichthe rubberized mixtures deform much lower compared tocontrol mixture.
5.3. Creep Strain Slope (CSS). CSS is the slope of the sec-ondary phase of typical repeated load creep test results.
05
1015202530354045
Cree
p str
ain
slope
(mic
rostr
ain/
cycle
)
Control
12R 4.5V12R
Test conditions: stress (kPa) and temperature (∘C)200 kPa, 40∘C 200 kPa, 50∘C 400kPa, 40∘C 400kPa, 50∘C
Figure 5: CSS results for control and rubberizedmixtures versus testconditions.
It is calculated from the regression line that excludes theprimary stage and therefore perfectly reflects the rate ofdeformation affected by the load cycling. For constant stressloading conditions, the creep strain rate is approximatelyconstant during the secondary creep phase. Hence, CSS isanother permanent deformation characteristic that shows thedeveloping rate of deformation [25, 26].
Figure 5 shows the CSS results for control and rubberizedmixtures under different stress level and temperature. Similarto ultimate strain results, Figure 5 manifests that modify-ing asphalt mixtures with rubber and trans-polyoctenamerdecreases the temperature and stress susceptibility of themixtures. In other words, dependency of permanent defor-mation on temperature and stress in rubberized mixtures isconsiderably lower than that of control mixture.
As seen in Figure 5, increasing the temperature from40∘C to 50∘C at stress level of 200 kPa in control mixturesincreases the CSS 2.24 times (from 4.42 to 9.90). Moreover,at stress level of 400 kPa, 10∘C increase in temperature resultsin rises CSS 2.61 times (from 15.10 to 39.44) for controlmixture. However, in rubberized mixtures at 200 kPa and400 kPa stress level, an increase 10∘C in temperature canlead to 1.74 times and 1.97 times increase, respectively (from2.22 to 3.87 and from 7.19 to 14.16), considerably lower thancontrol mixture. Rubberized mixtures at both stress levels,therefore, are less sensitive to temperature increase thancontrol mixture.
Further, by rising stress level, the same finding wasobserved. Increase in load stress leads to increase in CSSfor all mixtures. Result obtained by control mixture showsthat increasing the stress level from 200 kPa to 400 kPa at40∘C rises the CSS around 3.42 times (from 4.42 to 15.10)and 3.98 times (9.90 to 39.44) at 50∘C. CSS for rubberizedmixtures also increases as stress level increases; however therate is lower compared to controlmixture. For instance, at thesame test condition as above, the CSS for rubberizedmixturesincreases 3.24 times (from 2.22 to 7.19) and 3.66 times (from3.87 to 14.16), which is slightly lower than the controlmixture.

8 Advances in Materials Science and Engineering
0
20000
40000
60000
80000
100000
120000
0 10 20 30 40 50Creep strain slope (microstrain/cycle)
Ulti
mat
e str
ain
(𝜇s)
R2 = 0.9884
y = 2299.5x + 9556.1
Figure 6: Ultimate strain versus creep strain slope for control andrubberized mixtures.
The above findings show that the rubberizedmixtures are lesssusceptible to stress level compared to control mixture.
It is important to note that comparison of CSS betweencontrol and rubberized mixtures becomes more significantas stress level and temperature increase. For instance, therate of CSS for control mixtures is 1.99, 2.56, 2.10, and 2.78times that of the 12R 4.5V for 200 kPa, 40∘C; 200 kPa, 50∘C;400 kPa, 40∘C; and 400 kPa, 50∘C, respectively. However, itseems that low temperature and low stress level did not revealthe benefits of rubberized asphalt. Above phenomenon isprobably due to the behaviour of crumb rubber particlesthat do not dissolve entirely in asphalt; it swells and adsorbsthe certain components of the asphalt. Therefore the crumbrubber maintains their integrity and acts as flexible fillerin the mixtures. At high temperature, the crumb rubberis stiffer than the asphalt while at low temperature theasphalt is stiffer whereas the crumb rubber properties donot change significantly. Thus, at low temperature and stresslevel, the strength of mixture is not attributable to the role ofrubberized binder but rathermore to the contact points in theaggregate skeleton. As seen in Figure 5, at 200 kPa stress leveland 40∘C temperature, the CSS for all mixtures is not muchdifferent; thus it supported above justification.
Relationship between ultimate strain and CSS is shownin Figure 6. There is a good correlation between these twoparameters. The relationship coefficient of the fitted curve,𝑅2, is 0.9884. It is apparent that ultimate strain increases with
an increase of CSS. Therefore if the creep strain slope of themix is being enhanced; then its susceptibility to permanentdeformation will increase as the consequence. Thus ultimatestrain and CSS are considered to be useful parameters forevaluating the permanent deformation susceptibility of themixtures.
6. Zhou Three-Stage Model
In this study, Zhou three-stage model was used for betterunderstanding of permanent deformation behaviour of themixtures. Regression analysis as explained by Zhou et al.[10] was utilized to determine the mathematical functions as
0
200
400
600
800
1000
1200
Control
Cycle
s
Mixtures
200 kPa, 40∘C200 kPa, 50∘C
400kPa, 40∘C400kPa, 50∘C
12R 4.5V12R
Figure 7: Number of load cycles at first stage for control andrubberized mixtures at all test conditions.
well as transition points between each stage and use it formodelling each stage.
The results are presented in Tables 7 and 8. Achievedresults show that all curves obey the Zhou model. Similarstrain values are observed when predicted strains calculatedvia mathematical functions based on Zhou model werecomparable with measured strain.
As seen in Tables 7 and 8, results show that control andrubberized mixtures only achieve the secondary stage. Thisis due to short loading cycles (1800); tertiary stage was notachieved. However, at 400 kPa stress and 50∘C, the controlmixtures enter the tertiary stage after 829 loading cycleswhereas the rubberized mixtures are still at the second stage.
Figure 7 shows number of load cycles at first stage alsoknown as transition point from first stage to second stage forall mixtures. Generally, the number of load cycles decreasesas stress level and temperature increase. As first stage presentsrecoverable elastic and second stage presents viscoelasticbehaviour of the mixture, it means that specimen changes toviscoelastic behaviour faster as stress level and temperatureincrease. At 40∘C, for instance, increasing stress level from200 kPa to 400 kPa leads the control mixture to enter thesecond stage from 1173 cycles to 469 cycles which is 2.5 timesfaster.
From Figure 7, it can be illustrated that length of firststage for rubberized mixture is longer than control mixture.This shows that rubberized mixtures sustain the first stagelonger compared to control mixture. For example, at 400 kPaand 40∘C, transition point for 12R mixture is 979 cycleswhile control mixture is 469 cycles which is more than twotimes longer. Although the length of first stage of modifiedmixtures is generally longer than control mixture, exceptionis observed at low test condition (200 kPa stress level and40∘C temperature).

Advances in Materials Science and Engineering 9
Table 7: Three-stage models and boundary points for control and modified mixtures at 200 kPa stress.
Testtemperature Sample
Primary stage Secondary stage Tertiarystage
Model End point Measuredstrain, 𝜇s
Predictedstrain, 𝜇s Model End
point Model
40∘C
Control 𝜀𝑃
= 2979.3𝑁0.2628𝑁 = 1173 19100.08 19086.48 𝜀
𝑃
= 19086.48 + 4.422(𝑁-1173) a a
12R 𝜀𝑃
= 2331.3𝑁0.2486𝑁 = 865 12222.56 12523.92 𝜀
𝑃
= 12523.92 + 2.235(𝑁-865) a a
12R 4.5V 𝜀𝑃
= 2169.4𝑁0.248𝑁 = 831 11294.98 11492.13 𝜀
𝑃
= 11492.13 + 2.223(𝑁-831) a a
50∘C
Control 𝜀𝑃
= 2513.8𝑁0.3004𝑁 = 479 16116.79 16051.05 𝜀
𝑃
= 16051.05 + 9.904(𝑁-479) a a
12R 𝜀𝑃
= 2505.7𝑁0.2737𝑁 = 701 15183.12 15059.21 𝜀
𝑃
= 15059.21 + 5.886(𝑁-701) a a
12R 4.5V 𝜀𝑃
= 2227.5𝑁0.2673𝑁 = 901 13865.05 13728.26 𝜀
𝑃
= 13728.26 + 3.865(𝑁-901) a a
aNot found at the end of 1800 load cycle.
Table 8: Three-stage models and boundary points for control and modified mixtures at 400 kPa stress.
Testtemperature Sample
Primary stage Secondary stage Tertiary stage
Model Endpoint
Measuredstrain, 𝜇s
Predictedstrain, 𝜇s Model End
point Model
40∘C
Control 𝜀𝑃
= 4088N0.2949𝑁 = 469 25185.27 25074.93 𝜀
𝑃
= 25074.93 + 15.1(𝑁-469) a a
12R 𝜀𝑃
= 3740.9N0.2823𝑁 = 979 26216.27 26138.10 𝜀
𝑃
= 26138.10 + 7.977(𝑁-979) a a
12R 4.5V 𝜀𝑃
= 2891.4N0.277𝑁 = 647 17659.15 17367.15 𝜀
𝑃
= 17367.15 + 7.19(𝑁-647) a a
50∘C
Control 𝜀𝑃
= 5146.9N0.307𝑁 = 169 25046.38 24860.33 𝜀𝑃 = 24860.33 + 39.439
(𝑁-169) 𝑁 = 829 𝜀𝑃
= 50890.1 +2789.6(𝑒0.0046(𝑁-829)−1)
12R 𝜀𝑃
= 4100.3N0.2983𝑁 = 599 27859.29 27626.26 𝜀𝑃 = 27626.26 + 14.184
(𝑁-599) a a
12R 4.5V 𝜀𝑃
= 3923.8N0.2462𝑁 = 269 15792.31 15556.50 𝜀
𝑃
= 15556.5 + 14.162(𝑁-269) a a
aNot found at the end of 1800 load cycle.
7. Statistical Analysis
Statistical analysis was performed using SPSS software toanalyse the relationships between permanent deformation ofthe mixtures and the parameters. The two-way analysis ofvariance (ANOVA) was used with a confidence interval of95% (𝛼 = 0.05). To present permanent deformation of themixtures, ultimate strain was selected as dependent variablewhile temperature, stress, and additive (rubber and trans-polyoctenamer) were selected as independent variables. Theresult of two-way ANOVA is tabulated in Table 9, which indi-cates that temperatures, stress, and additive have a significanteffect on the ultimate strain when the𝑃 value is less than 0.05.The interaction effect between the chosen parameters also hasa significant effect on the ultimate strain.
8. Conclusion and Recommendations
Based on the findings, use of crumb rubber in constructionof pavement deserves serious consideration as it significantly
improves the resistance to deformation compared to unmod-ified mixtures. The effect of crumb rubber is more significantat high stress and temperature. This fits in with Malaysia’sconditions which observe tropical weather and high trafficvolume.Moreover, addition of trans-polyoctenamer increasesthe resistance to deformation of rubberized mixtures.
Conclusion has been drawn as follows.
(1) Trans-polyoctenamer improves the properties of rub-berized asphalt as best resistance to permanent defor-mation shown by 12R 4.5V at all test conditions.
(2) At higher stress level and temperature, permanentdeformation resistance of both control and rubber-ized mixtures decreased.
(3) Methods to analyse the permanent deformation bydynamic creep curve, ultimate strain, and CSS areconsistent.

10 Advances in Materials Science and Engineering
Table 9: Two-way ANOVA on ultimate strain.
Source SS df MS 𝐹 𝑃 valueCorrected model 1.727𝐸10 11 1.570𝐸9 575.347 0.000Intercept 3.410𝐸10 1 3.410𝐸10 12495.654 0.000Stress 6.012𝐸9 1 6.012𝐸9 2203.268 0.000Temperature 2.126𝐸9 1 2.126𝐸9 779.059 0.000Additive 3.795𝐸9 2 1.897𝐸9 695.332 0.000Stress ∗ temperature 8.442𝐸8 1 8.442𝐸8 309.402 0.000Stress ∗ additive 1.361𝐸9 2 6.806𝐸8 249.424 0.000Temperature ∗ additive 8.831𝐸8 2 4.416𝐸8 161.829 0.000Stress ∗ temperature ∗ additive 7.231𝐸8 2 3.616𝐸8 132.513 0.000Error 5.457𝐸7 20 2728588.943Total 5.663𝐸10 32a. 𝑅 Squared = 0.997 (adjusted 𝑅 Squared = 0.995).
(4) Creep curve observes the Zhou model trend. Pre-dicted strain calculated by Zhou model is similar tomeasured strain.
(5) Based on Zhou model, length of first stage of creepcurve increased considerably in rubberized mixtures.
Conflict of Interests
The authors declare that there is no conflict of interestsregarding the publication of this paper.
Acknowledgments
The authors would like to acknowledge the Departmentof Civil Engineering, Faculty of Engineering, University ofMalaya, Kuala Lumpur, Malaysia, for providing the labora-tory facilities to perform this study.This investigation is a partof the research supported by University of Malaya throughGrant RP 010A-13SUS.
References
[1] ATJ 5/85, “Manual for the structural design of flexible pave-ment,” Jabatan Kerja Raya Malaysia, 2013.
[2] N. S. Mashaan and M. R. Karim, “Evaluation of permanentdeformation of CRM-reinforced SMA and its correlation withdynamic stiffness and dynamic creep,” The Scientific WorldJournal, vol. 2013, Article ID 981637, 7 pages, 2013.
[3] N. S. Mashaan, A. H. Ali, S. Koting, and M. R. Karim, “Per-formance evaluation of crumb rubber modified stone masticasphalt pavement in Malaysia,” Advances in Materials Scienceand Engineering, vol. 2013, Article ID 304676, 8 pages, 2013.
[4] N. S. Mashaan, M. R. Karim, M. Abdel Aziz, M. R. Ibrahim, H.Y. Katman, and S. Koting, “Evaluation of fatigue life of CRM-reinforced SMA and its relationship to dynamic stiffness,” TheScientific World Journal, vol. 2014, Article ID 968075, 11 pages,2014.
[5] G. Yadollahi and H. Sabbagh Mollahosseini, “Improving theperformance of CrumbRubber bitumen bymeans of Poly Phos-phoric Acid (PPA) andVestenamer additives,”Construction andBuilding Materials, vol. 25, no. 7, pp. 3108–3116, 2011.
[6] H. Liu, Z. Chen, W. Wang, H. Wang, and P. Hao, “Investigationof the rheological modification mechanism of crumb rubbermodified asphalt (CRMA) containing TOR additive,” Construc-tion and Building Materials, vol. 67, part B, pp. 225–233, 2014.
[7] Evonik Degussa GmbH, http://www.vestenamer.com/sites/dc/Downloadcenter/Evonik/Product/VESTENAMER/en/bro-chures/VESTENAMER%20Asphalt%20english.pdf.
[8] K. E. Kaloush andM.W.Witczak, “Tertiary flow characteristicsof asphalt mixtures,” Journal of the Association of Asphalt PavingTechnologists, vol. 71, pp. 248–280, 2002.
[9] L. P. T. L. Fontes, G. Triches, J. C. Pais, and P.A.A. Pereira, “Eval-uating permanent deformation in asphalt rubber mixtures,”Construction and Building Materials, vol. 24, no. 7, pp. 1193–1200, 2010.
[10] F. Zhou, T. Scullion, and L. Sun, “Verification and modeling ofthree-stage permanent deformation behavior of asphalt mixes,”Journal of Transportation Engineering, vol. 130, no. 4, pp. 486–494, 2004.
[11] R. C.West, J. Zhang, and L. A. Cooley, “Evaluation of the asphaltpavement analyzer for moisture sensitivity testing,” NationalCenter for Asphalt Technology (NCAT) report 04-04, AuburnUniversity, Auburn, Ala, USA, 2004.
[12] A. Khodaii and A. Mehrara, “Evaluation of permanent defor-mation of unmodified and SBSmodified asphalt mixtures usingdynamic creep test,” Construction and Building Materials, vol.23, no. 7, pp. 2586–2592, 2009.
[13] A. Mehrara and A. Khodaii, “Evaluation of asphalt mixtures’moisture sensitivity by dynamic creep test,” Journal of Materialsin Civil Engineering, vol. 23, no. 2, pp. 212–219, 2011.
[14] T. Baghaee Moghaddam, M. Soltani, and M. R. Karim, “Eval-uation of permanent deformation characteristics of unmodi-fied and Polyethylene Terephthalate modified asphalt mixturesusing dynamic creep test,”Materials andDesign, vol. 53, pp. 317–324, 2014.
[15] K. E. Kaloush, M. W. Witczak, and G. B. Way, PerformanceEvaluation of Arizona Asphalt Rubber Mixtures Using AdvancedDynamic Material Characterization Tests, Department of Civiland Environmental Engineering, College of Engineering andApplied Sciences, Arizona State University, 2002.
[16] REAM SP 4/2008 Specification for Polymer Modified AsphalticConcrete, Road Engineering Association of Malaysia, 2008.

Advances in Materials Science and Engineering 11
[17] ASTM D5-13, Standard Test Method for Penetration of Bitumi-nous Materials, American Society for Testing and Materials,2004.
[18] ASTM, “Standard test method for softening point of bitumen(ring-and-ball apparatus),” ASTM D36—14e1, American Soci-ety for Testing and Materials, 2004.
[19] ASTM D4402-13 Standard Test Method for Viscosity Determi-nation of Asphalt at Elevated Temperatures Using a RotationalViscometer, American Society for Testing and Materials, 2006.
[20] B. Burns, “Rubber-modified asphalt paving binder,” U.S. Patentno. 5,936,015, 1999.
[21] M. Solaimanian, D. Anderson, and D. Hunter, Evaluationof Vestenamer Reactive Modifier in Crumb Rubber Asphalt,Pennsylvania Transportation Institute, 2003.
[22] K. L. N. Ng Puga, Rheology and performance evaluation ofpolyoctenamer as asphalt rubber modifier in hot mix asphalt[M.S. thesis], Iowa State University, 2013.
[23] S. Gokhale, B. Choubane, T. Byron, and M. Tia, “Rut initiationmechanisms in asphalt mixtures as generated under acceleratedpavement testing,”Transportation Research Record, no. 1940, pp.136–145, 2005.
[24] G. Yadollahi and H. Sabbagh Mollahosseini, “Improving theperformance of CrumbRubber bitumen bymeans of Poly Phos-phoric Acid (PPA) andVestenamer additives,”Construction andBuilding Materials, vol. 25, no. 7, pp. 3108–3116, 2011.
[25] G.-P. He and W.-G. Wong, “Laboratory study on permanentdeformation of foamed asphalt mix incorporating reclaimedasphalt pavement materials,” Construction and Building Mate-rials, vol. 21, no. 8, pp. 1809–1819, 2007.
[26] G.-P. He andW.-G. Wong, “Effects of moisture on strength andpermanent deformation of foamed asphalt mix incorporatingRAPmaterials,”Construction andBuildingMaterials, vol. 22, no.1, pp. 30–40, 2008.

Submit your manuscripts athttp://www.hindawi.com
ScientificaHindawi Publishing Corporationhttp://www.hindawi.com Volume 2014
CorrosionInternational Journal of
Hindawi Publishing Corporationhttp://www.hindawi.com Volume 2014
Polymer ScienceInternational Journal of
Hindawi Publishing Corporationhttp://www.hindawi.com Volume 2014
Hindawi Publishing Corporationhttp://www.hindawi.com Volume 2014
CeramicsJournal of
Hindawi Publishing Corporationhttp://www.hindawi.com Volume 2014
CompositesJournal of
NanoparticlesJournal of
Hindawi Publishing Corporationhttp://www.hindawi.com Volume 2014
Hindawi Publishing Corporationhttp://www.hindawi.com Volume 2014
International Journal of
Biomaterials
Hindawi Publishing Corporationhttp://www.hindawi.com Volume 2014
NanoscienceJournal of
TextilesHindawi Publishing Corporation http://www.hindawi.com Volume 2014
Journal of
NanotechnologyHindawi Publishing Corporationhttp://www.hindawi.com Volume 2014
Journal of
CrystallographyJournal of
Hindawi Publishing Corporationhttp://www.hindawi.com Volume 2014
The Scientific World JournalHindawi Publishing Corporation http://www.hindawi.com Volume 2014
Hindawi Publishing Corporationhttp://www.hindawi.com Volume 2014
CoatingsJournal of
Advances in
Materials Science and EngineeringHindawi Publishing Corporationhttp://www.hindawi.com Volume 2014
Smart Materials Research
Hindawi Publishing Corporationhttp://www.hindawi.com Volume 2014
Hindawi Publishing Corporationhttp://www.hindawi.com Volume 2014
MetallurgyJournal of
Hindawi Publishing Corporationhttp://www.hindawi.com Volume 2014
BioMed Research International
MaterialsJournal of
Hindawi Publishing Corporationhttp://www.hindawi.com Volume 2014
Nano
materials
Hindawi Publishing Corporationhttp://www.hindawi.com Volume 2014
Journal ofNanomaterials