paving the way to postsecondary education: k-12 ...nces.ed.gov/pubs2001/2001205.pdf · gándara...
TRANSCRIPT

Paving the Way toPostsecondary Education:
K-12 Intervention Programsfor Underrepresented Youth
Report of the National PostsecondaryEducation Cooperative Working Group
on Access toPostsecondary Education

Paving the Way toPostsecondary Education:
K-12 Intervention Programsfor Underrepresented Youth
Report of the National PostsecondaryEducation Cooperative Working Group
on Access toPostsecondary Education
Prepared for the National Postsecondary Education Cooperative (NPEC) and itsWorking Group on Access by Patricia Gándara with Deborah Bial, under thesponsorship of the National Center for Education Statistics (NCES), U.S.Department of Education.

U.S. Department of EducationRod PaigeSecretary
Office of Educational Research and ImprovementGrover J. WhitehurstAssistant Secretary
National Center for Education StatisticsGary W. PhillipsActing Commissioner
The National Center for Education Statistics (NCES) is the primary federal entity for collecting, analyzing, andreporting data related to education in the United States and other nations. It fulfills a congressional mandate tocollect, collate, analyze, and report full and complete statistics on the condition of education in the UnitedStates; conduct and publish reports and specialized analyses of the meaning and significant of such statistics;assist state and local education agencies in improving their statistics systems; and review and report oneducation activities in foreign countries.
NCES activities are designed to address high priority education data needs; provide consistent, reliable,complete, and accurate indicators of education status and trends; and report timely, useful, and high quality datato the U.S. Department of Education, the Congress, the states, other education policymakers, practitioners, datausers, and the general public.
We strive to make our products available in a variety of formats and in language that is appropriate to a varietyof audiences. You, as our customer, are the best judge of our success in communicating information effectively.If you have any comments or suggestions about this or any other NCES product or report, we would like to hearfrom you. Please direct your comments to:
National Center for Education StatisticsOffice of Educational Research and ImprovementU.S. Department of Education1990 K Street, NWWashington, DC 20006-5574
September 2001
The NCES World Wide Web Home Page is: http://nces.ed.govThe NCES World Wide Web Electronic Catalog is: http://nces.ed.gov/pubsearch/index.asp
Suggested Citation
U.S. Department of Education, National Center for Education Statistics. Paving the Way to PostsecondaryEducation: K-12 Intervention Programs for Underrepresented Youth, NCES 2001-205, prepared by PatriciaGándara with the assistance of Deborah Bial for the National Postsecondary Education Cooperative AccessWorking Group. Washington DC: 2001.
For ordering information on this report, write:
U.S. Department of EducationED PubsPO Box 1398Jessup, MD 20794-1398or call toll free: 1-877-4ED-Pubs.
ContactNancy Borkow202-502-7311
iii
FOREWORD
This report is a product of the National Postsecondary Education Cooperative (NPEC). NPEC was authorizedby Congress in 1994 and is supported by the National Center for Education Statistics. NPEC’s overarchingmission is to promote better decisions through better data. This report was undertaken as part of NPEC’s workin the area of access to postsecondary education.
Fifteen individuals with extensive research and/or experiential backgrounds in the issues surrounding access topostsecondary education were brought together. They were charged with developing a project that wouldexplore a relatively uncharted set of concerns in the area of access. After much deliberation, this “workinggroup” decided there was a critical need for evaluative data and information on the effectiveness of K-12intervention programs designed specifically to increase access to postsecondary education for underrepresentedyouths. The working group also recognized the heavy burden this lack of data placed on policymakersinterested in funding early intervention programs.
While it was clear that program evaluation, per se, was not within the purview of NPEC, it was felt that a studyidentifying the data infrastructure necessary for adequately evaluating early intervention programs was withinNPEC’s mandate and operating policies and would also make a significant contribution to policy and practicesin postsecondary education. This report chronicles the results of that study.
The report was reviewed and accepted by the NPEC Steering Committee as meeting NPEC’s standards andpolicies. We hope that by making the results of this study available to the postsecondary community, we canfacilitate the work of those involved in early intervention programs and those funding these programs.
Michael McGuire Roslyn KorbExecutive Director Program DirectorOffice of Planning and Institutional Research Postsecondary Cooperative Systems,Georgetown University and Analysis, and Dissemination2001 Chair NPEC Steering Committee National Center for Education Statistics

iv
ACKNOWLEDGMENTS
The National Postsecondary Education Cooperative would like to take this opportunity to thank the members ofthe working group for contributing their time, enthusiasm, insights, and expertise to this project and this report,especially the chairperson, Sharon Thomas- Parrot. We would also like to thank all those individuals whoreviewed this report. They included members of the NPEC Steering Committee, William Kramer, VicePresident for Planning and Education, Ivy Tech State College, a member of the NPEC Council, Dennis Carrollof NCES, Denise Glover of Westat, and the following three individuals who were asked to provide anindependent review of the report:
1. Eugene Garcia, Professor and Dean,Graduate School of EducationUniversity of California, Berkeley
2. Reginald Wilson, FellowAmerican Council on EducationWashington, DC
3. Jeannie Oakes, Professor of Education and Associate Dean,Graduate School of Education and Information Studies
and
Director,Institute for Democracy, Education & Access (IDEA)University of California, Los Angeles
Finally, we would like to thank those individuals working with the K-12 programs that were identified in thisstudy. They shared their work with the authors and provided the information that made this report possible.

v
NATIONAL POSTSECONDARY EDUCATION COOPERATIVEACCESS WORKING GROUP
Members:
Sharon Thomas-Parrott, Vice Presidentof Government Relations,DeVry, Inc., (Chair)1
Cheryl Blanco, Director, Policy and Information,Western Interstate Commission for HigherEducation2
Donald Brown, Commissioner, Texas HigherEducation Coordinating Board
Edward Blews, Jr., President, Association ofIndependent Colleges and Universities of Michigan
Ruth Burgos-Sasscer, Chancellor, HoustonCommunity College System
Rene Gonzalez, Director, Education Collaboratives,Hispanic Association of Colleges and Universities3
Roberto Haro, Professor and Director of Research,Cesar E. Chavez Institute for Public Policy, SanFrancisco State University4
Cheryl Lovell, Associate Professor of Education andCoordinator of Master's Program in HigherEducation, University of Denver5
Michael Nettles, Professor of Education, School ofEducation, University of Michigan
Laura Rendon, Veffie Milstead Jones EndowedChair, California State University, Long Beach
Wilma Rosco, Vice President, National Associationfor Equal Opportunity in Higher Education
1 Current title is Vice President of Government Relations and
Student Finance2 Current title is Director, Policy Analysis and Research3 Current department name is Program Collaboratives4 Current title is Professor of Ethnic Studies and Director of
Research5 Current department name is Higher Education and Adult Studies
Talbert Shaw, President, Shaw University
Watson Scott Swail, Associate Director for PolicyAnalysis, The College Board6
Vincent Tinto, Distinguished UniversityProfessor of Education, Syracuse University
Deborah Wilds, Deputy Director, Office of Minoritiesin Higher Education, American Council on Education7
Consultant to the Working Group:
Patricia Gándara, Associate Professor,University of California, Davis
NPEC Staff:
Brenda Albright, Consultant to NPEC
Nancy Borkow, NPEC Project Director,National Center for Education Statistics
Denise Glover, Contractor to NPEC, Westat
Roslyn Korb, Program Director, PostsecondaryCooperative Programs and Analysis andDissemination Program, National Center forEducation Statistics
Hans L'Orange, Director, SHEEO/NCESCommunication Network, State HigherEducation Executive Officers
Meredith Ludwig, Director, PostsecondaryStatistics Support, Education Statistics ServicesInstitute8
Robert Wallhaus, Consultant to NPEC
6 Current contact information is Senior Policy Analyst, SRI
International7 Current contact information is Program Officer, Education, Bill
and Melinda Gates Foundation8 Current contact information is Principal Research Analyst,
American Institutes for Research

vi

vii
EXECUTIVE SUMMARY
Background to the Study
The United States has changed dramatically in the past three decades. While in 1970, 87.5percent of the population was classified as white, non-Hispanic, in 1998, 72 percent of Americans fellinto this category, and as a group, they are older than all others. Analyzing population changes andpostsecondary enrollments shows that college-going rates for most minority groups are low. Since themid-1970s, modest improvements have occurred for some underrepresented groups, although rates havenot improved for others. For example, while 33.5 percent of black high school graduates between ages 18and 24 were enrolled in postsecondary institutions (both 2- and 4-year) in 1976, it was not until 1992 thata similar percentage of black students again enrolled. By 1997, almost 40 percent of blacks in thetraditional college-age group were enrolled in college. On the other hand, in 1997, Hispanics had onlyfinally returned to a level of enrollment that was equivalent to 1976 (35.8 versus 36.0 percent in 1997),but the Hispanic population had increased by more than 200 percent during that time (U.S. Department ofCommerce, 2000). By contrast, 45 percent of whites in the same age group enrolled in college in 1997compared to just 33 percent in 1976 (Wilds, 2000).
Since the mid-70s, college-going rates for white, non-Hispanic students have increasedsignificantly. In contrast, despite progress in the 1990s, students from historically underrepresentedminority groups have not experienced substantial increases in college-going rates. Improving theircollege-going rates is an issue of growing urgency for colleges, universities, and states.
The Challenge
More and more, institutions are turning to special programs designed to better prepareunderrepresented students for college. Although thousands of early intervention programs exist across thenation, data about whether they work, or for whom and under what circumstances, are generally sparse.These programs represent a significant beacon of hope for many young people, and having betterinformation about the programs can be beneficial to all levels of education. This report approaches thattask by:
1. Mapping the field of K-12 postsecondary education bridge program types and featuresusing a typology to categorize strategies.
2. Identifying and reviewing selected K-12 postsecondary education college accessprograms with analytical data that provide information on how programs work and under what conditionsbased on needs and problems identified in the literature.
3. Identifying information and data that are needed to evaluate K-12/postsecondaryeducation bridge programs to inform future analytic efforts.

viii
Effective Program Practices
From a review of evaluation studies of early intervention programs, the most effectiveprograms appear capable of at least doubling the college-going rate of participants. Students and familiesreport that these programs open both eyes and doors to postsecondary possibilities. The programs thatappeared to be the most effective had the following elements in common:
• Providing a key person who monitors and guides the student over a long period oftime—a “mentor,” program director, faculty member, or guidance counselor. Studiesare not clear on which of these is most effective.
• Providing high-quality instruction through access to the most challenging coursesoffered by the school (“untracking”), through special coursework that supports andaugments the regular curricular offerings (tutoring and specially designed classes), or byrevamping the curriculum to better address the learning needs of the students.
• Making long-term investments in students rather than short-term interventions. Thelonger students were in the program, the more likely they were reported to benefit fromit.
• Paying attention to the cultural background of students. Many programs reported havinggreater success with one group of students than another; it is likely that background andexpertise of the staff and directors helped them to make cultural connections withstudents.
• Providing a peer group that supports students’ academic aspirations as well as givingthem social and emotional support.
• Providing financial assistance and incentives. Financial assistance is important foraccess to academic leveling experiences—college visits and SAT preparation courses—as well as to monetary support to make college a realistic possibility for some students.Scholarships make the difference between going to college or not for many low-incomestudents (Thomas, 1998; St. John, 1990).
Program Limitations
Limitations for many of these program efforts included the following:
• Program attrition. Few programs either report or know how many students who begintheir program actually complete it. The authors estimate that between one-third and one-half of all students who begin programs leave before completion or before high schoolgraduation. Nonetheless, programs commonly report high percentages of participantsgoing on to college based on counting only the number of participants in the graduatingclass.
• Smaller number of students affected. Because of costs and the labor-intensive natureof the services provided, few students in any given school are normally included in sucha program. Based on High School and Beyond data, Adelman (2000) estimates that no

ix
more than 11.4 percent of black and 5.3 percent of Hispanic students participate, at anylevel, in such programs.
• Participant selection. Few programs were explicit about how students were selected toparticipate and about the characteristics of the most successful participants. This kind ofinformation is critically important in evaluating who can best benefit from the program.
• Participation of males. Boys are seriously underrepresented in these programs.Generally, only about one-third of participants are males.
• Records on program contact. Few programs keep records on the amount of contactparticipants have with the program. Similarly, programs are often vague about whatconstitutes completion or retention in the program. Without this information it isdifficult to know if a program can be credited for student outcomes, or if outcomesshould be attributed to other factors.
• Sector approach. Programs are usually nonsystemic. Since most programs serve onlyone sector of the K-12 system, services are noncontinuous. Without continuousintervention, gains made at one level may be lost at the next.
• Academic achievement. While some programs were able to demonstrate that theydoubled college-going rates among their participants (compared to controls), evidencethat programs are effective in raising academic achievement as measured by grades ortest scores is limited.
• Type of postsecondary institution. Because overall measured achievement is notgenerally considered, these programs are most effective at increasing college-going tocommunity colleges and less selective 4-year colleges. They do not appear to have amajor impact on increasing the numbers of students who go on to selective colleges anduniversities who would not otherwise have qualified to do so.
• Long-term outcomes. Little is known about long-term outcomes for students. Mostprograms do not have data that show if they increase the rates at which participantsobtain college degrees when compared to students who have not participated in theprogram.
• Costs. Little is reported about the costs of these programs. This review does notprovide information to discern a relationship between costs and outcomes.
Program Evaluation
Perhaps most troubling was the finding that few programs had engaged in a thoroughevaluation of their activities. Programs commonly operated on the assumption that they were effective,but data were not available to support that belief. Evaluation may be viewed as a threat to the programrather than a means to improve it, document its effectiveness, or better understand how it works. Becauseof the widespread absence of evaluation, many questions are left unanswered:

x
• How effective are most of these programs at meeting their goals of increasing college-going rates when participants are compared to similar students who have not beenenrolled in such a program?
• While careful monitoring and guidance of students is clearly beneficial, who might mosteffectively provide this service—teaching staff, counselors, mentors, or specializedprogram staff?
• How can programs increase their impact on student achievement?
• How can programs most effectively stem student attrition?
• What happens to graduates of these programs after they matriculate in college? Arestudents equipped to succeed in a college environment?
• How can programs maximize their resources? Which features of the programs are most(cost) effective?
To answer these questions, it is important that programs take the following steps:
• Collect baseline data on program participants and comparisons
− Were there differences between participants and comparison students before theprogram intervention?
• Monitor and report program attrition
− How many students are lost along the way?
• Carefully match control groups (assuming random assignment of participants is notpossible) and report differences
• Give attention to measuring the outcomes that the program purports to be affecting
• Attend to program features and outcomes
− What specific features of the program are most responsible for its effects?
− What attracts students to the program and fosters their retention?
Connecting Programs with School Reform Efforts
It should not be surprising that these early intervention programs appear to have little effecton academic achievement. The programs, whether community based, school district sponsored, orpartnered with postsecondary education, tend to be peripheral to the K-12 schools. They augment andsupplement what schools do, but do not fundamentally change the ways schools interact with students.

xi
Thus, while some successful programs work to emulate the features of prep schools that routinely sendhigh percentages of their graduating students on to college, they only do it for part of the day, and oftenoutside of school time. The rest of the time, students are exposed to the same school practices that havebeen proven to be unsuccessful for them. Intervention programs tend to help students maximize theirassets, expand their goals, and show evidence of doubling the college-going rate of their participants, butdo not appreciably alter their academic achievement. For changes in academic achievement to occur,schools should consider adopting many of the practices of the early intervention programs.

xii

xiii
Table of Contents
Section Page
FOREWORD...................................................................................................................................... iii
ACKNOWLEDGMENTS.................................................................................................................. iv
NATIONAL POSTSECONDARY EDUCATION COOPERATIVE ACCESSWORKING GROUP .......................................................................................................................... v
EXECUTIVE SUMMARY................................................................................................................ vii
1. INTRODUCTION AND BACKGROUND ....................................................................................... 1
Background and Diversifying the Nation’s Colleges ......................................................................... 1U.S. Demographic Shifts.................................................................................................................... 2Access to Postsecondary Education ................................................................................................... 2Why is it Important to Go to College? ............................................................................................... 4Increasing Minority Participation in Postsecondary Education ......................................................... 5
2. OPPORTUNITY TO LEARN............................................................................................................ 7
Summarizing the Impediments to Opportunity to Learn.................................................................... 8Early Intervention as a Response ....................................................................................................... 9
3. STUDY METHODS .......................................................................................................................... 11
Step 1: Programs Survey ................................................................................................................... 11
Survey of Published Literature .................................................................................................... 11State Higher Education Executive Officers and Chief School Officers...................................... 12Information from Foundations, Government, and Other Agencies and Organizations ............. 12Personal Networks ....................................................................................................................... 13
Step 2: Gathering Evaluation Studies................................................................................................ 13Step 3: Analysis of Program Information and Data and Forming Conclusions ................................ 14
4. A TAXONOMY OF INTERVENTION PROGRAMS TO INCREASE THE COLLEGE-GOINGRATES OF UNDERREPRESENTED STUDENTS ......................................................................... 15
Types of Programs.............................................................................................................................. 17
Private Nonprofit Programs ......................................................................................................... 17Postsecondary Education-Sponsored Programs or K-16 Partnerships......................................... 18Government-Sponsored Programs ............................................................................................... 19Community-Based Programs ....................................................................................................... 19K-12-Sponsored Programs........................................................................................................... 20

xiv
Table of Contents (continued)
Section Page
Program Components ......................................................................................................................... 21
Counseling ................................................................................................................................... 21Academic Enrichment.................................................................................................................. 22Parent Involvement ...................................................................................................................... 24Personal Enrichment and Social Integration................................................................................ 26
Mentoring..................................................................................................................................... 28Scholarships ................................................................................................................................. 29Summary of Program Features .................................................................................................... 31
Logical Links Between Impediments to Access and Program Strategies .......................................... 32
5. PROMISING PRACTICES................................................................................................................ 35
Summary of Evaluation Findings....................................................................................................... 36
Key Features of Successful Programs.......................................................................................... 36Impediments to Greater Success for Programs ............................................................................ 37Issues in Evaluation ..................................................................................................................... 38
6. SPECIFIC PROGRAMS WITH EVALUATION DATA.................................................................. 39
High School Programs for Individual Students.................................................................................. 39
Posse ............................................................................................................................................ 39Neighborhood Academic Initiative (NAI) ................................................................................... 40A Better Chance (ABC) ............................................................................................................... 41Upward Bound............................................................................................................................. 43
High School Programs That Serve Students by Classroom ............................................................... 44
Advancement via Individual Determination (AVID) .................................................................. 45Puente........................................................................................................................................... 46College Pathways......................................................................................................................... 48
K-12 Programs by Classroom or Community .................................................................................... 49
I Have a Dream (IHAD) .............................................................................................................. 49
K-12 Programs That Serve Students by Schools................................................................................ 51
GE's College Bound Program ...................................................................................................... 51Project GRAD.............................................................................................................................. 53

xv
Table of Contents (continued)
Section Page
Statewide Programs Serving All (Underrepresented) Students......................................................... 55
Florida’s College Reach Out Program (CROP)........................................................................... 56Indiana Career and Postsecondary Advancement Center (ICPAC)/21st Century Scholars........ 57Minnesota’s Postsecondary Enrollment Options Program (PEOP) ............................................. 60
Issues in Evaluation............................................................................................................................ 61
7. CONCLUSIONS ................................................................................................................................ 63
Effective Practices .............................................................................................................................. 63
Program Limitations .................................................................................................................... 64Program Evaluation ..................................................................................................................... 65Connecting Programs With School Reform Efforts .................................................................... 65
References................................................................................................................................................. 67
List of AppendicesAppendix Page
A: Review of the Literature on Opportunities to Learn...........................................................................A-1B: List of Programs for Which Information Was Submitted ..................................................................B-1C: Brief Descriptions of Programs ..........................................................................................................C-1
List of ExhibitsExhibit Page
1 Prototype intervention programs, by program type and targeted students ......................................... 162 Counseling services provided, by program ........................................................................................ 223 Academic enrichment services provided, by program ....................................................................... 244 Parent involvement activities, by program......................................................................................... 265 Personal enrichment and social integration (PESI) strategies, by program........................................ 276 Mentoring provided by various participants, by program .................................................................. 297 Scholarships available from various sources, by program ................................................................. 308 Summary of features, by program...................................................................................................... 319 Promising programs and their target populations............................................................................... 35

xvi
Table of Contents (continued)
List of TablesTable Page
1 Percent of students enrolled in 2-year colleges, by race/ethnicity: 1976 and 1996........................... 32 Median annual household income, by educational attainment of the head of household: 1998 ....... 4

1
1. INTRODUCTION AND BACKGROUND
This monograph was written in a period of exceptional prosperity in the United States.Unemployment is currently at its lowest point in decades and per capita income is on the rise. Overallfunding for education, both at the federal and state levels, has been increasing. Despite this prosperity,about one-fifth of the country’s children live in poverty. Moreover, the United States is a nation in whichopportunity is distributed, to some extent, along color lines, and family background may determine if andwhere bright and talented young people go to college. Exacerbating this problem is a widespread beliefthat the pathway to postsecondary education has been leveled, and that anyone willing to work hardenough can “make it.” In reality, the path is well paved for some students by generations of familymembers who have preceded them to college, while for others there is no discernable path at all.
Because of dramatic demographic shifts, addressing the persistent and, in some cases,growing discrepancies in educational opportunity among particular groups of young people is essentialfor the social and economic well-being of the United States. The purpose of this report is to review andsynthesize what is known about efforts currently underway in K-12 education to increase the chances thatunderrepresented youth will be able to participate successfully in postsecondary education.
Section 1 introduces the challenges in equalizing educational opportunity and suggests whyearly intervention programs have been proliferating in recent years. Section 2 introduces the issue ofgroup differences in educational achievement and attainment and summarizes what is known about theprobable impact of specific program features on particular educational problems. Section 3 summarizesthe methods that were employed in this study, and Section 4 provides a taxonomy of features ofintervention programs. The taxonomy provides the basis for understanding what programs are trying toaccomplish. Section 5 focuses on a review of evaluations conducted on 13 programs with conclusionsabout “what works” and, in some cases, under what conditions these strategies are likely to have thegreatest impact. This section also provides an analysis of what is knowable given the limitations of theseevaluation studies. Section 6 is a brief summary of the foregoing with conclusions. Appendix A is areview of the literature on group difference in education achievement and attainment introduced inSection 2. Appendix B summarizes some sources of information, and Appendix C provides detail aboutthe programs that were reviewed for this study.
Background and Diversifying the Nation’s Colleges
After significant progress in increasing the college-going rates for underrepresented youthand diversifying the nation’s colleges and universities during the 1970s, little progress occurred in thefollowing two decades. Data suggest that the 1980s represented a period of decline in college-going ratesfor underrepresented students (Wilds, 2000). Only in the 1990s did colleges regain lost ground. Forexample, while 33.5 percent of black high school graduates between ages 18 and 24 were enrolled inpostsecondary institutions (both 2- and 4-year) in 1976, it was not until 1992 that black students againenrolled at an equivalent rate. By 1997, almost 40 percent of blacks in the traditional college-age groupwere enrolled in college. On the other hand, in 1997 Hispanics had only finally returned to the level ofenrollment that was equivalent to 1976 (35.8 versus 36.0 in 1997), but the Hispanic population hadincreased by more than 200 percent since that time (U.S. Department of Commerce, 2000).
By contrast, 45 percent of whites in the same age group enrolled in college in 1997compared to just 33 percent in 1976 (Wilds, 2000). Progress in college enrollment rates for whitestudents has been substantial, but the same cannot be said for students from historically underrepresented

2
groups. Since 1990 enrollment rates have been improving for underrepresented groups, however, giventhe rapid shifts in demographics in the United States, increasing the enrollment rates for traditionallyunderrepresented students is a matter of growing urgency.
U.S. Demographic Shifts
The United States has changed dramatically since the early 1970s. While in 1970, 87.5percent of the population was classified as white, non-Hispanic, in 1998 72 percent of Americans fell intothis category, and as a group they are older than all others, with a median age of 37 years. Nationwide,the Hispanic population is the fastest growing, accounting for 11.4 percent of all Americans in 1998. Theyouthfulness of the group (a medium age of 26 years) and its fertility rate, which is the highest of allmajor groups, combined with sustained immigration, means that the Hispanic population will continue togrow at a disproportionately high rate in the coming years (del Pinal and Singer, 1997). Sometime shortlyafter the turn of the millennium, Hispanics will have become the nation’s largest minority group. Asianshave also registered a significant increase in their numbers over the last four decades, from only 0.5percent of the population in 1960 to 3.7 percent in 1998. Most of this growth can be attributed toimmigration made possible by the liberalization of U.S. immigration law in 1965. Blacks and NativeAmericans have maintained a relatively stable proportion of the population, with 12.7 percent and 0.8percent, respectively (U.S. Department of Commerce, 2000).
Nationwide trends are amplified considerably in the states with the highest immigrationrates. For example, in California, which receives about 40 percent of the nation’s immigrants, whitestudents are a minority among school-age children, representing about 38 percent of public schoolstudents. Hispanics are now the largest single population group in California’s public schools at 41percent, and Asians are the second largest nonwhite group, with more than 11 percent of the state’s K-12students. Blacks represent fewer than 9 percent of students (California Department of Education, 1999).
Access to Postsecondary Education
Gaining access to college is important, but it is only part of the story. Where students go tocollege is almost equally important. There is considerable difference among ethnic groups in the types ofpostsecondary institutions that students attend. Lower income black and especially Hispanic students aremuch more likely to go to 2-year colleges than are white and Asian students, and they are much less likelyto actually complete their degrees (Rendon and Garza, 1996; Grubb 1991). Moreover, while a little morethan one-third of all college students attend 2-year institutions, more than half of all Hispanic and NativeAmerican students are found in these institutions (table 1) (Chronicle of Higher Education, 1998).
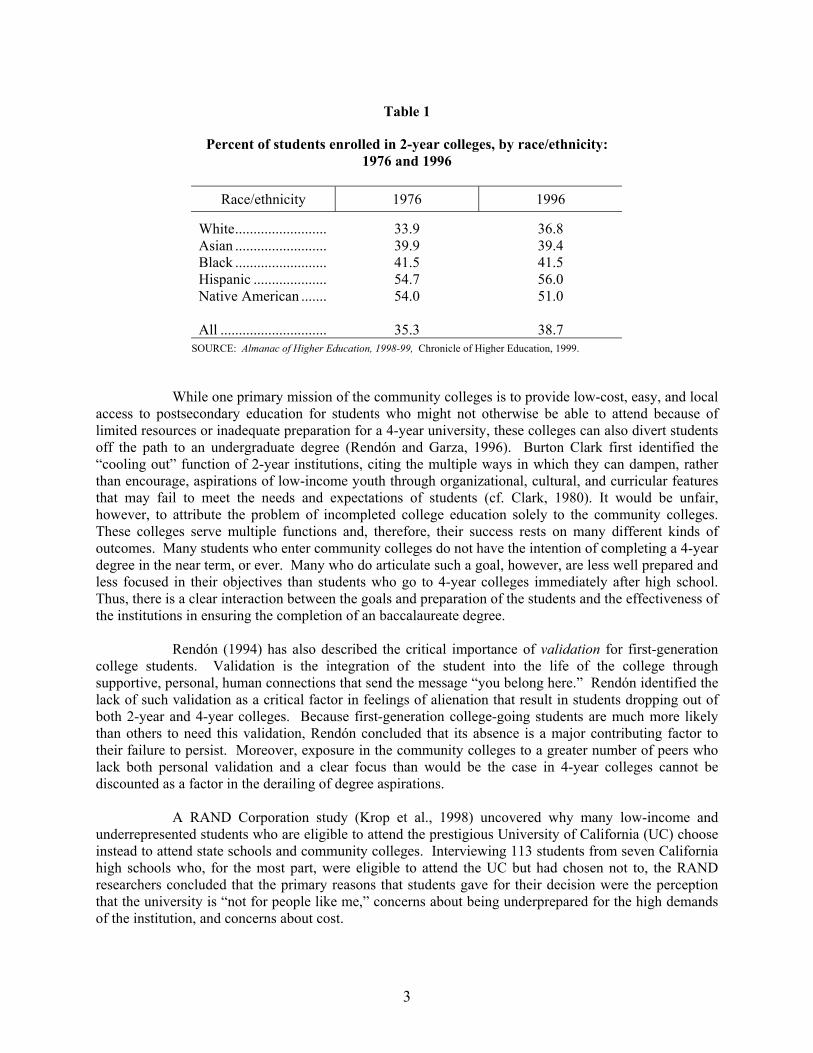
3
Table 1
Percent of students enrolled in 2-year colleges, by race/ethnicity:1976 and 1996
Race/ethnicity 1976 1996
White......................... 33.9 36.8Asian ......................... 39.9 39.4Black ......................... 41.5 41.5Hispanic .................... 54.7 56.0Native American ....... 54.0 51.0
All ............................. 35.3 38.7SOURCE: Almanac of Higher Education, 1998-99, Chronicle of Higher Education, 1999.
While one primary mission of the community colleges is to provide low-cost, easy, and localaccess to postsecondary education for students who might not otherwise be able to attend because oflimited resources or inadequate preparation for a 4-year university, these colleges can also divert studentsoff the path to an undergraduate degree (Rendón and Garza, 1996). Burton Clark first identified the“cooling out” function of 2-year institutions, citing the multiple ways in which they can dampen, ratherthan encourage, aspirations of low-income youth through organizational, cultural, and curricular featuresthat may fail to meet the needs and expectations of students (cf. Clark, 1980). It would be unfair,however, to attribute the problem of incompleted college education solely to the community colleges.These colleges serve multiple functions and, therefore, their success rests on many different kinds ofoutcomes. Many students who enter community colleges do not have the intention of completing a 4-yeardegree in the near term, or ever. Many who do articulate such a goal, however, are less well prepared andless focused in their objectives than students who go to 4-year colleges immediately after high school.Thus, there is a clear interaction between the goals and preparation of the students and the effectiveness ofthe institutions in ensuring the completion of an baccalaureate degree.
Rendón (1994) has also described the critical importance of validation for first-generationcollege students. Validation is the integration of the student into the life of the college throughsupportive, personal, human connections that send the message “you belong here.” Rendón identified thelack of such validation as a critical factor in feelings of alienation that result in students dropping out ofboth 2-year and 4-year colleges. Because first-generation college-going students are much more likelythan others to need this validation, Rendón concluded that its absence is a major contributing factor totheir failure to persist. Moreover, exposure in the community colleges to a greater number of peers wholack both personal validation and a clear focus than would be the case in 4-year colleges cannot bediscounted as a factor in the derailing of degree aspirations.
A RAND Corporation study (Krop et al., 1998) uncovered why many low-income andunderrepresented students who are eligible to attend the prestigious University of California (UC) chooseinstead to attend state schools and community colleges. Interviewing 113 students from seven Californiahigh schools who, for the most part, were eligible to attend the UC but had chosen not to, the RANDresearchers concluded that the primary reasons that students gave for their decision were the perceptionthat the university is “not for people like me,” concerns about being underprepared for the high demandsof the institution, and concerns about cost.

4
Gladieux and Swail’s (1998) findings with regard to who goes to college are entirelyconsistent with the RAND study. They found that family income level is a powerful predictor of the typeof postsecondary institution students select: in 1992, one-fifth of students in the lowest quintile of incomeenrolled in a 4-year institution, while two-thirds of those students in the highest quintile of family incomedid so. Thus, concerns about costs and the belief that the university is “not for people like me” appear tobe related to socioeconomic class. Similarly, Gladieux and Swail also found that degree completion ishighly correlated with both race and class. For example, more than 40 percent of the most advantagedstudents complete an undergraduate degree within 5 years of beginning college, while only about 6percent of the least advantaged students do. And, blacks and Hispanics disproportionately compose theleast advantaged group.
Another way to analyze the issue of who has access to postsecondary education is toconsider students “at risk” as a category. Horn and Carroll (1997) defined at-risk students as being from asingle parent home, having an older sibling who is a high school dropout, experiencing excessiveresidential mobility, having Cs or lower between grades six and eight, repeating a grade in school, andbeing from a low SES home. All of these risk factors are also highly correlated with ethnic minoritystatus. In comparing at-risk students with those who had no risk factors, Horn and Carroll found thatamong students with no risk factors, 58 percent enrolled in a 4-year college, compared to 30 percent ofstudents who were at risk.
Why is it Important to Go to College?
From the post-World War II years to the present, the gap in incomes between individualswith and without a college education continues to grow. College graduates in 1975 earned 57 percentmore than high school graduates, and in 1997, they earned 77 percent more (College Board, 1999a).Moreover, there is a perfect linear correlation between amount of education and income earned across alleducation levels (table 2). Clearly, the education of the head of household has implications for theeconomic well-being of all persons living in the household.
Table 2
Median annual household income,by educational attainment of the head of household: 1998
Education Income
Less than 9th grade.............................. $15,541Less than high school diploma ........... 19,851High school graduate.......................... 33,779Some college ...................................... 40,015Associate’s degree .............................. 45,258Bachelor’s degree ............................... 59,048Master’s degree .................................. 68,115Doctor’s degree .................................. 87,232Professional degree............................. 92,228
SOURCE: Trends in College Pricing, The College Board, 1999.

5
Access to a college education has clear implications for the country’s economic well-being.Beyond the pecuniary benefits of a college education are numerous social benefits to increasing theeducation levels of underrepresented groups. Persons with higher levels of education are less likely toburden the social service and criminal justice systems (Karoly et al. 1998), they enjoy better health andlonger lives (Perna and Swail, 1998), and they contribute substantially more to the public coffers throughtheir taxes (Sorensen, Brewer, and Brighton, 1995). For example, in a RAND study of the economicreturns of increasing the education level of Hispanics, Sorensen, Brewer, and Brighton (1995) concludedthat “Hispanics with a bachelor’s degree will pay more than twice as much in taxes as those with only ahigh school diploma, and Hispanics with a professional degree will pay an estimated three times as muchas those with a bachelor’s degree” (pp. 2-3).
Economic equity and concerns about sustaining a vibrant economy are certainly reasonablejustifications for pursuing policies to equalize educational opportunity, but some would argue that theyare ultimately not the most important reasons for doing so. Jeannie Oakes (2000) maintains that the mostimportant outcome of school reform should be its role in shaping a more just civil society. Similarly,Amatai Etizioni (1995) has long advocated that the value of our social institutions should be judged bytheir ability to produce a more communitarian society—one that places the establishment of more humanesocial structures above other considerations. Nel Noddings (1995) has also cautioned that schools that donot place an ethos of caring at the center of their pedagogy fail at their most fundamental task—to prepareyouth for happy and productive lives. Bowen and Bok (1998), in their study of the long-termconsequences of affirmative action, found that blacks with college degrees (from very selectiveinstitutions) were more likely to contribute to their communities through volunteer and leadershipactivities than were white degree holders from the same institutions. Thus, they made the argument thatthe opportunity to gain prestigious college degrees served a much higher purpose than simply providingthese students with economic advantages. In fact, they contend, the whole society was benefited.
Diversity within educational settings has also been shown to confer cognitive advantages onthose students schooled in such settings, especially when it occurs in late adolescence. Thus, not only dounderrepresented students obtain benefit from access to higher education, but their nonminorityclassmates can be expected to benefit cognitively as well. For example, Gurin (1999) examined multi-institutional national data, an extensive survey of students at the University of Michigan, and data drawnfrom a specific program at the University of Michigan. Based on these analyses, she concluded that
interaction with peers from diverse racial backgrounds, both in the classroomand informally, is positively associated with a host of “learning outcomes.”Students who experienced the most racial and ethnic diversity in classroomsettings and in informal interactions with peers showed the greatest engagementin active thinking processes, growth in intellectual engagement and motivation,and growth in intellectual and academic skills (p.100).
Increasing Minority Participation in Postsecondary Education
Recent events may have had an effect on diversification in the nation’s colleges over the lastseveral years. In 1994, the U.S. Fourth Circuit Court of Appeals decided in Podberesky v Kirwan that theUniversity of Maryland’s Banneker Scholars Program for black students was unconstitutional becauserace was the sole determinant of eligibility. In 1995, the regents of the University of California passedSP-1 and SP-2, two provisions that prohibited the use of race, ethnicity, or sex in hiring, contracting, orcollege admissions decisions within the university. California voters followed suit in 1996 withProposition 209, which outlawed the consideration of race, ethnicity, or sex for admissions, contracting,

6
or hiring decisions throughout the state. In 1997, the Fifth Circuit Court of Appeals ruled in favor ofCheryl Hopwood, who had been denied admission to the University of Texas law school. The court’sdecision was interpreted by the attorney general of Texas as outlawing the use of race or ethnicity as afactor in admission, financial aid, and retention and recruitment programs in all institutions of highereducation within the fifth circuit. Most recently, the state of Washington passed Initiative 200 barring theconsideration of race or ethnicity in college admissions decisions within that state. Similar efforts areunderway in other parts of the country.
University administrators across the country have reflected about the potential consequencesof these decisions. Many predicted that these actions would have a devastating impact on the numbers ofHispanics and other minorities admitted to the University of California and to the Texas higher educationinstitutions. In 1998, the year after Proposition 209 took effect, 53 percent fewer Hispanics and 66percent fewer blacks were admitted to the entering freshman class at UC Berkeley, and 33 percent fewerHispanics and 43 percent fewer blacks were admitted to UC Los Angeles. For the two flagship campusesof the UC system, this translated into a freshman class composed of about 13 percent underrepresentedminorities in a state in which more than 40 percent of the high school graduates in that year were black,Native American, or Hispanic (California Department of Education, 1999). The university systemrebounded considerably in 1999, admitting nearly as many underrepresented students as in the year priorto the implementation of Proposition 209; however, because overall almost 5,000 more students wereadmitted in 1999 (from 41, 935 in 1997 to 46,921), the student participation percentages still fell below1997 levels. Moreover, in 1997 the university was concerned that only 17.5 percent of its student bodycomprised underrepresented minorities (at the two flagship campuses, the figure was somewhat higher—19.6 percent), so a return to 1997 admittance levels did not address this problem.
Similarly, the fall 1997 entering freshman class at the University of Texas included 12percent fewer blacks and 10 percent fewer Hispanics than were in the previous class. And the effect ofHopwood was even more drastic at the law school, where only 52 percent of the previous year’s numberof Hispanics and 19 percent of the number of blacks were being admitted (Chapa, 1997). With the adventof the 1998 plan to accept the top 10 percent of students from all high schools in the state to theUniversity of Texas system, undergraduate admissions have begun to return to pre-Hopwood levels.
Many blacks, Native Americans, and Hispanics who aspire to higher education in Californiaand Texas apply to state-supported schools because their lower family incomes often lead them topreclude out-of-state or private school options.1 In 1998, UC Berkeley reported that 800 minoritystudents with 4.0 GPAs and mean SAT scores of 1,170 were turned away because their relative ranking,combining GPA and SAT scores, was lower than those of other students (Lee, 1998). UCLA now reportsthat its 1999 freshman class has an average GPA of 4.24 and a median SAT score of 1,330. This placesmany of the very brightest students from these underrepresented groups outside the reach of admissionsbecause their schools do not offer the honors and AP courses that confer the extra grade points to enableaccruing averages higher than 4.0 (Chávez and Serna, 1999), and their families are unable to pay theseveral hundred dollars to take an SAT preparation class to help boost their test scores to morecompetitive levels (Crouse and Trusheim, 1988).
1 It is important to note, however, that “sticker price” can often be deceptive, and many private colleges and universities are able and willing to
provide financial aid to underrepresented students, making the institutions highly competitive with state-supported schools with respect topricing.

7
2. OPPORTUNITY TO LEARN
Perhaps the most troubling aspect of the disparity in academic achievement among differentgroups of students is the multiple ways in which opportunity to learn differs for young people dependingon their ethnicity and their socioeconomic status.2 The nation has been undergoing an examination of itsK-12 education system for nearly two decades, experimenting with various reform efforts to increase theachievement of all American students and to reduce the achievement gap. The extent to which theseefforts have been successful is a hotly debated issue (Berliner and Biddle, 1996; Stedman, 1995; Elmore,1996); however, there remains little doubt that gaps in achievement between underrepresented studentsand all others have remained large or increased (Jencks and Phillips, 1998). For example, while thereading score gap between black and white students on the National Assessment of Educational Progress(NAEP) has narrowed from 1.25 standard deviations to 0.69 over the period between 1971 and 1996(Jencks and Phillips, 1998), for Hispanics 13 years of age, the gap on the same reading test has widenedfrom 9.9 percentage points to 12.7 between 1975 and 1996 (U.S. Department of Education, 1999).
The persistent gap in achievement indicators between black, Hispanic, and Native Americanstudents on the one hand, and white and Asian students on the other, may be the most important singlefactor in the underrepresentation of the former in higher education. Beyond socioeconomic status and riskcharacteristics, the kind of education to which students are exposed in the K-12 years may be moreeffective at predicting their postsecondary choices than any other variable, including socioeconomicstatus. Adelman (1999), for example, argued that no single factor, including test scores and GPA, betterpredicts college completion for underrepresented students than the rigor of courses students have taken inhigh school. The best proxy of rigorous coursework is the highest math course completed. Across allethnic groups, students who take at least one math course beyond algebra 2 in high school aresignificantly more likely to complete college (Adelman, 1999). Given the importance of high schoolcurriculum for long-term postsecondary outcomes, how does pre-college curriculum differ betweenstudents from low-income and minority backgrounds and all others?
If Adelman is correct that rigor of high school courses is the single most important variableaffecting students’ eventual college completion, then it is critically important to know what factors in thehigh school and pre-high school years lead to the probability of a student taking rigorous coursework insecondary school. There are many factors that have a significant impact on K-12 schooling experiencesin addition to policies, practices, and resources within the schools themselves. Among these nonschoolvariables are family background, community resources, peer influence, and social-structural factors. Eachvariable and its effect on college access and students’ preparation for college is described in the Reviewof the Literature, Appendix A.
2 A large body of literature defines “opportunity to learn” by features and conditions in schools. The summary in Appendix A includes most
features identified in the literature.

8
Summarizing the Impediments to Opportunity to Learn
As shown in the body of research presented in Appendix A, there are a number ofimpediments to higher education for low-income and underrepresented youth. Each of these has beenshown to contribute to the relatively low college-going rates of low-income black, Hispanic, and NativeAmerican students. A reduction in the salience of each of these impediments would almost certainlyincrease, to some extent, the college-going rates for these populations; however, it is likely that to makesignificant inroads on the problem of inequality of access, all of the following impediments shouldprobably be addressed in a comprehensive manner.
1. Inequalities of familial cultural and social capital. That is, poor families and thosefrom underrepresented groups are much less likely to have sufficient familiarity with the social andeducational systems, and to have access to important information and resource networks, to adequatelyrepresent their children’s interests.
2. Inequality of resources in neighborhoods and communities. Poor communitieshave fewer local resources, such as libraries, parks, and museums, and fewer adult role models to supportthe academic aspirations of underrepresented youth.
3. Lack of peer support for academic achievement. Black and Hispanic students aremore likely than others to have peers who interpret being a good student as “acting white” and thereforeostracizing these high performers from important social supports. Peers who shun academic achievementare common in poor inner-city and rural schools, where students of color feel systematically excludedfrom white, middle class society.
4. Racism. Although most Americans no longer believe black and Hispanic studentsare innately intellectually inferior, they do attribute these students’ school problems largely to their ownlack of desire to do better, rather than to structural factors that might impede their advancement. Racismalso works to undermine the self-confidence of students of color and can cause them to doubt theirabilities and thus remove themselves from academic competition with mainstream students.
5. Inequalities in K-12 schools, including unequal distribution of well-qualifiedteachers. Poor children tend to go to poor schools that are attended largely by other poor children. Theseschools, largely in the overcrowded urban centers, have been shown to enjoy fewer resources and less-qualified teachers and to have more disciplinary problems and higher turnover of both students and staff.They also offer less rigorous coursework and generally have lower aspirations for their students. Studentswho attend these schools are more likely to finish school unprepared for postsecondary study than arestudents from suburban schools, and they are less likely to be competitive for admission to selectivecolleges because their test scores reflect less rigorous preparation.
6. Segregation of black and Hispanic students. Black and Hispanic students areincreasingly likely to be educated in segregated schools that provide fewer opportunities for interracialcontact and the development of personal and social networks that can increase cultural capital andpromote social mobility.
7. Poor high school counseling. Underrepresented students are more likely to attendcrowded, inner-city public schools where the quality of counseling is poor and students are neitheradequately informed of their postsecondary options nor helped to achieve their goals. Inadequatecounseling also contributes significantly to the tracking of underrepresented students into non-college-preparatory coursework that limits their postsecondary opportunities.

9
8. Low expectations and aspirations. Underrepresented students are provided lessencouragement by teachers who may harbor doubts about their abilities and thereby contribute to a self-fulfilling prophecy of underachievement. These students are also more likely than middle class white andAsian students to have low or unrealistic aspirations for themselves. When aspirations are defined aswhat a student plans to do, as opposed to what he or she would like to do, researchers find thatunderrepresented students are less likely than others to plan for higher education. This is criticallyimportant because true aspirations are powerful predictors of educational outcomes.
9. High dropout rates. Dropping out is a function of both push and pull factors.Underrepresented students, and especially Hispanics, are much more likely to drop out of school thanother students, effectively foreclosing postsecondary opportunities for most. However, some portion ofthe dropout problem can also be attributed to school practices that act to remove “difficult” students fromschool.
10. Limited financial resources. Limited financial resources remains a powerfulimpediment to postsecondary education for many low-income, underrepresented students. Low-incomestudents with high test scores are significantly less likely to pursue higher education than high-incomestudents with similar test scores. The increasing shift from grants to loans leads to a fear of incurring debtthat cannot be repaid or that places an excessive burden on the family (Thomas, 1998; Latino EligibilityStudy, 1994). Furthermore, concerns about forgoing income that could relieve family financial stressesduring the long years of study can convince some students to reject higher education as an option.
Early Intervention as a Response
Given college participation rates for underrepresented students, and the declining numbers ofunderrepresented students who are eligible for admission to some of the nation’s most selectiveinstitutions, many educators and policymakers are placing increased hopes on the potential for earlyintervention programs to address this situation. For example, the California Legislature appropriated$38.5 million to augment university outreach efforts in the 1998-99 and 1999-2000 state budgets withpromises to continue the support into succeeding years if such efforts are successful. Many other stateshave already launched comprehensive programs to prepare students, especially low-income and minoritystudents, to go on to college, and across the nation there are thousands of programs dedicated to this task(Perna and Swail,1998). In spite of the scale of these activities, data are generally sparse, and for most, itis difficult to know if they work, or for whom, and under what circumstances. Nonetheless, theyrepresent a significant beacon of hope for many young people, It is, therefore, critical to have a betterunderstanding of how these programs work to increase the representation of low-income and minorityyouth in postsecondary education.

10

11
3. STUDY METHODS
This study had several goals: (1) to map the field and thereby show the range of programtypes that exist and describe their features; (2) to identify programs with evaluation data that would allowan assessment of the effectiveness of particular models and features; and (3) to assess the extent to whichexisting programs address needs and problems identified in the literature. The first step of the study wasto identify what existed across the nation.
There are literally thousands of intervention programs to help underrepresented students getinto college (Swail, 1999). Even if it were possible to gather information on all of them, one wouldquickly find an enormous amount of redundancy in the program descriptions. While individual variationis broad at the level of local implementation, there are a limited number of model types and features thatthese programs encompass. Thus, it is possible to select prototype programs that represent particulartypes of efforts. While these prototype programs may differ in details, all programs that meet theprototype criteria share significant commonalities, so it has been possible to set parameters forcomparisons. Nonetheless, the process of identifying the range of models and their features, and mostespecially searching out programs with rigorous evaluation data that allow conclusions about whetherthey are working and how, has been labor intensive.
Step 1: Programs Survey
Five primary strategies were used to survey the field: a survey of published literature,including compendia of programs; a survey of all State Higher Education Executive Officers (SHEEO)agencies; a survey of all Council of Chief State School Officers (CCSSO) member agencies; a review ofstudies by foundations and government agencies; and a survey of the authors’ personal networks. Byusing diverse strategies, a broad view of programs across the 50 states, as well as more intensive efforts atlocal sites, was created.
Survey of Published Literature
Few programs actually have published evaluations or studies. Typically, programs canprovide descriptive material in the form of brochures, local press accounts of their activities, or reports tofunding agencies that list the numbers of students served, but these materials are seldom found throughdatabase searches. Rigorous evaluation studies are rare. Much of the published literature actually focuseson broad reviews of program strategies or analyzes the need for such programs. The exception is thecompendia of programs that have been produced, usually under government contract, by variousindependent researchers. The authors consulted the following such publications:
• 1998 Resource Guide and Directory: for Teachers, Counselors, and Other Educators toCreate a Better Tomorrow for Today’s Youth. (1998). The Center for Higher EducationPolicy Analysis at the University of Southern California.
• Advancing Minority High Achievement: National Trends and Promising Programs andPractices. (1998). A report prepared for the National Task Force on Minority HighAchievement. The College Board and Johns Hopkins University Center for SocialOrganization of Schools.

12
• Higher Education Outreach Programs: A Synthesis of Evaluations. (1997). G.Hayward, B. Brandes, M. Kirst, and C. Mazzeo. A report commissioned by the OutreachTask Force of the University of California, Board of Regents.
• Linking America’s Schools and Colleges: Guide to Partnerships and National Directory.(1995). Franklin P. Wilbur and Leo M. Lambert. American Association for HigherEducation.
• Campus Practices for Student Success: A Compendium of Model Programs. (1994).American Association of State Colleges and Universities.
• Sources: Diversity Initiatives in Higher Education. A Directory of Programs, Projects,and Services for African Americans, Hispanic Americans, and Native Americans inHigher Education. (1993) Office of Minorities in Higher Education, American Councilon Education.
• Reaching for College. Volume 1: Directory of College-School Partnerships. (1992).Human Services Group, Westat.
State Higher Education Executive Officers and Chief School Officers
Each state postsecondary higher education and K-12 agency provided the names andcontacts for college preparation programs in their state. Contacts with the State Higher EducationExecutive Officers (SHEEOs) were coordinated through the national SHEEO office. Individual emailand phone contacts were made with the Council of Chief State School Officers between February andApril 1999, seeking information about programs in the states. Information was made available fromabout half of the states.
• Alaska • Minnesota• Arkansas • Missouri• Colorado • Montana• Connecticut • New Jersey• Delaware • New Mexico• Florida • Oklahoma• Hawaii • Pennsylvania• Idaho • Rhode Island• Illinois • South Dakota• Indiana • Texas• Kentucky • Virginia• Maine • Washington• Michigan • Wisconsin
Information from Foundations, Government, and Other Agencies and Organizations
The following organization, well known for their involvement with K-12 reform activities,were contacted:

13
• Carnegie Foundation• College Board• ConnectED• DeWitt Wallace Readers’ Digest Foundation• Ford Foundation• Lilly Foundation• Mellon Foundation• Pew Charitable Trusts• TERI: The Education Resource Institute• U.S. Department of Education
Surprisingly, many of the individuals who were contacted could not name programssupported by their own organizations. Other than the project officer, frequently others within the sameorganization are not fully aware of the activities of the agency. Personal contacts, knowledge of the field,and published compendia of programs were the greatest sources of program information.
Personal Networks
The authors’ personal contacts in California, New York, and Massachusetts, and suggestionsprovided by the NPEC Working Group members yielded a considerable number of program nominationsand further contacts.
This process resulted in scores of program descriptions, some comprehensive and otherssketchier, which began to fall into category types that allowed the authors to begin mapping the field. Itis prudent to remind the reader at this juncture that the majority of programs that exist throughout thecountry, some at the level of local schools and communities, others more broadly dispersed, were notcaptured in the search. Many programs are not included because the information gathered wasinsufficient to understand the working of the program, or they were largely redundant with programsalready reviewed.
Step 2: Gathering Evaluation Studies
All materials gathered in the search phase of the study were examined for evidence of anevaluation study that could yield reliable information about the effectiveness a program or its individualfeatures. While many programs include descriptive “evaluation” material citing numbers of studentsserved, numbers going on to college, and the like, or formative studies that attempt to provide feedback tothe program implementers about how the program works, very few actually conduct rigorous outcomeevaluations with comparable comparison or control samples. Thirteen studies with at least some attemptat comparing program results with other reasonably comparable students, or time-series studies in whichprogram effects are plotted over time, and/or that provided insight to a particular issue in educationalaccess, were chosen for the evaluation analyses. Those programs are:
• A Better Chance• AVID• College Pathways• GE College Bound• I Have a Dream• Neighborhood Academic Initiative

14
• Posse• Project GRAD• Puente• Upward Bound• The initiatives of
− Florida− Indiana− Minnesota
These program evaluations, then, form the bulk of the research evidence on the effectivenessof various strategies for increasing college-going among underrepresented youth examined for this report.There are almost certainly excellent program evaluations that are not included.
Step 3: Analysis of Program Information and Data and Forming Conclusions
Programs were categorized by type, and program features were inventoried. Othertypologies in the literature (Tierney and Jun, 1998; Swail, 1999; Bailis et al. 1995) helped provideguidance in designing a typology that addresses the strategies that different program types employ, tobuild or support theory, and to draw relevant conclusions. In the end, two typologies were devised: oneof program features, divided into five categories of strategies, that serves to describe the programs inbroad terms; and one of programs based on their source of support, their genesis, and the age groups theytarget.
The descriptive typology illustrates the range of programs in the field; the evaluationtypology helps them to make sense of how program features interact with students’ movement throughthe academic pipeline. Program typologies were based, for the most part, on a review of the documentsthe programs provided, and the analyses depend greatly on how programs are described in thesedocuments. It is recognized that some programs may include features that are not included in theirwritten documents, and that some program directors might interpret program features differently. Giventhese caveats, however, every attempt was made to describe programs as thoroughly and accurately aspossible without conducting actual site visits.

15
4. A TAXONOMY OF INTERVENTION PROGRAMS TO INCREASETHE COLLEGE-GOING RATES OF UNDERREPRESENTED STUDENTS
There are many ways to organize a discussion of intervention or “pipeline” programs. Someresearchers have chosen to categorize them by the point in the K-16 pipeline at which the programintervenes, for example, early intervention programs versus high school bridge programs. Othersorganize programs by their major feature(s), for example, scholarship programs versus mentoringprograms. However, there is considerable overlap among programs with respect to their primary features.The authors have chosen to organize programs by their source of funding or support. Put another way,the programs have been categorized according to their impetus for being. The rationale has been thatprogram missions are shaped differently according to who establishes them. For example, when acommunity group comes together to sponsor a program, the program is likely to incorporate elements ofcommunity and family support and involvement, and it will probably be directed toward the particularkinds of students that concern that community. Thus, it is important to understand these programs asproducts of different sectors of society and the value systems and beliefs that guide individuals in thatsector.
Particular program features may exist in any of these programs, independent of their impetusor the category into which they are grouped. Features may be expressed quite differently depending onthe sector from which the program emanates. These differences can be meaningful with respect toidentifying resources for students, as well as in the outcomes that might be expected. For example,mentoring in a community-based program is more likely to involve mentors who represent thatcommunity than would be the case in a K-12-based program, where school personnel may play a largerrole. Likewise, tutoring in a university-based program is more likely to involve college students thanlocal parents, who may fill those functions in a school- or community-based program.
Programs are organized into five major categories: private nonprofit, university-based,government-sponsored, community-based, and K-12. While it is important to organize programs alongsome dimension to understand how they work, programs, like other living organisms, do not always fitneatly into any taxonomy. Many of the programs examined could, in fact, fit into more than one of thecategories. A notable example is summer bridge programs. An entire program may consist of a summerbridge intervention, but it may be sponsored equally by a nonprofit foundation, a K-12 district, and areceiving university. Summerbridge is a private nonprofit program inasmuch as its structure is itself afoundation. Similarly, the Monterey Bay Education Consortium is categorized as a university-basedprogram on the basis that the administration of the program is housed at one of the University ofCalifornia campuses. While acknowledging a certain arbitrariness, the authors have attempted to groupprograms according their primary impetus, i.e., who started the program? What has been the source of itsgenesis, and who, structurally, is responsible for its management?
Exhibit 1 categorizes programs by type and by targeted population. Whether programstarget individual students, classrooms, or whole schools is an important distinction, since this decision hasimplications for the program’s impact institutions as well as individuals. (See Appendix C for detailedprogram descriptions.)

16
Exhibit 1
Prototype intervention programs, by program type and targeted students
Program type Target population Private nonprofit: A Better Chance Individual high school students I Have a Dream (IHAD) 6th –12th graders by class Prep for Prep Individual high school students College Bound (GE) Secondary schools Summerbridge Individual secondary students Kids to College (K2C) 6th graders by school College Pathways Secondary students by class University-based: BioPrep Individual secondary students
(grades 8-12) College Now Individual high school students Monterey Bay Education Consortium (MBEC) K-12 by school/region Neighborhood Academic Initiative (NAI) Individual high school students MN Postsecondary Enrollment Options Program (PEOP) Individual secondary students Project Step K-12 students Xavier’s Stress on Analytical Reasoning (SOAR) Individual secondary students King-Chávez-Parks Initiative Individual secondary students (grades 6-11) TexPrep Individual secondary students Minorities in Engineering and Sciences (MESA) Individual secondary students
Early Identification Program (EIP) Individual secondary students (Virginia and Wisconsin) (grades 8-12)
Government-sponsored: State OK Higher Learning Access Program (OHLAP) Individual high school students College Reach Out Program (CROP) (RL) Individual secondary students
(grades 6-12) New Jersey College Bound Individual secondary students
(grades 6-12) Illinois Early Outreach Program (EOP) Individual secondary students
(grades 7-12) Indiana Career & Postsecondary Advancement Center (ICPAC) Individual secondary students
Federal: Upward Bound Secondary students by class GEAR UP K-12 student by school

17
Exhibit 1
Prototype intervention programs, by program type and targeted students (continued)
Program type Target population Community-based: College Kids Individual 3-5 grade students The Posse Program Individual high school students Puente High school students by class K-12: Advancement via Individual Determination (AVID) Individual high school students Baltimore College Bound 9th & 10th graders by class
Detroit Area Pre-college Engineering Program (DAPCEP) Individual K-12 students
Project GRAD K-12 students by school Urban Partnerships K-12 students by school
Types of Programs
Private Nonprofit Programs
Private nonprofit programs originate from foundations, agencies, or even corporate entitieswith a specific mission or goals related to better preparing students for college. These programs tend togrow out of a belief that the focused attention of a benefactor outside the system can provide “lighthouse”demonstrations that may later be picked up and integrated into the educational system. Although thecorporations that sponsor such initiatives are quite obviously for-profit organizations, the programactivity is typically conducted under the auspices of a nonprofit subsidiary or foundation set up for thispurpose, or it is sponsored out of the community relations department of the company. Foundations willfrequently fund such programs for a limited demonstration period with the idea that if they are successful,they will attract support from other sources.
Sometimes these programs incorporate themselves and become permanent features in theeducational landscape. I Have a Dream (IHAD) is such a program. It began with the good intentions ofone person to inspire one classroom of students in New York City. It has expanded to become anationwide nonprofit program at 140 sites across the country, and its components have grown from thesingle-minded notion of inspiring students to go to college by providing guaranteed scholarships, toensuring that the students in the program receive a host of supplemental services. Nonetheless, eachprogram site must attract its own benefactor who provides support for the program. Benefactors of IHADmay be individual communities, agencies, corporations, or foundations. The impetus for the programs,though, revolves around a notion that people outside the public schools can have an impact on studentsinside these schools, and that their status as unfettered outsiders is of particular value in this effort.

18
The College Bound program, which was working with 19 high schools in 1999, was initiatedby the General Electric company. GE gives grants to schools in communities where the company hasplants or offices that agree to double their college-going rate for particular groups of students. GEembarked on this ambitious experiment nearly a decade ago to test out models of intervention that ithoped would prove effective, and then to assist schools in adopting these interventions. GE has givenconsiderable autonomy to its pilot sites to develop program features that work in each uniqueenvironment. GE’s grants have been awarded in amounts up to $1 million to each school, and it hasprovided up to 10 years for the reforms to take hold. A recently released evaluation is reviewed later inthis document.
Foundations often provide grants to universities, community-based organizations, or schoolsto help them achieve their goals. The foundations vary greatly in their level of involvement in programdevelopment and implementation—from a hands-on approach to simply providing the financial resourcesto allow others to experiment. The Urban Partnership Program (UPP) sponsored by the U.S. Departmentof Education’s Fund for the Improvement of Postsecondary Education is one such initiative. UPPprovides funding to support partnerships between schools, colleges, parents, and other organizations.With the ambitious goal to “broaden postsecondary opportunities” for at-risk students, it disseminatesfunds to those organizations that can work toward this goal rather than developing its own programming.
Postsecondary Education-Sponsored Programs or K-16 Partnerships
A 1994 survey by the U.S. Department of Education revealed that about one-third of allcolleges and universities offer at least one program designed to increase access for educationally and/oreconomically disadvantaged precollegiate students (Perna and Swail, 1998, citing Chaney, Lewis, andFarris, 1995). Universities become involved in these efforts for multiple reasons. At one level,universities see themselves as consumers of the products of public schools—high school graduates. Tothe extent that these students arrive at the university underprepared for the rigors of college-level work,the institutions have viewed it to be in their own self-interest to help strengthen the public schools. Atanother level, the colleges’ and universities’ involvement results from the taxpayers’ perception that theuniversity holds some responsibility for the state of American education. At yet another level, facultywith expertise in learning and education have relished the opportunity to test out their own theories inmodel interventions.
Programs can focus on partnerships between colleges and schools, usually high schools, inan effort to share resources, strengthen the schools, and establish connections between the variouseducational communities. The Monterey Bay Education Consortium (MBEC) is such a program. TheSanta Cruz campus of the University of California took the lead in organizing the feeder schools to itscampus from elementary school through middle school, high school, and community college, and joinedwith the local campus of the state university to provide integrated informational and support services tostudents beginning in the early grades. Students are given a Passport to Education in the fourth grade(hand-held and on the web), which they are to have stamped every 2 years as they achieve benchmarkson their pathways toward high academic achievement and college.
Another example of this type of program is Virginia’s Early Identification Program (EIP), acollaborative program between George Mason University and the Fairfax County public schools. EIPoffers academic programming that takes place on the college campus to selected eighth grade students,thus exposing students to college life and providing intensive academic preparation.

19
Xavier University runs Stress on Analytical Reasoning (SOAR), an intensive academicsummer program for students considering careers in the health professions. Students attend each summerof their high school years, focusing on supplementing the math and science curriculum in their schools,and building their vocabulary and reading skills. By the time these students are ready to enroll at Xavier,they may have had several summers of supplemental instruction to help prepare them for a rigorous pre-med science education. The program helps the historically black Catholic college to realize its ownmission of preparing black students for careers in science and medicine, and it helps to provide a cohortof well-prepared students to fill its freshman classes.
Government-Sponsored Programs
The two major sources of government-sponsored programs are the states and the federalgovernment. A number of states have taken on statewide initiatives to stimulate college-going. Theselarge-scale programs often are funded because the state is not preparing enough highly qualified collegegraduates to fuel its economy, and it may be losing population as a result. Indiana is one such example.Or, demographic trends in the state may threaten to create social problems if higher education is not mademore accessible to the increasing portion of the state’s population that is low income and nonwhite. BothCalifornia and Florida are examples of this situation.
Federal initiatives, on the other hand, tend to stem from an evolving philosophy about therole of the federal government in education. While the provision of education is a state responsibility, therole of the federal government has increasingly become that of equalizing opportunity across the states byproviding information to students, assistance to schools in accommodating students with special needs,and financial support for low- (and increasingly for middle-) income students to attend college.
Many government programs focus on providing incentives and increasing access forunderrepresented students to attend postsecondary institutions. Florida’s College Reach Out Program(CROP) provides funding for enrichment activities, career counseling, and academic programs as a wayto provide support to students who might not normally have considered college. Oklahoma’s HigherLearning Access Program (OHLAP) offers scholarships and information about financial aid to helpstudents with financial need attend college. The federal government’s TRIO programs providecomprehensive services from middle school to college to increase the likelihood that low-income andunderrepresented students might gain access to postsecondary opportunities.
Community-Based Programs
These programs originate from members of a community who see a need among their ownyouth and develop a program to address that need. They often focus on supporting students outside of theschool environment. Strategies used by community-based programs are frequently similar to those inschool-based programs, but they can also incorporate elements that are specific to a particularcommunity, including cultural experiences that help students to develop healthy self-concepts. Theseprograms typically pull resources from within their own community, such as mentors who representsimilar backgrounds as those of the children whom they serve. The Kids to College Program inMassachusetts pairs colleges and clusters of local schools to expose sixth graders to postsecondaryeducation. An important element of the program is making students aware of the opportunities forpostsecondary education within their own communities and connecting students to others from their owncircumstances who are pursuing higher education. Kids to College offers day trips to colleges andengages students in a special curriculum designed to support academic learning as well as providingactivities that help tie students to their own communities.

20
The Puente program in California, while currently supported by university and state funds,actually had its impetus as a community-based program, and many of its features continue to reflect thatorientation. Puente focuses on preparing the large population of underachieving Hispanic students in thestate for a college education. It incorporates literature from the students’ own community into a rigorous2-year college preparatory English curriculum, and it provides both mentors and counselors from theHispanic community who can communicate in Spanish with parents and serve as models of educationalaccomplishment from within the community.
College Kids, based at three sites in California, is a unique program in that it focusesintensively on students in grades three to five and helps their communities to gain resources to providementoring, academic enrichment, and parent education. The program draws heavily on local collegestudents to provide academic enrichment activities twice weekly and incorporates lessons and activitiesdesigned to support the children’s self-concept and identity as persons of color before they enter thechallenging middle school years. Ninety percent of the students are Hispanic, and most of the others areblack.
K-12-Sponsored Programs
Many programs are spearheaded by the public school systems throughout the country. Somebegin as early as grammar school, while others are initiated by high schools. Superintendents of publicschools or individual principals may begin programs. The impetus for the schools is clear. The public isincreasingly demanding that students complete their high school diploma programs and be prepared forentry into college. K-12 public schools have been under a spotlight of public attention and heavilycriticized for failing at this mission, especially with low-income and nonwhite children, and interventionprograms are an important way for schools to demonstrate their commitment to improving outcomes forstudents. Slavin and Fashola (1998) have reviewed some of these programs that they find particularlysuccessful in raising student achievement.
For this review, K-12 programs that do not have a specific focus on assisting inpostsecondary educational enrollment are not examined. Programs that serve to increase studentachievement can have a powerful effect on the chances that students will enroll in postsecondary schools.However, including any portion of the programs nationwide that simply purport to raise studentachievement would have rendered this study far too unwieldy and unfocused to have served the questionat hand: What are the most effective strategies currently being employed to increase the college-goingrate of underrepresented students? Early and consistent focus on academic achievement is essential toachieving any significant increases in the educational attainment levels.
Advancement via Individual Determination (AVID) was a response by one high schoolEnglish teacher in a San Diego school to her frustration with the academic tracking system. MaryCatherine Swanson decided that a group of mostly low-income minority students who showed academicpromise, but who were underperforming in school, should be placed into college preparatory English andprovided the support to help them succeed. From this bold experiment grew a program whose focus hasbeen on “untracking” students and providing them with the academic support and encouragement to go onto college. AVID is now in scores of California schools as well as in several other states.
In Houston, Project GRAD takes a highly systemic approach to its intervention strategy.Project GRAD is designed to capitalize on the extensive research that exists on increasing studentlearning. It incorporates six well-researched programs into a K-12 strategy that includes components tostrengthen students’ learning along the pipeline leading to high school graduation. More than an

21
informational, counseling, or incentive approach, Project GRAD is based on a philosophy that onlyreform of the entire education system will allow significant numbers of underrepresented students tobecome academically competitive for college.
Program Components
Within each of the five program types there are multiple program components. The mostcommon program components are counseling, academic enrichment, parental involvement, personalenrichment and social integration, mentoring, and scholarships. Each of these components can occuralone or in combination with others in a program type. All 33 programs reviewed employ at least one ofsix overall program components. Counseling and academic enrichment define the majority of theprograms, with 28 programs providing some form of counseling and 26 providing an academicenrichment component. Parental involvement components in some form are found in 18 programs.Personal integration and social enrichment components are also part of 18 programs. Thirteen of theprograms incorporate a mentoring element, and 10 offer some type of college scholarship.
Counseling
It is not surprising that so many programs would incorporate a counseling component. Thelack of adequate counseling has been identified as a major obstacle to college-going for underrepresentedstudents (Oakes, 1995; Romo and Falbo, 1996; McDonough, 1997). However, underrepresentedstudents’ reluctance to use counselors because they are perceived to be ill informed about minoritystudent issues or because they have a reputation for counseling these students into low-level classes isalso well documented (Atkinson, Jennings, and Livingston, 1990). At least two challenges forintervention programs that incorporate counseling features are providing enough qualified counselinghelp to meet students’ needs and building trust with this population of students and families.
The majority of the pipeline programs discussed in this report invest time and effort incounseling their student participants. The goal behind the counseling efforts is the same for mostinitiatives: to provide students with access to information so that they may attend college. Programsemploy a number of strategies in order to disseminate college information and advising. Some offerindividual consultations with students to help them to better understand the college search and applicationprocess. Others employ peer, staff, or college representatives who speak with groups of students aboutcollege opportunities and campus life in a workshop or classroom setting. Several programs offerassistance with financial aid forms and college applications. For many students, these forms, whichsometimes seem overwhelming, can become a significant barrier to attending college (Latino EligibilityStudy, 1994). In some cases, programs with specific interests—such as the Illinois Early OutreachProgram—counsel their student participants to enter specific fields, such as science and engineering.Wisconsin’s Early Identification Program focuses heavily on counseling and advising in order to helpstudents achieve their career, employment, and college goals.
Nine of the programs that offer counseling address career planning. These programs, oftenwith specific interests, encourage students to explore their career options. As a part of the careercounseling process, some counselors develop internship programs or partnerships with corporate sponsorswho provide speakers or volunteers from the business sector to work directly with students. Counselingis different from mentoring, however, in that it offers guidance to students in an informational oreducational way. The focus is usually on the college selection and application process or careercounseling. Exhibit 2 displays the types of counseling services provided by the programs.

22
Exhibit 2
Counseling services provided, by program
ProgramCollege and/or
financial advisingCareer advising
Assistance w/form and college
applicationPersonal
A Better Chance x x xAVID x xBaltimore College Bound x xBioPrep x xCollege Bound x xCollege KidsCollege NowCROP x x xDAPCEP xGEAR UP x x x xI Have a Dream x xICPAC xIL EOP x x xKids to College xKing-Chávez-Parks xMBEC xNAI x x xNJ College Bound x xOHLAP xPostsecondary EOPPrep for Prep x xProject GRAD xProject StepPuente x x xSOAR xStep to College/Mission xSummerbridgeTexPrep xThe Posse Program x x xUpward Bound x x xUrban Partnership Program x xVirginia EIP x xWisconsin EIP x x x x
Academic Enrichment
While most of the programs provide college counseling, just as many employ an academicenrichment component of some kind. Academic enrichment addresses the problem of underpreparationfor college and attempts to strengthen students’ college eligibility. When underrepresented students arebeing required to compete with more advantaged students for the limited slots in selective institutions,academic enrichment helps them to compete more effectively, both in admissions and in the classroom.

23
To strengthen students’ academic preparation, some programs provide tutoring (e.g., AVID)or extensive supplemental courses to augment the schools’ curriculum (e.g., Upward Bound), or theyfocus on changing the curriculum and method of delivery (e.g., Project GRAD). All of these strategieshave a strong basis in the literature. Tutoring has been shown to be an effective means of strengtheningstudents’ core academic skills (Slavin and Karweit, 1985), and additional time on task when instruction istargeted to particular needs and provided by a skilled teacher also increases achievement (Walberg, 1993;Carroll, 1963). Some programs also provide students with an opportunity to get a head start on theircollege requirements, or to experience college life prior to matriculation. To better prepare students forthe demands of college-level courses, programs offer specific classes, seminars, or workshops to helpstudents improve their reading, writing, and analytic skills.
Many of these programs make the academic component their core component. XavierUniversity’s SOAR program, for example, is heavily focused on improving the academic skills of itsparticipants. The summer program, which involves daily quizzes, daily homework, an emphasis onreading and writing, and weekly report cards sent home to parents, hopes to better prepare students for therealities of college demands. The long-term goal for SOAR—and for many other programs withacademic components—is, in addition to making students eligible for college, to increase their retentionand graduation rates by improving their academic skills. Initiatives like SOAR, TexPrep, andSummerbridge offer their core academic programs during the summer, but programs vary. Some engagestudents in classes taught by university faculty on the college campus in order to expose participants to acollege environment (e.g., SOAR) or to college or high school students who may be trained by theprogram (e.g., College Kids). Some are peer-taught (like Summerbridge). BioPrep has developed its ownaccelerated curriculum and encourages students to pursue careers in the health and science professions.
In addition to these academic enrichment efforts, many programs offer tutoring to theirparticipants. Tutors can be college students (e.g., AVID), members of the community (e.g, MBEC), orschool personnel (e.g., Upward Bound). Others, such as College Bound or Virginia’s EIP, offer SAT orACT preparation courses or coaching. A few utilize assessment tools to evaluate student levels ofpreparation and ability. College Now, at City University in New York, identifies high school studentswho are “moderate achievers” and places them in either remedial or college-level courses.
Some programs, like the Neighborhood Academic Initiative (NAI), offer before- or after-school and/or Saturday programs, while some form partnerships with local colleges and universities sothat students can take college level courses—sometimes for credit. Minnesota’s PostsecondaryEnrollment Options Program (EOP) offers accredited college-level classes to high school juniors andseniors enrolled in public schools. The state strategy is focused on challenging students to spur them onto more “rigorous academic pursuits.” Exhibit 3 displays academic enrichment activities by program.

24
Exhibit 3
Academic enrichment services provided, by program
ProgramSummerprogram
TutoringCollege-based or
college-levelcourses/programs
High school orafter-schoolacademic
preparationprogram
AssessmentSAT/test
preparation
A Better Chance XAVID x X xBaltimore College BoundBioPrep x XCollege Bound x X xCollege Kids x xCollege Now (+remedial) x xCROP x xDAPCEP x xGEAR UP x x x x xI Have a Dream x xICPAC xIL EOP x xKids to CollegeKing-Chávez-ParksMBECNAI x xNJ College Bound x xOHLAPPostsecondary EOP xPrep for Prep xProject GRAD x xProject Step x xPuente x xSOAR x x x x xStep to CollegeSummerbridge x x xTexPrep xThe Posse Program xUpward Bound x x x xUrban PartnershipProgramVirginia EIP x x x x xWisconsin EIP x x x
Parent Involvement
While the education literature touts the advantages of parent involvement for students’academic achievement, this research has sometimes been misconstrued to suggest that involvement instudents’ schools is a causal factor in their increased performance. Some have been quick to equate

25
attendance at PTA meetings or as school volunteers as the measure of parents’ interest or influence ontheir children’s schooling. In fact, it is the parents’ involvement in their children’s education—whereverthat occurs—that is the more critical factor in achievement (Moles, 1982), and it is difficult to measurethis level of involvement, especially for language minority parents and others who have not themselveshad extensive experience with the American schooling system. Many of these parents feel uncomfortablein the schools and will not come to parent meetings. This does not necessarily mean that they areuninterested in their children’s education or their schooling, but it does make it more difficult tocommunicate important information. A major challenge for some intervention programs is to find waysto communicate with parents about the goals of the program and the ways that parents can help supportthose goals.
Some programs require that parents sign a contract to support their child’s participation inthe program and attend parent information meetings (e.g., Puente). At a minimum, programs that have aparent involvement component provide informational sessions on college requirements, financial aid, andother related topics (e.g., King-Chávez-Parks, SOAR, and Upward Bound). A number of programs alsooffer training programs on helping students to excel in school. These training sessions may covermonitoring homework, maintaining communication and discipline with adolescents, issues in adolescentdevelopment, and other related topics. To attract parents, some programs conduct the sessions in theirprimary language and add other cultural elements to the activities (e.g., Puente, College Kids).
More than half of the programs reviewed include a component that involves parents in someway. Most of them offer an orientation so that parents better understand the programs in which theirchildren are involved. Some engage parents as volunteers. Some develop initiatives specifically designedfor parents. NAI, for example, includes parents in Saturday morning counseling sessions so that parentscan better understand the academic options for their children both in high school and college. Programsthat require a heavy commitment of time from parents may also use this strategy to screen out studentswhose parents do not support their children’s academic endeavors, since that may be an importantpredictor of long-term success in a program (PEPC, 1998). Several programs involve parents as programdesigners, developers, or even staff. California’s Project Step encourages networking among parents,college faculty, and principals. The Detroit Area Pre-College Engineering Program (DAPCEP) uses aparent advisory committee that offers seminars and opportunities for other parents and their children.Exhibit 4 demonstrates the kinds of parent involvement activities that are employed.

26
Exhibit 4
Parent involvement activities, by program
ProgramOrientation to
program for parentsParents asvolunteers
Programs for parentsParents as program
designers,developers, staff
A Better Chance xAVIDBaltimore College Bound xBioPrepCollege BoundCollege Kids x x x xCollege NowCROP xDAPCEPGEAR UP xI Have a DreamICPAC xIL EOP xKids to CollegeKing-Chávez-Parks xMBEC xNAI xNJ College Bound xOHLAP xPostsecondary EOP xPrep for PrepProject GRAD xProject Step xPuente x x xSOAR xStep to College/MissionSummerbridgeTexPrepThe Posse Program xUpward Bound x xUrban Partnership ProgramVirginia EIPWisconsin EIP x
Personal Enrichment and Social Integration
Eighteen of the pipeline initiatives reviewed here describe themselves as offering some kindof personal enrichment or social integration strategy, including leadership development, goals setting,confidence building, cross-cultural workshops, community service, connection to the arts, or field trips.Some programs bring in speakers from colleges and universities or from the workforce to help students

27
broaden their understanding of the opportunities available to them. The goal behind these personalenrichment activities is to help students build self-esteem, develop confidence, and feel empowered toachieve and succeed in their academic careers, and ultimately to confer cultural capital, or a knowledge ofhow to make the system work. Activities geared toward social integration help students to find asupportive niche in their environment and provide opportunities to build relationships with others.California’s Step to College Program works toward creating a “culture of college-going” amongunderrepresented junior and high school students. Activities include cultural awareness and socialsupport from peers. Some students who finish the program return to become tutors and counselors to theyounger students. Exhibit 5 displays the range of personal enrichment and social integration activities.
Exhibit 5
Personal enrichment and social integration (PESI) strategies, by program
Program LeadershipArts andcultural
activitiesField trips Speakers
Peercomponent
A Better ChanceAVID x x xBaltimore College BoundBioPrepCollege Bound xCollege Kids x x xCollege NowCROPDAPCEP x xGEAR UP x x x xI Have a Dream xICPACIL EOP xKids to College xKing-Chávez-Parks xMBECNAINJ College BoundOHLAPPostsecondary EOPPrep for Prep x x

28
Exhibit 5
Personal enrichment and social integration (PESI) strategies, by program (continued)
Program LeadershipArts andcultural
activitiesField trips Speakers
Peercomponent
Project GRAD xProject StepPuente x x x x xSOAR x x x xStep to College/Mission x xSummerbridge xTexPrep x xThe Posse Program x x xUpward BoundUrban Partnership Program x xVirginia EIPWisconsin EIP
Mentoring
Although only 13 of the 33 programs highlight formal mentoring as one of their mainprogram components, mentoring is viewed by many as a critical element in increasing student successrates. However, there is actually very little evidence in the literature to support the notion that mentoringimproves academic performance. Only a couple of studies have shown even modest increases in grades(Grossman and Tierney, 1998), which could represent a Hawthorne effect—students who are selected forany kind of program may show some effects from simply being treated specially—or othermethodological problems. Other studies have shown mentoring effects on behavioral indicators such asreduction in student truancy and drug and alcohol use (Rogers and Taylor, 1997; Grossman and Garry,1997). One difficulty with this research is the problem of measuring the nature of mentoring relationshipsacross large groups of students and finding appropriate comparison groups of students against which totest the effectiveness of the program (Mejorado, 1999).
Programs like The Posse Program train and send students in teams to college so that they cansupport one another through the year prior to college and all through college. In addition to the teamcomponent at Posse, a graduate student is assigned to each team to formally mentor each student bothacademically and socially. The I Have a Dream program engages mentor-sponsors from the corporatecommunity. Each mentor-sponsor adopts a sixth grade class and provides encouragement, culturalenrichment opportunities, and financial support to each student. Mentoring activities that areincorporated in the programs are shown in exhibit 6.

29
Exhibit 6
Mentoring provided by various participants, by program
Program Peer-basedUniversity and/or high
school staff and/or facultyVolunteers
Corporate/professionals
A Better ChanceAVIDBaltimore College BoundBioPrepCollege Bound x x xCollege Kids xCollege NowCROP xDAPCEP xGEAR UP xI Have a Dream x xICPACIL EOPKids to CollegeKing-Chávez-ParksMBECNAI xNJ College Bound xOHLAPPostsecondary EOPPrep for PrepProject GRADProject StepPuente x xSOAR xStep to College/MissionSummerbridge xTexPrepThe Posse Program x xUrban Partnership ProgramUpward Bound x xVirginia EIPWisconsin EIP
Scholarships
Ten of the programs include some financial assistance in the form of scholarships. Thescholarships may be solely for the purpose of defraying costs associated with attending college, such asIndiana’s 21st Century Scholars Program (an addition to the ICPAC portfolio of programs instituted in1990), or they may be used as encouragement or incentives to attend college, and therefore cover collegecosts. Scholarships can also be awarded at different levels, depending on the student’s level ofachievement, or they may be awarded on the basis of college admission. Scholarships offered can take

30
the form of last dollar scholarships (the difference between all other scholarships and aid and the student’sneed), field-focused or career-specific initiatives (such as engineering scholarships), diversity initiatives,or merit awards. Often a scholarship component is included or made the core component of a programwith the intention of inducing students to work toward and apply to specific colleges or academic foci.
The size of the scholarship and the commitment of the funding agencies are a function of thesize of the program as well. Large-scale initiatives such as statewide programs are unlikely to providefull-ride scholarships to independent or private schools, though they may provide full tuition scholarshipsfor public institutions to a targeted group of students. Smaller programs, on the other hand, may providefull scholarships to either a specific independent college, such as the NAI provides for the University ofSouthern California and Posse provides for Vanderbilt University, or for an institution of choice, such asA Better Chance does. Funding for these types of programs can come from university commitments,private sponsors, or government initiatives. Indiana’s statewide program to increase college-going amongits students places scholarships at the center of its activities, along with information gathering anddissemination. On the basis of an extensive study sponsored by the Lilly Foundation, Indiana elected toinvest heavily in scholarships that it awards for different levels of performance. The 21st CenturyScholars program, for example, guarantees that any student who meets the eligibility requirements for oneof the state’s 4-year institutions will be provided sufficient scholarship money to attend. In the last 10years, Indiana has doubled its commitment to student scholarship support. Baltimore, Maryland’s CollegeBound Program helps students apply for financial aid and then offers “last dollar” support to ensure thatthey will be able to attend. Exhibit 7 provides information on scholarships.
Exhibit 7
Scholarships available from various sources, by program
Program University Private/corporate Federal/state
A Better Chance xAVIDBaltimore College Bound xBioPrepCollege BoundCollege KidsCollege NowCROPDAPCEP xGEAR UP xI Have a Dream xICPAC/21st Century Scholars x xIL EOPKids to CollegeKing-Chávez-ParksMBECNAI xNJ College Bound xOHLAP xPostsecondary EOP x

31
Exhibit 7
Scholarships available from various sources, by program (continued)
Program University Private/corporate Federal/state
Prep for PrepProject GRAD xProject StepPuenteSOARStep to College/MissionSummerbridgeTexPrepThe Posse Program xUpward BoundUrban Partnership ProgramVA EIPWI EIP
Summary of Program Features
Based on the review of the literature, there were 10 major impediments to educationalmobility for underrepresented students. The programs reviewed attempt to ameliorate them through theirvarious programmatic strategies. Each program takes a somewhat different focus both with respect to thebarriers it attempts to reduce and to the point in the educational pipeline that it targets (e.g., elementary,middle, or high school). Exhibit 8 summarizes the program features incorporated by program andpopulation target.
Exhibit 8
Summary of features, by program
Program CounselingAcademicenrichment
Parentalinvolvement
Personaland socialenrichment
Mentoring Scholarships Target audience
A Better Chance X x x Ind. H.S. studentsAVID X x x Ind. H.S. studentsBaltimoreCollege Bound
X x x H.S. students byclass (9th & 10th)
BioPrep X x Ind. secondary (8-12)College Bound X x x x Secondary schoolsCollege Kids x x x x Ind. K-12College Now x Ind. H.S. studentsCROP x x x x Ind. secondary (6-12)DAPCEP x x x x x Ind. K-12GEAR UP x x x x x x K-12 students by
schoolInd. = individual

32
Exhibit 8
Summary of features, by program (continued)
ProgramCounsel
-ingAcademicenrichment
Parentalinvolvement
Personaland socialenrichment
Mentor-ing
Scholar-ships
Target audience
I Have a Dream x x x x x 6-12 students by classICPAC x x x x Ind. secondary
studentsIL EOP x x x x Ind. secondary (7-12)Kids to College x x 6th graders by schoolKing-Chávez-Parks x x x Ind. secondary (6-12)MBEC x x K-12 studs by schoolNAI x x x x Ind. H.S. studentsNJ College Bound x x x x Ind. secondary (6-12)OHLAP x x x Ind. H.S. studentsPostsecondary EOP x x x Ind. secondary
studentsPrep for Prep x x x Ind. H.S. studentsProject GRAD x x x x x K-12 students by schoolProject Step x xPuente x x x x x H.S. students by classSOAR x x x x x Ind. secondary studentsStep toCollege/Mission
x x
Summerbridge x x x Ind. Secondary studentsTexPrep x x x Ind. secondary studentsThe Posse Program x x x x x x Ind. H.S. studentsUpward Bound x x x x Secondary students by
classUrban PartnershipProgram
x x K-12 students by school
Virginia EIP x x Ind. secondary (8-12)Wisconsin EIP x x x Ind. secondary students
Ind. = individual.
While few programs are actually explicit about the relationship between what they do, thekinds of problems they are attempting to ameliorate, or how the program elements relate to impedimentsidentified in the literature, it is possible, nonetheless, to create these logical links by matching knownimpediments with the strategies that the programs incorporate.
Logical Links Between Impediments to Access and Program Strategies
Inequalities in familial cultural and social capital. These inequalities are addressed byparent involvement programs that provide parents with critical information about educationalopportunities and teach skills to help parents monitor their children’s educational progress. Eighteenprograms offered this kind of support for parents. Notable examples of informational programs areIndiana’s ICPAC program and Florida’s CROP program. Both have invested substantial resources indeveloping extensive data and information delivery systems so that parents of first-generation college

33
students can easily access the information they need, including students’ records and collegerequirements, to help support their children’s pathway to college. Mentoring is also a strategy thatsupports the goals of increasing cultural and social capital to students, and sometimes to parents. Aprimary role of the mentor is to share knowledge and experience gained from having successfullynavigated at least some portion of the educational system.
Inequality of neighborhood resources. Most programs do not address this problem, butprograms that are rooted in the community and provide some programming related to communityexperiences, such as College Kids, do attempt to strengthen neighborhood support of youth. Programsthat draw their mentors from the neighboring community, such as Puente, also tap community resourcesand build a cadre of role models accessible to students within their neighborhoods or local communities.Finally, programs such as A Better Chance and Prep for Prep take the opposite approach—they transferstudents into educational settings where high levels of community resources already exist.
Lack of peer support. Programs like AVID and Posse work directly to develop and nurturepeer groups from the same backgrounds and communities who mutually support high academic goals.Through joint activities, field trips, and course-taking, students in AVID come to build supportivefriendships; Posse builds strong peer groups through joint activities and workshops during high school,then sends the group together to college, where they support each other during the critical first year awayfrom home. These kinds of activities generally fall under the rubric of social integration. Many programsprovide some kind of integrating function for students, but most do not attend specifically to their peergroups and the issues that students face when they choose to excel in a peer culture that is not supportiveof academic accomplishment.
Racism. Few programs attempt to deal directly with the problem of racism, perhaps in partbecause most reviewed programs catered to a broad mix of students, including low-income and first-generation college-going white students for whom racism is not a major issue. However, programs likeCollege Kids, SOAR, or Puente, which either consciously recruit from particular communities or drawstudents of color almost exclusively, implicitly deal with racism in some of the activities they provide tostrengthen students’ self-concepts and increase their pride in their communities of origin. For example,Puente’s integration of Hispanic literature into the core college-preparatory English class is an attempt tocounter stereotypes that Hispanics do not excel academically.
Inequalities in K-12 schools. Most programs offer some kind of academic enrichmentdesigned to make up for the inequalities in the schools. Upward Bound, Neighborhood AcademicInitiative, and the Detroit Area Pre-college Engineering program, for example, all provide extensiveacademic coursework to augment the public school curriculum. Only Project GRAD, however,specifically targets the educational system across segments to help strengthen all students’ academicexperience. Project GRAD fundamentally alters the existing curriculum in the schools, though itscurricular focus does not extend into the high schools where tracking continues to be a problem.
Segregation. Most programs do not address the problem of segregation by class orethnicity. However, some programs segregate students for some portion of the day or in some activitiesin order to build a group of ethnically similar peers to support each other. This is sometimes referred to ascreating “safe places” for students to retreat when the pressures of stereotype can become stressful andplace students at risk (Steele, 1997). On the other hand, Prep for Prep, A Better Chance, Posse, and NAIincorporate low-income and underrepresented students into schools that serve largely privileged, whitestudents. In this way, they provide a desegregated schooling experience for some students.
Ineffective counseling. Most (26) of the programs reviewed offer extensive counseling.While educational preparation has been shown to be a powerful predictor of postsecondary choices, there

34
is also abundant evidence that counseling that tracks students into low-level courses is responsible, inpart, for under preparation. Hence, to address this problem, counseling for underrepresented studentsmust be improved. The Monterey Bay Education Consortium has introduced a unique approach tocomprehensive college counseling. Through its Passport to Education program, MBEC begins the collegecounseling process at grade four and continues meeting with students at intervals to document theirprogress on the pathway to college. Each time a benchmark is achieved, the student receives a stamp inhis or her passport. In this way, students are kept constantly aware of the requirements for college, andare aware that others expect them to go to college.
Low expectations and aspirations. The personal enrichment and social integration featurethat 18 of the programs includes often incorporates activities designed to strengthen students’ self-concepts and to raise their aspirations. Programs such as Upward Bound and AVID regularly offermotivational speakers, often from the students’ communities, who act as role models and provideencouragement to students that they, too, can make it to college and beyond.
Financial aid. Having limited financial resources is a major barrier to attending 4-yearcolleges for low-income students, yet most intervention programs do not directly provide financialsupport. Many offer information about scholarships that are available and encourage students to seekthese scholarships. However, provision of financial support is not a core aspect of most of theseprograms. Indiana and Florida, however, have made large-scale commitments to provide adequatesupport for all their qualified low-income students. I Have a Dream is a private nonprofit program withthe objective of ensuring that all children in the program who qualify for college will receive scholarshipssufficient to cover their costs. Since its inception, IHAD has expanded its activities to include an array ofstrategies to help increase the probability that students will succeed in school and become eligible for thescholarships.

35
5. PROMISING PRACTICES
In the review of the literature on opportunities to learn (Appendix A and in section 2) 10major impediments to access were summarized. In Section 4, a taxonomy of programs was developed,and the program features and strategies were reviewed. The logical links between impediments andprogram strategies were discussed; however, most programs do not provide evidence of empirical linksbetween program features and student outcomes. Most do report increases in student achievement oraccess as a result of the program, but because these findings are rarely tied to outcomes for comparablecontrol groups, it is very difficult to know if the outcomes are the result of the program intervention, theselection of students into the program, or something else. Bailis et al. (1995) observe that,
Several barriers have been particularly powerful in preventing thedevelopment of definitive estimates of program impact. . . studiestypically lack comparison groups of similar students who did not receiveprogram benefits, and this makes it impossible to be sure how much theoutcomes can be attributed to the programs. . . .Coupled with this is thepaucity of data collected by most college access programs. Withoutinformation about students prior to participation in the program, it isagain difficult to ascertain whether the programs actually made adifference (p.6).
Thirteen programs that have undertaken evaluations of varying rigor and whose findingsilluminate important issues in college access have been identified. Most are not designed to test whichfeatures of the program are most effective, but some inferences can be drawn. The 13 programs and thestudents they target for intervention are shown in exhibit 9.
Exhibit 9
Promising programs and their target populations
Program Target
Posse Individual high school studentsNAI Individual high school studentsA Better Chance Individual high school studentsUpward Bound Individual high school studentsAVID High School --ClassroomsPuente High School --ClassroomsCollege Pathways High School --ClassroomsGE College Bound* Entire high schoolsI Have a Dream K- 12 classroom or communityProject GRAD K-12 feeder schoolsFlorida (CPOP) High schools statewideIndiana (ICPAC) High schools statewideMinnesota (PEOP) High schools statewide
*Some College Bound programs reach into the middle school, and some target only one group within aschool; however, most programs target whole high school student bodies through school reform.

36
Most programs are anchored in the high schools and serve either individual students orclassroom groupings of students. Although most of the programs are tied in some kind of partnershipwith at least one university, it is uncommon for programs to continue services or monitoring of studentsafter high school graduation. While A Better Chance and NAI do provide some monitoring at the collegelevel, Posse is unique among the programs in its almost equal provision of services both before and aftercollege matriculation. The focus among these programs on individual students or individual classroomsof students also means that the impact of the program will remain relatively isolated from the rest of theschool. Program effects may carry over to other aspects of school or personal life for the students in theprogram, but they are unlikely to have a major impact on students in the same school who are not in theprogram. The next section is a summary of the overall findings of our review of these evaluations,followed by a discussion of each of the programs and findings.
Summary of Evaluation Findings
While not all of the programs provided a rigorous evaluation, some did, and the convergence ofconclusions around certain issues follows.
Key Features of Successful Programs
1. Across programs, the single most important feature of those that purported to besuccessful with individual students was a close, caring relationship with a knowledgeable adult whomonitors the student’s progress. Many programs have been quick to adopt mentors for this purpose, butthe research is not yet clear on the overall effectiveness of this approach. I Have a Dream employs manyadults in the program as sponsors, mentors, and staff persons; however, the evaluation suggests that formost students, it was the years-long relationship with the program director that was key to success.Sponsors and mentors were not always as consistent in their lives. For Puente students, the counselorwho stayed with them for 4 years of high school was reported to be a very influential person in their livesand in helping them to make the decision to go to college.
2. Effective program provided high-quality instruction either through access to the mostchallenging courses offered by the school (“untracking”), through special coursework that supports andaugments the regular curricular offerings (tutoring and specially designed classes), or by revamping thecurriculum to better address the learning needs of the students.
3. These programs made long-term investments in students rather than short-terminterventions. The longer students were in a program, the more they were reported to benefit from it.
4. Most of the effective programs paid attention to the students’ cultural background andattempted to incorporate this both in the structure and the content of the program. If Rendón (1994) iscorrect about the need for validation that many of these students have, then the cultural component maybe a core feature of success.
5. A number of programs attributed some of their effectiveness to the formation ofsupportive peer groups, yet there is little extensive study of this phenomenon and little evidence ofeffective strategies to create and sustain these groups being replicated across programs. This area isprobably worthy of much more study and attention.
6. Scholarship assistance has been shown to be very important in helping students to go tocollege, but most programs do not provide significant scholarship support. Given the documented

37
evidence that income has independent effects on college-going, both whether a student goes, and to whatkind of institution, it is troubling that more emphasis is not placed on this need.
Impediments to Greater Success for Programs
1. Attrition from programs is a major—often unattended—problem. Many programsprovide no or very sketchy data on their attrition over time, and those that do commonly show only aboutone-third to one-half of the original participants completing the program. Of course, the longer theintervention, the more the risk of attrition exists. But many programs reported evidence that the longerthe students were in the program, the greater the impact on outcomes. Thus, it would appear that in orderto maximize the effects of these programs, it is critical to stem attrition.
A major factor in attrition is the ease with which students may enter and exit purelyvoluntary programs. Strategies used by some programs were shown to be very effective in holdingstudents. Puente’s strategy of enrolling students into a class that met graduation requirements and waspart of their regular high school program of study seemed to be an effective method.
2. It is uncommon to find programs reporting actual academic gains in the form of increasedGPA or even test scores for individual students. Most programs appear to begin too late (in high school),do not last long enough, and are not intensive and extensive enough to have a real impact on measuredacademic achievement. The best that most of the programs appear to do is to level the playing field forthese underrepresented students as a group, but little evidence exists that the programs they reviewedwere actually creating high performing students. Some programs did, however, help students to exploittheir potential much more effectively, sending much higher percentages of students on to college.However, without a more systemic approach, it does not appear that these programs can have a truly largeeffect on measured achievement.
3. Most programs focus on affecting outcomes for individual students. That is, theintervention is based on selected individuals, even though the evaluation studies often are not.Nonetheless, such an approach, while potentially very effective for individual students, leaves the schoolsand the environments that surround underachievement untouched. Project GRAD was alone in itsemphasis on changing the structures of the education system in order to have an impact on the fortunes ofindividual students. It is too early to know yet how successful Project GRAD will be, but early returns onthe experiment are positive.
4. None of the programs reviewed was truly systemic in the sense that it linked programcomponents across the K-12 and postsecondary education. Project GRAD covers the longest period ofeducation—from kindergarten into high school. However, it assumes that students will be sufficientlyequipped at the high school level to succeed without additional intensive intervention. While that mayprove to be true, the research suggests caution in this regard. Moreover, of all the programs thatpurported to be aiming at getting more students successfully into and through college, only Posse actuallyhad an intensive program component at the college level. Most programs based their success on whetherstudents matriculated into college. Beyond that, students’ fates are unknown. Posse helps us tounderstand why students falter in college: the students can feel isolated and alone in what for many maybe perceived as an alien environment, with few other students like themselves to provide support.

38
Issues in Evaluation
1. Very few evaluations were longitudinal in nature. Therefore, it was necessary to make anumber of untested assumptions about the effectiveness of the program and the sources of its impact.Moreover, few evaluations actually used comparisons or controls to test their outcomes that would meeteven minimum standards of rigor. Thus, a number of conclusions from the studies must remain tentative.
2. There was wide variation in cost of programs, and many programs report that they do notreally know how much they cost. Even more surprising, however, was the absence of any form of cost-benefit analysis of the program components. How does one explain no difference, or only minordifferences, in outcomes for programs that cost $500 per student and those that cost $4,000 per student?More careful, and longer term, evaluation might well yield outcomes that have not been measured or evenconsidered.
3. While there is considerable evidence that scholarships are an important and effectivestrategy, few scholarship programs report data on student persistence. Thus, the long-term effects of thisstrategy when coupled with an early intervention program are unknown.

39
6. SPECIFIC PROGRAM WITH EVALUATION DATA
High School Programs for Individual Students
Posse
Program description
Posse was begun in New York City as a response to the founders’ observation that low-income and underrepresented students with whom they had worked in another youth program would gooff to college but did not often succeed there. The students reported that they felt isolated and had nowhere to turn; they needed their “posse” with them to succeed. Between 1990 and 1997 the program,which is run by the Posse Foundation and funded by individual, corporate, government, and foundationgrants, had placed 109 students at such prestigious universities as Vanderbilt, Rice, DePauw, and Lehigh.The program has three major objectives: (1) to provide college access and success for underrepresentedstudents from the New York City area who probably would not otherwise attend college, and almostcertainly would not be considered for highly selective colleges; (2) to help selective colleges anduniversities work toward improving the climate of diversity on their campuses; and (3) to graduate morestudents of diverse backgrounds from selective universities so that they may take on leadership positionsin society and the workforce. The program has also been a site for experimentation with the DynamicAssessment Process that focuses on identifying nontraditional high school students with strong leadershipability and potential for success.
Four principles undergird the program:
1. Educational progress, personal development, and academic achievement are advanced bycooperative and supportive conditions of learning.
2. Purposive involvement in social and political action designed to change the social contextof one’s learning contributes to a sense of polity that aids personal and academicdevelopment.
3. Cultural, political, and social intelligences, as complements to traditional criteria, areuseful variables for consideration in selection of students for selective colleges.
4. Cultural, political, and social leadership are viable as categories of talents, andcomparable to artistic, athletic, and scholastic abilities for the assignment of merit-basedcollege scholarships.
There are four major components to the Posse program:
1. Recruitment and selection of students, which is a lengthy process of interview and groupactivities to assess skills like negotiation, intergroup relations, problem solving, listening,and presentation.

40
2. A 34-week training program consisting of skill-building workshops that occur weeklyfrom January through August of the senior year and include team development,leadership and diversity training, time and financial management, and academic skills, aswell as the Posse retreat and “test of fire,” a secret set of activities designed as aculminating experience for the group from which “they leave understanding some verybasic tenets of the relationship between individuals and their culture” (Bowman andGordon, 1998, p. 34).
3. A full-tuition scholarship provided by the university partners.
4. An on-campus program, which includes a graduate student mentor assigned to eachPosse; a PossePlus retreat, which involves up to 100 students from the larger studentbody each year; and ongoing weekly workshops. The program culminates with a Possegraduation that complements the university graduation.
Evaluation outcomes
The evaluation of Posse (Bowman and Gordon, 1998) consisted of comparing the 41 Possemembers at Vanderbilt University in 1997 with 41 randomly selected athletes at the college, and 41randomly selected students with similar SAT scores. The mean SAT score for the group of athletes wasabout 142 points higher than for the Posse group (1042 vs. 900), however the difference between theirmean GPAs was just 3.17 versus 2.93 for the Posse students. Compared to the randomly selected non-athletes, neither their SAT scores (922 vs. 900) nor their GPAs (2.97 vs. 2.93 for Posse) weresignificantly different. Thus, the Posse students, while not performing at exceptionally high levels, wereperforming comparably to other students at Vanderbilt whose backgrounds approximated their own, andimportantly, they were persisting at a very selective institution. The persistence rate for the 41 studentswas 92.7 percent compared to approximately 85 percent for other non-Posse comparison students. Itshould be noted that the Posse students were selected using very different criteria than those normallyemployed by the university, so the students’ persistence and survival at the university were a testament tothe viability of the Dynamic Assessment Process.
The program directors consider the peer support provided through team-building and thesupport of the mentor in the early years of college to be the key features of the program that contribute tostudents’ success once they have been selected. The preparatory activities during the senior year are animportant part of the program, but there has been no independent evaluation of their contribution to thesuccess of the program. While directors were unable to provide an estimate of the per-student costs of theprogram, citing a number of idiosyncratic expenses and funding relationships, however, this is clearly a“high end” program that can only afford to serve a small number of students.
Neighborhood Academic Initiative (NAI)
Program description
The Neighborhood Academic Initiative (NAI) program began in 1990 by the University ofSouthern California (USC) in an attempt to have a direct impact on access to higher education in its owncommunity. The program is limited to the area surrounding USC. Located in the central part of LosAngeles, this area is largely low income and most residents are either black or Hispanic. “Average”seventh grade students (mostly Bs and Cs) are selected into the program from one school in the

41
surrounding area based on two criteria: their stated willingness to learn; and a parent or guardian’swillingness to support the “scholar” by attending classes and meetings and ensuring that the student canattend all required activities. The program lasts the 6 years from 7th to 12th grades, and it is intensive.Students are bused every morning for 2 hours of math and English enrichment classes at USC, and bothstudents and parents meet on Saturdays for 4 hours of workshops. Students also receive tutoring twice aweek for an hour and a half, and have a counseling session on Friday mornings that deals both withcollege preparation activities and socioemotional issues. During the summer, students are enrolled inadditional classes. If they persist through the program, graduate, and meet minimum eligibility criteria,they are awarded a full-ride scholarship to the university, a selective, independent school whose tuition isabout $20,000 per year.
NAI’s mission statement includes the following language: “NAI provides multipleeducational opportunities for students and parents to gain an understanding of themselves, and to obtainthe skills that will enable them to assume a measure of control over the direction and quality of their lives.Students and parents are taught to believe in their limitless capacity to learn, to acquire the skillsnecessary to function in society. . . . .”(CHEPA, 1998, p.20). While the objective of the programostensibly is to support underrepresented students in gaining access to a 4-year college education, theunderlying principles of the program focus much more directly on community empowerment. There is astrong attempt in the program to draw faculty and staff from the local area and to integrate the localcommunity into the program. Bringing the community into the classroom is considered important inhelping students to develop strong identities in order to weather the challenges ahead.
Evaluation outcomes
To date, two cohorts of students have completed the program, having begun in the 7th grade.Of these entering students, 64 percent persisted through 6 years to graduation. Of those who graduated,over 60 percent went on to a 4-year research university—52 percent to USC—and 96 percent to someform of postsecondary education. In Tierney and Jun’s (1998) evaluation of the NAI, no comparison dataare provided, but in the high-risk neighborhoods and schools from which these students come, very fewstudents go on to 4-year universities. Even without these data, it would seem that the NAI students areperforming far above their peers in their own and similar neighborhoods. The evaluation does not reporton how these students fare once they are in the university.
NAI serves between 40 and 50 new students per year, with a total enrollment in the programof about 360 students. Not counting the scholarships, the program costs about $2,000 per studentannually, which is covered by the university and private foundation grants. Combined with the cost ofscholarships, NAI is both labor intensive and expensive and, as such, serves a relatively small number ofstudents. In fact, the program is so rigorous, requiring that students rise early and attend extra classesevery day, including Saturday, over a period of years, that one might conclude that the persistencedemonstrated in staying in such a program may be the most critical factor in student success.
A Better Chance (ABC)
Program description
A Better Chance is the oldest of the college access programs reviewed. It began in 1963 togive talented “minority” students a chance at a first-rate high school education outside of their ownenvirons. Most students in the early days of the program were placed in boarding schools and thereby

42
were separated not only from their local schools, but also from their families and local communities.Implicit in the design of the program is the notion that bright students from low-income communities willfare better when removed from their own settings and placed into highly enriched schools andcommunities. Over the years, more students have attended day schools and a few excellent public schools(where students typically live in a nearby ABC house with a resident supervisor), but evaluators haveconcluded that students did do better in private school settings (Griffin, 1990).
ABC is an independent nonprofit organization that has enjoyed financial support from manyof the major philanthropic organizations in the country, including the Ford Foundation, the RockefellerFoundation, the DeWitt Wallace Foundation, and the Sloan Foundation, in addition to federal support inits early years. Headquartered in Boston, it sends many of its students to prep schools in the Northeast.The 160 member schools that take ABC students typically accept about 300 students per year in theprogram.
ABC’s primary function is identifying talented students of color, usually from poorcommunities throughout the nation, who, once nominated by someone in their schools or by a member ofthe clergy, undergo a rigorous selection process including a battery of tests and extensive interview. Theprogram also accepts students who do not test well if they can demonstrate strong ability in math, science,and English through other means, and if they demonstrate a strong desire to achieve. Once identified andaccepted into the program, ABC matches students to member high schools that assume the costs of thestudents’ education. ABC provides a liaison at the schools, but it does not offer other supportive services.Although in the early years of the program a summer session was provided, there are now no special ABCcounselors, tutors, or mentors. Students are expected to make it on their own after a 3-day orientation,and the selection process takes into account that students will need to exhibit considerable self-confidenceand independence.
Evaluation outcomes
ABC has been evaluated several times over the years (Griffin, 1990; Perry and Kopperman,1973; Johnson and Prom, 1983), but evaluations have consisted largely of surveying alumni about theirexperiences and their success in postsecondary education. One of the few that have been done comparesthe rate of college graduation for ABC students to that of all black students. Of course, ABC students arenot typical, and so a comparison to other, typical students adds little to our understanding of whether, andhow, the program works to achieve its goals. Data on persistence rates of students in the program, that is,how many students who began the program as freshmen actually graduated with their class 4 years later,were not available. All evaluations, however, show that of those students who do graduate fromsecondary school, at least 96 percent go on to college, and of those, approximately 20 percent go to IvyLeague schools. Thus, for students at an ABC school, the academic future looks bright.
The latest evaluation of the program was conducted in 1990 by DMP Associates in Detroit,Michigan. Surveys were sent to 210 alumni who had previously agreed to participate in the study, and118 (56 percent) responded. A separate survey asking many of the same questions was sent to 1,114current students, 184 (16 percent) of whom responded. Notably, most respondents to both surveys werefemale. Their responses show that these respondents viewed the program as very effective in preparingthem academically for college. Virtually all of the respondents either had gone to college and received adegree or were intending to do so. However, among both alumni and current students, more than halfreported feelings of isolation and/or depression, and 42 percent of current students reported that they didnot like their school. On the other hand, almost all current students reported that they were engaged inmany activities at school and that they did not have grades below C.

43
The picture that emerges from the survey data—albeit based on small samples of students—is that students emerge from these schools equipped to go on to college and to at least survive thatexperience (most respondents reported that they had Bs in college). The alumni reported feeling gratefulfor the opportunity, and 98 percent said they would recommend it to a friend. But the majority of thestudents expressed feelings of isolation and depression and worry about meeting the standards of theschools (reported by 71 percent of respondents). It is difficult to know how different these students’feelings were from those of other adolescents striving to do well in school since no comparisons wereprovided.
It is also worth emphasizing that ABC attempts to affect the life course of individualstudents selected to participate, not the schools or communities from which they come. Its cost is high ona per-student basis, and in terms of numbers of students affected, its impact is small, although no doubtprofound for those individuals selected to participate.
Upward Bound
Program description
Upward Bound is a member of the TRIO family of programs supported by the U.S.Department of Education with the objective of increasing college-going rates of underrepresentedstudents. It targets students who have completed the eighth grade, whose family incomes are below 150percent of the poverty line, and/or who are potentially the first in their families to go to college. Studentsare usually recommended into the program by a counselor, and they are generally screened to excludethose with behavioral problems. Thus, most Upward Bound students are low-income minority studentswho have expressed a desire to go to college, but who lack the resources in their own homes andcommunities to support those aspirations.
Students may participate in Upward Bound for up to 4 years, through high schoolgraduation, but they can also quit the program at any time. Attrition is a major problem. Approximatelyone-third of the students who begin the program quit by the end of their first year, and only about one-third of students actually complete the program (that is, they are still enrolled in the program in May oftheir senior year). The primary reason that students give for not completing is that they have taken a job.Not surprisingly, students who stay in the program to completion are much more likely to go on to college(85 percent).
Upward Bound provides a host of services to the 42,000 students it serves in 566 programsacross the nation. A key aspect of the program is the 6-week summer program hosted by a collegecampus where students receive intensive pre-college academic preparation. Ninety percent of the UpwardBound programs include a residential component to the summer program designed to simulate an actualcollege experience. Extra academic support is also provided in the form of tutoring and academic coursesusually held on Saturdays or after school to supplement the school’s academic program, and academic,personal, and career/college counseling services are also provided. Most programs also expose studentsto cultural events, and financial aid counseling is offered. While there is considerable variability inimplementation of programs, all are expected to offer the key components.

44
Evaluation outcomes
Upward Bound has been evaluated several times (Burkheimer et al., 1976; Burkheimer,Riccobono, and Wisenbaker, 1979; Myers and Schirm, 1997, 1999). Earlier evaluations comparedUpward Bound students to other, similar students in their schools and focused on high school retentionand the program’s effectiveness in increasing college-going rates. In both of their studies, Burkheimerand colleagues found that while Upward Bound students were retained in high school at higher rates thantheir comparisons in the 10th and 11th grades, there was no significant difference by 12th grade. TheUpward Bound students, however, were significantly more likely to enroll in college. An additionalimportant finding was that the longer students remained in the program, the more likely they were tobenefit from it and to go on to college.
The most recent evaluation of Upward Bound conducted by Myers and Schirm (1999) wasmuch more sophisticated than earlier studies, and compared almost 1,500 Upward Bound students withabout 1,200 randomly selected control students from 67 programs across the country. The evaluation alsotracked students’ length of tenure in the program. While program attrition remained a major problem,Myers and Schirm also found that the longer a student stayed in the program, the more likely the studentwas to show significant benefits, including going on to college. The primary immediate impact ofUpward Bound was on increased numbers of social science and math credits earned in high school. It didnot have a significant impact on in-school activities, participation in extracurricular activities, GPA, highschool graduation, or college attendance. The researchers found some tentative evidence that the programmay have an impact on college performance, with a small portion of the sample earning more credits in 4-year colleges, but the sample was too small and the students’ duration in the program too short to drawfirm conclusions. An important additional finding was that whites, Hispanics, males, and lowerperforming students with initially lower aspirations were more likely to benefit from the program thanblacks, females, higher performing students, and those with higher initial aspirations. Myers and Schirmestimate that the per-student annual cost of Upward Bound is about $4,200.
Evaluators concluded that two important ways to improve the program would be to stemattrition and to enroll more high-risk students of the kind who seem to benefit most from the program.The latter recommendation seems reasonable; however, one cannot assume that the program dynamicswould be the same if the mix of students were to change significantly. One might find that the presenceof a significant number of lower risk students in the program is an important element in its effectivenesssince these students provide important role models and probably are less labor intensive, freeing up timefor program staff to devote to higher risk students.
High School Programs That Serve Students by Classroom
Three high school programs, AVID, Puente, and College Pathways, provide the services inthe context of a classroom cohort. Students are selected to enter into a special class where the core of theprogram is administered and a part of the intervention is the interaction of students within this classroomcontext. AVID and Puente offer a daily class, beginning in the freshman year, where students form acohort for at least 2 years. College Pathways goes into English classrooms in the sophomore year andrecruits participants who will meet as a class on a weekly basis. An important difference between theclassroom-based programs and the individual programs is that in the former there is more of an emphasisin working with the whole group, and the group is viewed as the target of intervention. In two of theprograms, special attention is paid to group dynamics both in and outside the classroom.

45
Advancement via Individual Determination (AVID)
Program description
In some ways the Advancement via Individual Determination program is misnamed. Theuse of the word “individual” in the program title is at odds with its philosophy, which emphasizes “socialscaffolding,” defined by its authors as “the engineering of instructional tasks so that students developtheir own competencies through their interactions with more capable peers or experts” (Mehan et al.,1996, p. 78), and the building of a community of peers to support students’ aspirations. The programbegan in 1980 in one school in San Diego, California, and since that time has grown to more than 500sites in eight states and abroad. Students eligible for AVID are high school students from low-income,ethnic, or linguistic minorities who have average to high achievement test scores, but C average grades.Students are selected by program coordinators, usually on the recommendation of counselors, and parentsmust sign a contract and agree to support their child in the program.
The key feature of the AVID program is what it refers to as “untracking,” or placingunderachieving students who would otherwise be in the general or vocational track into collegepreparatory classes. In addition, the students are provided with extensive support services. They meetdaily in an AVID class with a trained AVID teacher who oversees a specific curriculum. Two days aweek, students meet in small groups for academic tutoring. Two other days are devoted to writingdevelopment, note-taking, test-taking, and study strategies. Finally, 1 day a week is set aside for guestspeakers, field trips, and other motivational activities. Sometimes speakers focus on informationnecessary to prepare for college. AVID also provides “public markers” for the students so that theyidentify with the program and each other—AVID students carry special notebooks with the AVID logo,eat lunch and socialize in the AVID room, and participate in a host of AVID-only activities.
Evaluation outcomes
The AVID program evaluation in 1996 (Mehan et al.) focused on 248 of 1,053 students whoparticipated in the program for 3 years and 146 of 288 students who had participated for 1 year or less ateight San Diego high schools between 1990 and 1992. Selection of students was a function of who couldbe located at the time of the study. It is not known to what extent there were biases in the samples. It isalso important to note that AVID does not keep track of the number of students who complete theprogram compared to those who begin it, and thus, no overall attrition data are reported.
Of the 248 students who completed the AVID program and were in the study sample, 48percent reported attending a 4-year college immediately after high school, 40 percent attended a 2-yearcollege, and 12 percent “were doing other things.” The researchers note that these figures comparefavorably with the data for San Diego public schools as whole, where 37 percent of students in the districtwent on to 4-year colleges. They also found that the AVID completers compared favorably to thestudents who only participated for 1 year or less; 34 percent of these students went on to 4-year colleges.
AVID appeared to be particularly effective with Hispanic and black students. For example,whereas only 25 percent of Hispanic students in the San Diego schools went on to 4-year colleges in1992, 43 percent of AVID completers did so. Among black students, 55 percent of AVID studentsenrolled in 4-year colleges versus 38 percent for all other black students in the district. As with otherstudies reported here, evaluators found that the longer students stayed in the program, the better theiroutcomes. Importantly, the researchers also found that students from the lowest income stratum (less than

46
$20,000 annual income) enrolled in 4-year colleges at equal or higher rates than students from higherincome strata (between $20,000 and $65,000), and AVID students from homes where neither parent had acollege education were actually more likely to enroll in a 4-year college than those AVID students whoseparents were college graduates. Thus, like Upward Bound, AVID appears to have its greatest effects onthe most at-risk students.
Mehan et al. (1996) also attempted to interview students 1 and 2 years into college in orderto determine if the program had an effect on college persistence. The researchers cautioned that theirsamples were too small to draw firm conclusions, but their findings did raise concerns. Interviewing 168students who had been out of high school for 1 year and 46 who had been out for 2 years, they found verylittle upward mobility. That is, few students transferred from 2-year to 4-year colleges or began collegeduring this period. About 7 percent transferred from 4-year to 2-year colleges, and 11 percent of thesestudents who had enrolled in 4-year colleges in 1992 had dropped out.
While the AVID study provides tentative evidence that underachieving students withaverage or above average achievement test scores can be helped to go on to college at much higher rates,the lack of true controls and factors associated with the selection of AVID students suggest that it isimportant to exercise caution in interpretation of the data (Slavin and Fashola, 1998). Moreover,achievement data including GPAs are not reported, so it is difficult to know to what extent students’actual achievement had been improved by the program. On the other hand, AVID reports that the annualcosts per student are only about $625, a relatively modest sum for the array of services provided. Theresearchers attributed much of the impact of the program to the transmission of “cultural capital” that itprovided and the supportive networks of faculty and peers who helped students to redefine themselves asachievers.
Puente
Program description
The high school Puente project was an outgrowth of a highly successful community collegeprogram that served 38 California colleges, which was expanded in 1993 and adapted to 18 high schools.Puente serves a largely Hispanic clientele and has three major components: a 2-year college preparatoryEnglish class, a Puente counselor, and a mentoring program. The English class, taught by a Puente-trained English teacher, integrates community-based writing, portfolio assessment, and Hispanic-authoredliterature into the core college preparatory curriculum. The Puente counselor works closely with studentsand parents to ensure that students are enrolled in college preparatory courses, that they are making goodprogress, and that parents have the information they need to support their children’s academic success. ACommunity Mentor Liaison (CML) recruits and trains successful, college-educated mentors from thecommunity. Both the Puente counselor and the mentor are usually Hispanic, which is seen as importantbecause these individuals are to serve as models of accomplishment as well as to share commonexperiences with students and families in both English and Spanish as necessary.
Puente accepts ninth grade students along a wide continuum of achievement. Students areusually selected based on recommendations of eighth grade counselors or teachers, and the mostimportant criterion for acceptance is a desire to improve one’s academic standing and go on to college. Atypical class of 30 Puente students is composed of equal proportions of low achievers (1.4 to 2.2 GPA),moderate achievers (2.3 to 2.9 and 3.0 to 3.5 GPA), and high achievers (above 3.5 GPA). Studentsshould not test lower than 2 years below grade level in reading in order to be able to succeed in a rigorouscollege preparatory curriculum. Parents are interviewed as a part of the selection process, and they must

47
agree to support their children in the program and to attend workshops and functions designed to includethem in their children’s education. Because the Puente class substitutes for the students’ regular Englishclass and thus students are programmed into it, attrition from Puente is quite low: approximately 88percent of Puente students are still in the program at the point of graduation. Most attrition from theprogram occurs when students move away or drop out of school altogether.
Evaluation outcomes
The Puente program was evaluated in 1998 by Gándara et al. using several samples ofstudents. Data were collected on more than 900 Puente students and 900 non-Puente students over 4years in all four grades of high school on aspirations, attitudes toward school and achievement, andpreparation for college, and on 75 Puente students from three schools who were matched with 75 non-Puente students from the same schools on age, ethnicity, sex, eighth grade GPA, and reading scores. Thissample was followed longitudinally for the 4 years of high school and used to test for differences in highschool GPA, college preparatory course-taking, and college matriculation that could be attributed toparticipation in the program. Additionally, ethnographies were conducted on a sample of 27 students inthree high schools to help interpret the quantitative data.
Evaluators found that Puente students were significantly better prepared to enter college thantheir non-Puente peers with respect to students’ own assessment of their knowledge of what was neededto apply successfully to college and their record of admissions test-taking. Puente students were alsosignificantly more likely to place a high value on going to college and to be willing to give up otherimportant things in their lives in order to achieve this goal. They were also more likely to want to beknown as a “good student” by others, a finding that was heartening in that it combated the problem ofpeer pressure to not “act white” by excelling in school. While the pattern of attitudinal measures washeavily weighted in favor of Puente participants both cross-sectionally and longitudinally over the 4years, because pre-test data were not collected on the samples, it is impossible to know to what extentselection factors may have had a role in producing these differences. However, longitudinal data suggestthat selection was almost certainly not a factor in measures of college preparation.
With respect to academic measures, there were no significant differences between Puentestudents and their non-Puente controls on high school retention, GPA, or course-taking by the end of 12thgrade. However, there were some differences in college matriculation. Forty-three percent of Puentestudents went on to 4-year colleges, compared to just 24 percent of the controls, and 41 percent of Puentestudents went to 2-year colleges, compared to 51 percent of non-Puente controls. Thus, a total of 84percent of Puente students went to either a 2- or 4-year college compared to 75 percent of non-Puentestudents. Because the evaluation study ended in the same year that the students entered college, theevaluators did not collect data on students’ persistence in college and longer term outcomes remainunknown.
The Puente evaluators concluded that the program had a real impact on students’ attitudes,aspirations, and preparation for going to college, as well as their rate of college enrollment. Noting thatnon-Puente students with the same academic profiles did not apply to or gain acceptance to colleges innearly equivalent numbers, the Puente evaluators concluded that the program helped students to betterexploit their potential. They attributed this in large part to the network of supportive adults and peers inthe students’ lives, and especially to their counselors. Fifty-eight percent of the more than 900 Puentestudents reported that their counselors influenced their decision making about going to college comparedto just 15 percent of a similar number of non-Puente classmates. Survey responses from high schoolprincipals indicate that parent involvement in the Puente program is very high, and Puente studentsthemselves report significantly higher involvement in their schooling by their parents than non-Puente

48
Hispanics, white, and Asian students. This is particularly significant given the widespread finding in theliterature that Hispanic parents tend to be less overtly involved in their children’s schooling thannonminority parents. Evaluators speculated that the high level of parental involvement was related to thefact that the program actively sought to incorporate the parents’ culture and language into all parentfunctions, and that counselors and mentors were able to communicate with parents in their own languageand encourage them to become involved in their children’s schooling.
The Puente program reports its annual per student costs to be about $500, making it one ofthe lowest cost programs reviewed.
College Pathways
Program description
The College Pathways program is a project of the Fulfillment Fund that was incorporated inLos Angeles, California, to work with disadvantaged youth within the school district in 1977. It servesstudents in seven Los Angeles Unified School District high schools. The program is based on five goals:love of learning, increased self-expectation, realized achievement, college matriculation, and communityservice. The program targets historically underrepresented students who are potentially the first in theirfamilies to attend college. Students are selected into the College Pathways class based on a belief thatthey can profit from the program and are neither “good” nor “bad” enough to warrant special attentionfrom other sources. Parents are not required to support their children in the program in order for them tobe admitted. Some of the students in the program would otherwise be eligible for higher education butmight not go because of lack of information and appropriate preparation.
Students in the College Pathways 10th grade English classes are visited each week byprogram staff or volunteers, who follow a curriculum that involves academic support in reading, writing,public speaking, and critical thinking. Information is provided about college admissions, financial aid,and career exploration, and students are required to visit at least two colleges each year. College visits,including an occasional overnight, are included in the program. Similar activities are provided in thejunior and senior years, but students meet only once every 2 weeks at this point, and they are called out ofregular classes to attend the College Pathways meetings. According to the evaluators of the program,many students do not attend these meetings. A separate mentoring program is also attached to theprogram; however, little information was available on how this operated.
An advantage of the program at the 10th grade level is that it takes place in the students’regular classrooms, thereby reducing the problem of attrition at this grade level. However, sinceattendance is voluntary in the 11th and 12th grades, there is a problem of attrition at this point.
Evaluation outcomes
While the program has not been formally evaluated, it has been studied by the Center forHigher Education Policy Analysis (CHEPA). CHEPA (1998) investigated the claims that CollegePathways students attended 4-year colleges in substantially higher percentages than other similar studentsin the district and the state (about 30 percent versus 18 percent and 14 percent, respectively), but founddifficulty confirming the findings because of an inadequate record-keeping system. Nonetheless, it wasclear that the program was having an impact on students’ aspirations for postsecondary education. The

49
primary difficulty with the program, however, appeared to be a significant drop-off in program attendanceafter the 10th grade such that only between 29 percent and 44 percent of original participants appeared tobe in the program at the point of graduation. However, of those retained, all were reported to go on tocollege. Moreover, classroom observations did suggest that students were being exposed to material andopportunities that would not have been available to them under ordinary circumstances, and this almostcertainly had an impact on some students’ decisions to pursue postsecondary education. The programcosts of about $980 per student annually place it at the lower end of the student-centered programs.
K-12 Programs by Classroom or Community
While most college preparation programs reviewed focused on the secondary school years,and especially high school, a few began earlier. I Have a Dream was one such program.
I Have a Dream (IHAD)
Program description
The I Have a Dream Foundation was established in 1986 to launch local programs based onthe experience of Public School 121 in New York City, where Eugene Lang challenged the sixth gradersin 1981 to complete high school with the promise that he would give each graduate a scholarship tocollege. Today there are more than 160 programs serving 12,000 student in 60 cities, and a great deal hasbeen written about the program. The personal and financial commitment to see students through thedifficult years of middle school and high school, combined with the promise of a tangible means forgetting to college if they successfully navigate that system, has captured the public’s imagination and ledsome to conclude it is “the most exciting program” around (Levine and Nidiffer, 1996). Each programmust follow guidelines set out by the foundation, but there is considerable latitude to vary by site.Sponsors may be individuals, groups, or corporations, and the project site can be at a school or in thecommunity. Particular elements of the program, however, must be present, that is, college scholarships,counseling, mentoring, and tutoring. Students are to be adopted as a class or group, preferably in the 3rdgrade, or when they are 8 or 9 years old, but it can be at any point in elementary school, and the sponsorsare to maintain the commitment to continue working with the students through 12th grade. Thus, IHADis one of the few programs that monitors students through several school transitions. It is also one of thefew programs that directly address the costs of a college education.
Evaluation outcomes
While a great deal has been written in the popular press about the IHAD program, fewattempts have been made to carefully evaluate it. In one, Kahne and Bailey (1997), conducted anextremely careful and thoughtful study of two Chicago area IHAD sites. They studied two classes for 2 ½years, beginning when the students were in the 11th grade and following them through high schoolgraduation. The classes were located in very low-income, high-risk neighborhoods, and the students hadbegun the program when they were in the sixth grade. Almost all students were black or Hispanic. Thetwo sites were selected because they were “models” with respect to implementation and record-keeping.They were models in other ways as well. Unlike all other sites in the Chicago area, only these two hadmaintained the same project director for the entire duration of the program, and each had also benefitedfrom extensive additional staff, including Americorps volunteers and Princeton Project 55 programinterns. Thus, they had enjoyed almost unparalleled stability and extraordinary staff resources.

50
Evaluators selected the classes immediately preceding these classes in each of the twoschools as controls, so that the control students came from the same neighborhoods and schools anddiffered in age only by 1 year. The high school graduation rates of the IHAD participants was 76 percentat one of the sites and 69 percent at the other, more than twice the graduation rates for the control schools(37 percent and 34 percent, respectively) (Kahne and Bailey, 1997). It was difficult to make comparisonsfor college enrollment because detailed followup data were not available for the controls. The evaluatorscompared the college-going rates of the IHAD students with the averages for all black and Hispanicstudents in the Chicago Public Schools. Given the extremely low socioeconomic profiles of the IHADschools, it is likely that these comparisons would have been biased in favor of the comparison students.Nonetheless, the overall college enrollment rate for IHAD participants was roughly three times that of thecomparisons. (Data were not provided on college persistence.) Clearly, these programs were extremelysuccessful in meeting their goals of high school graduation and college enrollment. The evaluators soughtto understand what elements of the program appeared to be responsible for this success, and which couldbe successfully replicated for policy development purposes.
Kahne and Bailey found that the essential element that had contributed to the successfuloutcomes in the IHAD program as it was implemented in these two sites was the development of strongtrusting relationships among the Project Coordinator (PC), staff, sponsors, and the students. Theserelationships allowed for the transmission of social capital that aided the students in understanding theiroptions, increasing their aspirations, and achieving their goals. Because the role of the PC is critical tothe success of the enterprise, these two sites were at a significant advantage by having highly competent,long-term PCs. Such continuity was seen as an important factor in students’ maintaining contact with theprogram and even influencing them to return when they had taken a leave for a period of time.
Kahne and Bailey also noted, however, that the relationships were not universally successfuland depended to some extent on the match of personality, interests, sex, and ethnicity. For example,sometimes white sponsors, with little personal understanding of the students’ circumstances, found itdifficult to create a meaningful relationship and maintained their distance from the students whilecontinuing to provide financial support. In contrast, the Princeton interns and Americorps volunteerswere sometimes able to form relationships with students with whom the PC had been unsuccessful.
Importantly, more than half of the student participants had been placed in parochial schoolsas part of the IHAD program. Recognizing the limited ability of the Chicago public schools to provideconsistent monitoring and personal relationships with students, the program worked with families toremove the most challenging students from the public schools. In a review of other Chicago area sites,the evaluators found that although this is one strategy used by IHAD programs, it was not nearly asprevalent a practice in other Chicago area programs. It is thus difficult to separate the independent effectsof IHAD activities from those of the parochial schools in which the students were enrolled. It wasnotable, however, that 4-year versus 2-year college attendance was up to more than four times higher forstudents attending parochial schools compared to those who had stayed in the Chicago public schools.
IHAD does not have a particular role for parents, because one philosophy of the program isthat students should not be excluded because their parents are unwilling to participate. While noparticular demands are placed on parents, neither is there a strong attempt to involve parents or to seektheir advice. The evaluators worried that the lack of contact with parents could also undermine their role,sending the unintentional message that parental opinions, knowledge, and values were not important. Theevaluators did not uncover evidence from students that their relationship with their parents had beeneroded, but some students raised questions about the program’s failure to respect parents’ values insensitive issues such as birth control.

51
A typical IHAD program may cost between $1,000 and $3,000 per year per student, notcounting the cost of college scholarships. Costs vary depending on the extent to which students arererouted into private or parochial schools. (Both private schools and parents also made substantialcontributions to the private schooling costs, which are not considered in these figures.) It is alsoimportant to note that the other Chicago IHAD programs had neither the same level of resources as theprograms studied, including the additional personnel, nor could they boast the impressive outcomes forthese programs.
Kahne and Bailey (1997) conclude that IHAD has the potential to create exceptionaloutcomes for students at high risk for school failure, largely due to the profound relationships of trust thatcan be developed within the context of the program over a long period of time. However, staff turnoverwas common in most programs, with PCs averaging 2 years in this very demanding position. The PC’scritical role in developing relationships with the students, the unique set of skills required of the PC, andthe huge demands of the job (students described contacting the PCs at all hours of the night to have themintervene in family and personal crises), can be a weakness in the program. The evaluators alsoacknowledge that by seeking school placements outside of the public schools, and relying to a largeextent on Catholic schools to help provide the social capital to support the program’s students, thestructures of public schooling are left untouched. Thus, the program can be extremely effective for smallnumbers of students, but may not be capable of creating change in the structures and environments thatplace students at risk in the first place, or that fail to aid them to overcome their disadvantages.
Kahne and Bailey report that it may be best to view the expansion of efforts such as IHADas “scaling down” from large bureaucratic programs that exist in schools rather than “scaling up,” whichmeans that relatively few students can be touched by such a program. It is the personal, consistent contactwith a caring and knowledgeable adult who is skillful in connecting with the student that appears to be atthe heart of the program’s success—an element that depends to a great extent on locating and retaining arelatively unique individual in the role of PC—and one that by its nature, cannot be created on a largescale. Unfortunately, success may also depend on removing students from the schools and environmentsthat the program cannot fix.
K-12 Programs That Serve Students by Schools
Very few programs took a systemic approach to stimulating college enrollment amongunderrepresented students. As the exhibits show, most target individual students at the secondary or highschool level; a few reach down into the lower grades, but the focus remains mostly on individuals orsmall groups of students. Two of the programs studied, GE College Bound and Project GRAD, haveattempted whole-school or systemwide reform.
GE's College Bound Program
Program description
The College Bound program was launched in 1989 by the GE Fund as an ambitious, 10-year,$20 million effort to double or significantly increase the college-going rate in selected high schools. Theprogram, targeted to low-income and inner-city communities, has made 5-year grants of between$250,000 and $1 million to 19 high schools in 17 communities. The College Bound approach is to allowschools and communities to devise strategies that work best for them, but that are geared toward doubling(or significantly increasing) the college-going rate for the whole school or for a substantial targeted

52
population within the school. The major requirements for the competitive grants are that the schoolsagree to make necessary changes in curriculum and practice that will operate to raise the achievement ofstudents in the schools, and that they involve GE personnel in the design of the program and, to the extentpossible, as volunteers working within it. Additionally, schools must propose plans for professionaldevelopment, curricular modification, proposed structural changes (e.g., block scheduling), and studentenrichment activities. Local communities are given a great deal of flexibility to design a reform strategy.
Most programs work entirely within the targeted high school, but some involve feedermiddle and elementary schools as well. Some program components are found at nearly all the sites, suchas field trips to colleges and cultural sites, SAT preparation courses, homework assistance, collegecounseling, and summer academic enrichment programs. However, each school has developed its ownapproach and emphases, and different schools serve quite distinct populations. Most program sites areeast of Mississippi, but one is in New Mexico and one is in Texas.
Evaluation outcomes
The GE College Bound program has been recently evaluated by Bailis et al. (1999). Theevaluators had to base their analyses on data that had been collected by each school in the program, andthese data were not always consistent or adequate. They also found it impossible to identify appropriatecontrol schools or groups of students for each of the varied experiments, and for comparison, they chosethe schools' baseline college-going rates and national samples. Given these limitations, the findings forthe study are promising.
Four factors contributed to sustainability of programs over time: taking a whole-school(versus a targeted population) approach; the presence of one or more strong program champions (oftenoffseting the high turnover of school administrators); ongoing relationships with the local GE partner; andsupplemental grants from GE (which helped to deepen the school's investment in the program). Theresearchers report that college-going was increased significantly at 7 of the 10 programs for which therewere sufficient data to draw conclusions, and the effects were greatest for those schools where the initialcollege-going rate was lowest. College-going rates more than doubled at four of the five sites with initialrates below 50 percent. In fact, College Bound graduates were more likely to attend college thancomparable students nationally (76 percent of College Bound graduates versus 71 percent of all studentsnationally). The differences in college-going rates were greatest for those students whose parents hadlittle or no college education.
The study by Bailis et al. was unique among those reviewed in that it attempted to answerthe question of whether the program had longer term effects on college retention and completion. Theevaluators interviewed 361 graduates from two different program cohorts by telephone and found that 87percent of College Bound students completed their first year of college, compared to just 70 percentnationally. Moreover, only 28 percent of College Bound students had dropped out of college without adegree, compared to 37 percent nationally. It is not clear, however, which program features might haveled to these outcomes, nor how comparable these students were with the national sample.
While the GE evaluation was challenged in some ways by the diversity of program types andsites that it attempted to study, it also had a unique advantage in that it was able to look somewhatdispassionately at different program features across sites because there was no particular program modelto which all participants were wedded. That allowed the evaluators to observe the factors that operated tosustain healthy programs.

53
Program evaluators chose not to cite per-pupil costs associated with the program because ofthe difficulty in specifying who was a participant in what were largely whole-school initiatives. It isimportant to note, however, that while the investment in the schools was large, it was spread over manyyears and many students.
In sum, the GE evaluation appears to point to several particularly important findings: (1)schools can improve the preparation they provide for underrepresented students if given sufficient andsustained resources and support; (2) allowing schools to adopt strategies, within a common broadframework, that work for their local context is a viable approach to improving college access; (3)students who come from homes with the lowest educational levels may be the most advantaged by theseprograms; (4) effective college access programs may have longer term effects on college retention andgraduation; and (5) utilizing volunteers for the purpose of mentoring is a complex and difficultundertaking.
Project GRAD
Program description
Project GRAD assumes that significant numbers of students cannot be moved toward highschool graduation and college enrollment unless the schools that educate them are changed, starting at theearliest grades. Project GRAD was first initiated in 1993-94 in the Houston Independent School Districtto improve the instructional culture and effectiveness of the school system in dealing with at-risk students.It began with one nine-school feeder system and has subsequently been installed in two more feedersystems. The program grew out of the Tenneco Presidential Scholarship Program that provided collegescholarships for Davis High School graduates. Recognizing that challenging students in high school tograduate and go on to college was too late to change the fortunes of many at-risk youth, the Houstondistrict, together with a retired CEO of a Fortune 500 company and other individuals, agencies, andbusinesses, set out to rethink the education that these children were receiving from the time they firstentered the system.
Project GRAD’s philosophy is that educational failure can be prevented through a strongprimary curriculum that builds students’ self-discipline and confidence while stimulating a love forlearning. By working with a feeder pattern of schools, some of the problems of student mobility areaddressed as well. Even if students change schools, as long as they remain in the same cluster of highschool feeder schools (which research shows that many do), they will continue to be monitored in theprogram. What is unique about the Project GRAD program is that it is systemic, following students fromtheir first days in school into high school, and that the program developers sought out the best researchedmodels they could find and wove them into a total reform package designed to meets the needs of theHouston schools.
The four areas that the program targets for reform are math, reading, instructionalenvironment, and parent involvement. Thus, MOVE IT Math and the University of Chicago School MathProgram (UCSMP) address mathematics instruction from the first years through high school; Success forAll (SFA) and Cooperative Integrated Reading & Composition (CIRC) are focused on reading andwriting development from kindergarten or first grade through middle school; Consistency Management &Cooperative Discipline (CMCD) is a classroom management and self-discipline program that isimplemented throughout the grades, including high school, to address issues of classroom learningenvironment and school climate; and the Communities in Schools (CIS) program provides for the social

54
service needs of pupils and their families throughout the grades, and organizes parent involvementactivities. Finally, the Scholarship program is designed to attack motivational issues and make it possiblefor all students who qualify to go on to college. Each of these programs has a considerable body ofliterature behind it and uses research-based methods.
Another important aspect of the program has been the extensive staff development providedby a number of the program developers (SFA, CIRC, CMCD) that also entails up to six followup sessionsduring the school year. Teachers expressed a great deal of satisfaction with staff development, andrequested more. A critique of Project GRAD made by some researchers, however, is that the programdoes not incorporate a community voice sufficiently into its plan, and thus it may lack sensitivity to somecultural features of the communities it serves.
Evaluation outcomes
Project GRAD pays a great deal of attention to school climate as a precursor to studentachievement. In the evaluation conducted by Opuni (1998), the Comprehensive Assessment of SchoolEnvironments (CASE) instrument was used to measure and monitor a number of factors that contribute topositive or negative learning environments in schools, including community relations, schooladministration, and student-student and student-teacher relations. Opuni found that in both 1995-96 and1997-98, all schools fell into the normal range on these dimensions, considered to be quite a feat in itselfbecause that is atypical for schools serving at-risk urban youngsters. Unfortunately, pre-Project GRADdata had not been collected, so it is not possible to know to what extent the program was responsible forthese fairly positive outcomes. Both pre-test and post-test data were collected, however, on teachers’perceptions of similar factors in a survey of project impact on the schools. With 93 percent of teachersresponding in the first cluster of feeder schools, the findings suggest that there has been significantimprovement across all dimensions of school climate, including teachers’ expectations of students.Moreover, the increased level of satisfaction among teachers bodes well for a decrease in teachermobility.
With respect to student discipline, referrals to the principal’s office across the feederelementary schools declined by 74 percent since the inception of the program in 1994-95. Studentachievement is also on the upswing. Across all cohorts of students in the original feeder elementaryschool cluster, as well as in the 10th grade at the high school, Project GRAD students are outperformingtheir peers in comparison schools in math and, in some cases, in reading on the Texas Assessment ofAcademic Skills (TAAS) test.
Project GRAD has found that the longer the students stay in the program, the higher theyachieve above grade-level expectations. Thus, intensity of exposure to the program appears to have aneffect on outcomes. However, Project GRAD schools have a serious problem of both student and teachermobility, such that it was impossible to draw conclusions from some reading tests administered becausenot enough students remained in the same schools to allow for sufficient sample sizes. At the high schoollevel, the numbers of graduating seniors has almost doubled, and four times as many students now go onto college compared to the pre-1988 graduates (the year that the $1,000 annual scholarship becameavailable).
Project GRAD is a large-scale effort to reform Houston’s schools and to provide everystudent with a greater opportunity to learn. It involves research-based instructional reforms and addressesmany of the shortcomings of low-income, inner-city schools. Although it is relatively new, it appears tobe creating important changes in school climate and some student achievement indicators. Nonetheless,there are still many problems to confront. Student mobility is high, and no program can have a significant

55
impact when students are not exposed to it consistently and over a sufficient period of time. Most of theresources of Project GRAD (apart from the scholarships) are front-loaded into the elementary and middleschools, with the hope that by strengthening students’ skills and attitudes early, less extensiveintervention will be necessary later. However, we have seen that students in at-risk environments canremain vulnerable throughout their schooling, and programs that provide one-on-one monitoring of theprogress toward graduation and college enrollment for adolescents can also capture students who wouldotherwise be lost to the system. Project GRAD stops short of this kind of intervention at the high schoollevel.
Project GRAD does not report per-student costs of the program, although they do note thatover $10 million has been raised for the program from a large number of private sponsors. With perhaps25,000 to 30,000 students now affected by the program, the actual per-student cost is probably relativelylow when compared to programs that focus on individual students. Nonetheless, it is an endeavor that hasrequired significant private funding to implement.
Statewide Programs Serving All (Underrepresented) Students
Both federal and state governments support various early intervention programs to increaseaccess to higher education for underrepresented students. The greatest investment by the federalgovernment has been in the TRIO programs, of which Upward Bound (reviewed earlier) is the largest.While these programs are funded by the federal government, they are administered locally, and thereforeeach differs somewhat according to local circumstances. Legislation was passed in 1992 establishing theNational Early Intervention Scholarship and Partnership Program (NEISP), which set out matching fundsfor states that agree to provide both scholarship funding and support services for underrepresentedstudents. Total appropriations in 1998 were only $3.6 million. Nine states were participating in theNEISP program in 1998. The most recent reauthorization of the Higher Education Act in October 1998included a $120 million allocation for FY1999 for a new program, Gaining Early Awareness andReadiness for Undergraduate Programs (GEAR UP), which supercedes NEISP. Matching funds areavailable to both states and educational consortia. The conditions for participation are essentially thesame as for the NEISP program, with minor modifications. Because GEAR UP is new, little is yet knownabout how it is faring. Moreover, because education is largely left up to the individual states, there is nofederal program that could be evaluated as a strictly federal enterprise. There are, however, numerousstatewide initiatives.
Perna and Swail (1998) identified 15 states with active early intervention programs to helpunderrepresented students gain access to college. While there are others, most do not provide evaluationdata that allow for an assessment of their effectiveness. While states may support programs that fit intoother categories, such as high school programs that serve individual students, the statewide programs tendto be unique in that they attempt to impose strategies that have an overall impact. Three such programs—Florida’s College Reach Out Program, Indiana’s Career and Postsecondary Advancement Center/ 21st
Century Scholars, and Minnestota’s Postsecondary Enrollment Options Program—represent quitedifferent strategies and have been evaluated for their effectiveness.

56
Florida’s College Reach Out Program (CROP)
Program description
The College Reach Out Program is a statewide program designed to strengthen theeducational motivation and preparation of low-income, educationally disadvantaged students in grades 6through 12 who “otherwise could be unlikely to seek admission to a community college, state universityor independent postsecondary institution without special support and recruitment efforts” (Section 240.61(1) Florida Statutes). The program recruits the students and provides them with academic enrichmentactivities and career and personal counseling.
Forty-six of 67 Florida counties, with approximately 6,200 students in grades 6 to 12,participated in CROP in 1995-96. The overwhelming majority of students served were black (78percent), and the remaining small percentages were white, Hispanic, and Asian. The highest percentagesof students participated in the 7th, 8th, and 11th grades, with an average of 56 percent of studentsreturning to the program each year. Each local program differed in its mix of program activities;however, grants are competitive and programs must present a comprehensive package of supportelements, including academic support and college readiness components, in order to obtain funding. Thecost of the program in 1995-96 was reported to be $365 per student.
Evaluation outcomes
CROP was evaluated by Florida’s Postsecondary Education Planning Commission (PEPC)in 1998. The study is somewhat unique in that it attempted to evaluate the program from severalperspectives: it compared the 1995-96 CROP high school graduates with a random group of non-CROPgraduates (CROP students are not representative of all Florida students) for postsecondary choices; itcompared the 1991-92 CROP graduates with a random group of non-CROP graduates for postsecondaryoutcomes in 1995-96; and it investigated the characteristics of the most successful CROP programs todetermine which program features appeared to be associated with successful outcomes.
The 1991-92 cohort of CROP students differed little from the non-CROP comparisonstudents with respect to enrollment in postsecondary education (52 percent of CROP versus 49 percent ofnon-CROP), and 78 percent of both groups went to community colleges first. About half of the studentswho completed community college continued on to a 4-year college. The percentage of studentscompleting degrees within 5 years was nearly identical—only 6 percent of both groups had received anassociate’s degree and 3 percent a bachelor’s degree. Twenty-seven percent of CROP students and 25percent of non-CROP students were still enrolled in college 5 years later. Although CROP students weredisproportionately low income and educationally disadvantaged, they performed similarly to the non-CROP students, which suggests that the program may have had the effect of leveling the playing field forthe students in the program.
The 1995-96 cohort of CROP high school graduates, however, actually outperformed itsrandom comparisons with respect to enrollment in postsecondary institutions (51 percent versus 43percent). Of those CROP students continuing their education, 36 percent enrolled in 4-year institutionscompared to only 29 percent of the non-CROP students. Of these students, 71 percent of CROP studentsand 78 percent of non-CROP students had a GPA of 2.0 or better in their freshman year. Fifty-threepercent of CROP students and only 39 percent of non-CROP comparisons were required to take remedialcourses in core subjects in college. These outcomes were especially noteworthy since criteria for

57
participation had been made more stringent by 1995-96, and 79 percent of participating CROP studentswere both economically and educationally disadvantaged. This fact was evident in the 10th gradecomparisons of reading scores in which the non-CROP students significantly outperformed the CROPstudents. For both the 1991-92 and 1995-96 cohort comparisons, certain questions are left unanswered.Because there were no preprogram comparison data presented, and because students were not matched onimportant background characteristics, it is very difficult to know which outcomes can be attributed to theprogram and which are a result of selection factors such as willingness to seek help, motivation to pursuepostsecondary education, parental support, and persistence.
The evaluation study is particularly helpful in its investigation of factors that very successfulprograms identified as key to their effectiveness. The three programs with the best results all agreed thatparental involvement, close tutor/teacher/counselor relationships with students, and continuous andconsistent contact were critical factors in their success. Parental involvement in the program was a proxyof sorts for parental support of the students, which proved to be very important for their academicadvancement. This evaluation, like so many others, also concluded that the close personal relationshipwith a key supportive adult was an effective strategy for success, and consistent contact between studentsand their mentors, tutors, or teachers was key to the strength of that relationship. Other factors that werecited by a number of program sites included the availability of tuition scholarships (not all programsprovide scholarships), summer programs and field trips that add to student retention, and communityinvolvement, which can also be instrumental in gaining financial support for the program.
CROP appears to be providing important support and information for students such thatmany who would not otherwise choose postsecondary education appear to be doing so, and their survivalrates in college appear comparable to other more typical students in the Florida schools. On the otherhand, it serves a relatively small number of students, and there is also high turnover in the program—about half of students do not return from year to year. Florida’s experience does, however, confirm acommon finding in the literature: the most effective programs provide consistent monitoring of studentsin the context of a close relationship between individual students and at least one supportive adult.
Indiana Career and Postsecondary Advancement Center (ICPAC)/21st CenturyScholars
Program description
The Indiana Career and Postsecondary Advancement Center was created in 1986 by theIndiana General Assembly to help prepare more of Indiana’s students for higher education. In 1990, the21st Century Scholars, a program designed to provide financial support to ensure that all eligible studentsin the state, regardless of family income, could attend a postsecondary institution, became part of theICPAC portfolio. Indiana’s postsecondary initiatives grew out of a growing concern that a relativelysmall percentage of the state’s high school students were pursuing a college education, which was havinga negative effect on the state’s economy. Research indicated that the state’s economy was lagging in theproduction of knowledge-based employment opportunities that attract college graduates. State legislatorsreasoned that these were the kinds of jobs that were created by entrepreneurs, and to create the jobs, itwould first be necessary to educate the students.
Indiana represents a unique and interesting approach to the problem of increasing college-going among its youth. It is a multi-pronged effort, including services, scholarships, and a careful studyof the attitudes, conditions, and resources surrounding postsecondary education. The program has alsobeen generously supported by the Lilly Endowment and is an example of state-foundation partnership.

58
In 1986, Indiana ranked 39th in the nation with respect to percentage of high schoolgraduates pursuing postsecondary education. Only 37.5 percent of high school graduates enrolled in anykind of higher education institution. To approach the problem systematically, the state partnered with theLilly Endowment to study why students made the postsecondary choices that they did and to identify thebarriers to postsecondary education. Gary Orfield of Harvard University and Faith Paul of the PublicPolicy Research Consortium in Chicago were commissioned to study the challenges that the state facedand the options that lay before it in attempting to change college-going patterns in Indiana.
Orfield and Paul (1994) found that while Indiana’s students expressed high aspirations forprofessional employment, many had little understanding of what was required to realize their dreams.Although students enjoyed easy access to counselors in the high schools, counselors lacked a goodunderstanding of the higher education system, and many students—especially those of color and thosefrom low-income backgrounds—lacked both information and financial resources to make college a realpossibility. Orfield and Paul found that the school system was segregated by vocational and collegepreparatory tracks, and that if a student was routed into the vocational track because of lack ofinformation or understanding of the requirements for professional employment, it was nearly impossibleto become college eligible. Gatekeeping courses were reserved for the students who declared theiracademic intentions early. Based on the information available from the report, the ICPAC fine-tuned itsprograms and dedicated itself to two major efforts: collection, analysis, and dissemination of informationabout college-going, and financial incentives and support to attend college.
State planners concluded that they had two choices in how to spend their limited statedollars: on an intensive program that would provide extensive support for a few students with greatestneed, or on an extensive program that would provide information and financial support for large numbersof students (Gillie, 1999). Indiana chose the latter. ICPAC has focused on three strategies:
• Providing a massive guidance information and awareness campaign that begins in the7th grade by contacting every family with initial information about postsecondaryoptions, including college, then continuing with a flow of information through the 12thgrade that provides all necessary steps to prepare for and apply to college.
• Restructuring the secondary curriculum to provide academic rigor to more students,including introduction of the Core 40 program, a statewide campaign to encourage allstudents to take the basic college preparatory course load that will qualify them foradmission to a 4-year college if they choose to apply.
• Reducing the financial barrier to college through state grant and scholarship programsthat provide between 80 percent and 100 percent of tuition and fees depending on thestudent’s academic standing, and scholarships through the 21st Century Scholarsprogram, which guarantees fully paid college tuition to all low-income students who areIndiana residents and meet the eligibility criteria for admission.
ICPAC has instituted other strategies as well to strengthen the curriculum, reduce the costsof college, and stimulate greater interest in postsecondary education:
• Indiana pays the cost of the Advanced Placement exam for any student wishing to takethe test in English, math, or science.

59
• The Indiana University Early College Program is available at over 60 high schools toallow students to take college courses through distance education.
Evaluation outcomes
Because Indiana viewed the low college-going rate of its youth as an economic and quality-of-life problem for the state (as opposed to individual students), it has evaluated its efforts by comparingits standing on a number of dimensions against rankings for the states. Thus, Indiana judges its efforts atstimulating college matriculation as successful because its ranking in the nation on this indicator rosefrom 39th in 1986 to 20th in 1996. Progress on this goal was particularly strong in the period after thepublication of High Hopes, Long Odds in 1994. Between 1990 and 1995, the percentage of Indianastudents enrolling in higher education grew from 48.6 percent to 56.3 percent.
Indiana has been especially effective in moving more students into its college preparatorytrack. Between 1994-95 and 1997-98, interest in the Core 40 program grew from 11 percent to 37 percentof ninth graders. Likewise, the percentage of students graduating with the state’s Academic HonorsDiploma increased from 5.5 percent in 1990 to 15.3 percent in 1997.
The 21st Century Scholars program comprises a parent education component supported bythe Lilly Endowment, an outreach and support component supported by NEISP, and a service learningcomponent sponsored, in large part, by the Prudential Youth Leadership program. Americorps staffprovide tutoring, mentoring, and monitoring of student progress in high school. Students are invited tosign up for the Scholars program at the end of eighth grade. They must be eligible for state assistance andpledge to take the Core 40 courses, to abstain from drugs and alcohol, and to graduate with at least a 2.0average. If a student meets all of these criteria, 21st Century Scholars promises to ensure the full cost oftuition at any Indiana college or university to which the student is accepted. (Because it is a last-dollarscholarship, the program pays the difference between all other scholarships and aid and the student’sneed.)
In the first cohort of students in 1990, 5,757 students signed up and 2,621 (46 percent) metthe conditions of the scholarship. Of these, 1,421 students (54 percent) used their award to attend collegein the first year, and 1,246 returned in the second year. Data for the second cohort to reach college weresimilar, with more students enrolling initially (6,347), 44.5 percent of whom met the conditions. Some 65percent of those students meeting the conditions of the scholarship attended college. Between 1989 and1999, Indiana doubled the number of financial aid offers it made to college-going students and tripled theamount of funding it provided.
Thus, as Gillie (1999) pointed out, Indiana found itself at a crossroads in 1990. It assessedits problem of undeveloped human resources and decided to use its limited resources to provide extensiveservices that targeted a large percentage of the state’s students with information and substantial financialsupport for college. The evidence suggests that Indiana’s strategies have been successful.

60
Minnesota’s Postsecondary Enrollment Options Program (PEOP)
Program description
Minnesota’s Postsecondary Enrollment Options Program was instituted in 1985 as a directresponse to increased pressure in the state for “choice” programs in the form of vouchers. From theperspective of students and families, the PEOP offered the opportunity to take college courses that wouldcount for credit both at the secondary and the college level, thereby giving students a head start on collegeand reducing the costs of a higher education (all courses were paid for by the state). Minnesota’s PEOPhas been evaluated recently, and it is a model that other states have used, sometimes for differentpurposes. For example, New Jersey has experimented with enrolling some at-risk high school studentsinto community colleges as a means of providing an environment—and an incentive to continueschooling—aimed at stemming dropout rates and better meeting the needs of students who do not fit wellinto the structure of high school. Minnesota does not address this potential benefit, and the criteria forattendance at the postsecondary institutions are stringent enough that at-risk students are unlikely to beaccepted—in most cases high school students must meet higher criteria for admission than regularlyenrolled college students. Nonetheless, the Minnesota experience provides important insights into thepotential of this type of strategy to increase student achievement and provide increased options forcompleting high school and increasing postsecondary enrollment.
In order to participate in PEOP, students wishing to attend classes at a state 4-year college oruniversity must be in the upper one-third of their class; for enrollment in the community colleges,students must be in the upper half of their class. Students may take courses in both their junior and senioryears, and most elect to take social studies and language courses. Grades and credit received at thecollege are transferred to the high school; most students’ GPAs are relatively unaffected because studentstend to get similar grades in college courses as in high school classes. In 1994-95, about 6 percent of alljuniors and seniors in Minnesota’s public schools participated in the program; almost two-thirds ofparticipants were female, and about three-quarter were seniors.
Evaluation outcomes
The evaluation of the PEOP program was conducted by the Program Evaluation Division ofthe Office of the Legislative Auditor in 1996. It is largely a descriptive study, employing no comparisonsor controls to assess student outcomes. However, considerable survey data were collected on allparticipants (students, parents, teachers, and administrators) to assess strengths and weaknesses of theprogram. Students and parents were found to be overwhelmingly happy with the experience, and two-thirds of students could not name a single weakness with the program. Program administrators, however,were less enthusiastic. Almost one-third of postsecondary administrators cited lack of academic oremotional maturity on the part of student participants as a significant weakness, while high schooladministrators worried that students took nondemanding courses and that the program actually cost thedistricts money (since colleges received per-course compensation that otherwise would have gone to thehigh schools). Since no data were collected on the extent to which this program stimulated college-goingor captured students who might not otherwise have gone on to college, it is unknown whether theprogram had such an impact. However, data on who participates in the program and to whom the costsand benefits accrue provide some insights into this issue.
While minority students appeared to participate in the program commensurate with theirpercentage in the Minnesota population (about 10 percent), there were significant differences in

61
participation according to income. Families with incomes above $45,000 were much more likely toparticipate than low-income families. Moreover, when the costs of attending the program werecalculated, evaluators found that upper income families were the greatest beneficiaries of the programsince they would have had to pay college tuition in order for their children to take the same courses thatthey took for free in high school. Lower income families could have depended on some aid from the stateto meet these college expenses in any case. Also, whereas the program was envisioned as adding onlymarginal costs to the college budgets, since they were only required to accept students on a space-available basis, the program cost an estimated $10 million in 1994-95 because institutions tended toaccommodate as many students as were eligible and applied. Since the state covered the costs ofeducating the students, there were financial incentives for accepting more students. In sum, the PEOPprogram, while producing highly satisfied “customers” and providing more school choice options forMinnesota’s high school students, also operates to redistribute state funds to the most affluent portion ofthe population. It substantially decreased the cost of education for the participating families, who weredisproportionately in upper income brackets, but had little effect on the cost of higher education for thepoorest families since they were much less likely to participate.
Lower income families tended to participate less for several reasons. One, transportationwas a problem—families had to make their own arrangements for transportation, and those living closerto colleges, or who had more ready means of transportation, were more likely to attend. Second, thecriteria established for participation excluded lower performing students and those who were limitedEnglish proficient. Finally, no special effort was made by the state agencies to encourage low-incomefamilies to participate, and those families who were most adept at gaining information, i.e., those with thegreatest social capital, were most likely to apply.
Postsecondary enrollment programs for high school students can be used to achievenumerous goals, including providing more challenging curriculum for high achieving students, offeringincentives for students who may have struggled in high school to continue their education, and facilitatinga college experience for some borderline students who might not have considered higher education as anoption. Fiscal policies can also be constructed that redistribute benefits to the most disadvantaged insociety. However, most of these goals were not part of the Minnesota initiative, so while this evaluationyields the finding that such a program can be highly effective in producing a satisfied clientele, Minnesotahas not tested the limits of its program with respect to increasing access for underrepresented students.
Issues in Evaluation
The programs included in this section incorporate the more exacting evaluations of programeffectiveness found in the literature. Nonetheless, it is apparent that there is great variability in the rigorof these studies, and in almost cases, they could be improved considerably with a few standardmodifications. Few evaluations employed true control groups, that is, comparisons between students whohad been randomly selected into the program and those who had not, or comparisons to students who hadnot participated in the program and who were matched with participants on significant backgroundcharacteristics like socioeconomic status, race, and ability scores. Drawing comparisons to “all otherstudents nationwide” or to other students in the same school district or state ignores the fact that theprogram participants were normally selected into the program by some process, and they were not like allother students.
An important way to strengthen comparisons and partially control for bias in the controlgroups is to collect baseline data on students from the point just prior to their entry in the program andthen to compare their growth over time with that of students who are not in the program. However,studies with baseline data on student participants were rare. It was also uncommon to find studies that

62
had true longitudinal comparisons, beginning with a baseline data point. Most studies simply collectedoutcome data at one point in time, leaving unknown what differences could be observed from pre-program to post-program.
Some programs simply provided information about responses to surveys conducted onselected participants (those they were able to locate and who agreed to participate, introducing substantialselection bias). It was often impossible to determine what the response rates were to these surveys, andthus to what extent they may have represented a highly skewed sample (for example, only thoseindividuals who were either happy enough with the program, or upset enough with it, to want to havetheir say). While these data can serve an important purpose in understanding how students experience aprogram and how the program might be strengthened or improved, they are of limited value in measuringhow effective the program was compared to other kinds of interventions or no intervention at all.
There also seemed to be a lack of specificity of outcomes and measurement. For example,many programs purported to “double” college-going but were not specific about what they meant by“college.” Was it part-time attendance at a community college while holding a full-time job? Was it full-time attendance at a 4-year college? The answer to this question has major implications for the likelihoodthat the students will persist in college and actually earn a degree. It was also rare to find programs thatmeasured anything beyond college-going, such as grade point averages, college admissions scores, orsome other measure of achievement, including first-year persistence. It was not possible to know whetherthe program influenced achievement or simply matriculation to a postsecondary institution. The fewstudies that did report such data seem to indicate that affecting achievement is a much more difficult taskthan affecting college-going. Since high school achievement is a much stronger predictor of persisting incollege and completing a degree than simply matriculating, these missing data are important.
Few programs kept careful track of participant attrition. Usually the number of students whoare measured on some dimension(s) for the purposes of evaluation were actually a subset of those whostarted the program. Seldom was it possible to discern the percentage these students represented of thatinitial cohort. This practice introduces enormous bias into the findings, since students who persist aremore likely to be successful in any undertaking than those who do not. The failure to keep track ofprogram attrition means that important opportunities are lost to learn more about what might help keepstudents in programs and on track for high school graduation and postsecondary education.
While many people in education decry the mere notion of cost-benefit analysis as asimplistic response to a complex problem, the virtual absence of any discussion about the costs ofprograms and program components as they relate to outcomes is of concern. Given that resources arelimited, it would seem reasonable to deploy available resources in the most effective way possible.However, in the absence of any evaluation of what works best at what cost, it is impossible to make thesejudgments. Cost information sought from the programs studied was often difficult or impossible toobtain. Even where such data are reported, it is with the caveat that it is generally the evaluator’s bestguess, because very few definitive analyses of program costs exist.
Social science research is fraught with limitations and pitfalls, and research in schools ismany times more difficult because of severe restrictions placed on researchers, the need for approval toask even the most benign questions of a minor, and the myriad problems of tracking highly mobilestudents who tend to change schools or leave them altogether. Nonetheless, the incorporation of a fewstandard methodological procedures into the studies that are done could strengthen greatly our knowledgebase about how and how well these programs work. Improving evaluation procedures could provide thedata necessary to improve programs.

63
7. CONCLUSIONS
Section 3, Study Methods, describes how programs that met the criteria for being collegepreparatory and that had conducted evaluations with sufficient rigor to allow some conclusions about theireffects were identified. It is certain that some important programs were missed in this process. The scopeof this activity is enormous, and there is presently no central repository for information about theseprograms. While there are many notable efforts to improve student achievement in the K-12 sector, andmany thousands of programs in schools across the nation, the scope of this study was limited to programsthat focused specifically on college enrollment as their chief outcome goal. However, even with theseacknowledged limitations, much has been learned about ways to improve the chances forunderrepresented students going on to higher education.
Effective Practices
From the review of evaluative studies of early intervention programs, the most effectiveprograms appear capable of at least doubling the college-going rate of participants. Students and familiesreport that these programs open both eyes and doors to postsecondary possibilities. The passion,dedication, and commitment that are evidenced by staff and directors of these programs point the way tosuccessful strategies. The literature also suggests how the strategies these programs employ may beimplemented in different contexts. The programs that appeared to be the most effective had the followingelements in common:
• Providing a key person who monitors and guides the student over a long period oftime—a mentor, program director, faculty member, or guidance counselor. Studies arenot clear on which of these is most effective.
• Providing high-quality instruction through access to the most challenging coursesoffered by the school (“untracking”), through special coursework that supports andaugments the regular curricular offerings (tutoring and specially designed classes), or byrevamping the curriculum to better address the learning needs of the students.
• Making long-term investments in students rather than short-term interventions. It wasclear that the longer students were in a program, the more they were reported to benefitfrom it.
• Paying attention to the cultural background of students. Many programs reported havinggreater success with one group of students than another. The background and expertiseof the staff and directors likely helped them make cultural connections with students.
• Providing a peer group that supports students’ academic aspirations and that meets foracademic as well as social and emotional support.
• Providing financial assistance and incentives. Financial assistance is important foraccess to academic leveling experiences—college visits and SAT preparation courses—as well as access to monetary support to make college a realistic possibility for somestudents. Scholarships can make the difference between going to college or not formany low-income students (Thomas, 1998; St. John, 1990; Gándara, 1995).

64
Program Limitations
Limitations for many of these program efforts included the following:
• Program attrition. Few programs either report or know how many students who begintheir program actually complete it, although an estimated third to half of all studentswho begin in these programs leave them before completion or before high schoolgraduation. Nonetheless, programs commonly report very high percentages ofparticipants going on to college based on counting only the number of participants in thegraduating class. Because of cost and the labor-intensive nature of the servicesprovided, few students in any given school are normally included in such a program.Based on High School and Beyond data, Adelman (2000) estimates that no more than11.4 percent of black and 5.3 percent of Hispanic students participate, at any level, insuch programs.
• Participant selection. Few programs were explicit about how students were selected toparticipate and about the characteristics of the most successful participants. This kind ofinformation is critically important to judge who can best benefit from the program.
• Participation of males. Boys are seriously underrepresented in these programs.Generally, only about one-third of participants are males.
• Records on program contact. Few programs keep records on the amount of contactthat participants have with the program. Similarly, programs are often vague about whatconstitutes completion or retention in the program. Without this information it isdifficult to know if a program can be credited for student outcomes, or if they are a resultof other factors.
• Sector approach. Programs are usually nonsystemic. Since most programs serve onlyone sector of the K-12 system, services are noncontinuous. Without a continuousintervention, gains made at one level may be lost at the next.
• Academic achievement. While some programs were able to demonstrate that theydoubled college-going among their participants (compared to controls), evidence thatprograms are effective in raising academic achievement as measured by grades or testscores is limited.
• Type of postsecondary institutions. Because measured achievement is not generallyraised, programs are most effective at increasing college-going to community collegesand less selective 4-year colleges. They do not appear to have a major impact onincreasing the numbers of students who go on to selective colleges and universities whowould not otherwise have done so.
• Long-term outcomes. Little is known about long-term outcomes for students. Mostprograms so not have data that show if they increase the rates at which participantsobtain college degrees when compared to students who have not participated in theprogram.
• Costs. Very little is reported about the costs of these programs. This review does notaddress the relationship between costs and outcomes.

65
Program Evaluation
Perhaps most troubling was the finding that so few programs had engaged in a thoroughevaluation of their activities. Program staff commonly operated on the assumption that their programswere effective, but data were not available to support that belief. Evaluation may be viewed as a threat tothe program rather than a means to improve it, document its effectiveness, or better understand how itworks. Because of the widespread absence of evaluation, many questions remain unanswered:
• How effective are most of these programs at meeting their goals of increasing college-going rates when compared to similar students who have not been enrolled in such aprogram?
• While careful monitoring and guidance of students is clearly beneficial, who might mosteffectively provide this service—teaching staff, counselors, mentors, or specializedprogram staff?
• How can programs increase their impact on student achievement?
• How can programs most effectively stem student attrition?
• What happens to graduates of these programs after they matriculate in college? Arestudents equipped to succeed in a college environment?
• How can programs maximize their resources? Which features of the programs are most(cost) effective?
To answer these questions, it would be important to:
• Collect baseline data on program participants and comparisons. Were there differencesbetween participants and comparison students before the program intervention?
• Monitor and report program attrition. How many students are lost along the way?
• Carefully match control groups (assuming random assignment of participants is notpossible) and report differences.
• Give attention to measuring the outcomes that the program purports to be affecting.
• Compare program features and outcomes. What specific features of the program aremost responsible for its effects? What attracts students to the program and fosters theirretention?
Connecting Programs With School Reform Efforts
It should not be surprising that these early intervention programs appear to have little effecton academic achievement. The programs, whether community based, school district sponsored, orpartnered with postsecondary education, tend to be peripheral to the K-12 schools. They augment andsupplement what schools do, but do not fundamentally change the ways schools interact with students.Thus, these successful programs work to emulate the features of schools that routinely send high
66
percentages of their graduating students on to college, but they only do it for part of the day, and oftenoutside of school time. The rest of the time, students are exposed to the same school practices that havebeen proven to be unsuccessful for them. Good programs tend to help students maximize their assets,expand their goals, and show evidence of doubling the college-going rate of their participants, but do notappreciably alter their academic achievement. For changes in academic achievement to occur, and accessto highly selective institutions to be substantially increased, schools would need to adopt the provenstrategies that early intervention programs have incorporated.

67
REFERENCES
Adelman, C. (1999). Answers in the Tool Box. Academic Intensity, Attendance Patterns, and Bachelor’sDegree Attainment. Washington, DC: U.S. Department of Education, Office of Educational Researchand Improvement.
Adelman, C. (2000). Participation in Outreach Programs Prior to High School Graduation:Socioeconomic Status by Race. Paper presented at the ConnectED Conference, San Diego, CA, January10.
Akerheilm, K., Berger, J., Hooker, M., and Wise, D. (1998). Factors Related to College Enrollment.Final Report. Washington, DC: U.S. Department of Education. Office of the Undersecretary.
Atkinson, D., Jennings, R., and Livingston, L. (1990). Minority students’ reasons for not seekingcounseling and suggestions for improving services. Journal of College Student Development, 31, 342-350.
August, D., and Hakuta, K. (1997). Improving Schooling for Language Minority Children. A ResearchAgenda. Washington, DC: National Research Council. Institute of Medicine.
Bailis, L. N., Melchior, A., Sokatch, A., and Sheinberg, A. (1999). Evaluation of the GE Fund CollegeBound Program. Waltham, MA: Center for Human Resources, Heller Graduate School, BrandeisUniversity.
Bailis, L.N., Hahn, A., Aaron, P., Nahas, J. and Leavitt, T. (1995). A New Field Emerges: CollegeAccess Programs. Waltham, MA: Brandeis University, Center for Human Resources.
Barr, R., and Dreeben, R. (1983). How Schools Work. Chicago: University of Chicago Press.
Baumrind, D. (1989). Rearing competent children. In Child Development Today and Tomorrow, editedby W. Damon, 349-378. San Francisco, CA: Jossey-Bass..
Berliner, D., and Biddle, B. (1996). The Manufactured Crisis: Myths, Fraud, and the Attack onAmerica’s Public Schools. Reading, MA: Addison Wesley.
Bowen, W., and Bok, D. (1998). The Shape of the River. Long Term Consequences of Considering Racein College and University Admissions. Princeton NJ: Princeton, University Press.
Bowman, C., and Gordon, E. (1998). A Connoisseurial Evaluation of the Posse Program. Pomona, NY:Gordon and Gordon Associates in Human Development, Inc.
Brooks-Gunn, J., Denner, J., and Klebanov, P. (1995). Families and neighborhoods as contexts foreducation. In Changing Populations, Changing Schools: Ninety-fourth Yearbook for the NationalSociety for the Study of Education, Part II., edited by E. Flaxman and A. Passow. Chicago: NationalSociety for the Study of Education.
Brophy, G., and Good, T. (1974). Teacher-Student Relationships: Causes and Consequences. NewYork: Holt, Rinehart & Winston.

68
Burkheimer, G., Levinsohn, J., Koo, J., and French, A.. (1976). Evaluation Study of the Upward BoundProgram. Research Triangle Park, NC: Research Triangle Institute.
Burkheimer, G., Riccobono, J., and Wisenbaker, J. (1979). Final Report. Evaluation Study of theUpward Bound Program --A Second Follow Up. Research Triangle Park, NC: Research TriangleInstitute.
Cabrera, A., Stempen, J., and Hansen, W.L. (1992). Exploring the effects of ability to pay on persistencein college. Review of Higher Education, 13, 303-313.
California Department of Education (CDE). (1999). California Basic Educational Data System.Available online. www.cde.ca.gov/demographics/reports/statewide/sums98.htm.
Carnevale, A., Haghighat, E., and Kimmel, E. (1998). The Role of Tests in College Admission:Evaluating Skills for Higher Education. Princeton, NJ: Educational Testing Service.
Carroll, J.B. (1963). A model of school learning. Teachers College Record, 64, 723-733.
Chapa, J. (1997). Hopwood in Texas: The Untimely End of Affirmative Action. Cambridge, MA: TheCivil Rights Project, Harvard University.
Chávez, L., and Serna, C. (1999). Access to A - F Courses and Racial Composition of the School. Paperpresented at the American Educational Research Association Conference, Montreal, Canada, April.
Center for Higher Education Policy Analysis (CHEPA). (1998). National Study of College PreparationPrograms. Program Summary: Los Angeles. Unpublished internal document.
Chronicle of Higher Education. (1998). Almanac of Higher Education, 1998-99. Washington, DC:Chronicle of Higher Education.
Clark, B. (1980). The “cooling out function” revisited. New Directions for Community Colleges, 8, 15-31.
Clark, R. (1983). Family Life and School Achievement: Why Poor Black Children Succeed and Fail.Chicago: University of Chicago Press.
Coleman, J., Campbell, E., Hobson, C., McPartland, J., Mood, A., Weinfield, F., and York, R. (1966).Equality of Education Opportunity. Washington, DC: U.S. Government Printing Office.
College Board (1999a). Trends in College Pricing. New York: The College Board.
College Board (1999b). Trends in Students Aid. New York: The College Board.
Crouse, J., and Trusheim, D. (1988). The Case Against the SAT. Chicago: University of Chicago Press.
Darling, N., and Steinberg, L. (1997). Community influences on adolescent achievement and deviance.In Neighborhood Poverty. Volume II. Policy Implications in Studying Neighborhoods, edited by J.Brooks-Gunn, G. Duncan, L. Aber. New York: Russell Sage Foundation.

69
Darling-Hammond, L., and Green, J. (1994). Teacher quality and equality. In Access to Knowledge. TheContinuing Agenda for Our Nation’s Schools. Revised Edition, edited by J. Goodlad and P. Keating, NewYork: The College Board.
Delgado-Gaitán, C. (1990). Literacy for Empowerment: The Role of Parents in Children’s Education.London: Falmer Press.
del Pinal, J, and Singer, A. (1997). Generations of Diversity: Latinos in the United States. Washington,DC: Population Reference Bureau.
Delpit, L. (1995). Other People’s Children. Cultural Conflict in the Classroom. New York: The NewPress.
DiMaggio, P. (1982). Cultural capital and school success: The impact of status culture participation onthe grades of U.S. high school students. American Sociological Review, 47, 189-201.
Douglas, W. (1989). New spin on getting in college: Applicants hire private counselors. Newsday, 6,February, 4.
Eaton, S., and Meldrum, C. (1996). Broken promises. In Dismantling Desegregation. The QuietReversal of Brown vs the Board of Education, edited by G. Orfield and S. Eaton. New York: The FreePress.
Elmore, R. (1996). Getting to scale with good educational practice. Harvard Educational Review, 66, 1-26.
Epstein, J., and Karweit, N. (eds.). (1983). Friends in School: Patterns of Selection and Influence inSecondary Schools. New York: Academic Press.
Etzioni, A. (1995). New Communitarian Theory: Persons, Virtues, Institutions, and Communities.Charlottesville, VA: University of Virginia Press.
Ferguson, R. (1998). Can schools narrow the black-white test score gap? In The Black-White Test ScoreGap, edited by C. Jencks and M. Phillips. Washington, DC: The Brookings Institution.
Fine, M. (1991). Framing Dropouts: Notes on the Politics of an Urban Public High School. Albany,NY: State University of New York Press.
Fordham, S., and Ogbu, J. (1986). Black students’ school success: Coping with the burden of “actingwhite.” Urban Review, 18, 176-206.
Gándara, P. (1995). Over the Ivy Walls: The Educational Mobility of Low-income Chicanos. Albany,NY: State University of New York Press.
Gándara, P., and Lopez, E. (1998). Latino students and college entrance exams: How much do theyreally matter? Hispanic Journal of Behavioral Sciences, 20, 17-38.
Gándara, P., Mejorado, M., Gutiérrez, D., and Molina, M. (1998). Final Report of the High SchoolEvaluation, 1994-98. Davis, CA: University of California.

70
Gándara, P., Rumberger, R., Larson, K., and Mehan, H. (1998). Capturing Latino Students in theAcademic Pipeline. Berkeley, CA: University of California: California Policy Seminar andChicano/Latino Policy Project.
Gillie, S. (1999). An Extensive System for Postsecondary Encouragement. Indianapolis, IN: IndianaCareer and Postsecondary Advancement Center.
Gladieux, L., and Swail, W.S. (1998). Financial Aid is Not Enough: Improving the Odds of CollageSuccess for Low-Income Minority Students. Washington, DC: The College Board.
Goldhaber, D., and Brewer, D. (1996). Evaluating the Effect of Teacher Degree Level on EducationalPerformance. Rockford, MD: Westat.
Grebler, L., Moore, J., and Guzmán, R. (1970). The Mexican American People: The Nation’s SecondLargest Minority. New York: Free Press.
Griffin, J. (1990). A Better Chance, Inc. Internal Program Review. Preliminary Findings. Submitted toDeWitt Wallace-Reader’s Digest Fund. Boston: A Better Chance, Inc.
Grossman, J., and Garry, E. (1997). Mentoring—A proven delinquency prevention strategy. JuvenileJustice Bulletin, April. Washington, DC: U.S. Department of Justice.
Grossman, J., and Tierney, J. (1998). Does mentoring work? An impact study of the Big Brothers BigSisters Program. Evaluation Review, 22, 403-426.
Grubb, W. N. (1991). The decline of community college transfer rates: Evidence from nationallongitudinal surveys. Journal of Higher Education, 62, 194-222.
Gurin, P. (1999). Expert Testimony in the Cases Gratz et al., v Bollinger et al., and Grutter et al., vBollinger et al. Ann Arbor: University of Michigan.
Haro, R., Rodríguez, G., and Gonzales, J. (1994). Latino Persistence in Higher Education: A 1994Survey of University of California and California State University Chicano/Latino Students. SanFrancisco: Latino Issues Forum.
Hanushek, E. (1994). Money might matter somewhere: A response to Hedges, Laine, and Greenwald.Educational Researcher, 23, 5-8.
Haycock, K. (1998). Good teaching matters. How well-qualified teachers can close the gap. Thinking K-16, 3, 1- 14.
Heller, D., and Laird, T. (1999). Institutional need-based and non-need grants: Trends and differencesamong college and university sectors. Journal of Student Financial Aid, 29, 7-24.
Henderson, R. (1997). Educational and occupational aspirations and expectations among parents ofmiddle school students of Mexican descent: Family resources for academic development andmathematics learning. In Social and Emotional Adjustment and Family Relations in Ethnic MinorityFamilies, edited by R. Taylor and M. Wang. Mahwah, NJ: Lawrence Erlbaum Associates.

71
Horn, L., and Carroll, C.D. (1997). Confronting the Odds: Students at Risk and the Pipeline to HigherEducation. NCES 98-094. Washington, DC: U.S. Department of Education, National Center forEducation Statistics.
Hutchinson, R.L., and Reagon, C.A. (1989). Problems for which seniors would seek help from schoolcounselors. The School Counselor, 36, 271-80.
Jarret, R. (1997) Bringing families back in: Neighborhood effects on child development. InNeighborhood Poverty. Volume II. Policy Implications in Studying Neighborhoods, edited by J. Brooks-Gunn, G. Duncan, and L. Aber. New York: Russell Sage Foundation.
Jencks, C., and Phillips, M. (1998). The Black-White Test Score Gap. Washington, DC: BrookingsInstitution Press.
Jencks, C., Smith, M., Acland, H., Bane, M.J., Cohen, D., Gintis, H., Heynes, B., and Mickelson, R.(1972). Inequality. New York: Harper & Row.
Jencks, C., and Meyer, S. (1990). The social consequences of growing up in a poor neighborhood. InInner-city Poverty in the United States, edited by L. Lynee and M. McGeary. Washington, DC: NationalAcademy Press.
Jessor, R. (1993). Successful adolescent development in high risk settings. American Psychologist, 48,117-126.
Johnson, S., and Prom, S. (1983). Factors Related to Science and Mathematics Career Choice in aMinority Population: A Survey of Alumni of A Better Chance, Inc. Boston: A Better Chance, Inc.
Kahne, J., and Bailey, K. (1997). The Role of Social Capital in Youth Development: The Case of “I Havea Dream.” Chicago: University of Illinois at Chicago, College of Education.
Karoly, L., Greenwood, P., Everingham, S., Hoube, J., Kilburn, R., Rydell, C.P., Sanders, M., and Chiesa,J. (1998). Investing in Our Children: What We Know and Don't Know About the Costs and Benefits ofEarly Childhood Interventions. Santa Monica, CA: RAND Corp.
King, J. (1996). Student Aid: Who Benefits Now? College Board Policy Analysis. New York: TheCollege Board.
Krop, C., Brewer, D., Gates, S., Gill, B., Reichardt, R., Sundt, M., and Throgmorton, D. (1998).Potentially Eligible Students: A Growing Opportunity for University of California. PM-808-EDU. SantaMonica, CA: RAND Corp.
Kunen, J. (1996). The end of integration. Time, 29 April, 38-45.
Lareau, A. (1989). Home Advantage: Social Class and Parental Intervention in Elementary Education.London and New York: Falmer Press.
Latino Eligibility Study. (1994). Report No. 4. Santa Cruz, CA: Regents of the University of California.
Lee, H. (1998). Oakland teachers decry UC rebuff of top students. San Francisco Chronicle, 17 April,A21.

72
Levin, S. (1999). Social and psychological evidence on race and racism. Chapter 3 in CompellingInterest. Examining the Evidence on Racial Dynamics in Higher Education, edited by M. Chang, D.Witt, J. Jones, and K. Hakuta. Report of the AERA Panel on Racial Dynamics in Colleges andUniversities.
Levine, A., and Nidiffer, J. (1996). Beating the Odds: How the Poor Get to College. San Francisco, CA:Jossey-Bass.
Mahoney, J., and Cairns, R. (1997). Do extracurricular activities protect against early school drop out?Developmental Psychology, 33, 241-253.
McDonough, P. (1997). Choosing Colleges. How Social Class and Schools Structure Opportunity.Albany, NY: State University of New York Press.
McDonough, P., Korn, J., and Yamasaki, E. (1997). Admissions advantage for sale: Private collegecounselors and the students who use them. Review of Higher Education, 20, 297-317.
McLeod, J. (1987). Ain’t No Making It. Leveled Aspirations in a Low-Income Neighborhood. Boulder,CO: Westview Press.
Mehan, H., Villanueva, I., Hubbard, L, and Lintz, A. (1996). Constructing School Success: TheConsequences of Untracking Low-achieving Students. New York: Cambridge University Press.
Mejorado, M. (1999). Puente: Creating a Model for Mentoring Chicano High School Students. Paperpresented at the American Educational Research Association Conference, Montreal, Canada, April.
Miller, L.S. (1995). An American Imperative: Accelerating Minority Educational Achievement. NewHaven: Yale University Press.
Minicucci, C., and Olsen, L. (1992). An Exploratory Study of Secondary LEP Programs. Vol. V.Meeting the Challenge of Language Diversity: An Evaluation of Programs for Pupils with LimitedProficiency in English. Berkeley, CA: BW Associates.
Moles, O. (1982). Synthesis of research on parent participation in children’s education, EducationalLeadership, 40, 44-47.
Morantz, A. (1996). Desegregation at risk. Threat and reaffirmation in Charlotte. In DismantlingDesegregation. The Quiet Reversal of Brown v Board of Education, edited by G. Orfield and S. Eaton.New York: The New Press.
Mortenson, T. (ed.). (1999). Postsecondary Education Opportunity. Washington, DC: Author.
Myers, D., and Schirm, A. (1997). The National Evaluation of Upward Bound. The Short Term Impactof Upward Bound: An Interim Report. Washington, DC: U.S. Department of Education, Office of theUndersecretary.
Myers, D., and Schirm, A. (1999). The Impacts of Upward Bound: Final Report for Phase I of theNational Evaluation. Washington, DC: U.S. Department of Education, Office of the Undersecretary.

73
National Research Council, Panel on High Risk Youth. (1993). Losing Generations: Adolescents inHigh Risk Settings. Washington DC: National Academy Press.
Noddings, N. (1995). Teaching themes of care. Phi Delta Kappan, 76, 675-79.
Oakes, J. (1985) Keeping Track: How Schools Structure Inequality. New Haven, CT: Yale UniversityPress.
Oakes, J. (2000). Becoming Good American Schools: The Struggle for Civic Virtue in Education Reform.San Francisco, CA: Jossey-Bass.
Olsen, L., Jaramillo, A., McCall-Perez, Z., and White, J. (1999). Igniting Change for ImmigrantStudents. Oakland, CA: California Tomorrow.
Opuni, K. (1998). Project GRAD. Graduation Really Achieves Dreams, 1997-98. Program EvaluationReport. Houston, TX: Project GRAD.
Orfield, G. (1996). The growth of segregation. In Dismantling Desegregation. The Quiet Reversal ofBrown v the Board of Education, edited by G. Orfield and S. Eaton. New York: The New Press.
Orfield, G., and Eaton, S. (1996). Dismantling Desegregation: The Quiet Reversal of Brown v the Boardof Education. New York: The New Press.
Orfield, G., and Paul, F. (1994). High Hopes, Long Odds: A Major Report on Hoosier Teens and theAmerican Dream. Indianapolis, IN: Indiana Youth Institute.
Orfield, G., and Yun, J. (1999). Resegregation in American Schools. Cambridge, MA: Harvard CivilRights Project.
Outreach Task Force. (1997). New Directions for Outreach. Oakland, CA: Board of Regents of theUniversity of California.
Postsecondary Education Planning Commission (PEPC). (1998). Statewide Evaluation of Florida’sCollege Reach-Out Program. Annual Report: 1995-96 Cohort. Tallahassee, FL: PEPC.
Program Evaluation Division, Office of the Legislative Auditor (1996). Postsecondary EnrollmentOptions Program. St. Paul, MN: State of Minnesota.
Perna, L., and Swail, W.S. (1998). Early Intervention Programs: How Effective Are They at IncreasingAccess to College? Paper presented at the annual meeting of the Association for the Study of HigherEducation, Miami, Florida, November 7.
Perry, G., and Kopperman, N. (1973). A Better Chance: Evaluation of Student Attitudes and AcademicPerformance, 1964-1972. Boston: A Better Chance.
Postsecondary Education Opportunity. (1999). Refocusing student financial aid: From grants to loans,from need to merit, from poor to affluent. Postsecondary Education Opportunity, 82, 1- 4.
Puma, M., Karweit, N., Price, C., Ricciuti, A., Thompson, W., and Vaden-Kiernan, M. (1997).Prospects: Final Report on Student Outcomes. Washington, DC: U.S. Department of Education, Officeof the Under Secretary.

74
Rendón, L. (1994). Validating culturally diverse students: Toward a new model of learning and studentdevelopment. Innovative Higher Education, 19, 33-50.
Rendón L., and Garza, H. (1996). Closing the gap between two- and four-year institutions. In Educatinga New Majority: Transforming America’s Educational System for Diversity, edited by L. Rendón and R.Hope. San Francisco: Jossey-Bass.
Rendón, L., and Hope, R. (1996). Educating a New Majority: Transforming America’s EducationalSystem for Diversity. San Francisco, CA: Jossey-Bass.
Rogers, A., and Taylor, A. (1997). Intergenerational mentoring: A viable strategy for meeting the needsof vulnerable youth. Journal of Gerontological Social Work, 28, 125-140.
Romo, H., and Falbo, T. (1996). Latino High School Graduation. Defying the Odds. Austin, TX:University of Texas Press.
Rosenholtz, S., and Simpson, C. (1984). The formation of ability conceptions: Developmental trend orsocial construction? Review of Educational Research, 54, 31-64.
Rumberger, R. (1991). Chicano drop outs. In Chicano School Failure and Success: Research and PolicyAgendas for the 1990s, edited by R. Valencia. London and New York: Falmer Press.
Rumberger, R., and Larson, K. (1998). Student mobility and increased risk of high school dropout.American Journal of Education, 107, 1-35.
Schuman, H., Steeh, C., Bobo, L., and Krysan, M. (1997). Racial Attitudes in America. Trends andInterpretations. Cambridge, MA: Harvard University Press.
Shields, P., Esch, C., Humphrey, D., Young, V., Gaston, M., and Hunt, H. (1999). The Status of theTeaching Profession: Research Findings and Policy Recommendations. Santa Cruz, CA: Center for theFuture of Teaching and Learning.
Slavin, R., and Braddock, J. III. (1994). Ability grouping: On the wrong track. In Access to Knowledge.The Continuing Agenda for Our Nation’s Schools. Revised Edition, edited by J. Goodlad and P. Keating.New York: The College Board.
Slavin, R., and Fashola, O. (1998). Show Me the Evidence. Proven and Promising Programs forAmerica’s Schools. Thousand Oaks, CA: Corwin Press, Inc.
Slavin, R., and Karweit, N. (1985). Effects of whole class, ability grouped, and individualized instructionon mathematics achievement. American Educational Research Journal, 22, 351-367.
Sorensen, S., Brewer, C., and Brighton, E. (1995). Increasing Hispanic Participation in HigherEducation: A Desirable Public Investment. Santa Monica, CA: RAND Corp., Institute on Education andTraining.
Sprinthall, R., Sprinthall, N., and Oja, S. (1998). Educational Psychology. A Developmental Approach.Seventh Edition. Boston, MA: McGraw Hill.

75
Stanton-Salazar, R. (1997). A social capital framework for understanding the socialization of racialminority children and youths. Harvard Educational Review, 67, 1-40.
Stedman, L. (1995). The new mythology about the status of United States’ schools. EducationalLeadership, 52, 80-85.
Steele, C. (1997). A threat in the air: How stereotypes shape intellectual identity and performance.American Psychologist, 52, 613-629.
Steinberg, L., Blinde, P., and Chan, K. (1984). Dropping out among language minority youth. Review ofEducational Research, 54, 113-132.
Steinberg, L. (1996). Beyond the Classroom: Why School Reform Has Failed and What Parents Need toDo. New York: Simon & Shuster.
Steinberg, L., Dornbusch, S., and Brown, B. (1992). Ethnic differences in adolescent achievement: Anecological perspective. American Psychologist, 47, 723-729.
St. John, E. (1990). Price response in enrollment decisions: An analysis of the high school and beyondsophomore cohort. Research in Higher Education, 31, 161-172.
St. John, E. (1994). Prices, Productivity, and Investment: Assessing Financial Strategies in HigherEducation. ERIC Digest. Available online. http://ericae.net/edo/ED382092.htm.
Swail, W.S. (1999). Do Pre-College Early Intervention Programs Work? Presentation at the West CoastCollege Board Forum, San Diego, CA, October 28.
Swisher, K., and Hoisch, M. (1992). Dropping out among American Indians and Alaska Natives: Areview of studies. Journal of American Indian Education,31, 3-23.
Teranishi, R. (2000). African American college choice, post affirmative action: The role of informationand perceptions of opportunity. Paper presented at ASHE 2000 Conference, Sacramento, California,November 17.
Thomas, R. (1998). Black and Latino college enrollment: Effects of background, high schoolpreparation, family and peer influence, and financial aid. Paper presented at American EducationalResearch Association Conference, San Diego, California, April 13-17.
Tierney, W., and Jun, A. (1998). Tracking School Success: Preparing Low-income Urban Youth forCollege. Los Angeles, CA: Center for Higher Education Policy Analysis, University of SouthernCalifornia.
Tinto, V. (1987). Leaving College: Rethinking the Causes and Cures of Student Attrition. Chicago:University of Chicago Press.
U.S. Department of Commerce, Bureau of the Census. (2000). Available online. http://www.Census.gov/population/www/estimates/popest. html.
U.S. Department of Education, National Center for Education Statistics. (1999). The Condition ofEducation 1998. Washington, DC: U.S. Government Printing Office.

76
U.S. Department of Education, National Center for Education Statistics. (1997a). Dropout Rates in theUnited States, 1995. Washington, DC: U.S. Government Printing Office.
U.S. Department of Education, National Center for Education Statistics. (1997b). The Condition ofEducation 1996. Washington, DC: U.S. Government Printing Office.
Walberg, H. (1993). Productive use of time. In Timepiece: Extending and Enhancing Learning Time,edited by L. Anderson and H. Walberg. Reston, VA: National Association of Secondary SchoolPrincipals.
Weinstein, R. (1989). Perceptions of classroom processes and student motivation: Children’s views ofself-fulfilling prophecies. In Research on Motivation in Education: Goals and Cognition’s. Vol. 3,edited by R. Ames and C. Ames. New York: Academic Press.
Wilds, D. (2000). Minorities in Higher Education, 17th Annual Status Report. Washington, DC:American Council on Education.
Wilds, D., and Wilson, R. (1998). Minorities in Higher Education, 16th Annual Status Report.Washington, DC: American Council on Education.
Willis, P. (1977). Learning to Labor. How Working Class Kids Get Working Class Jobs. New York:Columbia University Press.

APPENDIX A
Review of the Literature on Opportunities to Learn

A-1
REVIEW OF THE LITERATURE ON OPPORTUNITY TO LEARN
Student Background Characteristics
Family Background
Family background characteristics have long been associated with students’ educationalachievement, and many studies have concluded that family background explains the largest portion of thevariance in student achievement (Coleman et al., 1966; Jencks et al., 1972; Puma et al., 1997). Whilesuch factors as parental attitudes toward education, expectations, and involvement in their children’sschooling certainly form an important part of the home environment (e.g., Puma et al., 1997), “familybackground,” including family income and parent education level, is commonly operationalized as acomposite variable. By looking at the income and educational backgrounds, a considerable amount canbe inferred about their likely success in school. Table A-1 displays parental education and income forseveral ethnic groups. The students in this sample intend to go to 4-year colleges and thus are among thehighest achievers in their respective ethnic groups.
Table A-1
Parental education and incomeof college-bound students, by race/ethnicity: 1999
Race/ethnicity NumberLess than
high schooldiploma
Some college Income lessthan 20,000
Income morethan 100,000
Black ...................................... 114,912 5% 45% 27% 3%Mexican.................................. 41,028 27 30 27 4Puerto Rican........................... 13,635 9 47 26 5Native American .................... 10,159 4 53 15 9Asian ...................................... 94,066 11 59 21 10White...................................... 704,462 1 66 5 16
SOURCE: The College Board, 1999 SAT administration data.
Nearly all of the black, Native American, and white students in this college-going grouphave parents with high school diplomas. A relatively high percentage of these parents have at least somecollege education, with 45 percent for blacks being the lowest for the three groups. Notable, however, arethe very low levels of parental education among the Mexicans in the sample—27 percent of parents donot have a high school diploma, and only 30 percent have some college, about half the percentage foreither Asians or whites. Such low levels of education in the students’ backgrounds suggests a significantneed for both information and academic support to supplement parents’ efforts to support students.
Figure A-1 shows the average SAT scores by parental income and race/ethnicity. MeanSAT scores for blacks students from upper income families (942 for more than $60,000) are lower thanthe mean SAT scores for whites from the lower income category (976 for less than $20,000); based onparents’ education for one would expect these scores to be higher. Moreover, high-income Hispanicsscore only slightly higher than low-income white students (1,020 versus 976).

A-2
Figure A-1
Average SAT scores by parental income and race/ethnicity: 1999
������������������������������������������������������������������������������������������������������������������������������
������������������������������������������������������������������������������������������������������������������������������
������������������������������������������������������������������������������������������������������������������������������
���������������������������������������������������������������������������������������������������������������������������������������
���������������������������������������������������������������������������������������������������������������������
������������������������������������������������������������������������������������������������������������������������������
���������������������������������������������������������������������������������������������������������������������������������������
������������������������������������������������������������������������������������������������������������������������������������������������
793851
890942
835901
9551020
976 1011 10351091
920
10141066
1151
885970
10191085
0
200
400
600
800
1000
1200
1400
Less than $20,000 $20,000-$40,000 $40,000-$60,000 More than $60,000
Black Hispanic���White
���Asian All
SOURCE: College Board 1999 SAT administration data.
Miller (1995) hypothesized that the substantial variation in test scores and achievement fordifferent ethnic groups within the same income and education categories is due to a type of cumulativeeducational disadvantage experienced by underrepresented minorities. According to this hypothesis,blacks and Hispanics (especially Mexicans and Puerto Ricans) are failing to adhere to the Americanprototype of intergenerational advancement because the quality of education that they receive, in bothformal and informal settings, is consistently lower than that of more advantaged groups. Hence,according to Miller, parents with lower quality formal education, albeit with similar educationalattainment, are less able to confer the educational advantages that other parents with the same level, buthigher quality, education do for their children. Thus, it is likely that many black and Hispanic children donot receive the enriched educational experiences that should be commensurate with their parents’educational background. These students find themselves at a serious disadvantage in competing withstudents from other, better educated ethnic groups.
A number of studies have found that ethnic minority families have uniformly high aspirations fortheir children (Haro, Rodríguez, and Gonzales, 1994; Delgado-Gaitán, 1990; Steinberg, 1996); however,there is also a consensus in the literature that not all parents are equally endowed with the skills andresources to help their children realize these aspirations (Lareau, 1987; Steinberg, 1996). Low-incomeand minority parents often lack the cultural capital—knowledge of how the system works—and socialcapital—access to important social networks—that play such an important role for middle class white andAsian parents in supporting their children’s academic achievement. Even among middle class parentsfrom underrepresented communities of color, cultural capital may be in short supply. Often these families

A-3
represent the first generation in the middle class, and they do not have these middle class experiences intheir own backgrounds to draw upon and replicate for their children. Attitudes, tastes, and dispositionsdevelop over time and result from exposure to particular cultural experiences that are unique to classcategories (DiMaggio, 1982).
Research has also converged on a particular parenting style that appears to be associatedwith higher achievement. Parents who are classified as “authoritative”—firm in their expectations yetwarm in their relationships with their children, and who provide significant autonomy for their progeny—are most likely to have children who do well in school (Baumrind, 1989; Steinberg, 1996). Yet manyblacks and Hispanics are accustomed to parenting in a more traditional, authoritarian style that has beenadaptive to their own sociocultural circumstances; that is, higher risk urban environments may call for adifferent parenting style than lower risk suburban neighborhoods (Clark, 1983; Gándara, 1995). Suchparenting styles, however, may not prepare students as effectively to compete in the classroom with theirwhite peers (Steinberg, Dornbusch, and Brown, 1992).
Family residential mobility can also play a large role in the educational achievement ofchildren. Both young children and adolescents are negatively affected by moves that result in schoolchanges; young children are more likely to have school adjustment problems, and older children are morelikely to drop out of school altogether (Rumberger and Larson, 1998). Unfortunately, family mobility ismore common among poor children and immigrants, and thus they are affected disproportionately bythese changes. Not all school changes are the result of family mobility, nor are they always bad.Sometimes children change schools to find a better fit, but that appears to be more common with whitechildren than low-income minorities (Rumberger and Larson, 1998). In schools with high proportions oflow-income and minority youth in particular, multiple school changes can be the result of school practicesthat “get rid of” students who are perceived to be problems (Fine, 1991). Multiple school changes aremore common among, and generally have a more negative impact on school achievement for, suchyoungsters (Rumberger and Larson, 1998).
At the point when students begin to consider their postsecondary options—whether to go tocollege or not, and if so, to what kind of college—the experience, knowledge, resources, and expectationsof parents play a significant role in the kinds of choices that students make. Students with equal abilitymake very different decisions about their postsecondary education based on the guidance—or lack of it—that they receive from home. Unfortunately, low-income and underrepresented students tend to set theirsights lower than white students with comparable academic records, due in large part to their parents’ lackof understanding of the postsecondary education system (McDonough, 1997).
Community Characteristics
There is considerable debate in the literature about the relative effects of neighborhood type,as distinct from family or peer influence, on student achievement. Two theoretical models can help toexplain how neighborhoods can affect the development of youth in ways that in turn have an impact ontheir schooling outcomes. Neighborhood Resource Theory postulates that the quality of local resourcesavailable to families (e.g., parks, libraries, child care facilities) affects child developmental outcomes.Because poor children live in neighborhoods with fewer supportive resources, they receive less exposureto developmentally enriching activities (Brooks-Gunn, Denner, and Klebanov, 1995). Even when suchresources are available, a family’s access to them is still mediated by the skills (cultural capital) of theparents. More educated, well-informed parents are more likely to access whatever resources exist. Thus,methodologically, there are difficulties in separating the effects of neighborhoods from the effects ofparenting.

A-4
Collective Socialization Theory argues that more affluent neighborhoods generally providemore successful role models and stronger normative support for the kinds of behaviors that are associatedwith school success (Jarret, 1997). Middle-income students are more likely to encounter both adults andpeers in their communities who are supportive of high educational goals and can even assist young peoplein achieving them. This theory, like Neighborhood Resource Theory, is also plagued by methodologicalproblems that make it difficult to assess the independent effects of neighborhoods. For example, Darlingand Steinberg (1997) note that it is difficult to separate the influence of peers in these neighborhoods fromthe effects of the neighborhoods themselves. Thus, neighborhood effects can be confounded with peerinfluence. Nonetheless, Jessor (1993) has argued strongly for the importance of considering the totalecological context in which a child is raised—families, schools, and communities—as influences ondevelopment, and a recent report by the National Academy of Sciences on the problems of adolescencepoints out that too much emphasis has been placed on high-risk youth, and not enough on the high-risksettings in which they live and go to school (National Research Council, Panel on High Risk Youth,1993).
Notwithstanding the significant impediments most poor families face in moving out of high-risk areas, choosing neighborhoods is one way that even low-income parents sometimes have an impacton their children’s academic achievement (Jarret, 1997). In a study of high-achieving Chicanos fromlow-income backgrounds, Gándara (1995) found that many parents made conscious choices to live inparts of town that afforded access to a better school or fewer problems of delinquency, in spite of theirlimited resources. Sometimes by choosing to live on the borders or “frontiers” of barrios or low-incomecommunities, families can provide access to resources that lie just beyond those borders (Grebler, Moore,and Guzmán, 1970; Gándara, 1995).
Peer Influences on Student Achievement
Adolescent peer groups are commonly portrayed as having a negative influence on thevalues and behavior of youth. Drug and alcohol use, gang membership, and a culture ofunderachievement are popularly viewed as risks that are associated with peer influence, and with goodreason since such risky behaviors have been shown to occur in peer clusters (Henderson, 1997). Peerscan, however, also have a positive influence on each other. They can support academic goals and serve asimportant sources of information for upward mobility (Stanton-Salazar, 1997). Adolescents who joinfriendship groups whose academic achievement is higher than their own tend to raise their achievement tomatch the level of their peers. Of course, students who hang out with low-performing friends tend toperform at lower levels as well, and those whose friends are dropouts are at higher risk for dropping outthemselves (Epstein and Karweit, 1983).
Among ethnic minority students from underrepresented groups, however, the issue ofacademic achievement can be complex. Steinberg (1996) reported that one in five adolescents says thathis or her friends make fun of students who do well in school, and this is particularly true for black andHispanic students. Many black and Hispanic students who aspire to high achievement reported beingaccused of “acting white” (Fordham and Ogbu, 1986) and thus being shunned by their lower performingpeers, who may be the arbiters of social acceptability in their schools. Because adolescents areconfronting the difficult (and self-absorbing) task of establishing a personal identity and forging a placewithin their social order, peer acceptance is exceptionally important for their healthy development. Thus,it is not difficult to understand why many students succumb to the admonitions of their friends to putaside the school books and not be a “nerd” or a “school boy” or “school girl.”
Mehan et al. (1996) and Gándara et al. (1998) have both reported on programs that appear toeffectively foster peer groups that support students’ high aspirations, thus allowing students to be both

A-5
high achievers and proud of their ethnic heritage. These peer networks can serve multiple purposes—support for ethnic identity, sources of information, and entree into a supportive peer network. Bothstudies, however, caution that such groups only thrive in the context of supportive schooling structuresthat provide both time and space for these relationships to flourish.
Social Structural Influences on Minority Student Achievement
Miller (1995) cited data suggesting that racism, or prejudice, is indeed one factor in thelower performance of some students of color. James Kleugel (cited in Miller, 1995) analyzed GeneralSocial Survey data to determine the trends in whites’ attitudes toward black disadvantage and concludedthat despite a drop from 27 percent in 1977 to 21 percent in 1989 in the belief that blacks are intellectuallyinferior, a still-significant portion of the white population subscribed to such a belief. More recent datafrom National Opinion Research Center (NORC) surveys on racial attitudes suggest that whites’ belief inblack inferiority has continued to drop. In 1996, only 10 percent of respondents would agree that this wasa factor in black disadvantage. However, what appears to be a positive trend is nonetheless problematicbecause the belief that black disadvantage stems from discrimination has also fallen sharply.
In the same survey, the single most common response to the question of why blacks continueto suffer disadvantages (52 percent) was that they lack the motivation to succeed (Schuman et al., 1997).These beliefs have implications for the ways in which whites are willing to address the problem. Forexample, Schuman et al. (1997) note that while whites overwhelmingly support the principle of equality(depending on the particular question, responses affirming this principle approach 100 percent), they areincreasingly disinclined to support the implementation of measures that would facilitate it. Researchersfind declining support for methods to desegregate schools and for policies such as affirmative action(Kunen, 1996; Morantz, 1996; Schuman et al., 1997). Miller (1995) concludes that “[T]hese views—which include notions of the innate intellectual inferiority of blacks and the cultural inferiority of AfricanAmericans and Latinos—seem to be associated with a lack of interest in or opposition to the addressing ofcritical economic, health, and educational needs of urban minorities” (pp. 241-2).
Societal beliefs about the intellectual or cultural inferiority of certain groups can result inconstrained choices as well as constrained opportunities. Claude Steele (1997) has advanced the theoryof stereotype vulnerability to explain why many blacks, as well as other minorities, may perform poorlyor choose not to participate at all in academic endeavors in which they run the risk of confirming thestereotype that they are intellectually inferior. He contended that the pervasive societal belief in theinferiority of some groups weighs heavily on these individuals when they are confronted with tasks thatcould support this stereotype.
Through a series of novel experiments in which he manipulated subjects’ perceptions oftesting conditions and consequences, Steele demonstrated that black students (and sometimes women)may disidentify (that is, plead lack of interest) with academic goals because of the performance anxietythat is produced by having to compete academically in settings where any mistake can be seen as anaffirmation of the notion that they are intellectually inferior. Steele argues that such disidentification canlead to disengagement from academic endeavors as well as depressed performance on tests. Support forSteele’s theory is also found in the ethnographic studies of Willis (1977) and McLeod (1987). In theirstudies, both black and white disaffected, low-income youth rejected the social norms of the society thatthey perceived as having rejected them. In assuming the very stereotypes that the society imposed uponthem, they thus inadvertently cooperated in reducing their own limited opportunities.
There can be little doubt that all of the foregoing background factors contribute significantlyto the lower achievement of underrepresented students. However, opportunity to learn is still

A-6
fundamentally the responsibility of schools, and many school practices function to reduce the opportunityto learn for many underrepresented students.
The Influence of Schools on Student Achievement
Quality of School
The particular school that a student attends has a significant impact on student achievement.Research has shown, for example, that learning environments and resources differ markedly betweenhigh-poverty and low-poverty schools. Teachers in high-poverty schools are more likely to reportproblems of student misbehavior, absenteeism, and lack of parental involvement than teachers in low-poverty schools; teachers’ salaries and advanced training are also lower in high-poverty schools than inlow-poverty schools (Darling-Hammond and Green, 1994; U.S. Department of Education, 1999).Schools in more affluent neighborhoods have also been shown to provide more rigorous collegepreparatory and honors courses than schools in lower income communities that largely serve populationsof underrepresented students (Orfield, 1996; Chávez and Serna, 1999).
Quality of Teachers
Not only are schools in more affluent areas better organized to provide more rigorouscurricula, they also tend to have stronger teachers (Haycock, 1998; Ferguson, 1998). However, Haycock(1998) reviewed data that show children of color, regardless of their socioeconomic level, are more likelyto be taught by teachers with lower test scores and less academic preparation than white children. Andthe quality of the teacher, measured by certification, quality of institution from which the teacher receivedhis or her degree, and test scores, has been shown in a number of studies to have a significant impact onstudent performance. Ferguson (1998) reviewed data from Texas in the 1980s and found that teacherswith higher scores on the Texas teachers’ test were more likely to produce significant gains in studentachievement than their lower scoring counterparts. Goldhaber and Brewer (1996), in an analysis ofNELS:88 data, showed a positive relationship between teachers’ degrees in technical areas (math andscience) and students’ achievement. Hanushek (1994) also concluded, in spite of a general reluctance toconcede that a greater investment of resources in schooling is likely to produce higher achievement, thatthe quality of the teacher is a major factor in increasing student test scores.
Some research also suggests that high scoring black or Hispanic teachers may be moreeffective with black and Hispanic children than high scoring white teachers (Ferguson, 1998). Delpit(1995) provided an explanation for this idea in her analyses of how progressive white teachers may differin their pedagogy from black teachers, who have greater familiarity with black children’s backgroundsand experiences. She discovered that white teachers may make assumptions about these children’slearning styles and prior knowledge that are unfounded and thus lead to inappropriate instructionalmethods. Teachers’ expectations of children’s abilities can also affect their school performance.
Expectations and Encouragement for High Aspirations
Stereotypes and societal expectations for children of color (and low-income students) oftendiffer from those held for other young people. Teachers are not exempt from these biases. Teachers canbe very effective in sending nonverbal messages to students about the amount of confidence they have inthe students’ abilities. For example, not only do teachers call on favorite students more often, they wait

A-7
longer for an answer from students they believe know the answer than from those in whom they havelittle confidence. With the latter, teachers are more likely to provide the correct answer or to movequickly to other students (Brophy and Good, 1974). Students have also been shown to be very sensitiveto these subtle teacher behaviors and to “read” their teachers’ attitudes quite accurately (Weinstein, 1989).In a series of studies conducted by the psychologist Robert Rosenthal, teachers’ attitudes toward theirstudents were shown to have a substantial impact on their academic performance. Thus, Sprinthall,Sprinthall, and Oja (1998) concluded that “the Rosenthal effect is three-fold: (1) Pupils who are expectedto do well tend to show gains; (2) pupils who are not expected to do well tend to do less well than the firstgroup; and (3) pupils who make gains despite expectations to the contrary are regarded negatively by theteacher” (p. 408). In this way, students’ assessment of their abilities can be moderated by teachers’attitudes and beliefs.
Rosenholtz and Simpson (1984) have also demonstrated that teachers’ organization of theirclassrooms—either unidimensionally in which students’ performance is evaluated very narrowly byfocusing on specific academic skills, or more multidimensionally, in which assessment incorporates abroader range of skills—can mediate students’ evaluation of their peers’ ability. Because peer evaluationhas such a powerful effect on students’ own self-conceptions of ability, teachers can play a pivotal role instudents’ view of their own ability by manipulating organizational features of their classrooms. Throughdirect evaluation, as well as indirectly by mediating the impact of peer evaluation, teachers can affect theaspirations and the expectations that students hold for themselves.
Students’ own aspirations are also influenced greatly by those of the important persons,including teachers, peers, and family members, in their environment. When students are surveyed with aone-time question asking what they want to do or hope to do after high school, researchers find thatstudents respond with uniformly high aspirations to attend college across all ethnic groups (although inresearch comparing approximately 2,000 California high school students by ethnic background, Gándaraet al. (1998) found consistently lower aspirations for Latino students than all others). Even though theydo report high aspirations, underrepresented students more frequently fail to meet their goals (U.S.Department of Education, 1999). Thus, aspirations alone are not very good predictors of who will go onto, and complete, college.
Adelman (1999) argued, however, that if aspirations are defined as what a student isplanning to do after high school, and if their responses are consistent over time, aspirations have muchgreater predictive power. High aspirations, though, are almost certainly the product of high expectationsand encouragement on the part of parents, teachers, and counselors. There is abundant evidence thatteachers and counselors in low-income and heavily minority schools tend to have lower expectations fortheir students than teachers and counselors in more affluent schools (McDonough, 1997; Haycock, 1998).And while many low-income parents hold high aspirations for their children, their actual expectations forwhat their children are likely to do are often considerably lower (Henderson, 1997). Aspirations areclearly important in helping to put students on the path to higher education, but responses to surveysabout students’ aspirations often mask as much as they reveal about young people’s true intentions, whichare likely to reflect those of the important adults in their environment.
Grading systems also differ considerably between low-income, minority schools and moreaffluent, suburban schools. Top grades represent very different levels of accomplishment between the twoeducational environments (Carnavale, Haghighat, and Kimmel, 1998). Even so, grade point averages inthe courses that underrepresented students take are uniformly lower than for white or Asian students, andthus suggest that these students are less well prepared by their schools to enter college than other students.Table A-2 reports GPAs for students from six major ethnic groups who took the SAT exams in 1999.

A-8
Table A-2
National grade point averages of students taking the1999 SAT, by race/ethnicity
Race/ethnicity GPA
White ..................................... 3.32Asian...................................... 3.41Mexican................................. 3.18Native American.................... 3.09Black...................................... 2.90
SOURCE: College Board 1998 SAT administration data.
Unfortunately, the relatively lower classroom performance of underrepresented minoritystudents is mirrored in their standardized test scores. Regardless of the debate—and it is a heated one—about the validity of such scores for students from nonmajority backgrounds, the tests do measure, in part,students’ exposure to middle class culture and high-quality educational experiences, and they do continueto be used widely in the evaluation of students for selective colleges and universities. Therefore theirimportance cannot be ignored. Table A-3 displays the range of scores among six ethnic groups on theSAT.
Table A-3
National scores of students taking the 1999 SAT, by race/ethnicity
Race/ethnicity Number Verbal: Allstudents
Math: Allstudents
Percentscoring
500+Verbal
Percentscoring 500+
Math
Black ...................................... 116,144 433 421 25 21Mexican.................................. 42,750 452 456 32 33Puerto Rican........................... 13,897 455 448 33 30Native American .................... 8,118 484 481 45 43Asian ...................................... 85,128 497 552 50 66White...................................... 705,019 527 528 61 61
SOURCE: The College Board, 1999 SAT administration data.
The effects of differential schooling experiences begin early in the educational careers ofstudents. Barr and Dreeben (1983) have shown how, in spite of the best intentions of teachers, theboundaries between reading groups formed early in the first grade become impermeable barriers toupward advancement in reading groups thereafter. Students have a strong tendency to stay where they areinitially placed. The students who come to school with readiness to read—usually those from homes thathave encouraged early literacy—tend to maintain their advantage over time. Teachers’ early judgments atthe beginning of schooling, more often than not, presage the educational path of students for the balanceof their K-12 years. Once students enter middle school, the math courses to which they are assigned willlargely determine their academic track in high school and their likelihood of being prepared to attendcollege (Adelman, 1999; Oakes, 1985). If they have not been assigned to algebra by ninth grade, they areunlikely to be competitive for a 4-year university. Moreover, they are also probably being “low-tracked”

A-9
depth of content, and quality of instruction (Oakes, 1985; Slavin and Braddock III, 1994). Findings fromthis tracking research convinced the College Board to launch a major initiative entitled Equity 2000whose purpose was to help cooperating schools enroll all students in algebra by the ninth grade, thuseliminating one of the major barriers to gaining a college education.
Segregation
Racial and ethnic segregation continue to have an impact on school performance forunderrepresented students. Inequalities in educational opportunity between segregated white schools andsegregated schools with students of color have been well-documented (Orfield and Eaton, 1996) andserved as the catalyst for a decades-long experiment with desegregation and busing. That experiment haslargely come to an end during the latter half of the 1990s. Today, both black and Hispanic students attendincreasingly segregated schools. The percentage of black students in 90 to 100 percent minority schoolsgrew from 33.9 percent in 1992 to 35 percent in 1997. Hispanic segregation has been increasing sincedata were first collected in the 1960s, and in 1997, 35.4 percent of Hispanic students were attendingschools that were 90 to 100 percent minority (Orfield and Yun, 1999). And, as Orfield (1996) points out:
Low-income and minority students are concentrated in schools withinmetropolitan areas that tend to offer different and inferior courses and levelsof competition, creating a situation where the most disadvantaged studentsreceive the least effective preparation for college. A fundamental reason isthat schools do not provide a fixed high school curriculum taught at acommon depth and pace. The actual working curriculum of a high school isthe result of the ability of teachers, the quality of counseling, and enrollmentpatterns of students (p. 67).
Eaton and Meldrum (1996) reviewed the case of Norfolk, Virginia, which in 1996 was thefirst district to be allowed by the federal courts to dismantle its desegregation plan. Whereas the court hadbeen convinced that returning to a neighborhood school policy would increase parent participation, reducewhite flight (and even encourage white families to move back into Norfolk), and allow for funds to beshifted from transportation costs to strengthening the schools—and therefore the achievement of allchildren—outcomes have not been as anticipated. Segregation has become more acute since the busingprogram was dismantled, and both parent participation in PTA meetings and black students’ test scoreshave dropped.
Quality of High School Counseling
High school counseling represents a problem of both quantity and quality. Over the lastcouple of decades, as school budgets have been stretched thin, particularly in some high-growth stateslike California, school counselors have been the target of budget cuts. For example, the average highschool counselor in California serves almost 450 students (California Department of Education, 1999),and an abundance of literature on high school counseling points to the fact that most public schoolstudents rarely, if ever, see their counselors, and when they do, it is usually for the purpose of routinescheduling of courses (Hutchinson and Reagan, 1989). Many low-income and underrepresented studentssee their counselors not as allies, or sources of support, but as gatekeepers who all too often refuse themadmission to the courses that would prepare them for college (Oakes, 1985; Gándara, 1995). Thesedecisions are commonly attributed to students’ having low test scores or being ill-equipped to take on the

A-10
challenges of more rigorous coursework (Oakes, 1985; Romo and Falbo, 1996). Once tracked into theslower reading group—or lower math group—it is difficult, if not impossible, for students to evercompete with their peers who have become proficient in material to which the low-tracked students havenever even been exposed.
Like other resources in schools, however, the quality and quantity of counselors available tostudents differs greatly by income level and education of parents. McDonough (1997) has shown how thecounseling support provided in middle class schools operates to achieve quite different outcomes than forstudents in lower income schools—even when students present themselves with nearly identicalqualifications. In the lower income school, aspirations are also often lower, and students are channeledinto less prestigious institutions than those for which they may qualify. A student with similar academicpreparation in a middle class school is much more likely to be urged to reach for more selective schools—and helped to do so (McDonough, 1997).
A relatively new feature on the educational landscape is the mushrooming business ofprivate, for-hire college counseling. Parents with sufficient means have increasingly been paying forcounseling services outside the schools. These private counselors can increase a student’s chances ofbeing selected into competitive colleges by advising on effective application strategies, as well as increasethe chances of even mediocre students finding colleges that meet their needs ( McDonough, Korn, andYamasaki, 1997; Douglas, 1989). Low-income and minority students are less likely to be able to availthemselves of these services.
Dropping Out of School
Dropout rates for underrepresented students are much higher than for white and Asianstudents, and this is especially true for Hispanics. The National Center for Education Statistics (NCES)reports that the high school dropout rate in 1995 was 8.6 percent for white students, but 12.1 percent forblack students, and 30 percent for Hispanics in the 16- to 24-year-old age cohort (U.S. Department ofEducation, 1997a). The Native American dropout rate appears to be about 30 percent as well, althoughthese data are estimates and accurate counts for this population are difficult to obtain (Swisher andHoisch, 1992).
Social and academic integration into school are two factors that have been consistentlyassociated with persistence in both high school and college. Students who are active in extracurricularactivities and who have meaningful relationships with both other students and faculty are less likely todrop out of school than students who do not participate in such activities or have such relationships(Mahoney and Cairns, 1997). This is probably one reason why mobility has such negative effects onstudent persistence: it is difficult for many students to reestablish relationships and group affiliations ineach new school to which they are assigned. Adolescents, in particular, are notoriously peer-oriented, andit can be difficult for a new student to enter into already-established friendship groups.
Fine (1991), however, has questioned to what extent low-income and underrepresentedminority students actually choose to drop out of school and to what extent this is a choice made forthem—either by a system that is anxious to be rid of them, or by school personnel who are so indifferentto their needs that some students find little point and few, if any, rewards in staying. There is both a pushand pull effect in the phenomenon of exiting school before graduation. Schools push some students out.Pull factors also contribute to disengagement from school. One significant pull factor is primaryfriendships outside of school, particularly when these friends are school dropouts; students withsignificant friendships with peers who have left school are more likely to leave school themselves(Epstein and Karweit, 1983; Rumberger, 1981). Another pull factor is employment that intrudes on both

A-11
time to study and to attend classes. Students who are employed more than 20 hours per week are at highrisk for having lower grades and less engagement with school, which in turn increases their risk ofdropping out of school (Steinberg, 1996).
Financial Constraints
Even if underrepresented students had no other impediments to accessing higher education,financial constraints would continue to be a major factor in their postsecondary choices. While there issome debate over the role of financial constraints as a major factor in students leaving college (Tinto,1987), there is little debate that it is critical in deciding whether or not a young person will go to college atall (Adelman, 1999; Cabrera, Stempen, and Hansen, 1992). Low-income students are significantly lesslikely to attend college than upper income students, even when their test scores are similar. Akerhielm etal. (1998) found that within the top test score group of the NELS:88 achievement test, 75 percent of low-income, 86 percent of middle-income, and 95 percent of high-income students went on to college. Stateddifferently, one out of every four high school graduates scoring at the top of their class, but coming froma low-income family, did not go to college.
The cost of a college education encompasses more than the cost of tuition for young peoplefrom low-income families. Potential students must also weigh heavily the costs of unearned income, andthe reality that they will not be able to help their families financially while they are in college. Even ifcollege costs are covered by grants and/or loans, it can be a difficult decision for some low-income youthto give up helping their families at an age when they can be productive wage earners. In a study of highachieving, low-income Chicano students, Gándara (1995) found that it was relatively common for oldersiblings to forgo college in favor of work so that younger siblings might have the opportunity to study asfamily finances were augmented by the incomes of the older siblings.
Some students, and their families, may take themselves out of the running for highereducation based on perceptions that do not fit reality. For example, research shows that many students areunclear about the costs of a college education and about the options that exist for paying college tuition(Akerhielm et al., 1998). “Sticker shock” has been shown to scare off some low-income students wholack adequate information about grants and loans that can make college possible, or who fear going intodebt for school because it is perceived as too burdensome on the family (Gándara et al., 1998; Teranishi,2000). Moreover, students tend to overestimate the costs of college, imagining an even greater barrierthan actually exists (King, 1996). That is, more low-income students can be expected to enroll in collegeif it does not require that they burden themselves and their families with debt in order to do so (St. John,1990; 1994).
The average cost of attending college has increased substantially. For example, at publiccolleges and universities tuition and fees have risen by 114 percent and 113 percent (in current dollars),respectively, in the decade from 1988-89 to 1998-99. During the same period, however, aid for full-time-equivalent students rose 68 percent, and the maximum Pell grant award, considered the foundation of thefederal student aid program, lost 15 percent of its purchasing power (College Board, 1999a). Financialaid, in the form of grants, has failed to keep up with rising college costs. The decreasing real-dollarbenefits of Pell grants, and the increasing shift from grants to loans, has served to make the financing ofhigher education more and more difficult for low-income minority families (College Board, 1999a). Formany students, this means that they either opt out of college altogether or restrict their choices to localstate or community colleges (Gándara et al., 1998; Teranishi, 2000; Thomas, 1998). While the latterstrategy would appear to be better than the former, data show consistently that the less selective theinstitution a student attends, the lower is the probability that the student will complete a bachelor’s degree(U.S. Department of Education, 1999).

A-12
APPENDIX B
List of Programs for Which Information Was Submitted

B-1
State Program Program Source Evaluation*
AK Arkansas Academic Challenge Governor’sScholars Program State initiative No
AL BioPrep**
CA Early Academic Outreach Program University of CA NoMonterey Bay Education Consortium (MBEC) Multiple NoMinorities in Engineering & Sciences (MESA) U of CA/CSU NoNeighborhood Academic Initiative (NAI) U of Southern CA YesAISES NoAdvancement Via Individual Determination(AVID) SD County schools YesStep to College and Mission to College San Francisco St. U NoProject Step University of CA NoPuente Project University of CA YesCollege Pathways** FoundationCollege Kids Foundation No
CT Minority Achievement Program (MAP) State initiative NoCollegiate Awareness Preparation (CONCAP) CT Public schools NoMinority Enrollment Incentive Program (MEIP) NoCT College Access and Success (CONCAS) NoCollege Admission and Bridge Program (COMCAB) NoMinority Staff Development & Recruitment Program No
FED Upward Bound/TRIO YesStudent Support Services /TRIO NoTalent Search/TRIO NoGear Up No
FL College Reach Out Program (CROP) State initiative Yes
IL College Futures Program State initiative NoParkland College Program State initiative NoExpanding Cultural Diversity Project State initiative NoTransfer Centers (27) State initiative NoEarly Outreach Program** University of ILKing-Chávez-Parks Yes
IN Indiana Career and Postsecondary Advance-ment Program (ICPAP) State initiative Yes21st Century Scholars Program State initiative No
KY Governor’s Minority Student CollegePreparation Program State initiative No

B-2
State Program Program Source Evaluation*
LA Stress on Analytical Reasoning (SOAR) Xavier University No
MA Transitional Year Program Brandeis U NoThe Education Resources Institute (TERI):
Kids to College (K2C) NoA Better Chance Foundation Yes
MD Baltimore College Bound Program No
MI A+ Schools Program State initiative NoDetroit Area Pre-college Engineering (DAPCEP) No
MN Postsecondary Enrollment Options Program (PEOP) State initiative Yes
MO Health Careers Opportunity Program University of MO NoINPSYCH University of MO NoMORE Energy Camp University of MO NoSTEP Bridge University of MO NoExpanding Your Horizons University of MO NoEngineering Minority Program University of MO NoAmerican Indian Research Opportunities University of MO NoMontana Apprenticeship Program University of MO NoMinority Intellectual Network University of MO NoScience and Engineering for All:
Opening the Door for Rural Women University of MO NoEducational Talent Search State initiative NoTribal College/High Plains Rural System Initiative No
NJ New Jersey College Bound Program State initiative Yes
NY Goodard Riverside Community Center NoOPTIONS Center for Educational andCareer Choice NoReadiness Program Settlement College NoI Have a Dream (and national) Foundation YesPrep for Prep Foundation NoThe Posse Program Foundation YesCollege Now** Kingsborough Com Coll
OK Oklahoma Higher Learning Access Program(OHLAP) State initiative Yes
PA Quantum Opportunities Program No

B-3
State Program Program Source Evaluation*
RI Access to Opportunity Comm Coll of RI NoAdvanced Training for Empowerment &Self-esteem (AT EAST) URI/CCE NoGateway Program URI/CCE NoThe College Readiness Program URI NoGuaranteed Admission Program URI NoProject Discovery URI NoSpecial Programs for Talent Development URI NoGetting to College Public Education Fund NoKids Health Career Alliance Public Education Fund NoLearning Enhancement for AdultsProgram (LEAP) URI/Foundation NoPre-college Enrichment Program Brown University NoPreparatory Enrollment Program (PEP) RI College NoLiteracy Initiative for Newport Kids ( LINK) Salve Regina College NoProvidence Summer Bridge NoRI Children’s Crusade for Higher Education NoRI Educational Enrichment Program (RIEEP) NoRI Educational Opportunity Center (RIEOC) NoRI Educational Talent Search NoSPHERE Comm Coll of RI NoTimes2 (Times Squared) No
TX Academic Excellence Awards University of Texas NoGateway Program University of Texas NoTexPrep Engineering Program University of Texas NoACT/PLAN/EXPLORE University of Texas NoSupplemental Instruction University of Texas NoMaverick Scholars Program UT Arlington NoProject GRAD Public Schls/Foundtn Yes
VA Better Information Project State initiative NoEarly Identification Program (EIP) George Mason U Reviewed
WI Wisconsin Educational Opportunity Programs State initiative YesEarly Identification Program (EIP) State initiative NoMinority Pre-college Program State initiative NoPreschool to Grade 5 (P-5) State initiative No
Multiple States: General Electric College Bound Business sponsor Yes
* A “yes” in this column means that the program produced an evaluation that met the authors’ criteria for minimal rigor; an assessmentof student outcomes through use of systematic controls or comparison groups and/or data collected on individual students that yielded insight intothe program’s effects. A “no” does necessarily mean that no such evaluation has been conducted, only that it was not made available to us.
** These programs had been reviewed by other researchers; while their reviews were generally informative, they fell short of being actualevaluations.

APPENDIX C
Brief Descriptions of Programs

Name anddate founded State Funding Main components Student eligibility Mission/goals Data Program description
The PosseProgram(1989)
NY Foundationsupport,privatecontributions,universitypartners,some federalfunding
• Alternativerecruitmentstrategy
• 34-week pre-college trainingprogram
• Team/posse• Scholarship• Mentor• On-campus
program• Faculty
involvement• Charge/mission
High school seniors ofdiverse backgroundsfrom New York Citypublic schools
• To broaden theapplicant poolconsidered byelite collegesanduniversities; getmore studentsfrom diversebackgroundsinto topinstitutions ofhighereducation.
• To help theseinstitutionswork oncreating a morediverse campusenvironment.
• To graduatemore studentsfrom diversebackgroundsfrom selectivecolleges anduniversities sothey can take onleadershippositions in theworkforce.
Dr. CarolBonillaBowmanand Dr.EdmundGordon;Conno-seurialEvalua-tion,1997-98
The Posse Program was createdas a response to the manytalented students from city highschools who went to collegeonly to drop out months later.When one student said, “if I hadmy posse with me I neverwould have dropped out,” ThePosse Program was born.
175 students, in teams of 10,have been placed into 6 partnerinstitutions: Brandeis, DePauw,Lehigh, Middlebury, Rice, andVanderbilt. These institutionshave awarded Posse scholarsalmost $14 million in leadershipscholarships.
Students are recruited frompublic schools. Studentsparticipate in a 34-week trainingcurriculum, which focuses onleadership development,academic enrichment, andcross-cultural communications.Students work with a graduatestudent mentor once on campus.
The Posse Program is one effortto help universities work onissues of diversity despite thenation’s backlash to affirmativeaction.
C-1

Name anddate founded State Funding Main components Student eligibility Mission/goals Data Program description
A BetterChance(ABC)(1963)
NY Corporate,foundation,and privatedonations
• Recruitmentstrategy thatidentifies,screens,evaluates, andrefers studentsto schools
• Assistance toschools inadditionalminorityrecruitmentefforts
• Works directlywith students tohelp duringtransition period
• “Motivates”students[unclear]
• Exposesstudents to“appropriateopportunities”
• Advocacy• Volunteer
recruiters
Minority students justabout to enter highschool.
• “Provideeducationalopportunities tominoritystudents withthe talent andpotential toexcel…”
• “Provideassistance andguidance tothese schools,students andtheir families toensure the bestpossiblelearning andsocializationexperiences…”
• “To providedirect academicand careerdevelopmentassistance tostudents… andto generateopportunitiesand support fordevelopment ofthese studentsin the corporateand pubicsectors.”
1983survey ofalumni of ABetterChance:Sylvia T.John –PrincipalInvestigator(submittedto the FordFounda-tion),InternalProgramReview,1990;severalpublishedarticleswritten bycurrentpresident
National program that findstalented minority students –mostly from inner cityneighborhoods – and placesthem at highly selectivepreparatory schools.
Volunteer recruiters scoutminority neighborhoods to findstudents who have talent andpotential for academicexcellence. [note: the describedrecruitment and assessmentstrategy in the literature is not“alternative” but quite standard– including SATs and schoolacademic performance althoughABC claims to use “alternative”measures.]
Students are selected rightbefore they enter high school.While most are placed in privateprep schools, some go toselected public schools. Thelatter often stay in “ABCHouses” where 6-10 ABCstudents live while attending thehigh school.
C-2

Name anddate founded State Funding Main components Student eligibility Mission/goals Data Program description
Detroit AreaPre-CollegeEngineeringProgram(DAPCEP)(1976)
MI Annualcorporategifts,governmentsupport, in-kind supportfrom Detroitpublicschools,Detroit UrbanSystemicInitiative:NSF subgrant,Black UnitedFund/Combined FederatedCampaign:contributionsfrom federalemployees
Alsoestablishinganendowmentfund.
$3.6 millionbudget fundedby local, state,and federalsources, and21 localcorps.
• In-schoolclasses
• Saturday andsummer“enrichment”programs
• Teacher training• Partnerships
withcorporations,government andeducationalleaders
• Active parentgroup
Black, Hispanic, andNative American middleand high school studentswho are academicallyprepared and motivated
• To increase thenumbers ofblack, Hispanic,and NativeAmericanmiddle schooland high schoolstudents whoare “motivatedandacademicallyprepared topursue careersin the science,engineering,andmathematics-related fields”
StudentTrackingReport:summaryoffindings1976-1996;annualreport
DAPCEP reaches over 5,000students in grades 5-12,involving them in engineeringand science enrichmentprograms. DAPCEP also servesover 500 students in grades 6-12 and almost 3,000 studentswith its Saturday program(grades 5-12). DAPCAP serves2,000 students in grades 7-12.
“Community partnerships withlocal corporations, universities,and the Detroit Public Schoolsprovide diverse programming.”
A parent advisory committeeoffers seminars, scholarships tocollege, and open houses, andsponsors a Teen Club.
C-3

Name anddate founded State Funding Main components Student eligibility Mission/goals Data Program description
OklahomaHigherLearningAccessProgram(OHLAP)(1992)
OK OklahomaStateLegislatureFund
• Scholarships• Scholarship
informationdisseminationprogram
• Requirements ofapplicantsinclude goodschoolattendance, goodGPA, nosubstance abuse,no involvementin crime ordelinquent acts
9th and 10th gradestudents who could dowell in college butwhose families’ yearlyincome is $24,000 orless
• To ensure thatstudents whomeet the criteriaare providedwith financialassistance tohelp relieve theburden ofpaying forcollege
1997-98Year-EndReport
State legislation passed in July1992 established a fund to helpstudents with financial needattend college. Attached to theapplication for financialassistance are requirements tostay away from trouble (drugsand crime) and to pursueacademic success in school.
C-4

Name anddate founded State Funding Main components Student eligibility Mission/goals Data Program description
CollegeReach-OutProgram(1992)
FL Provided bythe GeneralAppropria-tions Act
An annualallocation tothePostsecondaryEducationPlanningCommission,whichprovides anannualprogramevaluation, isrequired
• Recruitsstudents
• Provides“academicenrichmentactivities”
• Careercounseling
• Personalcounseling [usestutors, teachers,and counselors]
• “Competitiveaward programgivingpreference toconsortiainvolving two ormore collegesand universities,projects thatsecure matchinggrant funds…”
• Coordinatedefforts betweencolleges andschools
• Parentalinvolvement
Low-incomeeducationallydisadvantaged studentsin grades 6-12
Seeks students whowould not haveconsidered admission tocommunity college, stateuniversity, orindependent institutionsof higher education“without special supportand recruitment efforts”
• “To increasethe number oflow-incomeeducationallydisadvantagedstudents ingrades 6-12who, upon highschoolgraduation, areadmitted to andsuccessfullycomplete post-secondaryeducation"
StatewideEvaluationofFlorida’sCollegeReach-OutProgramAnnualReport:1995-96Cohort
CROP is a program designed toprovide support to students whonormally would not haveconsidered college. CROP triesto “strengthen the educationalmotivation and preparation oflow-income and educationallydisadvantaged students” frommiddle and high schools.
Students are recruited into theprogram, which offersacademic, career, and personal“enrichment” activities.Partnerships between collegesand schools are encouraged, butindividual institutions can applyfor project funding.C
-5

Name anddate founded State Funding Main components Student eligibility Mission/goals Data Program description
I Have ADream(1981)
NYbased,butnation-widenetworkofprojects
Individualsponsors mustinitiate eachprogram;some obtainfoundation,corporate,governmental,andcommunitydonations.
• Sponsor-mentors
• Adopted class orgroup ofstudents(between 50 and100)
• Promisedfinancial aid forcollege
• Personal, year-round supportfrom elementaryschool throughhigh school
• “Socialintervention”programs
• Cultural and artseducation
• Advocacy andpolicy work“aimed atreversing thetrend of losingyouth to ourtroubled streets”
• College anduniversitypartnershipswith IHAD(e.g., summercamps)
• Corporatepartnerships(e.g.,internships)
Usually 8- to 9-year-oldchildren in elementaryschool in public housingdevelopments
• To helpsponsoredstudentsachieve their“dreams” andbecomeproductivecitizens
• “It is IHAD’sgoal that everyDreamergraduate fromhigh schoolfunctionallyliterate andprepared eitherfor furthereducation or forfulfillingemployment."
.
“The Roleof SocialCapital inYouthDevelop-ment: TheCase of ‘IHave ADream,”JosephKahneand KimBailey;“Beatingthe Odds:How thePoor GettoCollege,”ArthurLevineand JanaNidiffer;Newsclips
Provides long-term financial,academic, and social supportbeginning in 6th grade toenhance high school graduationrates and encourage attendanceand completion of college.
There are 160 IHAD projects in57 cities.
C-6

Name anddate founded State Funding Main components Student eligibility Mission/goals Data Program description
TexPrep:TexasPreCollegeEngineeringProgram(1979)
TX In-kind“manpower”from variouspublic andprivate sectoragencies andinstitutions:local, state,and nationalcolleges anduniversities;militarycommands;State ofTexas; TexasHigherEducationCoordinatingBoardEisenhowerProgram;NASA, U.S.Dept. ofEnergy; othergov. agencies;public andprivateindustry;professionalorganizations;individuals;local schoolsystems; andSYETPsponsors
• Intensivesummerprogram
• Classes• Field trips• Guest speakers• School
universitypartnerships
• Classassignments andlaboratoryprojects
• Scheduledexaminationsand final grades
Different sites haveslightly differenteligibility requirementsbut many students comefrom low-income,minority families
No tuition or fee ischarged.
• Identify andofferacademicenrichmentopportunitiesfor middleand highschoolstudents with“high ability”who want topursue careersin science,math orengineering
“The TexasPrefreshmanEngineeringProgram:Filling thePipeline forWorkforceDiversity,”Manuel P.Berriozabal
The Texas PrefreshmanEngineering Program consistsof community and 4-yearcolleges working with middleand high school students tobetter prepare these students forscience, math, and engineeringcareers. There are severalprograms across the state.Summer programs focus onabstract reasoning, problemsolving, and career options, andinclude guest speakers, fieldtrips, and academic courses.
C-7

Name anddate founded State Funding Main components Student eligibility Mission/goals Data Program description
NJ CollegeBoundProgram(1986)
NJ $2.9 millionannual stateappropriation(part of theGovernor’sbudget)
• Academicclasses
• Summerprograms
• Counseling• Mentoring• Tutors• Parent
involvement• Career
exploration• Middle school
programs
“Urban/minority youth”grades 6-12 who are“historically underservedor underrepresented andwho are located in‘special needs’ schooldistricts as identified inthe 1990 QualityEducation Act”
• To providesupport in theform of grantsto precollege“educationalenrichmentactivities” thathelp to ensurehigh schoolgraduation andthe pursuit ofcollege inscience, math,and technology
“Evaluationof the NewJerseyCollegeBoundProgram:1997,” CarolF. Stoel(Sponsoredby the NJCommissionon HigherEd.)
The program exists at 13 sites inNJ colleges and universities.Grants are provided by the NJCommission on Higher Ed withfunds from the Governor’soffice to enhance academicachievement in the sciences inmiddle and secondary schools.Grants range from $42,400 to$938,700. Money goes to on-campus programs that includeacademic and support servicesfor underserved minoritystudents. Programs andprogram missions vary byinstitution. All programs haveacademic enhancementinitiatives, some involveparents, some are during thesummer – but most are duringthe academic year, some havecollege counselors and mentors.
C-8

Name anddate founded State Funding Main components Student eligibility Mission/goals Data Program description
Post-secondaryEnrollmentOptionsProgram(1985)
MN 1985 StateLegislaturecreatedprogram –part of theGovernor’s“Access toExcellence”school reformpackage
• College courses• Scholarship
assistance• College credits• Puts resources in
the hands ofhigh schoolstudents andparents ratherthan secondaryschooladministrators
• Credit forcollege courses
• Createsopportunities forhigh schoolstudents andsome adults totake collegecourses
• Admissioncontrolled bycolleges to theircourses
High school juniors andseniors enrolled in MNpublic schools or adults21 years or older who donot have high schooldegree
• Provideopportunity foracademicadvancementand encourage“rigorousacademicpursuits” forhigh schooljuniors andseniors byhaving themattend post-secondaryclasses at “stateexpense”
• “Promoterigorousacademicpursuits andprovide avariety ofoptions for 11th
and 12th gradestudents bygiving them anopportunity totakepostsecondaryclasses at stateexpense”
• Make schoolsmoreresponsive tostudent needsand interests
Postsecon-daryEnrollmentOptionsProgram,3/1996ProgramEvaluationDivision,Office oftheLegislativeAuditor,State ofMinnesota
In order to offer high schoolstudents more challenging andvaried courses, the state ofMinnesota provides funding forstudents to take classes incolleges or universities of theirchoice. These institutionsinclude private colleges,nonprofit vocational schools,and “accredited opportunitiesindustrialization centers.”Funding is re-allocated from thesecondary school to thepostsecondary school, andstudents receive postsecondarycredits.
C-9

Name and datefounded State Funding Main components Student eligibility Mission/goals Data Program description
NeighborhoodAcademicInitiative(1991)
CA University ofSouthernCalifornia;foundations
• Neighborhoodinitiative
• Parentinvolvement
• Daily classes• Saturday classes• Counseling• Mentoring• Scholarships to
USC• Recruitment/
SelectionProcess
• Mission“students asscholars”
Low-income studentsfrom the communitysurrounding USC(heavily Hispanic andblack) who expressdesire to go to college
• “Untracking”students whohave beentraditionallylabeled “at risk”and helpingthem to achieveacademically
“TrackingSchoolSuccess:PreparingLowIncomeUrbanYouth forCollege,”WilliamG. Tierney
NAI takes 40 7th grade studentseach year and works with themuntil they graduate from highschool. Students are selectedbecause of their “willingness tolearn” and parent commitmentto them as “scholar.”
Students attend a 2-hour class inmath and English every daybefore the regular school daystarts and 4-hour Saturdayacademies where they focus oncomputer literacy, study skillsand “socioemotional issues.”Parents also take part in anumber of Saturday morningsessions.
Students meet twice weeklywith tutors. Counseling is a bigpart of NAI. Students receivehelp with college applications,tests, etc. If students meetentrance criteria, they canreceive scholarships to USC.
C-10

Name anddate founded State Funding Main components Student eligibility Mission/goals Data Program description
Kids toCollegeprogram(K2C)(1992)
MA Private/SallieMae
• Day trip tocolleges
• College-schoolpartnership
6th graders attendingselected schools in MA
• School-basedinitiative with acurriculum thatintroduces 6th
graders tocollegecampuses“arming themwithinformation andresources tomake the goalof going tocollege areality.” Thisprogram hopesto raise“students’expectationsabout going tocollege andabout careerpossibilities.”
None Schools and colleges are pairedbased on location and 6th gradeclasses of students are exposedto higher education throughspecial curriculum materialsand activities. These activitiesinclude visiting a collegecampus. The program is run byThe Education ResourcesInstitute (TERI), but is acollaboration between theHigher Education InformationCenter, the Association ofIndependent Colleges andUniversities in MA, theEducational OpportunitiesCenter in Worcester andSpringfield, the Lowell EarlyAwareness Program, and SallieMae.
C-11

Name and datefounded State Funding Main components Student eligibility Mission/goals Data Program description
MilwaukeeParentalChoiceProgram(1990)
WI Public (stateand federal)
• Scholarships• School Choice
Family income below 1.75times the national povertyline.
• Publicly fundedschool voucherprogram toincreaseschooling optionsfor low-incomefamilies and toincrease schoolcompletion rates.
CeleliaElenaRouse,PrincetonUniversity,and NBERJanuary1998
Publicly funded school voucherprogram to increase schoolingoptions for low-income familiesand to increase school completionrates. Funding of public schoolsis related to number of students.Provides incentive for schools toimprove, raises the level ofeducation.
C-12
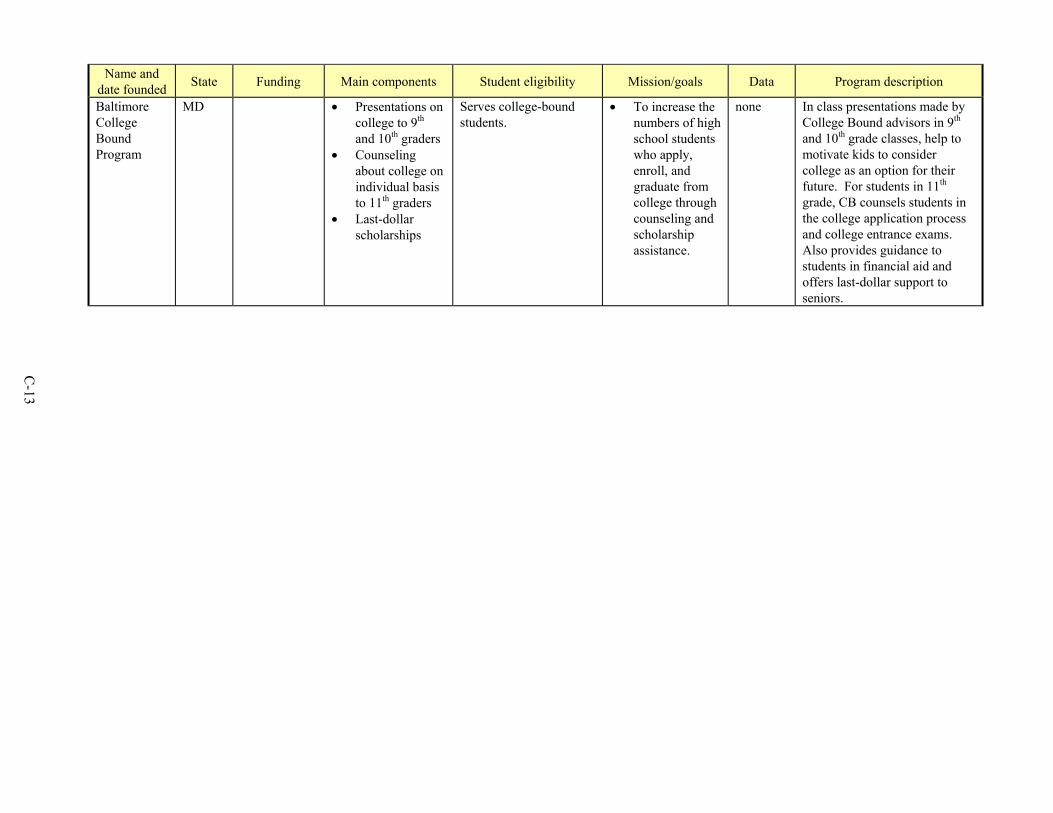
Name anddate founded State Funding Main components Student eligibility Mission/goals Data Program description
BaltimoreCollegeBoundProgram
MD • Presentations oncollege to 9th
and 10th graders• Counseling
about college onindividual basisto 11th graders
• Last-dollarscholarships
Serves college-boundstudents.
• To increase thenumbers of highschool studentswho apply,enroll, andgraduate fromcollege throughcounseling andscholarshipassistance.
none In class presentations made byCollege Bound advisors in 9th
and 10th grade classes, help tomotivate kids to considercollege as an option for theirfuture. For students in 11th
grade, CB counsels students inthe college application processand college entrance exams.Also provides guidance tostudents in financial aid andoffers last-dollar support toseniors.
C-13

Name anddate founded State Funding Main components Student eligibility Mission/goals Data Program description
MartinLuther KingJr.-CesarChavez-Rosa ParksInitiative(1986)
MI State • Exposure tocollegelife/housing
• Exposure tocollegeacademics
• Informationcounseling
• Travel money• Bridge program
Public school studentsgrades 6-11
• “Enrollment ofa significantnumber ofAfricanAmerican,Latino, andNativeAmericanstudents incollegepreparatorycourse in the 35targeted schooldistricts inMichigan.”
BoyneCountyResearchServices1995
1. College Day Program –introduction for secondarystudents and parents tocollege campuses andinformation. Each studentspends a day, overnight, orseveral days on a collegecampus and receivesinformation about collegeand university options.
2. Select Student SupportServices – funding foruniversities to developretention programs.
3. Visiting Professor Program– funding to universities tobring in scholars.
4. Future Faculty Program –develop diverse faculty forsecondary schools.
C-14

Name anddate founded State Funding Main components Student eligibility Mission/goals Data Program description
Prep for Prep(1976)
NY Fundedentirelythroughprivatedonationsfromcorporations,foundationsand individualsponsors
• Network ofelementary andjunior highschools used torecruit students
• Two 7-weeksummer sessions
• After-schoolWednesday andall-day Saturdayclasses duringthe school year
• Placement inindependentschools (36 dayschools and 10boardingschools)
• Scholarships• Post-placement
counseling andactivities
• Leadershipdevelopment(personal,academic andcollegecounseling)
• Campus visitsfor 11th and 12th
graders
Underrepresented(minority) junior highschool students andelementary schoolstudents
• To develop theleadershippotential ofyoung peoplefromunderrepresentedgroups in societyby identifyingtalented studentsand placing themin independentschools – with asupport program
none Each year 155 fifth graders and60 seventh graders are admittedinto day schools and boardingschools, respectively. Prep triesto provide talented youngstudents with a challengingacademic experience and thesupplementary support neededfor them to excel in school.
C-15

Name anddate founded State Funding Main components Student eligibility Mission/goals Data Program description
CollegeBoundProgram(1989)
National GeneralElectric
• Grants made toschools to workon increasingcollege-goingrates of students
• Volunteers fromGE
• Counseling• Mentoring• Test preparation• Campus visits• “Job
shadowing”• Supplemental
instruction• Tutoring• Special
academiccourses
• Saturdayworkshops
• Curriculumreform
(components listedabove varied byschool)
At-risk students(although this varied byschool)
• To increase thecollege-goingrate at 11schoolsreceivingCollege Boundgrants from GE
“RANDFormativeAssessment,”Susan J.Bodilly,Susanna W.Purnell, andPaul T. Hill
College Bound is a grantprogram intended to increasethe college-going rate at 11 highschools situated near GEfacilities in the U.S.Participating schools agree todouble or significantly increasethe college-going rate for aparticular group of students.Each program includesvolunteers recruited from thenearby GE facilities.
C-16

Name and datefounded State Funding Main components Student eligibility Mission/goals Data Program description
Summerbridge(1978)
National Privatelyfunded:foundations,corporations,and individualsponsors
• Six-week, full-time, academicsummerprogram
• After school orweekendsupportthroughoutschool year
• Tutoring• Mentoring• Academic
counseling andadvocacy
“Motivated elementaryand middle schoolstudents with limitededucationalopportunities”
• “To empowerstudents tosucceed inrigorousacademic highschoolprograms thatwill enablethem to attendstrongcolleges”
• “To empowerhigh school andcollege studentsto fullyexperience thechallenges,exhilaration andrealities ofteaching”
• “To empowerall students totake ownershipof theireducation andbecome leaderswithin theirprograms andschools”
none Volunteer high school andcollege-age students leadclasses that provide youngerstudent participants withchallenging academicexperience. Students are givenhomework and exams. Programis free to all participants.Classes are conducted inphysics, literature, AfricanAmerican history, Japanese, andother subjects. The intention isto get students excited aboutlearning and about teaching.
There are currently 38Summerbridge programs.C
-17

Name anddate founded State Funding Main components Student eligibility Mission/goals Data Program description
UrbanPartnershipProgram(1989)
national FIPSE; FordFoundation
Partnerships betweeninstitutions of highereducation and publicschools
Varies by project “To broadenpostsecondaryopportunities for at-risk students withcollege potential andto do so in a waythat fosters systemicchange”
none The program supportspartnerships among schools,colleges and universities,parents, and the community. Itidentifies and supports “feederpatterns that connect primary,middle and secondary schoolswith one another and withcolleges and universities.”
C-18

Name anddate founded State Funding Main components Student eligibility Mission/goals Data Program description
GainingEarlyAwarenessandReadinessforUndergrad-uatePrograms(Gear Up)(1998)
national U.S.Departmentof Education;FordFoundation;NationalCenter forUrbanPartnerships
• Technicalassistanceworkshops
• Onlineinformationresources
• After schoolprograms
• College visits• Academic
enrichment• Partnerships
betweencolleges andjunior highschools
• Mentoring• Tutoring• Counseling
Low-income youth inmiddle schools
• “To encouragemore youngpeople to havehighexpectations,stay in school,study hard andtake the rightcourses to go tocollege”
none Gear Up encourages colleges topartner with middle schools inlow-income communities tobetter prepare kids for college.Gear Up is a competitive grantsprogram.
C-19

Name anddate founded State Funding Main components Student eligibility Mission/goals Data Program description
College Kids(1994)
CA Foundation,corporate,individualsponsors
• After-schoolprograms
• Academicenrichment inmath, socialstudies,language arts,and science
• Parentvolunteers
• College prepcurriculum
• Parent programs• Mentoring
(connectingstudents toyoungprofessionals)
Low-income students • To help youngpeople fromlow-incomebackgrounds togain access tocollege
none College Institutes are led byparents, community leaders,university faculty, businessleaders, or elementary schoolfaculty. These institutes offerstudents a chance to improvetheir chances of attendingcollege by providing academicand social enrichment activitiesand classes.
Three College Kids sites exist –Los Angeles, San Mateo, andSan Diego.
Programs involve hands-on,interactive, and small grouplearning environments.C
-20

Name anddate founded State Funding Main components Student eligibility Mission/goals Data Program description
MontereyBayEducationConsortium(MBEC)
CA UC SantaCruz, KelloggFoundation,Bank ofAmerica(somesupporters)
• Provides criticalinformation toparents,teachers, andcommunitypartners to helpchildren worktoward college
• Ongoingevaluation
• Curriculumdevelopment(see “KidsAround theUniversity”
• Communityinvolvement
• Website
All students in theMonterey Bay area
• To increase the“levels ofeducationalattainment of allstudents in theregion” of theMonterey Bayarea
none Focused on the Monterey Bayregion, MBEC tries to increasethe levels of “educationalattainment of all students in theregion.” The public institutionsof education in the area haveformed an alliance to work withyoung people.
C-21

Name anddate founded State Funding Main components Student eligibility Mission/goals Data Program description
EarlyIdentificationProgram(1982)
WI WIDepartmentof PublicInstruction
• Academicenrichmentworkshops andskill building
• Parentalinvolvement
• “Curriculumguidance forminority anddisadvantagedmiddle schoolstudents”
• Pre-collegeprograms
• Careerexplorationprogram
• Counseling• Tutoring• ACT
preparation• Information
about collegeand financial aid
• Assistance withcollegeapplicationprocess andcitizenshiprequirements
• Annualrecognitionprograms
Minority anddisadvantaged middleschool and high schoolstudents
• “To identifypotentialacademicproblems beforethey arise andto recognizeacademicachievement”
• To helpstudentsachieve theircareer,employmentand collegegoals
• To reduce highschool attrition
none Students are selected in 8th
grade by guidance counselors tobe in the program. Studentsstay in the program until theygraduate from high school.
Parents, college and universitypersonnel, guidance counselors,teachers, administrators, cbos,and churches form a network tohelp students accessopportunities to advance theircareer and educational goals.
The program focuses mostly oncounseling and advising, and onproviding academic skillbuilding and enrichmentworkshops.
C-22

Name anddate founded State Funding Main components Student eligibility Mission/goals Data Program description
Stress onAnalyticalReasoning(SOAR) –one programof theSummerScienceAcademy forHigh SchoolStudents(1988)
LA XavierUniversity;outsidefoundationsupport andsponsorsincluding theHowardHughesMedicalInstitute, theBureau ofHealthProfessions,and theJoseph andFlorenceRobleeFoundation(donations arealso made byXavierfaculty)
• Residentialprogram
• Daily quizzes• “Rapid
turnaround” ingrading
• Problem solving• Two hours of
homework daily• Emphasis on
vocabulary andreading skills
• “Groupcompetitions” toencourage peersupport based onacademics
• Students asgroup leaders
• Student tutors• Parent
orientation• Weekly report
cards sent toparents
• Awardsceremony
• Social activities
Pre-college students(mostly black femalestudents apply.)
• To increase thenumbers ofblack studentsprepared forand enteringcollege in thescience fields
(SOAR originallybegan as an effort toreduce freshmanattrition rates inscience courses atXavier U. and toincrease theirsuccess in mathcourses.)
Biosciencearticle“Minorities inthe biologicalsciences – theXaviersuccess storyand someimplications,”JWCarmichaelJr., Deidre D.Labat,Jacqueline T.Hunter, J.Ann Privett,and John P.Sevenair
SOAR is a summer programthat focuses heavily onacademic skill building in orderto better prepare studentparticipants for college.
C-23

Name anddate founded State Funding Main components Student eligibility Mission/goals Data Program description
EarlyIdentificationProgram(EIP) (1987)
VA George MasonUniversity;schoolsuperintendent’soffice
• Summeracademicprogram
• School-yeartutoring
• Saturdayenrichment
• SAT prep• Parent
involvement• College
applicationassistance
High school studentswith “uneven academicrecords” who are at riskof “not successfullycompleting school” andmost will be first-generation collegestudents. EIP is targetedtoward minoritystudents.
• To help able butat-risk highschool studentssuccessfullycomplete highschool, apply toand be admittedat college
Westat“ReachingforCollege”casestudiesevaluationbook, 1992
Virginia’s EIP program is acollaborative program betweenGeorge Mason University andthe Fairfax County Publicschools, which works to helpdisadvantaged minoritystudents to pursue a collegeeducation. Students areidentified in the 8th grade andthen participate inprogramming that takes placeon the college campus.Teachers from the university aswell as from the public schoolsare paid to teach the summerand after school programs.Three local public schooldistricts are involved and eachdistrict has a coordinator.
C-24

Name anddate founded State Funding Main components Student eligibility Mission/goals Data Program description
College Now(1984)
NY State • CUNYplacement test
• College-levelcourses
• Remedialcourses
“Moderate achievers,”define as high schoolstudents whose averagesfall between 65 and 85(D and B).
• To ease thetransition fromhigh school tocollege formoderatelyachievingstudents whomay not haveconsideredcollege anoption
Westat“ReachingforCollege”casestudiesevaluationbook,1992
College Now is a partnershipbetween CUNY, KingsboroughCommunity College, and 17NYC public high schools. Theprogram assesses the level ofreadiness for college amonghigh school students who aremoderate achievers and thenprovides them with remedialand college-level courses tobetter prepare them for collegeand to ease the transition fromhigh school to college.
C-25

Name anddate founded State Funding Main components Student eligibility Mission/goals Data Program description
BiomedicalSciencesPreparationProgram(BioPrep)(1982)
AL University ofAlabama;public andprivatefunding
• Professionaldevelopment forteachers
• Campus visits• Assistance with
applications tocollege andfinancial aidforms
• Parentinvolvement
Disadvantaged rural highschool students “whoseschools lack a rigorouscollege-preparatorycurriculum”
• To helpdisadvantagedhigh schoolsstudents topursue a careerin medicine orhealth sciencesby providing acollege-prepcurriculum—with the hopethat thesestudents wouldreturn to theircommunities toestablish theircareers.
Westat“ReachingforCollege”casestudiesevaluationbook,1992
Students in BioPrep are selectedin 8th grade based on strongacademic performance andteacher recommendations.These students then participatein an accelerated corecurriculum (designed byBioPrep) through their highschool years. The universityprovides a summer program forthese students and the teacherswho teach the BioPrepcurriculum.
C-26

Name anddate founded State Funding Main components Student eligibility Mission/goals Data Program description
EarlyOutreachProgram(1980)
IL University,state, privateand corporatedonations;Mayor’soffice fundssummer jobprogram
• Saturdayacademicprogram
• Tutoring• Counseling• Financial aid• Parent
involvement• Assistance with
collegeapplications andforms
Junior high school andhigh school minoritystudents
• To encourageminoritystudents topursue collegeandprofessionalcareers
Westat“ReachingforCollege”casestudiesevaluationbook,1992
The focus of Early Outreach is aSaturday morning “college”program that provides classes inmath, science, engineering,writing, and public speaking.The program also has summerinstitutes, and offers careerdevelopment opportunities suchas internships and summer jobs.Early Outreach also employs aparent program that meets oncea month to hear guest speakers,plan events or raise money forscholarships. The program isbased at the University ofIllinois at Chicago.
C-27

Name anddate founded State Funding Main components Student eligibility Mission/goals Data Program description
Step toCollege/Mission toCollege(1985)
CA San FranciscoStateUniversity;some highschoolmoney; somefederal moneyfrom TitleVII; somefoundationsupport.
• College-levelclasses
• Tutoring• Counseling• Followup in
college• College prep
curriculum• Professional
development forfaculty
• Bilingualcurriculum/programs
Underrepresentedminority high schoolstudents
• To “create aculture ofcollege-going”among studentswho may notbelieve orrealize thatcollege is forthem
Westat“ReachingforCollege”casestudiesevaluationbook,1992
High school seniors takecollege-level classes for creditand younger students areinvolved in a variety of programactivities including “academicpreparation, cultural awareness,skill training, and socialsupport.” Some students whofinish the program later becometutors and peer counselors attheir former high schools.
C-28

Name anddate founded State Funding Main components Student eligibility Mission/goals Data Program description
Project Step(1981)
CA FIPSE;private andcorporatedonations/grants
• Partnership ofadministrators,college faculty,principals,teachers, parentsand students
• Curriculumdevelopment
• Professionaldevelopment
• Counseling• Tutoring
All students, “especiallyunderrepresentedminority students”
• To improveacademicpreparation ofall students inmath andscience
• To developteachers ofmath andscience
• To developeducationreform models
• To establishpermanentschool-collegepartnerships
Westat“ReachingforCollege”casestudiesevaluationbook,1992
Project Step finds funding todistribute to academic prepprograms in the district. Itencourages and supports thedevelopment of networks andpartnerships betweeneducational factions of thedistrict and promotes programsthat reflect the philosophy ofProject Step. The disseminationof information is a major part ofProject Step’s strategy.
C-29

Name anddate founded State Funding Main components Student eligibility Mission/goals Data Program description
21st CenturyScholarsProgram(1990)
IN State; LilyFoundation
• Scholarshipassistance;tuition free atpublicuniversities
• Funding is equalto public tuitionif student goesto privateinstitution
Indiana students • To reduce dropout rates
• To dramaticallyincrease thenumbers ofstudents inIndiana who goto college
• To reduce thecost barriers forlow-incomestudents
• To decreasedrug andalcohol use
• To improveeconomics inIndiana
Statewidedata onhigh schoolretention,collegepreparationandenrollment;scholarshipfundsexpended,student testscores; etc.
8th graders pledge “goodcitizenship” and are guaranteedthe cost of 4 years of college inan Indiana public college. If astudent chooses to attend aprivate Indiana college, thestudent will receive the sameamount of tuition as he would ifhe went to a public institution.
Described as a shift from“intensive” program to“extensive” intervention on thepart of the state. Private donors,such as Lily, are more engagedin the intensive aspects ofprogramming. The state utilizestechnology to gather data onstudents (including needsassessments given to students topinpoint their counseling needs)and to disseminate informationto schools and parents. Also,extensive investment in test feewaivers and scholarships forlow-income students (need-based) to reduce barriers forstudents who meet collegeentrance criteria.
C-30

Name and datefounded State Funding Main components Student eligibility Mission/goals Data Program description
Indiana Career&PostsecondaryAdvancementCenter(ICPAC)(1986)
IN State (LillyFoundationalso supportssome efforts)
• Extensiveinformationgathering anddisseminationsystem thatallows highschoolcounselors topinpoint needsof students andlink them toavailableservices. (LillyFoundationprovidesfunding for anumber ofprogramsprovidingintensiveservice.) Highaspirationscampaign andup to 100percentscholarships forlow-incomestudents.
• Toll-free hotline
Indiana students • To dramaticallyincrease thenumbers ofIndiana studentswho go on tohighereducation andto reduce thecost barriers forlow-incomestudents.
Statewidedata on highschoolretention,collegepreparationandenrollment;
Scholarshipfundsexpended,student testscores, etc.
Described as a shift from"intensive" program to"extensive" intervention on thepart of the state. Private donors,such as Lilly, are more engagedin the intensive aspects ofprogramming. The state utilizestechnology to gather data onstudents (including needassessments given to students topinpoint their counseling needs)and disseminate it to schoolsand parents. Also, extensiveinvestment in test fee waiversand scholarships for low-income students (need-based) toreduce barriers for students whomeet college entrance criteria.C
-31

Name anddate founded State Funding Main components Student eligibility Mission/goals Data Program description
Project Grad(1993)
TX Houstonschooldistrict;considerablecorporatesponsorship
• Consistencymanagement &cooperativediscipline(CMCD)
• Move it Math(MIM)
• University ofChicagoSecondary Mathprogram
• Success for All& CooperativeIntegratedReading andComprehension(CIRC)
• Cities in Schools• Scholarship
program
Entire feeder schoolnetwork. three now inprogram includingelementary, middle, andhigh schools
“Produce college-bound high schoolgraduates ofdistinction.” Lovefor learning, highacademicexpectations,strengthened skills,and ultimatelycollege attendance.
Annualevaluationsinclude pre-post data onschoolclimatemeasuresand studentoutcomeswithcomparisonschools onTAAS andStanford 9,high schoolgraduationand collegematriculationdata
Comprehensive program beginsin first grade, builds students’academic skills and focuses onteaching students self-regulationand motivation (classroommanagement). Program thenmoves into middle school math.
Cities in Schools providessocial support services forfamilies.
At the high school level, theprimary program element is thescholarship program, includingvisitations to children’s homesby community volunteers; andscholarships.C
-32

Name anddate founded State Funding Main components Student eligibility Mission/goals Data Program description
Puente(1993)
CA State,University ofCA, and somefoundation.
Per-studentcost about$500 perannum
• 2-year Englishclass
• 4-year counselordaily
• Mentoring• Classes• Field trips
Targets full range ofstudents who exhibitdesire to go to college.Students must have goodschool attendance.Entering GPAs rangefrom 1.6. to 4.0.
Increase thenumbers of Chicanostudents going on to4-year college andincrease theircompetitiveeligibility for UC
4-yearevaluationincludingmatchedcontrolscomparingretention,GPA,collegeprepcourses,andcollegeenroll-ment.Statewidedata onattitudestowardschool,higher ed.
Students are selected asincoming freshmen and attend a2-year college prep Englishprogram with the same cohortand teacher. The programfocuses on writing skills andincorporates Latino literature.Program counselors ensure thatstudents take college prepcourses, learn about test takingand are prepared for college.Program includes field trips tocolleges, speakers, etc. There isalso a community mentor,usually a prestigious Latino/a.
C-33

Name anddate founded State Funding Main components Student eligibility Mission/goals Data Program description
AVID (1980) CA andseveralotherstates
State and K-12 schools.
Per-studentcost approx.$625 annually
• Additionalclasses
• Guest speakers• Field trips• “Untracking”• College prep
Average to high-scoringstudents (in reading)who are under-performing (C average)but who express desire togo to college.
To increase thenumber of low-income and under-representedstudents who aregiven access tocollege prep coursesand who go on tocollege.
Programgraduatesfrom SanDiego, CAcomparedto allstudents inthe samedistrictand thestate forcollegematricula-tion.
The AVID class can be takenfor 4 years of high school.AVID teachers are trained instudy skills, college prepcounseling, and “motivation.”College tutors are provided.
Students are “untracked” intocollege prep courses. Guestspeakers and field trips tocolleges are also part of theprogram.
C-34