pattern recognition letters - cmpe webethem/files/papers/olcay_cca_prl.pdf · canonical correlation...
TRANSCRIPT
Pattern Recognition Letters 32 (2011) 134–144
Contents lists available at ScienceDirect
Pattern Recognition Letters
journal homepage: www.elsevier .com/locate /patrec
Canonical correlation analysis using within-class coupling q
Olcay Kursun a,⇑, Ethem Alpaydin b, Oleg V. Favorov c
a Department of Computer Engineering, Istanbul University, Avcilar, Istanbul 34320, Turkeyb Department of Computer Engineering, Bogazici University, Bebek, Istanbul 34342, Turkeyc Biomedical Engineering Department, University of North Carolina, Chapel Hill, NC 27599-7575, USA
a r t i c l e i n f o a b s t r a c t
Article history:Received 27 November 2009Available online 31 October 2010Communicated by W. Pedrycz
Keywords:Temporal contextual guidanceLinear discriminant analysis (LDA)Samples versus samples canonicalcorrelation analysis (CCA)Feature extraction
0167-8655/$ - see front matter � 2010 Elsevier B.V. Adoi:10.1016/j.patrec.2010.09.025
q The work of O. Kursun was supported by Scientination Unit of Istanbul University under the grant YA⇑ Corresponding author. Tel.: +90 212 473 7070/17
E-mail addresses: [email protected] (O. KursAlpaydin), [email protected] (O.V. Favorov).
Fisher’s linear discriminant analysis (LDA) is one of the most popular supervised linear dimensionalityreduction methods. Unfortunately, LDA is not suitable for problems where the class labels are not avail-able and only the spatial or temporal association of data samples is implicitly indicative of class member-ship. In this study, a new strategy for reducing LDA to Hotelling’s canonical correlation analysis (CCA) isproposed. CCA seeks prominently correlated projections between two views of data and it has been longknown to be equivalent to LDA when the data features are used in one view and the class labels are usedin the other view. The basic idea of the new equivalence between LDA and CCA, which we call within-class coupling CCA (WCCCA), is to apply CCA to pairs of data samples that are most likely to belong tothe same class. We prove the equivalence between LDA and such an application of CCA. With such animplicit representation of the class labels, WCCCA is applicable both to regular LDA problems and toproblems in which only spatial and/or temporal continuity provides clues to the class labels.
� 2010 Elsevier B.V. All rights reserved.
1. Introduction lows. Given a dataset of samples and their class labels, if we consider
Fisher’s linear discriminant analysis (LDA; Fisher, 1936) andHotelling’s canonical correlation analysis (CCA; Hotelling, 1936)are among the oldest, yet the most powerful multivariate dataanalysis techniques. LDA is one of the most popular superviseddimensionality reduction methods incorporating the categoricalclass labels of the data samples into a search for linear projectionsof the data that maximize the between-class variance while mini-mizing the within-class variance (Rencher, 1997; Alpaydin, 2004;Izenman, 2008).
On the other hand, CCA works with two sets of (related) variablesand its goal is to find a linear projection of the first set of variablesthat maximally correlates with a linear projection of the second setof variables. These sets have recently been also referred to as viewsor representations (Hardoon et al., 2004). Finding correlated func-tions (covariates) of the two views of the same phenomenon by dis-carding the representation-specific details (noise) is expected toreveal the underlying hidden yet influential semantic factorsresponsible for the correlation (Hardoon et al., 2004; Becker, 1999;Favorov and Ryder, 2004; Favorov et al., 2003).
Both LDA and CCA have been proposed in 1936, and shortly after,a direct link between them has been shown by Bartlett (1938) as fol-
ll rights reserved.
fic Research Projects Coordi-DOP-5323.913; fax: +90 212 473 7180.un), [email protected] (E.
the features given for the data samples as one view, versus the classlabels as the other view (a single binary variable works for the two-class problem but a form of 1-of-C coding scheme is typically used formulti-class categorical class labels), this CCA setup is known to beequivalent to LDA (Bartlett, 1938; Hastie et al., 1995). In other words,LDA can be simply said to be a special case of CCA.
The knowledge of this insightful equivalence between LDA andCCA enabled the researchers attempt the use of CCA to surpass thequality of the LDA projections. These attempts used samples versustheir class labels using several other forms of representations forthe labels (Loog et al., 2005; Barker and Rayens, 2003; Gestel etal., 2001; Johansson, 2001; Sun and Chen, 2007). An interestingexample of such a label transformation is by replacing hard cate-gorical labels by soft-labels; in (Sun and Chen, 2007), similar tothe support vector idea, the aim was to put more weight on thesamples near the class boundaries rather than using a common la-bel for all the samples of a class; thus, more useful projectionswere found as more focus was placed on the problematic regionsin the input space rather than the high-density regions with classcenters. Another example is the study on an image segmentationtask presented in (Loog et al., 2005), which uses image-pixel fea-tures and their associated class labels for learning to classify pixels.Their CCA-based method incorporates the class labels of the neigh-boring pixels as well, which can naturally be expected to yieldLDA-like (but possibly more informative) projections. The methodcan be applied to other forms of, non-image, data by accounting forthe spatial class label configuration in the vicinity of every featurevector (Loog et al., 2005).

O. Kursun et al. / Pattern Recognition Letters 32 (2011) 134–144 135
In this paper, we present another extension of CCA to LDA alongwith its equivalence proof. The main idea is to transform the classlabel of a sample such that it is represented, in a distributed man-ner, by all the samples in that same class. In other words, CCA isasked to produce correlated outputs (projections) for any pair ofsamples that belong to the same class, which we called WCCCAthat stands for within-class coupling CCA. This extension of CCAto LDA has various advantages despite its increased complexity(see Section 4.2 for a detailed list). One important advantage ofthe WCCCA idea of using samples versus samples, as the two views,is in its ability to perform a form of implicitly-supervised LDA (seeSection 5.2) as sometimes the class labels may be embedded in thepatterns of the data rather than being explicitly available, forexample, in the patterns of spatial and temporal continuity(Becker, 1999; Favorov and Ryder, 2004; Favorov et al., 2003; Borgaand Knutsson, 2001; Stone, 1996). Among exemplary applicationson such data, the tasks of division of a video into sequencesof relevant frames (scenes), segmentation of an image intoimage regions sharing certain visual characteristics, identifyingsequences of acoustic frames belonging to the same word in speechanalysis, or finding sequences of base pairs or amino acids belong-ing to the same protein in biological sequence analysis can be men-tioned. In such settings, the use of LDA is uneasy, if not impossible.
The idea of applying CCA or other forms of mutual informationmaximization models, for example, between the consecutiveframes of a video or between the neighboring image patches forfinding correlated functions is not a new one (Becker, 1999; Favo-rov and Ryder, 2004; Favorov et al., 2003; Borga and Knutsson,2001; Borga, 1998; Stone, 1996; Kording and Konig, 2000; Phillipset al., 1995; Phillips and Singer, 1997). Many of these attempts areinspired by the learning mechanisms hypothesized to be used byneurons in the cerebral cortex. For example, cortical neurons mighttune to correlated functions between their own afferent inputs andthe lateral inputs they receive from other neurons with differentbut functionally related afferent inputs. Thus, groups of neuronsreceiving such different but related afferent inputs can learn toproduce correlated outputs under the contextual guidance of eachother (Phillips et al., 1995; Phillips and Singer, 1997). However, it isnot mathematically justified whether these correlated functionsare good for discrimination. Would the covariates found this waybe suitable projections for clustering the frames into scenes orfor image segmentation? The results of our study show that sucha CCA application would be comparable to performing LDA; andas LDA projections maximize the between-class variance and min-imize the within-class variance, the covariates found this waywould be useful, for example, to cluster the frames into scenes.
This paper is organized as follows. In Sections 2 and 3, we re-view the CCA and LDA techniques, respectively. In Section 4, wepresent the WCCCA idea of using CCA on a samples versus samplesbasis and provide the proof for its equivalence to LDA; we alsoshow that the theoretically derived equivalence holds also practi-cally on a toy example. In Section 4, we also discuss the advantagesand disadvantages of this way of performing LDA; and finally, fin-ish this section by showing the nonlinear kernel extension ofWCCCA. In Section 5, we present the experimental results on a facedatabase and show that WCCCA can perform the task of LDA evenwhen the images are made into a movie and the class label infor-mation is kept only implicitly through the temporal continuity ofthe identity of the individual seen in contiguous frames. We con-clude in Section 6.
2. Canonical correlation analysis (CCA)
Canonical correlation analysis (CCA) is introduced by Hotelling(1936) to describe the linear relation between two multidimen-
sional (or two sets of) variables as the problem of finding basis vec-tors for each set such that the projections of the two variables ontheir respective basis vectors are maximally correlated (Hotelling,1936; Rencher, 1997; Hardoon et al., 2004; Izenman, 2008). Thesetwo sets of variables, for example, may correspond to differentviews of the same semantic object (e.g. audio versus video of a per-son speaking, two cameras viewing the same object as in binocularvision, text versus links or images in webpages, etc). Let u-dimen-sional X and v-dimensional Y denote corresponding two sets ofreal-valued random variables (i.e., X 2 Ru and Y 2 Rv ), the canoni-cal correlation is defined as:
qðX; YÞ ¼ supf ;g
corrðf T X; gT YÞ; ð1Þ
where, corr(X;Y) stands for Pearson’s correlation coefficient. Let u-dimensional column vector X = xi denote the ith sample (row) ofthe first view (dataset), v-dimensional column vector Y = yi denotethe ith sample of the second dataset, and N denote the total numberof samples. Then, the first dataset D1 is an N � u matrix that can beexpressed as:
D1 ¼ ½x1; x2; . . . ; xN�T ð2Þ
and similarly, the N � v matrix for the second dataset D2 can bewritten as:
D2 ¼ ½y1; y2; . . . ; yN�T: ð3Þ
Assuming that each dataset has zero mean, the total covariance ma-trix of (X, Y) can be written as a block matrix:
CðX;YÞ ¼ EX
Y
� �X
Y
� �T( )
¼CXX CXY
CYX CYY
� �; ð4Þ
where the within-sets covariance matrices are given as:
CXX ¼ EfXXTg;CYY ¼ EfYYTg ð5Þ
and the between-sets covariance matrix is given as:
CXY ¼ EfXYTg ¼ CTYX ð6Þ
and now the canonical correlation is the maximum of q with re-spect to f and g:
qðX; YÞ ¼ supf ;g
f T CXY gffiffiffiffiffiffiffiffiffiffiffiffiffiffiffiffiffiffiffiffiffiffiffiffiffiffiffiffif T CXXfgT CYY g
q : ð7Þ
The problem of finding the orthogonal projections that achieve thetop correlations reduces to a generalized eigenproblem, where theprojection f (and the projection g can be solved for similarly) corre-sponds to the top eigenvector of the following (Hardoon et al.,2004):
C�1XX CXY C�1
YY CYXf ¼ kCCAf ð8Þ
and
qðX; YÞ ¼ffiffiffiffiffiffiffiffiffikCCA
p; ð9Þ
where kCCA corresponds to the largest eigenvalue of Eq. (8).
3. Fisher linear discriminant analysis (LDA)
Fisher linear discriminant analysis (LDA) is a variance preserv-ing approach with the goal of finding the optimal linear discrimi-nant function (Fisher, 1936; Rencher, 1997; Raudys and Duin,1998; Alpaydin, 2004; Izenman, 2008). As opposed to unsuper-vised methods such as principal component analysis (PCA), inde-pendent component analysis (ICA), or the two view counterpart
136 O. Kursun et al. / Pattern Recognition Letters 32 (2011) 134–144
CCA, to utilize the categorical class label information in findinginformative projections, LDA considers maximizing an objectivefunction that involves the scatter properties of every class as wellas the total scatter. The objective function is designed to be maxi-mized by a projection that maximizes the between class (or equiv-alently total scatter as in PCA) and minimize the within classscatter. Let d-dimensional column vector zc
i denote the ith sampleof class c, Nc denote the number of samples in class c, m P 2 denotethe total number of classes, and finally N denote the total numberof samples. Then, the N � d data matrix D can be written as:
D ¼ z11; . . . ; Z1
N1; z2
1; . . . ; z2N2; . . . ; zm
1 ; . . . ; zmNm
h iT: ð10Þ
Assuming that the dataset D is centered (i.e. the data is normalizedto zero-mean), the overall scatter (covariance) matrix STb of thedataset D is given by:
ST ¼ covðDÞ ¼ 1N
Xc
XNc
i¼1
zci zcT
i ð11Þ
and the within-class scatter matrix is defined as:
SW ¼X
c
Nc
NcovðDcÞ
� �¼ 1
N
Xc
XNc
i¼1
zci � lc
� �zc
i � lc
� �T; ð12Þ
where lc 2 Rd denotes the mean of Dc (the samples of class c). Thebetween-class scatter matrix can be formulated as:
SB ¼X
c
Nc
Nlcl
Tc : ð13Þ
In fact, the overall scatter matrix ST can be expressed as the sum ofthe within-class and between-class scatter matrices:
ST ¼ SW þ SB: ð14Þ
Finally, the LDA objective function for finding the most discrimina-tive projection vector h (and other orthogonal projection vectors) isgiven by:
kLDA ¼ suphT SBh
hT SW h¼ sup
hTðST � SWÞhhT SW h
¼ suphT ST h
hT SW h� 1: ð15Þ
The optimization can be shown to be accomplished by computingthe solution of the following generalized eigenproblem for theeigenvectors corresponding to the largest eigenvalues:
SBh ¼ kLDASW h: ð16Þ
An already established direct connection between LDA and CCA,which we refer to as samples versus labels CCA (SLCCA), was first gi-ven in (Bartlett, 1938) by showing that LDA is exactly what isaccomplished by applying CCA between the data matrix D andthe class label matrix L, a dummy matrix that carries the class labelinformation using the 1-of-C, or the more compact 1-of-(C–1)) cod-ing, defined as:
L ¼
1N1 0N1 0N1 � � � 0N1
0N2 1N2 0N2 � � � 0N2
0N3 0N3 1N3 � � � 0N3
..
. ... ..
. . .. ..
.
0Nm 0Nm 0Nm � � � 1Nm
266666664
377777775
N�m
; ð17Þ
where 1j is a column vector of j ones and 0j is a column vector of jzeros, and m is the number of classes. Searching for the maximalcorrelation between the rows of D and L matrices via CCA yieldsthe LDA projection as the solution (Bartlett, 1938; Loog et al.,2005; Barker and Rayens, 2003; Sun and Chen, 2007). It is straight-forward to show that for the SLCCA setup, the CCA eigenproblem inEq. (8) reduces to that of LDA in Eq. (16) with:
kSLCCA ¼kLDA
kLDA þ 1: ð18Þ
Taking advantage of this equivalence, there are more recent ref-erences utilizing CCA on the basis of samples versus their class la-bels to extract more useful projections than LDA using other formsof class label representations; the work in (Sun and Chen, 2007),for example, uses soft labeling of the samples to deem the samplesnear other classes more important (similar to the support vectoridea) rather than using the actual hard labels. In another recentwork (Loog et al., 2005), the class labels, used as the second view,were augmented by the class labels of the neighboring pixels (i.e.by taking advantage of the spatial context) for an image segmenta-tion task. Moreover, Kursun and Alpaydin (2010) offer an ideabased on the equivalence on the multiview semisupervised learn-ing problem, where a CCA-based setup utilizes the unlabelledexamples as well as the labelled ones in learning discriminants.
4. Within-class coupling CCA (WCCCA)
Clearly, for CCA to be applicable to a dataset D, two views arenecessary, denoted as X and Y in Eq. (1). However, constructing aform of the dummy class label matrix L in Eq. (17) as the secondone of the two views is not the only way to create these views.We prove that CCA can be used to perform LDA using a differentmethod of incorporating the class labels of the data samples. Letus create the two views by coupling a pair of samples from thesame classes (one for each view). For an example, considera; b; c; d 2 Rd are our four training examples, with d features each,and also let a and b belong to class 1 and c and d belong to class2. Then we create two datasets such that the samples belongingto the same classes correspond to each other in the subsequentCCA analysis: a versus a, a versus b, b versus a, b versus b, c versusc, c versus d, d versus c, d versus d. In other words, when the featurevector X represents a sample (a row) in D (given in Eq. (10)) thatbelongs to class c, then the feature vector Y will correspond to an-other sample that also belongs to class c. The LDA problem can beshown to be polynomially reducible to CCA using this change ofrepresentation, as we show below. For the sake of simplicity, letus assume Ni = n for all 1 6 i 6m (when the classes are of differentcardinalities, the number of pairs produced by each class must beadjusted to preserve the prior distribution of the classes, see Sec-tion 4.3). As there are n2 pairs for each class, for the full set of pairsto be presented, mn2 � d matrices for the two views can be ob-tained from the mn � d data matrix D as:
D1 ¼ z11; . . . ; z1
n; z11; . . . ; z1
n; z11; . . . ; z1
n; . . . ; z11; . . . ;
z1
n; . . . ; zm1 ; . . . ; zm
n ; zm1 ; . . . ; zm
n ; zm1 ; . . . ; zm
n ; . . . ; zm1 ; . . . ; zm
n
T; ð19Þ
D2 ¼ z11; . . . ; z1
1; z12; . . . ; z1
2; z13; . . . ; z1
3; . . . ; z1n; . . . ; z1
n; . . . ; zm1 ; . . . ; zm
1 ;
zm2 ; . . . ; zm
2 ; zm3 ; . . . ; zm
3 ; . . . ; zmn ; . . . ; zm
n
T; ð20Þ
where each one of the samples of a class is paired with every othersamples of that class (located on the same rows of D1 and D2,respectively). CCA is, then, asked to find the maximally correlatedfunctions of the rows of D1 with those of D2. These functions areindirectly forced to produce the same output for the samples ofthe same class. What CCA produces as the maximally correlatedprojections f and g are both the same projection h that LDA wouldalso find; because in this setup, the eigenproblems for LDA andCCA can be shown to be equivalent as follows. Recall that CCAsolves the eigenproblem given in Eq. (8):
C�1XX CXY C�1
YY CYXf ¼ kCCAf ; ð8 revisitedÞ
O. Kursun et al. / Pattern Recognition Letters 32 (2011) 134–144 137
where for this particular case, we have:
CXX ¼ covðD1Þ ¼ covðDÞ ¼ covðD2Þ ¼ CYY ¼ ST ; ð20ÞCXY ¼ CYX ¼ SB: ð21Þ
Eq. (20) easily follows from the fact that the samples of D1 (and sim-ilarly D2) are basically the samples in the dataset D repeated ntimes. Therefore, the covariance matrix will not be altered at all.To show the validity of Eq. (21), consider that X and Y stand forall the pairs of the samples in the same classes. Therefore,
CXY ¼ E zci � zcT
j
h i¼X
c
Nc
N
XNc
i¼1
XNc
j¼1
1N2
c
zci � zcT
j
" #
¼X
c
Nc
N
XNc
i¼1
zci
Nc
XNc
j¼1
zcT
j
Nc
" #" #¼X
c
Nc
N
XNc
i¼1
zci
NclT
c
" #
¼X
c
Nc
Nlcl
Tc
� �¼ SB: ð22Þ
Thus, Eq. (8) is equivalent to:
S�1T SBS�1
T SBf ¼ kWCCCAf : ð23Þ
On the other hand, it was mentioned that LDA solves theeigenproblem:
SBh ¼ kLDASW h: ð16 revisitedÞ
Equivalently,
SBh ¼ kLDAðST � SBÞh;SBh ¼ kLDAST h� kLDASBh;
ðkLDA þ 1ÞSBh ¼ kLDAST h;
SBh ¼ kLDA
kLDA þ 1ST h;
S�1T SBh ¼ kLDA
kLDA þ 1h: ð24Þ
Let
k� ¼ kLDA
kLDA þ 1ð25Þ
and
A ¼ S�1T SB: ð26Þ
Then, we get from the last line of Eq. (24):
Ah ¼ k�h: ð27Þ
Thus, rewriting Eq. (23), we get:
S�1T SBS�1
T SBh ¼ AAh ¼ AðAhÞ ¼ Aðk�hÞ ¼ k�ðAhÞ ¼ k�ðk�hÞ ¼ ðk�Þ2h:
ð28Þ
Therefore, f = h is a solution of the eigenproblem (Eq. (23)) ofWCCCA with:
kWCCCA ¼ ðk�Þ2; ð29Þ
from which, it immediately follows that
qWCCCAðX; YÞ ¼ffiffiffiffiffiffiffiffiffiffiffiffiffikWCCCA
p¼
ffiffiffiffiffiffiffiffiffiffiffiðk�Þ2
q¼ k� ¼ kLDA
kLDA þ 1: ð30Þ
Similarly, it can be shown that g = h. Therefore, we have:
f ¼ h ¼ g: ð31Þ
This shows that the LDA and WCCCA projections are exactly thesame. In fact, for every eigenvector of the LDA eigenproblem, thateigenvector must be also a solution for the WCCCA eigenproblemwith the same ordering of the eigenvalues. That is because the orderof the eigenvalues will not change when they are squared.
Concisely, the projections found by LDA, the existing samplesversus class labels CCA setup (SLCCA), and the proposed samplesversus within-class samples CCA setup (WCCCA) are all identical,with the following relationships among the eigenvalues of theireigenproblems:
ffiffiffiffiffiffiffiffiffiffiffiffiffikWCCCA
p¼ kSLCCA ¼
kLDA
kLDA þ 1; ð32Þ
from which the relation between the correlation coefficients ofWCCCA and SLCCA is seen to be:
qWCCCA ¼ q2SLCCA: ð33Þ
Alternatively, a different way of seeing the LDA and WCCCA equiv-alence follows from the fact that the WCCCA algorithm is expectedto yield identical projections, f and g, as D1 and D2 are practically thesame dataset but only shuffled whilst preserving the class corre-spondence. Thus, the objective function of CCA given in Eq. (7) couldbe rewritten by substituting f for g as:
qWCCCAðX; YÞ ¼ supf ;g
f T CXY gffiffiffiffiffiffiffiffiffiffiffiffiffiffiffiffiffiffiffiffiffiffiffiffiffiffiffiffif T CXXfgT CYY g
q ¼ supf
f T SBfffiffiffiffiffiffiffiffiffiffiffiffiffiffiffiffiffiffiffiffiffiffif T ST ff T ST f
q
¼ supf
f T SBff T ST f
¼ supf
f TðST � SWÞff T ST f
¼ supf
1� f T SW ff T ST f
� �¼ 1� inf
f
f T SW ff T ST f
� �
¼ 1� 1
supf
f T ST ff T SW f
� � ¼ 1� 1
supf
f T ST ff T SW f � 1� �
þ 1
¼ 1� 1kLDA þ 1
¼ kLDA
kLDA þ 1: ð34Þ
It is clear from Eq. (34) as well as Eq. (30) that the objective functionfor CCA for the WCCCA setup maximizes the objective function ofLDA given in Eq. (15). An interesting way to state this is that usingthe best ratio, kLDA, for the Rayleigh quotient that LDA maximizes inEq. (15), we can directly calculate the canonical correlation maxi-mized in Eq. (7). The same conclusion can be drawn from Eq. (32).This is important in that it gives us a mechanism to judge the qual-ity of a projection LDA finds from a correlation coefficient scale (seeSection 4.2).
4.1. Toy problem demonstration
For a simple demonstration, we created a dataset with two vari-ables (d = 2) shown in Fig. 1(a). The dataset has two classes (m = 2)with 100 samples in both classes (N1 = N2 = 100). The samples inthe classes are generated with multivariate random distributionsboth with covariance identity and with class 1 having its meanat l1 = (0, 0) and class 2 at l2 = (2, 2). The full set of 2 � 1002 =20,000 pairs of samples are generated. CCA is then asked to pro-duce maximally correlated functions of these two ‘‘views”.
Shown in Fig. 1(a) is the discriminant learnt by WCCCA, which isidentical to that by LDA. We see in Fig. 1(b) that the samples ofclasses 1 and 2 are clearly separated when projected on the dimen-sion that WCCCA (and also LDA) found.
4.2. Some advantages of such an indirect computation of LDA usingCCA
There are many advantages of the WCCCA way of computingLDA that we could identify, which might not be limited to thefollowing.

Fig. 1. (a) The found LDA and WCCCA dimensions perfectly coincide. (b) The projection of the samples on the found WCCCA dimension; the first 100 (class 1) samples aregenerated with l1 = (0, 0) and the second 100 (class 2) samples are generated with l2 = (2, 2).
138 O. Kursun et al. / Pattern Recognition Letters 32 (2011) 134–144
4.2.1. Computational flexibilityCCA gives an alternative way of performing LDA, which might
be a more plausible way of reaching the goal of LDA under somearchitectures. For example, in the field of neuroscience, a numberof researchers have proposed that cerebral cortical neurons per-form mutual information extraction from different, but etiologi-cally related sets of inputs, which might be akin to CCA (Favorovand Ryder, 2004; Kording and Konig, 2000; Phillips and Singer,1997). That is, neural processing units (such as individual den-drites, single neurons, or local neuronal populations) might takeadvantage of contextual guidance they receive from their lateralinputs to learn to extract such features from their sensory spatio-temporal input patterns that will possess deeper, more inferen-tially powerful meaning. In other words, neurons will learn todiscriminate classes of sensory events that are causally significant.Such an LDA analysis could be accomplished by neurons using aform of the proposed samples versus samples CCA.
As another example, taking advantage of robust CCA implemen-tations, robust LDA computations can also be achieved; as aspecific illustration, consider SVM-2K (Farquhar et al., 2005).SVM-2K is a method that combines kernel CCA (KCCA) followedby an SVM classification into a single optimization problem andaccomplishes a robust form of KCCA. SVM-2K can be given theviews D1 and D2 to get a robust kernel-LDA followed by an SVMclassification at one-shot. Yet another extension of WCCCA couldbe for achieving a form of local LDA (Sugiyama, 2007). This canbe done by creating pairs of samples from the same classes in someneighborhood of each other.
4.2.2. Ease of representationThe class labels (or the dummy matrix) could be difficult to rep-
resent or store under certain architectures but the data samplescould be more readily available in the input channels (for examplethe observation at time t – 1 could be paired with the currentobservation at time t). Moreover, having a dataset with thousandsof different classes would make the dummy matrix with 1-of-Ccoding impractical. However, the samples versus samples idea,using an online implementation of CCA (or mutual informationmaximization models) (Becker, 1999; Favorov and Ryder, 2004;Favorov et al., 2003; Fyfe, 2005; Lai and Fyfe, 1999), could accom-plish the task of LDA easier because, in fact, not all but some of thepairs of within-class samples (or estimates for the class centers)will be sufficient to learn a good approximation to LDA as shownin Section 4.3.
4.2.3. Independence from class label informationThe categorical class labels may simply be unavailable explic-
itly. The class labels might be embedded into the spatial and/ortemporal patterns of the data such as in video and speech process-ing, in image segmentation, etc. For example, consider a movie offaces such that the consecutive frames are more likely to be ofthe same individual unless a ‘‘scene change” occurs. There are noclass labels given explicitly, therefore it is impossible to applyLDA but CCA can be applied (see Section 5).
4.2.4. Correlation coefficient as a tool for evaluation of the LDAprojections
The (maximal) correlation coefficient calculated by the CCAalgorithm from a training set is typically an overestimate and itis traditional to verify its dependability in terms of how correlatedthe found covariates on a validation or a test set. However, whenusing the LDA transform, its projections are given to a subsequentclassifier and LDA’s quality is measured in terms of correct classi-fication rate of the classifier applied on the data set. Here, in thissection, we show that the quality of LDA projections can be mea-sured without a need for a subsequent classifier (see Section 5.1and Table 1), again in terms of the correlation coefficient borrowedfrom the WCCCA equivalence.
It follows from Eqs. (32) and (33) that the LDA correlation is alsothe variance explained between the class labels and the input vari-ables because it is the square of the correlation coefficient pro-duced by SLCCA (the samples versus class labels CCA):
qLDA ¼ qWCCCA ¼ q2SLCCA: ð35Þ
Thus, the quality of an LDA projection h on the training set can becalculated using D1 and D2 sets obtained from the training set D(as in Eq. (20)) by:
qLDA ¼ corrðD1h;D2hÞ: ð36Þ
When applied to a test set, Eq. (36) may also be used as an approx-imation to the LDA quality on the test set. However, more generally,on any given dataset D, whether it is a training or a test set, with thegiven labels L (1-of-C coded as in Eq. (17)), the quality of an LDAprojection h is given by:
qLDA ¼ corrðDh; LMhÞ; ð37Þ
where M is a m � d matrix that holds the d-dimensional class centervectors, lc, of the training set for all the m classes.

Table 1The quality of the WCCCA projections extracted using 20 random pairs from each individual.
Projection # Training set Test set of known individuals Test set of unknown individuals
Canonical correlation LDA correlation Canonical correlation LDA correlation Canonical correlation LDA correlation
1 0.97 0.97 0.95 0.96 0.92 0.872 0.97 0.97 0.92 0.92 0.47 0.373 0.96 0.96 0.89 0.91 0.69 0.804 0.95 0.94 0.83 0.83 0.77 0.805 0.93 0.92 0.90 0.92 0.75 0.706 0.90 0.89 0.88 0.87 0.76 0.727 0.90 0.89 0.88 0.88 0.87 0.788 0.89 0.87 0.78 0.81 0.63 0.579 0.87 0.86 0.77 0.82 0.73 0.8610 0.84 0.83 0.73 0.57 0.76 0.7811 0.84 0.83 0.78 0.81 0.93 0.9112 0.82 0.81 0.55 0.74 0.35 0.4213 0.81 0.79 0.68 0.67 0.18 0.0514 0.79 0.76 0.79 0.71 0.82 0.7615 0.77 0.71 0.61 0.68 0.38 0.7516 0.74 0.72 0.65 0.63 0.61 0.5917 0.70 0.70 0.63 0.66 0.57 0.0318 0.69 0.66 0.70 0.72 0.54 0.2519 0.65 0.62 0.61 0.65 0.36 0.3920 0.63 0.59 0.49 0.54 0.06 0.3221 0.60 0.57 0.56 0.48 0.27 0.2122 0.55 0.49 0.05 0.07 0.26 0.5123 0.50 0.47 0.22 0.31 0.40 0.5824 0.49 0.47 0.22 0.25 0.42 0.5825 0.44 0.37 0.47 0.46 0.46 0.38
O. Kursun et al. / Pattern Recognition Letters 32 (2011) 134–144 139
4.3. The resolutions for the disadvantages of WCCCA
Obviously, there are some limitations and disadvantages associ-ated with the WCCCA method of computing LDA. As for its (impli-cit) limitations, the assumptions of CCA, namely multivariatenormality and outliers, must hold in the data; otherwise, violationsof these assumptions would bias the algorithm. However, multi-variate normality assumption can be overcome using kernels (seeSection 4.4) and there are regularization and robust estimationtechniques that can apply to CCA and give us flexibility in handlingoutliers (Hastie et al., 1995; Glendinning and Herbert, 2003;Kursun and Favorov, 2010). In the following, we discuss, in detail,some other implementational disadvantages of WCCCA andprovide procedures to overcome them.
Fig. 2. The number of pairs used for each class p (in log scale) versus the quality ofWCCCA approximation to LDA (the angle H, in degrees, between the foundprojections by LDA by WCCCA).
4.3.1. ComplexityAs opposed to LDA, creating all the within-class pairs of samples
results in squaring the number of samples presented subsequentlyto CCA. However, this complexity can be overcome becauseWCCCA can work well even when only a small subset of pairsare used. To quantify the quality of the LDA approximation byWCCCA using fewer pairs than all the possible ones, we have ran-ged the number of pairs used for the experiment given in Section4.1. We have randomly taken p of all 10,000 pairs available for eachclass, thus, presenting a total of 2p pairs to CCA. The plot of p versusthe angle H between the LDA and the WCCCA projection vectors, hand f, (see Eq. (38)) is shown in Fig. 2 (reported angles in degreesare the averages of 100 runs for each value of p).
H ¼ acosf T h
kfk � khk
� �: ð38Þ
Fig. 3 shows the average test errors and the standard deviations ofthe found LDA and WCCCA projections over 100 test runs for eachvalue of p. Each test set is generated the same way that the trainingdata has been generated. We see that WCCCA does not require allthe pairs of within-class samples in order to attain the quality ofthe optimal LDA projection, because the WCCCA error on the test
set very quickly reduces down to that of LDA as the number of pairsincreases.
Moreover, it is straightforward to show that using the class cen-ters (the average of all samples of each class) as the second view ina samples versus class centers CCA basis is also equivalent to LDA.For example, a form of running average could be used to estimatethe class centers in such a setup to reduce the complexity backto that of SLCCA.
4.3.2. Imbalance of class priorsUsing the within-class coupling, classes with higher prior prob-
abilities would have many more pairs of their samples than thepairs of classes with lower priors due to the squaring effect. Thus,simply taking all within-class pairs would be an unfair modifica-tion of the prior probabilities of the classes that would bias theLDA approximation by WCCCA. This issue can be easily resolvedby preserving the prior probabilities of classes also in their pairs

Fig. 3. The number of pairs used for each class p versus the test error of the projections (showing both averages and standard deviations of 100 independent random test sets,each generated with the distribution of the training set). The test error of WCCCA quickly approaches to that of LDA.
140 O. Kursun et al. / Pattern Recognition Letters 32 (2011) 134–144
created into D1 and D2. While generating all the within-class pairs,the pairs of the classes with lesser prior probabilities must beappropriately proliferated (repeated). Recall the example in Sec-tion 4.1 with N1 equals to 2 � N2 and suppose that the true equiv-alence to LDA is sought using WCCCA. In this case, as the totalnumber of distinct pairs of the first class would be four times thatof the second class, each pair of the second class should be gener-ated twice. Besides, the theoretical basis for this adjustment, ournumerical simulations have verified that the WCCCA and LDA giveexactly the same projections also in this case.
4.4. Kernel-WCCCA for approximating kernel-LDA
We present a straightforward nonlinear extension of WCCCAusing the kernels. When the classes are not linearly separable,the kernels have been used efficiently that enable linear methodscalculate nonlinear discriminants (Melzer et al., 2003; Alpaydin,2004; Hardoon et al., 2004; Shawe-Taylor and Cristianini, 2004;Gonen and Alpaydin, 2010). CCA can be asked, as before, to pro-duce correlated outputs using the kernel matrices (whose respec-tive rows preserve the class label information) as the two views(Hardoon et al., 2004; Melzer et al., 2003). Fig. 4 shows the resultson a known example of a decision boundary using the polynomialkernel of degree two on a dataset with two Gaussians with meansl1 = [0, 0] and l2 = [0, 4] and with the covariance matrices
r1 ¼1 00 1
� �and r2 ¼
10 00 1
� �.
5. Experimental results
In this section, we will present the results obtained usingWCCCA on two sets of experiments on the AT&T (ORL) face data-base, which is composed of 400 grayscale images obtained from40 different individuals, ten different images per person. Theimages were taken at different times, varying the lighting, theviewing angle (frontal or more or less semi-frontal view), facialexpressions (open or closed eyes, smiling or not, etc.), and other fa-cial details (e.g., with or without glasses). All images were taken
against a dark homogeneous background with the subjects in anupright position, with tolerance for some side movement. Each ori-ginal image was 92 � 112 pixels, with 256 gray levels. To reducethe computational load, we down-sampled each image to23 � 28 (=644) pixels by bilinear interpolation.
5.1. Supervised LDA by WCCCA on face images
Among the total of 40 individuals (classes), we left out (a ran-dom) five of the individuals for testing. This test set that we calledthe test set of unknown individuals, is a difficult one because itconsists of individuals not used for training. We also left out twopictures of each one of the 35 training individuals for a test ofknown individuals in order to measure the generalization of themethods to the known individuals. Therefore, we used a total of35 � 8 = 280 pictures for learning WCCCA (and LDA) projections.To avoid the computational instability of using 644 dimensionalcovariance matrices obtained by such a low number of samples,we first performed PCA dimensionality reduction to 50 compo-nents that preserved around 91% of the total variation in the origi-nal 644 dimensions.
We formed 20 random pairs for each class out of the 35 classesin the training set. As each class has eight training samples, the to-tal number of possible pairs is 64, or 56 if excluding the pairs of animage with itself, but we choose using a random subset basis (Leeand Huang, 2007; Lee and Mangasarian, 2001) to lessen the com-putational loading as described in Section 4.3.1. Then we appliedCCA to get the most interesting WCCCA projections. As a demon-stration, the top three WCCCA and LDA projections are shown inFig. 5b–d, respectively. The eigenvectors of WCCCA and LDA arepractically identical up to their signs. To quantify the differencecaused by the approximation to LDA by WCCCA, in Table 1, we tab-ulated the correlation coefficient of the covariates on all the data-sets (the training set, the test set of known individuals, and the testset of unknown individuals). For a comparison, we also reportedthe correlation of the LDA projections, qLDA, according to Eq. (36)(i.e. refer to the advantage number four in Section 4.2). AlthoughWCCCA used only 20 pairs of pictures from each individual, thecorrelations on all sets are practically the same.

Fig. 4. The nonlinear extension of WCCCA using polynomial kernel of degree two. (a) The found kernel LDA and kernel WCCCA dimensions perfectly coincide. (b) Theprojection of the samples on the found kernel WCCCA dimension.
Fig. 5. The results of a representative run of WCCCA on the face images with explicit class labels. (a) Plot of canonical correlations of the found projections (on the training setshown with solid line, on the test set of known individuals with dashed line, and on the test set of unknown individuals with dotted line). (b–d) The top three eigenvectors forWCCCA (shown with solid line) and LDA (shown with dashed line).
O. Kursun et al. / Pattern Recognition Letters 32 (2011) 134–144 141
When the images are projected on the found WCCCA covariates(and LDA dimensions to compare with), as expected, the imagesthat belong to the same individuals have similar projections butthe projections vary from individual to individual (Fig. 6). For
example, when the images are projected on the first covariate,the average of the standard deviations of the projections for pic-tures of the same individuals is only 0.16 ± 0.07. For the secondand third covariates, these averages are also low, 0.19 ± 0.05 and
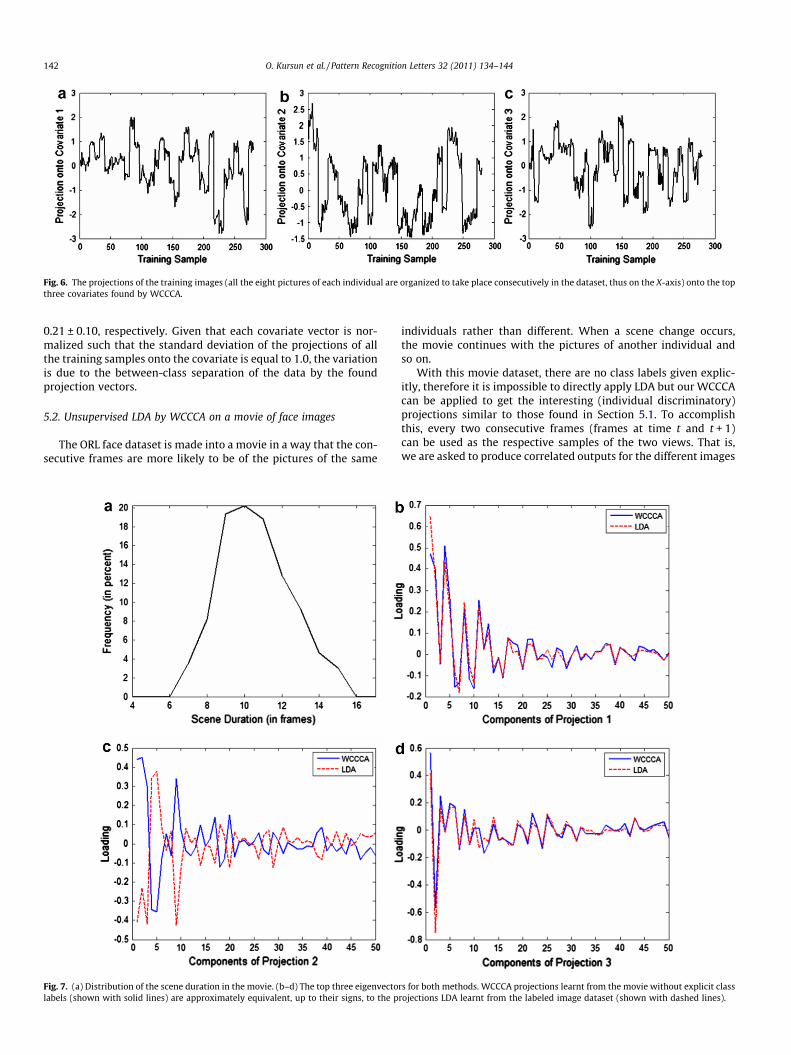
Fig. 6. The projections of the training images (all the eight pictures of each individual are organized to take place consecutively in the dataset, thus on the X-axis) onto the topthree covariates found by WCCCA.
142 O. Kursun et al. / Pattern Recognition Letters 32 (2011) 134–144
0.21 ± 0.10, respectively. Given that each covariate vector is nor-malized such that the standard deviation of the projections of allthe training samples onto the covariate is equal to 1.0, the variationis due to the between-class separation of the data by the foundprojection vectors.
5.2. Unsupervised LDA by WCCCA on a movie of face images
The ORL face dataset is made into a movie in a way that the con-secutive frames are more likely to be of the pictures of the same
Fig. 7. (a) Distribution of the scene duration in the movie. (b–d) The top three eigenvectolabels (shown with solid lines) are approximately equivalent, up to their signs, to the p
individuals rather than different. When a scene change occurs,the movie continues with the pictures of another individual andso on.
With this movie dataset, there are no class labels given explic-itly, therefore it is impossible to directly apply LDA but our WCCCAcan be applied to get the interesting (individual discriminatory)projections similar to those found in Section 5.1. To accomplishthis, every two consecutive frames (frames at time t and t + 1)can be used as the respective samples of the two views. That is,we are asked to produce correlated outputs for the different images
rs for both methods. WCCCA projections learnt from the movie without explicit classrojections LDA learnt from the labeled image dataset (shown with dashed lines).

Fig. 8. WCCCA results on the face movie without any explicit class labels. (a) The canonical correlations (between the functions on learnt from consecutive frames in themovie). (b–d) The projections of all the training pictures on the first three covariates found (all the ten pictures of each individual are organized to take place in the datasetconsecutively and as a result, the obtained step-like responses are satisfactory).
O. Kursun et al. / Pattern Recognition Letters 32 (2011) 134–144 143
in consecutive frames. We randomly chose the length of a scene(i.e. the number of frames during which the pictures of the sameindividual to be played) from a normal-like distribution, shownin Fig. 7a, ranging between 6 and 15 with its mean around 10.5frames. After a scene completes, we chose another individual tocontinue the movie for another randomly picked scene duration,and so on. For our experiments, we created a sequence of 8000frames such that, as in Section 5.1, each image is shown in the mo-vie with an expectation of 20 times. With 8000 frames we had7999 pairs of consecutive frames; however, as a pair of consecutiveframes could be used for both views in a symmetric fashion (i.e.frame t versus frame t + 1, and in addition, frame t + 1 versus framet can be used as for the two views), we obtained a total of 15998training pairs for WCCCA. As in Section 5.1, to avoid computationalinstability, we performed PCA to reduce dimensionality from 644pixels down to 50 principal components, which preserved 90.17%of the total variation in the original 644 dimensional data. TheWCCCA projections found are practically identical up to their signswith the projections LDA would find only if the class labels weremade explicitly available. Fig. 7b–d shows the top three WCCCAprojections, respectively.
The canonical correlations found by WCCCA are shown inFig. 8(a). In Fig. 8b–d, we show that, as in Section 5.1, WCCCAlearns to produce similar projections for the images of same indi-viduals but different responses for the images of different individ-uals. Each covariate (projection vector) is scaled so as that thestandard deviation of the projections of the whole training set is
1.0. For the first covariate, the average of the standard deviationsof the projections of the pictures of the same individuals is0.17 ± 0.06; for the second covariate, this average of the deviationswithin individuals is 0.21 ± 0.07; and it is 0.22 ± 0.09 for the thirdcovariate (these numbers are very close to those found in Section5.1 on the supervised dataset). These results show that from themovie dataset in which no explicit class labels were presented,individual-discriminatory representations (features) have been ex-tracted by WCCCA. Moreover, using a few of such features, anunsupervised-LDA based coding of the currently viewing framecould be obtained.
6. Conclusions
Fisher’s linear discriminant analysis (LDA) has two main goals:(1) minimize the within-class variance, and (2) maximize the be-tween-class variance. LDA has been long known to be a special caseof Hotelling’s canonical correlation analysis (CCA). That is, CCA canbe performed on a view that constitutes of samples (predictive fea-tures) versus a second view that is directly made up of the class la-bels of the samples in order to obtain projections that are identicalto those of LDA. In this paper, it has been shown that CCA can per-form LDA also when it is applied on a samples versus samples basis,which can be viewed as accomplishing LDA through a rather indi-rect and distributed style of an implicit presentation of the categor-ical class labels. More specifically, in the proposed WCCCA method,

144 O. Kursun et al. / Pattern Recognition Letters 32 (2011) 134–144
each one of the samples of a class, serving as the first view, ispaired with every other samples of that class serving as the secondview. We prove that when CCA is asked to find correlated functionsbetween these two views, it yields the LDA projections as expectedbecause it is the LDA projections that minimize the within-classvariance. As LDA has this as its first goal, samples from the sameclass presented to CCA as pairs would give similar scores whenprojected on the dimensions found by LDA. Likewise, if samplesthat belonged to different classes gave different outputs that wouldalso help maximize the canonical correlation. Thus, WCCCA canalso be said to aim the maximization of the between-class vari-ance, which is already the second one of the LDA goals. This equiv-alence and the application of WCCCA can be particularly usefulwhen the class labels, rather than being explicitly available, canbe tracked down in the temporal and/or spatial patterns of thedata, such as for the tasks of splitting a video into scenes (se-quences of relevant frames), segmentation of an image into imageregions sharing certain visual characteristics, speech analysis, orbiological sequence analysis. In such settings, the use of LDA isnot possible forthright. It has been known that it is possible to per-form a CCA analysis between, say, the consecutive frames of a vi-deo for searching correlations between a frame and the next; theequivalence proof presented in this paper assures that the use ofCCA in this manner would yield discriminatory features favorablefor the subsequent learning tasks such as classification, segmenta-tion, or clustering, without any need for explicit supervised classmemberships. We have also demonstrated that WCCCA can be eas-ily generalized to its nonlinear version via the kernel trick. It isstraightforward to extend the equivalence proofs given for the lin-ear case to the kernel version.
References
Alpaydin, E., 2004. Introduction to Machine Learning (Adaptive Computation andMachine Learning Series). The MIT Press.
Barker, M., Rayens, W., 2003. Partial least squares for discrimination. J. Chemometr.17, 166–173.
Bartlett, M.S., 1938. Further aspects of the theory of multiple regression. Proc.Cambridge Philos. Soc. 34, 33–40.
Becker, S., 1999. Implicit learning in 3d object recognition: The importance oftemporal context. Neural Comput. 11, 347–374.
Borga, M., Knutsson, H., 2001. A Canonical Correlation Approach to Blind SourceSeparation. Technical Report LiU-IMT-EX-0062. Department of BiomedicalEngineering, Linköping University, Sweden.
Borga, M., 1998. Learning Multidimensional Signal Processing, Ph.D. Thesis.Department of Electrical Engineering, Linköping University, Linköping, Sweden.
Farquhar, J.D.R., Hardoon, D.R., Meng, H., Shawe-Taylor, J., Szedmak, S., 2005. Twoview learning: SVM-2K, theory and practice. In: Proceedings of NIPS.
Favorov, O.V., Ryder, D., 2004. SINBAD: A neocortical mechanism for discoveringenvironmental variables and regularities hidden in sensory input. BiologicalCybernet. 90, 191–202.
Favorov, O.V., Ryder, D., Hester, J.T., Kelly, D.G., Tommerdahl, M., 2003. The corticalpyramidal cell as a set of interacting error backpropagating networks: Amechanism for discovering nature’s order. In: Hecht-Nielsen, R., McKenna, T.(Eds.), Theories of the Cerebral Cortex. Springer, London, pp. 25–64.
Fisher, R.A., 1936. The use of multiple measurements in taxonomic problems. Ann.Eugenic. 7, 179–188.
Fyfe, C., 2005. Hebbian Learning and Negative Feedback Networks. Springer.Gestel, T.V., Suykens, J.A.K., De Brabanter, J., De Moor, B., Vandewalle, J., 2001.
Kernel canonical correlation analysis and least squares support vectormachines. In: Proceedings of the International Conference on Artificial NeuralNetworks (ICANN 2001), pp. 384–389.
Glendinning, R.H., Herbert, R.A., 2003. Shape classification using smooth principalcomponents. Pattern Recognition Lett. 24 (12), 2021–2030.
Gonen, M., Alpaydin, E., 2010. Cost-conscious multiple kernel learning. PatternRecognition Lett. 31 (9), 959–965.
Hardoon, D., Szedmak, S., Shawe-Taylor, J., 2004. Canonical correlation analysis: Anoverview with application to learning methods. Neural Comput. 16, 2639–2664.
Hastie, T., Buja, A., Tibshirani, R., 1995. Penalized discriminant analysis. Ann. Statist.23 (1), 73–102.
Hotelling, H., 1936. Relations between two sets of variates. Biometrika 28, 321–377.Izenman, A.J., 2008. Modern Multivariate Statistical Techniques. Springer.Johansson, B., 2001. On Classification: Simultaneously Reducing Dimensionality and
Finding Automatic Representation Using Canonical Correlation. TechnicalReport LiTH-ISY-R-2375. ISSN 1400-3902, Linkoping University.
Kording, K.P., Konig, P., 2000. Learning with two sites of synaptic integration.Network: Comput. Neural Systems 11, 25–39.
Kursun, O., Alpaydin, E., 2010. Canonical correlation analysis for multiviewsemisupervised feature extraction. In: L. Rutkowski et al. (Eds.), Proceedingsof the 10th International Conference on Artificial Intelligence and SoftComputing (ICAISC 2010) Part I. Springer, Poland, pp. 216–223.
Kursun, O., Favorov, O.V., 2010. Feature selection and extraction using anunsupervised biologically-suggested approximation to Gebelein’s maximalcorrelation. Internat. J. Pattern Recognition Artif. Intell. 24 (3), 337–358.
Lai, P.L., Fyfe, C., 1999. A neural network implementation of canonical correlation.Neural Networks 12 (10), 1391–1397.
Lee, Y.J., Huang, S.Y., 2007. Reduced support vector machines: A statistical theory.IEEE Trans. Neural Networks 18, 1–13.
Lee, Y.J., Mangasarian, O.L., 2001. RSVM: Reduced support vector machines. InProceedings of the First SIAM International Conference on Data Mining, Chicago.
Loog, M., van Ginneken, B., Duin, R.P.W., 2005. Dimensionality reduction of imagefeatures using the canonical contextual correlation projection. PatternRecognition 38, 2409–2418.
Melzer, T., Reiter, M., Bischof, H., 2003. Appearance models based on kernelcanonical correlation analysis. Pattern Recognition 36, 1961–1971.
Phillips, W.A., Singer, W., 1997. In search of common foundations for corticalcomputation. Behav. Brain Sci. 20, 657–722.
Phillips, W.A., Kay, J., Smyth, D., 1995. The discovery of structure by multi-streamnetworks of local processors with contextual guidance. Network: Comput.Neural Systems 6, 225–246.
Raudys, S., Duin, R.P.W., 1998. Expected classification error of the Fisher linearclassifier with pseudo-inverse covariance matrix. Pattern Recognititon Lett. 19(5–6), 385–392.
Rencher, A.C., 1997. Multivariate Statistical Inference and Applications. Wiley-Interscience.
Shawe-Taylor, J., Cristianini, N., 2004. Kernel Methods for Pattern Analysis.Cambridge University Press.
Stone, J., 1996. Learning perceptually salient visual parameters usingspatiotemporal smoothness constraints. Neural Comput. 8, 1463–1492.
Sugiyama, M., 2007. Dimensionality reduction of multimodal labeled data by localFisher discriminant analysis. J. Machine Learn. Res. 8, 1027–1061.
Sun, T., Chen, S., 2007. Class label versus sample label-based CCA. Appl. Math.Comput. 185, 272–283.