paper how-138 making sense of proc tabulate jonas v ... · making sense of proc tabulate sesug 2016...
TRANSCRIPT
SESUG 2016
1
Paper HOW-138
Making Sense of PROC TABULATE Jonas V. Bilenas, Barclays PCB; Kajal Tahiliani, PRA Health Sciences
ABSTRACT The TABULATE procedure in SAS® provides a flexible platform to generate tabular reports. Many beginning SAS programmers have a difficult time understanding the syntax of PROC TABULATE and tend to avoid using the procedure. This tutorial will explain the syntax of PROC TABULATE and, with examples, show how to grasp the power of PROC TABULATE. The data used in this paper represents simulated consumer credit card usage data and the code was developed using SAS 9. This updates the paper presented at NESUG in 2001 with the same title.
INTRODUCTION PROC TABULATE is based on a table generation code developed by the U.S. Department of Labor. The syntax does not resemble other SAS PROCS and will appear to be cryptic to the beginning SAS programmer. To make matters worse, looking at sample TABULATE code provides no clue for the novice TABULATE user. Sample code often looks like long mathematical equations that make no sense to the individual learning TABULATE. Frustration often leads to dismissal of the procedure.
The TABULATE procedure is so flexible that there is no single correct way of generating tabular reports. The method I propose in this paper is the way I have learned TABULATE and still use it to generate custom tabular reports. I teach this method to all new users of TABULATE and find it helps them grasp the procedure. Here are my 9 steps to generate tabular reports using PROC TABULATE:
1. Don’t panic. Relax and take a few meditative breaths.
2. Design the report on paper. The design of the TABULATE report should be first specified on paper. The report design that is developed on paper will guide the code generation.
3. Generate the initial test code. Return to the computer and start coding the design that you have formulated on paper. There are a few rules of TABULATE syntax that will generate the report and we will review these here.
4. Test, retest and verify using a small sample. Test the initial code using a small number of observations. Use a random sample or use an OBS= option to test the syntax. TABULATE is tricky and you may have to run a few versions of your code and possibly include some DATA preparation. Verify that the results make sense. Look at your data and report! Don’t assume the report is correct just because you have no syntax errors. At this step, don’t be too concerned with report appearance. Verify that the results are correct.
5. Clean up the appearance of the report. Once the code has generated a report that makes sense, clean up the output of the report using a few tricks we will review here. Also consider adding additional summaries and or statistics to make the report even more useful.
6. Run code with OBS=MAX.
7. Add some ODS functionality.
8. Need to generate multi-label formats? SAS8 introduced multi-label formats to be used with PROC TABULATE. An example is shown.
9. Sit back, smile and be proud of your report. Your manager may be confused at how you were able to produce the report without sorting the data or without any spreadsheet crunching. He/She may be confused at your code, but then you can take him/her through the 9 steps of TABULATE bliss.
Making Sense of PROC TABULATE SESUG 2016
2
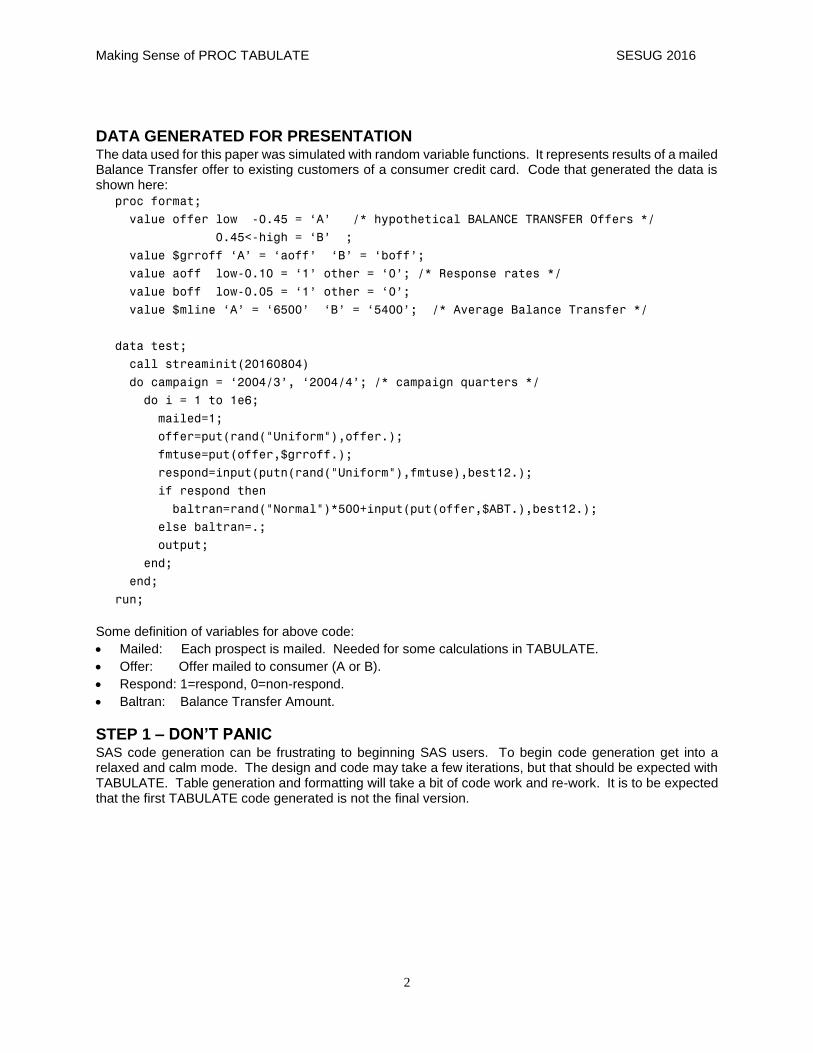
DATA GENERATED FOR PRESENTATION The data used for this paper was simulated with random variable functions. It represents results of a mailed Balance Transfer offer to existing customers of a consumer credit card. Code that generated the data is shown here:
proc format;
value offer low -0.45 = ‘A’ /* hypothetical BALANCE TRANSFER Offers */
0.45<-high = ‘B’ ;
value $grroff ‘A’ = ‘aoff’ ‘B’ = ‘boff’;
value aoff low-0.10 = ‘1’ other = ‘0’; /* Response rates */
value boff low-0.05 = ‘1’ other = ‘0’;
value $mline ‘A’ = ‘6500’ ‘B’ = ‘5400’; /* Average Balance Transfer */
data test;
call streaminit(20160804)
do campaign = ‘2004/3’, ‘2004/4’; /* campaign quarters */
do i = 1 to 1e6;
mailed=1;
offer=put(rand("Uniform"),offer.);
fmtuse=put(offer,$grroff.);
respond=input(putn(rand("Uniform"),fmtuse),best12.);
if respond then
baltran=rand("Normal")*500+input(put(offer,$ABT.),best12.);
else baltran=.;
output;
end;
end;
run;
Some definition of variables for above code:
Mailed: Each prospect is mailed. Needed for some calculations in TABULATE.
Offer: Offer mailed to consumer (A or B).
Respond: 1=respond, 0=non-respond.
Baltran: Balance Transfer Amount.
STEP 1 – DON’T PANIC SAS code generation can be frustrating to beginning SAS users. To begin code generation get into a relaxed and calm mode. The design and code may take a few iterations, but that should be expected with TABULATE. Table generation and formatting will take a bit of code work and re-work. It is to be expected that the first TABULATE code generated is not the final version.
Making Sense of PROC TABULATE SESUG 2016
3
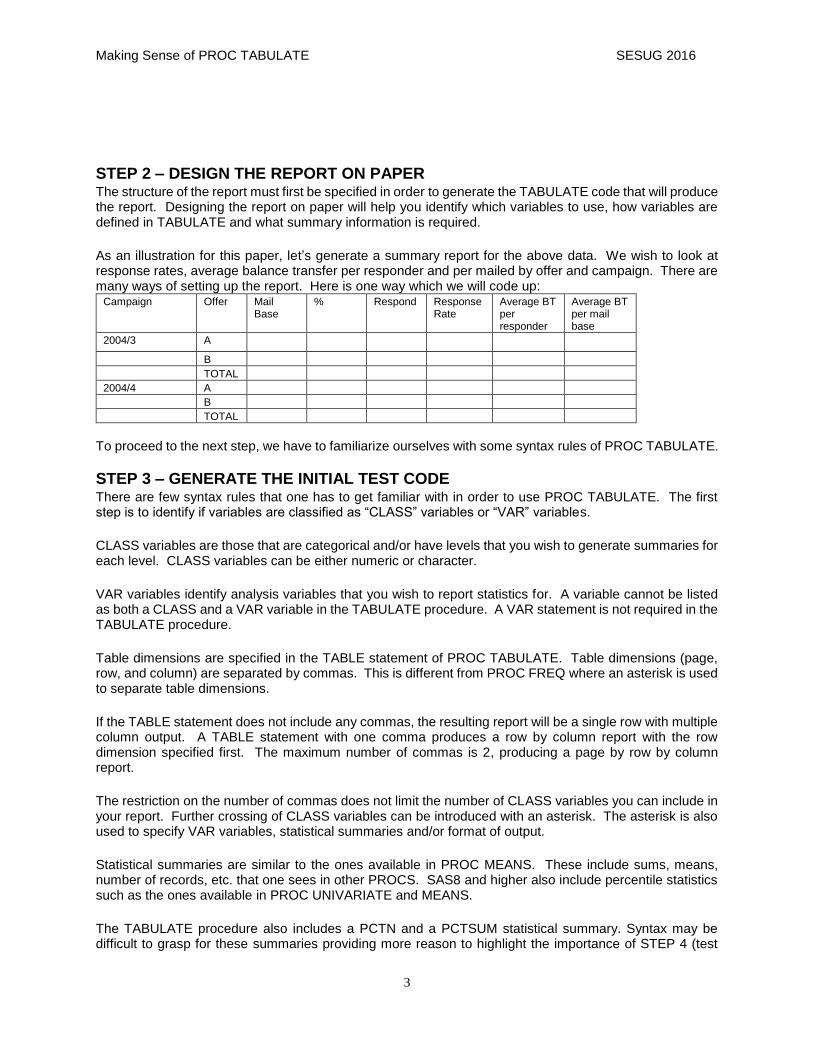
STEP 2 – DESIGN THE REPORT ON PAPER The structure of the report must first be specified in order to generate the TABULATE code that will produce the report. Designing the report on paper will help you identify which variables to use, how variables are defined in TABULATE and what summary information is required.
As an illustration for this paper, let’s generate a summary report for the above data. We wish to look at response rates, average balance transfer per responder and per mailed by offer and campaign. There are many ways of setting up the report. Here is one way which we will code up:
Campaign Offer Mail Base
% Respond Response Rate
Average BT per responder
Average BT per mail base
2004/3 A
B
TOTAL
2004/4 A
B
TOTAL
To proceed to the next step, we have to familiarize ourselves with some syntax rules of PROC TABULATE.
STEP 3 – GENERATE THE INITIAL TEST CODE There are few syntax rules that one has to get familiar with in order to use PROC TABULATE. The first step is to identify if variables are classified as “CLASS” variables or “VAR” variables.
CLASS variables are those that are categorical and/or have levels that you wish to generate summaries for each level. CLASS variables can be either numeric or character.
VAR variables identify analysis variables that you wish to report statistics for. A variable cannot be listed as both a CLASS and a VAR variable in the TABULATE procedure. A VAR statement is not required in the TABULATE procedure.
Table dimensions are specified in the TABLE statement of PROC TABULATE. Table dimensions (page, row, and column) are separated by commas. This is different from PROC FREQ where an asterisk is used to separate table dimensions.
If the TABLE statement does not include any commas, the resulting report will be a single row with multiple column output. A TABLE statement with one comma produces a row by column report with the row dimension specified first. The maximum number of commas is 2, producing a page by row by column report.
The restriction on the number of commas does not limit the number of CLASS variables you can include in your report. Further crossing of CLASS variables can be introduced with an asterisk. The asterisk is also used to specify VAR variables, statistical summaries and/or format of output.
Statistical summaries are similar to the ones available in PROC MEANS. These include sums, means, number of records, etc. that one sees in other PROCS. SAS8 and higher also include percentile statistics such as the ones available in PROC UNIVARIATE and MEANS.
The TABULATE procedure also includes a PCTN and a PCTSUM statistical summary. Syntax may be difficult to grasp for these summaries providing more reason to highlight the importance of STEP 4 (test
Making Sense of PROC TABULATE SESUG 2016
4
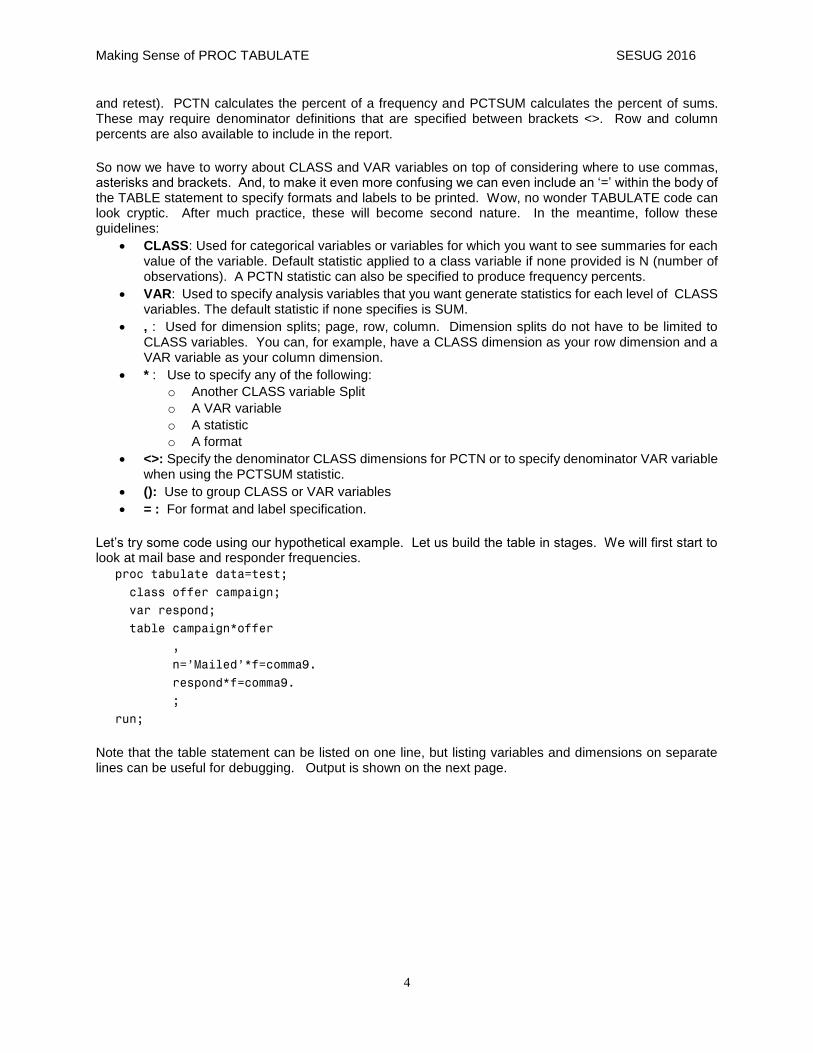
and retest). PCTN calculates the percent of a frequency and PCTSUM calculates the percent of sums. These may require denominator definitions that are specified between brackets <>. Row and column percents are also available to include in the report.
So now we have to worry about CLASS and VAR variables on top of considering where to use commas, asterisks and brackets. And, to make it even more confusing we can even include an ‘=’ within the body of the TABLE statement to specify formats and labels to be printed. Wow, no wonder TABULATE code can look cryptic. After much practice, these will become second nature. In the meantime, follow these guidelines:
CLASS: Used for categorical variables or variables for which you want to see summaries for each value of the variable. Default statistic applied to a class variable if none provided is N (number of observations). A PCTN statistic can also be specified to produce frequency percents.
VAR: Used to specify analysis variables that you want generate statistics for each level of CLASS variables. The default statistic if none specifies is SUM.
, : Used for dimension splits; page, row, column. Dimension splits do not have to be limited to CLASS variables. You can, for example, have a CLASS dimension as your row dimension and a VAR variable as your column dimension.
* : Use to specify any of the following:
o Another CLASS variable Split
o A VAR variable
o A statistic
o A format
<>: Specify the denominator CLASS dimensions for PCTN or to specify denominator VAR variable when using the PCTSUM statistic.
(): Use to group CLASS or VAR variables
= : For format and label specification.
Let’s try some code using our hypothetical example. Let us build the table in stages. We will first start to look at mail base and responder frequencies.
proc tabulate data=test;
class offer campaign;
var respond;
table campaign*offer
,
n=’Mailed’*f=comma9.
respond*f=comma9.
;
run;
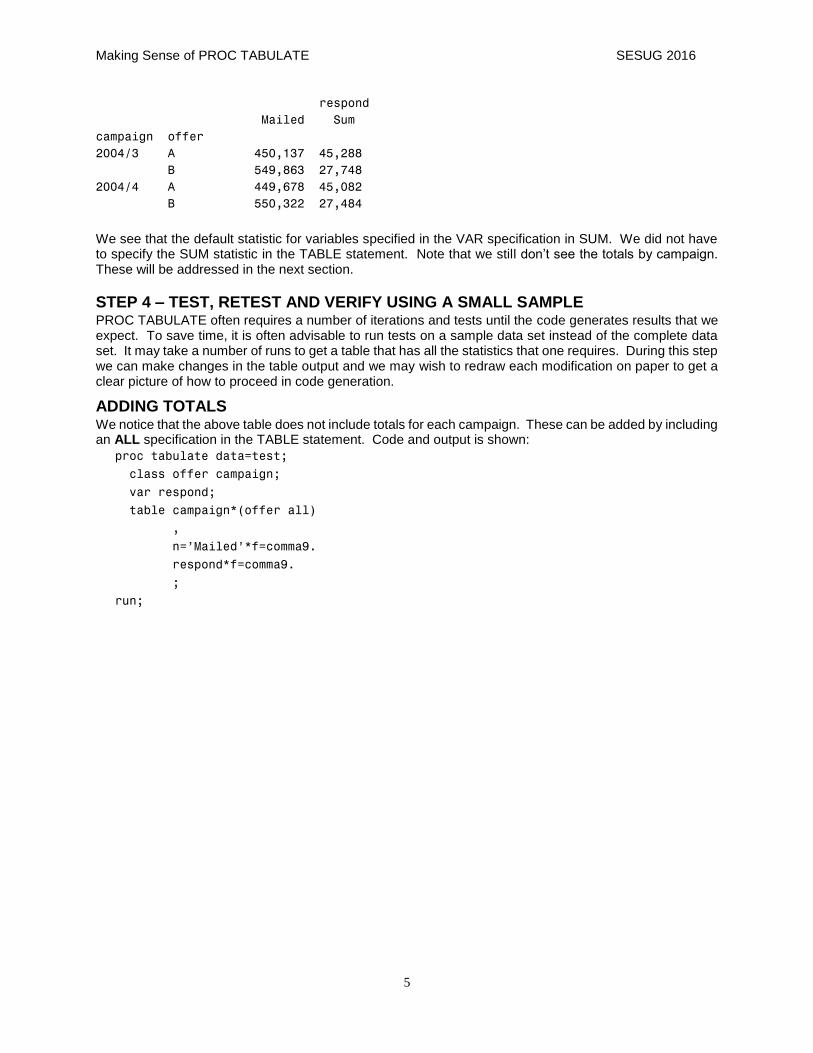
Note that the table statement can be listed on one line, but listing variables and dimensions on separate lines can be useful for debugging. Output is shown on the next page.
Making Sense of PROC TABULATE SESUG 2016
5
respond
Mailed Sum
campaign offer
2004/3 A 450,137 45,288
B 549,863 27,748
2004/4 A 449,678 45,082
B 550,322 27,484
We see that the default statistic for variables specified in the VAR specification in SUM. We did not have to specify the SUM statistic in the TABLE statement. Note that we still don’t see the totals by campaign. These will be addressed in the next section.
STEP 4 – TEST, RETEST AND VERIFY USING A SMALL SAMPLE PROC TABULATE often requires a number of iterations and tests until the code generates results that we expect. To save time, it is often advisable to run tests on a sample data set instead of the complete data set. It may take a number of runs to get a table that has all the statistics that one requires. During this step we can make changes in the table output and we may wish to redraw each modification on paper to get a clear picture of how to proceed in code generation.
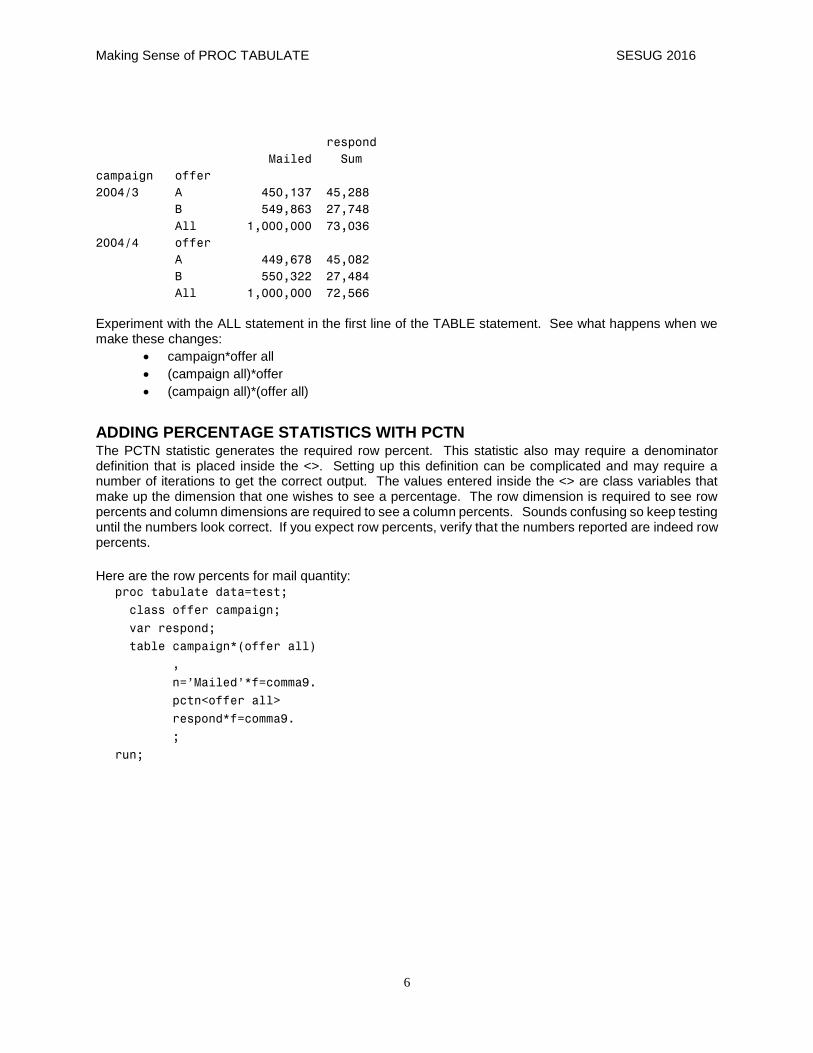
ADDING TOTALS We notice that the above table does not include totals for each campaign. These can be added by including an ALL specification in the TABLE statement. Code and output is shown:
proc tabulate data=test;
class offer campaign;
var respond;
table campaign*(offer all)
,
n=’Mailed’*f=comma9.
respond*f=comma9.
;
run;
Making Sense of PROC TABULATE SESUG 2016
6
respond
Mailed Sum
campaign offer
2004/3 A 450,137 45,288
B 549,863 27,748
All 1,000,000 73,036
2004/4 offer
A 449,678 45,082
B 550,322 27,484
All 1,000,000 72,566
Experiment with the ALL statement in the first line of the TABLE statement. See what happens when we make these changes:
campaign*offer all
(campaign all)*offer
(campaign all)*(offer all)
ADDING PERCENTAGE STATISTICS WITH PCTN The PCTN statistic generates the required row percent. This statistic also may require a denominator definition that is placed inside the <>. Setting up this definition can be complicated and may require a number of iterations to get the correct output. The values entered inside the <> are class variables that make up the dimension that one wishes to see a percentage. The row dimension is required to see row percents and column dimensions are required to see a column percents. Sounds confusing so keep testing until the numbers look correct. If you expect row percents, verify that the numbers reported are indeed row percents.
Here are the row percents for mail quantity:
proc tabulate data=test;
class offer campaign;
var respond;
table campaign*(offer all)
,
n=’Mailed’*f=comma9.
pctn<offer all>
respond*f=comma9.
;
run;
Making Sense of PROC TABULATE SESUG 2016
7
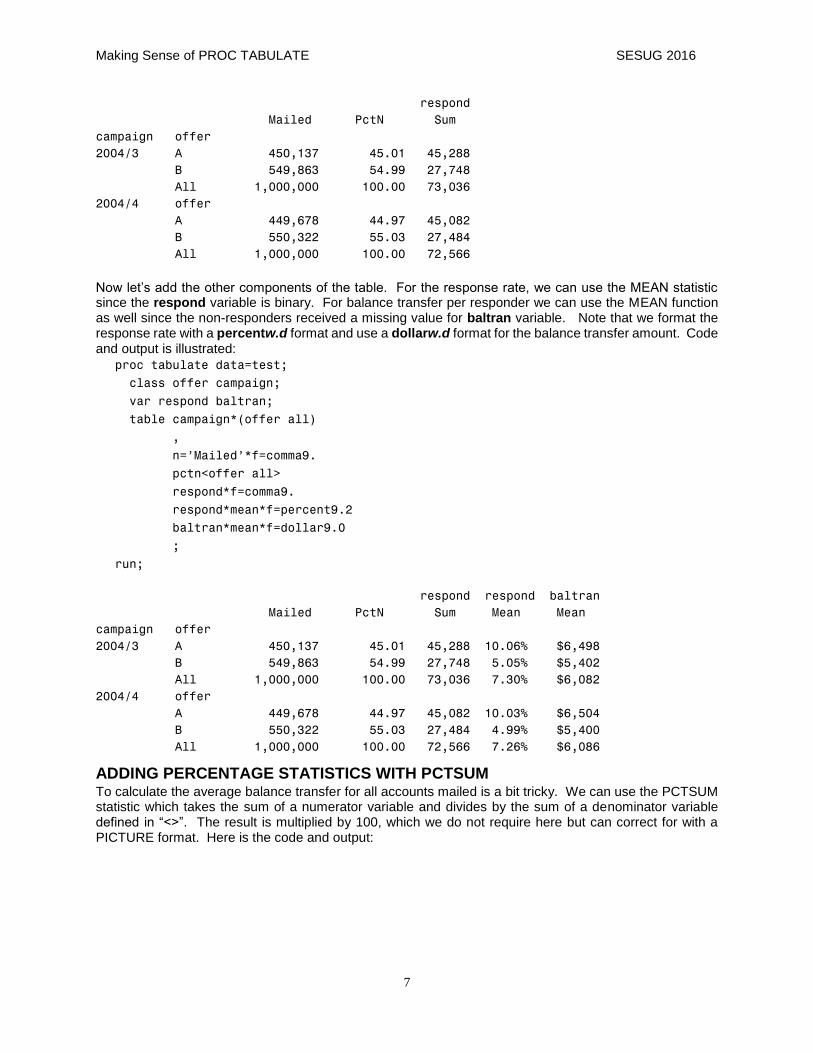
respond
Mailed PctN Sum
campaign offer
2004/3 A 450,137 45.01 45,288
B 549,863 54.99 27,748
All 1,000,000 100.00 73,036
2004/4 offer
A 449,678 44.97 45,082
B 550,322 55.03 27,484
All 1,000,000 100.00 72,566
Now let’s add the other components of the table. For the response rate, we can use the MEAN statistic since the respond variable is binary. For balance transfer per responder we can use the MEAN function as well since the non-responders received a missing value for baltran variable. Note that we format the response rate with a percentw.d format and use a dollarw.d format for the balance transfer amount. Code and output is illustrated:
proc tabulate data=test;
class offer campaign;
var respond baltran;
table campaign*(offer all)
,
n=’Mailed’*f=comma9.
pctn<offer all>
respond*f=comma9.
respond*mean*f=percent9.2
baltran*mean*f=dollar9.0
;
run;
respond respond baltran
Mailed PctN Sum Mean Mean
campaign offer
2004/3 A 450,137 45.01 45,288 10.06% $6,498
B 549,863 54.99 27,748 5.05% $5,402
All 1,000,000 100.00 73,036 7.30% $6,082
2004/4 offer
A 449,678 44.97 45,082 10.03% $6,504
B 550,322 55.03 27,484 4.99% $5,400
All 1,000,000 100.00 72,566 7.26% $6,086
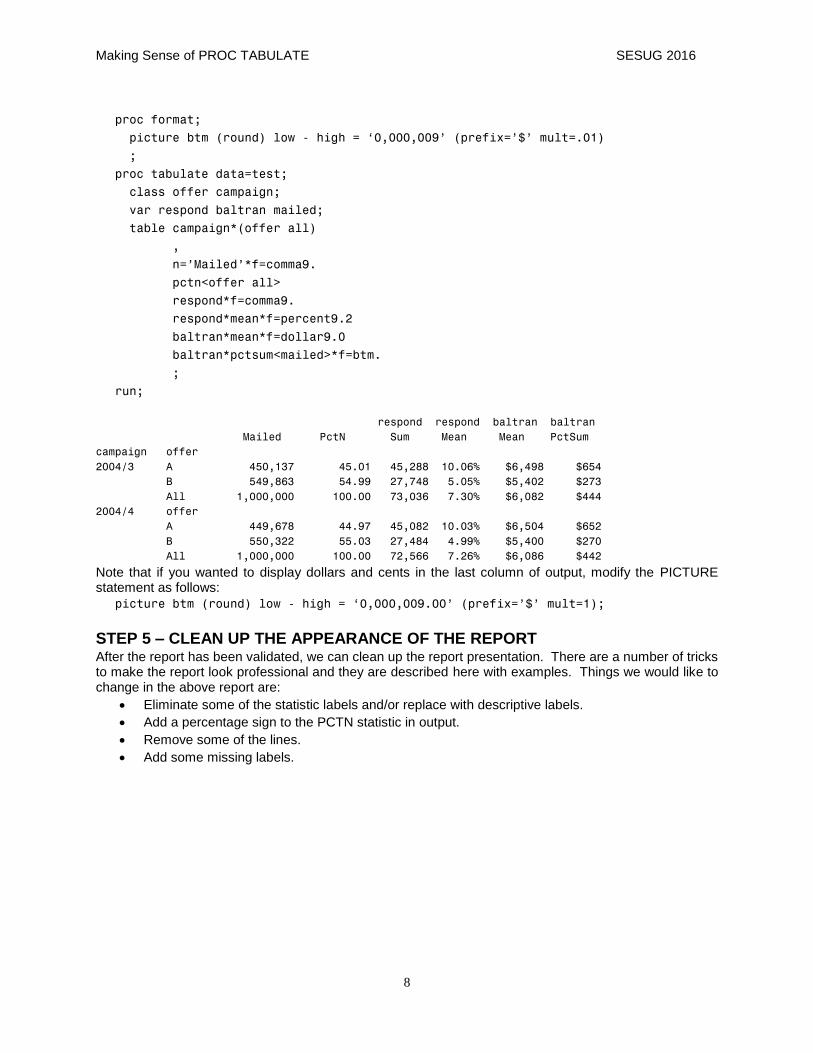
ADDING PERCENTAGE STATISTICS WITH PCTSUM To calculate the average balance transfer for all accounts mailed is a bit tricky. We can use the PCTSUM statistic which takes the sum of a numerator variable and divides by the sum of a denominator variable defined in “<>”. The result is multiplied by 100, which we do not require here but can correct for with a PICTURE format. Here is the code and output:
Making Sense of PROC TABULATE SESUG 2016
8
proc format;
picture btm (round) low - high = ‘0,000,009’ (prefix=’$’ mult=.01)
;
proc tabulate data=test;
class offer campaign;
var respond baltran mailed;
table campaign*(offer all)
,
n=’Mailed’*f=comma9.
pctn<offer all>
respond*f=comma9.
respond*mean*f=percent9.2
baltran*mean*f=dollar9.0
baltran*pctsum<mailed>*f=btm.
;
run;
respond respond baltran baltran
Mailed PctN Sum Mean Mean PctSum
campaign offer
2004/3 A 450,137 45.01 45,288 10.06% $6,498 $654
B 549,863 54.99 27,748 5.05% $5,402 $273
All 1,000,000 100.00 73,036 7.30% $6,082 $444
2004/4 offer
A 449,678 44.97 45,082 10.03% $6,504 $652
B 550,322 55.03 27,484 4.99% $5,400 $270
All 1,000,000 100.00 72,566 7.26% $6,086 $442
Note that if you wanted to display dollars and cents in the last column of output, modify the PICTURE statement as follows:
picture btm (round) low - high = ‘0,000,009.00’ (prefix=’$’ mult=1);
STEP 5 – CLEAN UP THE APPEARANCE OF THE REPORT After the report has been validated, we can clean up the report presentation. There are a number of tricks to make the report look professional and they are described here with examples. Things we would like to change in the above report are:
Eliminate some of the statistic labels and/or replace with descriptive labels.
Add a percentage sign to the PCTN statistic in output.
Remove some of the lines.
Add some missing labels.
Making Sense of PROC TABULATE SESUG 2016
9
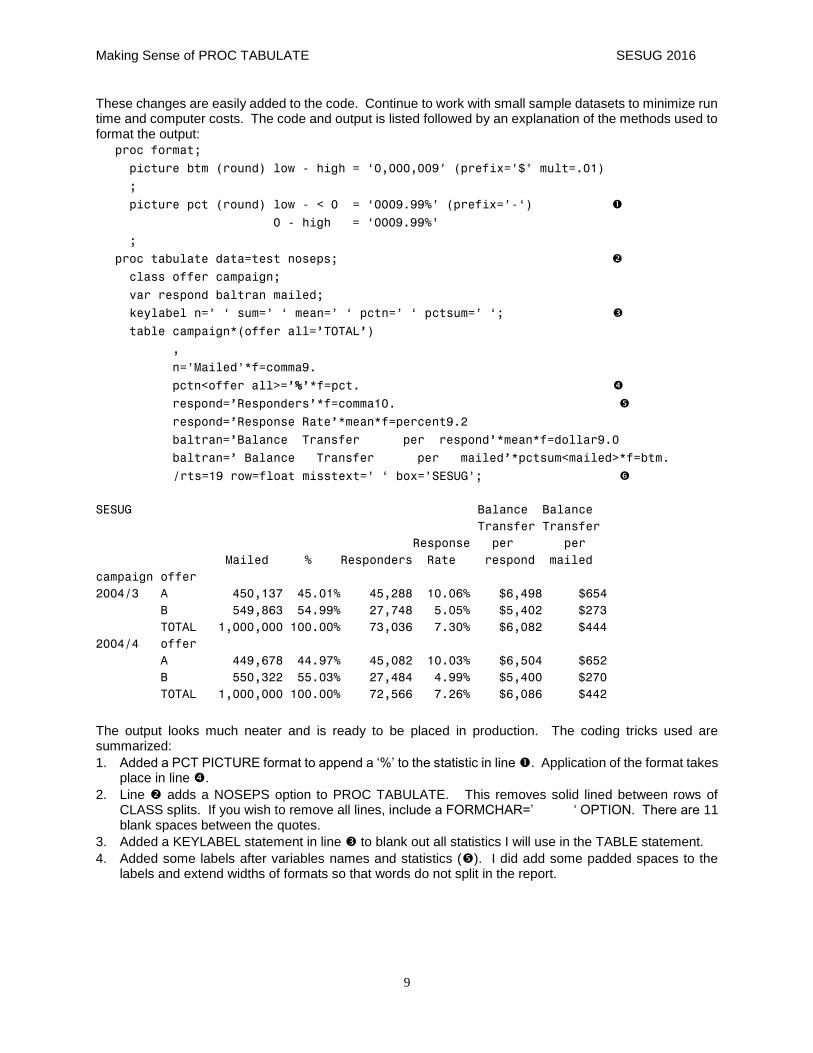
These changes are easily added to the code. Continue to work with small sample datasets to minimize run time and computer costs. The code and output is listed followed by an explanation of the methods used to format the output:
proc format;
picture btm (round) low - high = ‘0,000,009’ (prefix=’$’ mult=.01)
;
picture pct (round) low - < 0 = ‘0009.99%’ (prefix=’-‘)
0 - high = ‘0009.99%’
;
proc tabulate data=test noseps;
class offer campaign;
var respond baltran mailed;
keylabel n=’ ‘ sum=’ ‘ mean=’ ‘ pctn=’ ‘ pctsum=’ ‘;
table campaign*(offer all=’TOTAL’)
,
n=’Mailed’*f=comma9.
pctn<offer all>=’%’*f=pct.
respond=’Responders’*f=comma10.
respond=’Response Rate’*mean*f=percent9.2
baltran=’Balance Transfer per respond’*mean*f=dollar9.0
baltran=’ Balance Transfer per mailed’*pctsum<mailed>*f=btm.
/rts=19 row=float misstext=’ ‘ box=’SESUG’;
SESUG Balance Balance
Transfer Transfer
Response per per
Mailed % Responders Rate respond mailed
campaign offer
2004/3 A 450,137 45.01% 45,288 10.06% $6,498 $654
B 549,863 54.99% 27,748 5.05% $5,402 $273
TOTAL 1,000,000 100.00% 73,036 7.30% $6,082 $444
2004/4 offer
A 449,678 44.97% 45,082 10.03% $6,504 $652
B 550,322 55.03% 27,484 4.99% $5,400 $270
TOTAL 1,000,000 100.00% 72,566 7.26% $6,086 $442
The output looks much neater and is ready to be placed in production. The coding tricks used are summarized:
1. Added a PCT PICTURE format to append a ‘%’ to the statistic in line . Application of the format takes place in line .
2. Line adds a NOSEPS option to PROC TABULATE. This removes solid lined between rows of CLASS splits. If you wish to remove all lines, include a FORMCHAR=’ ‘ OPTION. There are 11 blank spaces between the quotes.
3. Added a KEYLABEL statement in line to blank out all statistics I will use in the TABLE statement.
4. Added some labels after variables names and statistics (). I did add some padded spaces to the labels and extend widths of formats so that words do not split in the report.
Making Sense of PROC TABULATE SESUG 2016
10
5. TABLE OPTIONS in line :
RTS shrinks the space of the first column in the report.
ROW=FLOAT divides the row title space equally among the nonblank row titles in the crossing.
MISSTEXT= adds a label if the statistic is missing as opposed to default missing values.
BOX= adds a title placed in the upper left box of the table. If you have page dimensions in your table, you can specify BOX=_PAGE_ to provide page split values in the box.
STEP 6 - RUN CODE WITH OBS=MAX Run production code on the full data set. Always test TABULATE code on smaller data. This is more efficient and time saving especially for large data.
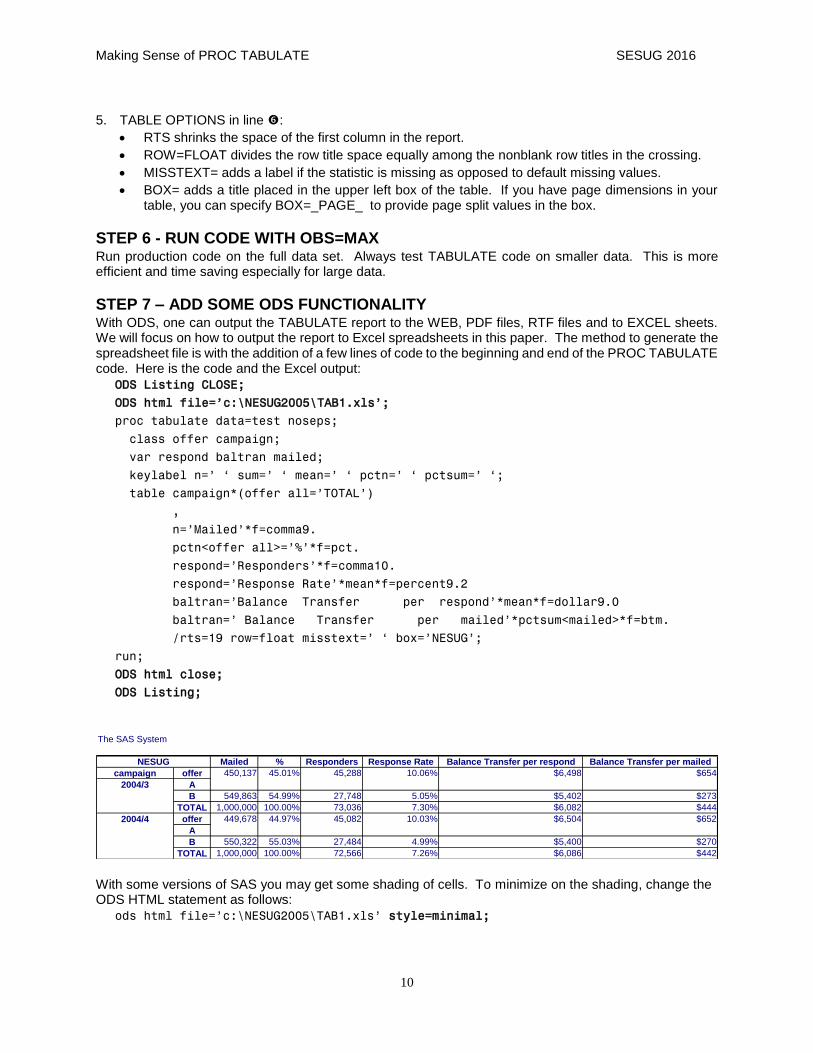
STEP 7 – ADD SOME ODS FUNCTIONALITY With ODS, one can output the TABULATE report to the WEB, PDF files, RTF files and to EXCEL sheets. We will focus on how to output the report to Excel spreadsheets in this paper. The method to generate the spreadsheet file is with the addition of a few lines of code to the beginning and end of the PROC TABULATE code. Here is the code and the Excel output:
ODS Listing CLOSE;
ODS html file=’c:\NESUG2005\TAB1.xls’;
proc tabulate data=test noseps;
class offer campaign;
var respond baltran mailed;
keylabel n=’ ‘ sum=’ ‘ mean=’ ‘ pctn=’ ‘ pctsum=’ ‘;
table campaign*(offer all=’TOTAL’)
,
n=’Mailed’*f=comma9.
pctn<offer all>=’%’*f=pct.
respond=’Responders’*f=comma10.
respond=’Response Rate’*mean*f=percent9.2
baltran=’Balance Transfer per respond’*mean*f=dollar9.0
baltran=’ Balance Transfer per mailed’*pctsum<mailed>*f=btm.
/rts=19 row=float misstext=’ ‘ box=’NESUG’;
run;
ODS html close;
ODS Listing;
With some versions of SAS you may get some shading of cells. To minimize on the shading, change the ODS HTML statement as follows:
ods html file=’c:\NESUG2005\TAB1.xls’ style=minimal;
The SAS System
Mailed % Responders Response Rate Balance Transfer per respond Balance Transfer per mailed
campaign offer
A
B 549,863 54.99% 27,748 5.05% $5,402 $273
TOTAL 1,000,000 100.00% 73,036 7.30% $6,082 $444
offer
A
B 550,322 55.03% 27,484 4.99% $5,400 $270
TOTAL 1,000,000 100.00% 72,566 7.26% $6,086 $442
10.03% $6,504 $652 2004/4 449,678 44.97% 45,082
10.06% $6,498 $654
2004/3
NESUG
450,137 45.01% 45,288
Making Sense of PROC TABULATE SESUG 2016
11
Want to eliminate all lines in the report? Look at SAS support document:
http://support.sas.com/sassamples/quicktips/04feb/ods-excel.html
The text will tell you how to create a modified style called NOBORDER that you can use in the STYLE option.
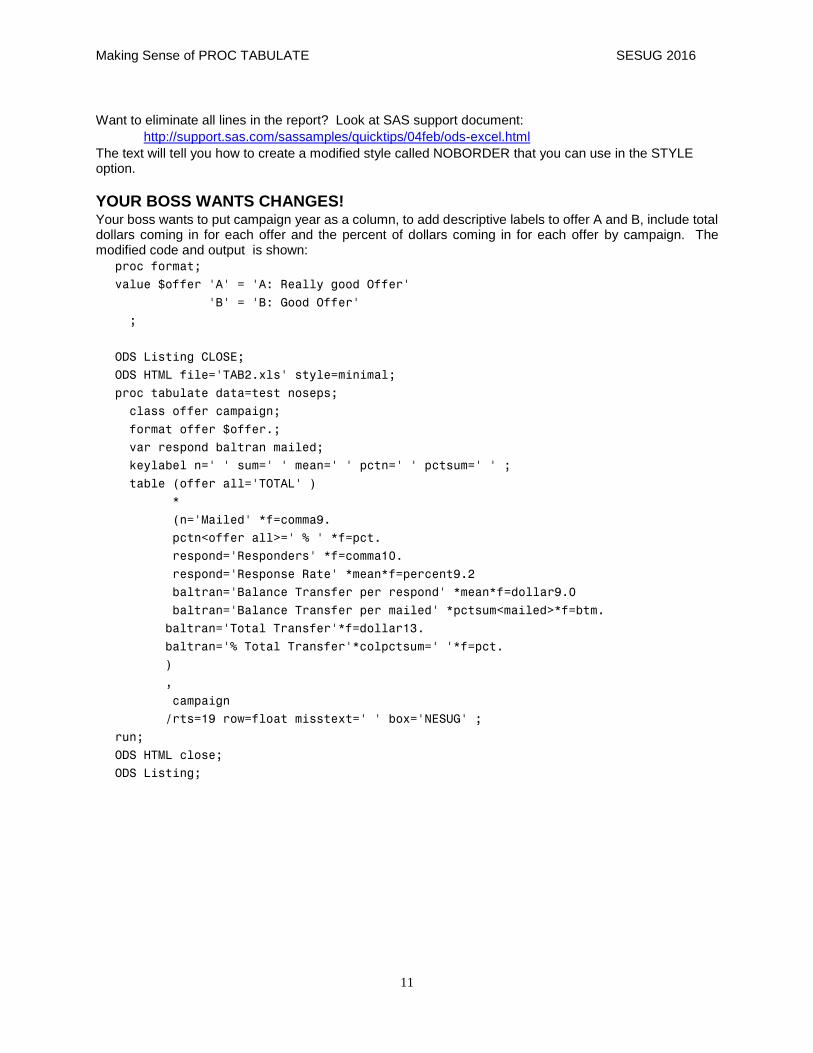
YOUR BOSS WANTS CHANGES! Your boss wants to put campaign year as a column, to add descriptive labels to offer A and B, include total dollars coming in for each offer and the percent of dollars coming in for each offer by campaign. The modified code and output is shown:
proc format;
value $offer 'A' = 'A: Really good Offer'
'B' = 'B: Good Offer'
;
ODS Listing CLOSE;
ODS HTML file='TAB2.xls' style=minimal;
proc tabulate data=test noseps;
class offer campaign;
format offer $offer.;
var respond baltran mailed;
keylabel n=' ' sum=' ' mean=' ' pctn=' ' pctsum=' ' ;
table (offer all='TOTAL' )
*
(n='Mailed' *f=comma9.
pctn<offer all>=' % ' *f=pct.
respond='Responders' *f=comma10.
respond='Response Rate' *mean*f=percent9.2
baltran='Balance Transfer per respond' *mean*f=dollar9.0
baltran='Balance Transfer per mailed' *pctsum<mailed>*f=btm.
baltran='Total Transfer'*f=dollar13.
baltran='% Total Transfer'*colpctsum=' '*f=pct.
)
,
campaign
/rts=19 row=float misstext=' ' box='NESUG' ;
run;
ODS HTML close;
ODS Listing;
Making Sense of PROC TABULATE SESUG 2016
12
STEP 8 – NEED TO GENERATE MULTI-LABEL FORMATS? SAS8 introduced the capability of generating multi-label formats. These formats can be used in PROC SUMMARY (MEANS) and TABULATE. An example is taken from my NESUG 2004 paper titled “The Power of PROC FORMAT (Updated for SAS8 and SAS9)”. In this example we look at credit card application decision results. There are 3 approval codes and 2 decline codes. The goal is to provide counts for each decision code and then have totals for approvals and declines. Code is shown next. Note that code to generate the data is available in the NESUG paper.
proc format;
picture p8r (round)
low - < 0 = '0009.99%' (prefix='-')
0 - high = '0009.99%'
;
value $deccode (multilabel notsorted)
'a0' - 'a9' = 'APPROVE TOTALS'
'a1' = ' a1: Approval'
'a2' = ' a2: Weak Approval'
'a4' = ' a4: Approved Alternate Product'
'd0' - 'd9' = 'DECLINE TOTALS'
'd1' = ' d1: Decline for Credit'
'd6' = ' d6: Decline Other'
;
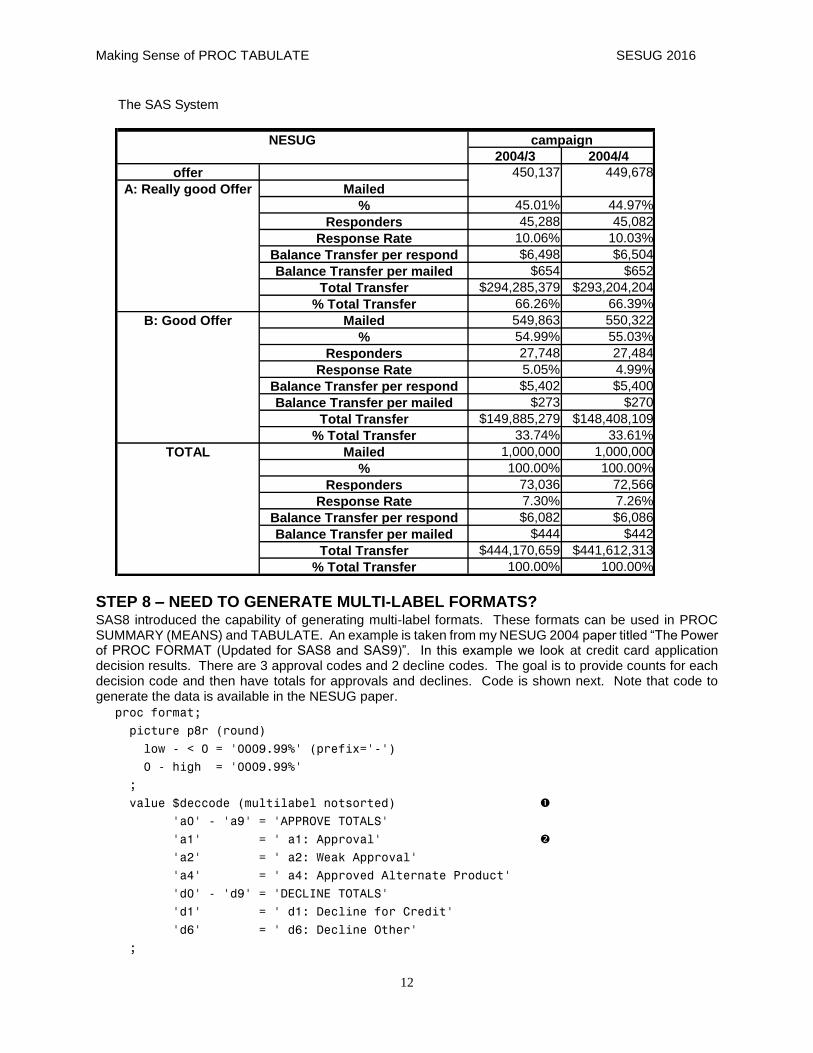
The SAS System
2004/3 2004/4
offer
Mailed
% 45.01% 44.97%
Responders 45,288 45,082
Response Rate 10.06% 10.03%
Balance Transfer per respond $6,498 $6,504
Balance Transfer per mailed $654 $652
Total Transfer $294,285,379 $293,204,204
% Total Transfer 66.26% 66.39%
Mailed 549,863 550,322
% 54.99% 55.03%
Responders 27,748 27,484
Response Rate 5.05% 4.99%
Balance Transfer per respond $5,402 $5,400
Balance Transfer per mailed $273 $270
Total Transfer $149,885,279 $148,408,109
% Total Transfer 33.74% 33.61%
Mailed 1,000,000 1,000,000
% 100.00% 100.00%
Responders 73,036 72,566
Response Rate 7.30% 7.26%
Balance Transfer per respond $6,082 $6,086
Balance Transfer per mailed $444 $442
Total Transfer $444,170,659 $441,612,313
% Total Transfer 100.00% 100.00%
B: Good Offer
TOTAL
NESUG campaign
450,137 449,678
A: Really good Offer
Making Sense of PROC TABULATE SESUG 2016
13
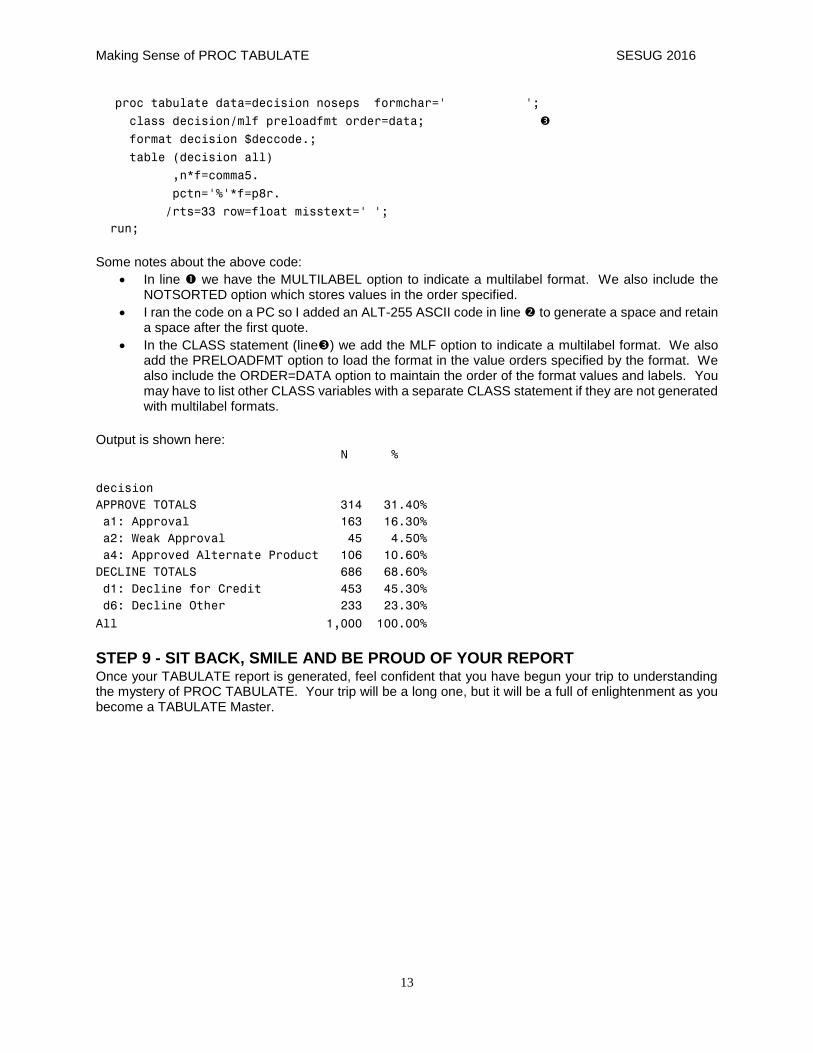
proc tabulate data=decision noseps formchar=' ';
class decision/mlf preloadfmt order=data;
format decision $deccode.;
table (decision all)
,n*f=comma5.
pctn='%'*f=p8r.
/rts=33 row=float misstext=' ';
run;
Some notes about the above code:
In line we have the MULTILABEL option to indicate a multilabel format. We also include the NOTSORTED option which stores values in the order specified.
I ran the code on a PC so I added an ALT-255 ASCII code in line to generate a space and retain a space after the first quote.
In the CLASS statement (line) we add the MLF option to indicate a multilabel format. We also add the PRELOADFMT option to load the format in the value orders specified by the format. We also include the ORDER=DATA option to maintain the order of the format values and labels. You may have to list other CLASS variables with a separate CLASS statement if they are not generated with multilabel formats.
Output is shown here: N %
decision
APPROVE TOTALS 314 31.40%
a1: Approval 163 16.30%
a2: Weak Approval 45 4.50%
a4: Approved Alternate Product 106 10.60%
DECLINE TOTALS 686 68.60%
d1: Decline for Credit 453 45.30%
d6: Decline Other 233 23.30%
All 1,000 100.00%
STEP 9 - SIT BACK, SMILE AND BE PROUD OF YOUR REPORT Once your TABULATE report is generated, feel confident that you have begun your trip to understanding the mystery of PROC TABULATE. Your trip will be a long one, but it will be a full of enlightenment as you become a TABULATE Master.
Making Sense of PROC TABULATE SESUG 2016
14
CONCLUSION The TABULATE procedure is a complex PROC that generates tabular reports. There is no single correct way to generate reports in TABULATE. This paper provided a framework that will help you understand the workings of TABULATE and will provide a starting framework on how to generate table reports using PROC TABULATE.
Often reports can be generated without additional DATA steps. The use of PROC FORMAT can assist in labeling output. DATA steps may be required to generate additional variables for TABULATE output and/or modify variables to generate statistics required in your output.
REFRENCES: Bilenas, J. “The Power of PROC FORMAT (Updated for SAS8 and SAS9)”, NESUG 2004.
www.nesug.org/html/Proceedings/nesug04/pm/pm10.pdf
Bilenas, J. “The Power of PROC FORMAT”, SAS Press, 2005.
CONTACT INFORMATION Your comments and questions are valued and encouraged. Contact the author at:
Jonas V. Bilenas
Barclays PCB
Wilmington, DE 19801
Email: [email protected]
SAS and all other SAS Institute Inc. product or service names are registered trademarks or trademarks of SAS Institute Inc. in the USA and other countries. ® indicates USA registration. Other brand and product names are trademarks of their respective companies.
This work is an independent effort and does not necessarily represent the practices followed at current or previous employers