ovvervviieeww hooff ttthe etkkeenntuucckkyy ... of krs (final... · 1 ovvervviieeww hooff ttthe...
TRANSCRIPT

1
OOVVEERRVVIIEEWW OOFF TTHHEE KKEENNTTUUCCKKYY RREETTIIRREEMMEENNTT SSYYSSTTEEMMSS
ADMINISTRATION & BENEFITS
Background Most Kentucky public employees are provided retirement coverage through one of six state administered retirement systems. These systems are defined benefit plans, which provide lifetime retirement benefits for the employee based upon a formula established by state statute that does not vary with the level of contributions, investment performance, and other relevant factors. This differs from a defined contribution plan, like a 401(k), where the retirement benefits the employee will receive is based upon the account balance accumulated at retirement and does vary based upon the contributions, investment performance, the employee’s life span, and other relevant factors. These state-administered retirement systems, along with Social Security benefits (if applicable), and other sources of retirement income (such as other retirement accounts and post-retirement employment) serve as the basis for providing income to Kentucky public employees during their retirement years.
Note: Teachers participating in the Kentucky Teachers’ Retirement System and some local government employees do not participate in Social Security. State employees, teachers, as well as many local government employees, are eligible to participate in voluntary defined contribution plans offered by the state through the Kentucky Public Employees Deferred Compensation Authority, which includes a 401(k) plan and a 457 plan.
What Is Kentucky Retirement System (KRS)? State employees and many local government employees generally participate in one of the three following retirement systems:
Kentucky Employees Retirement System (KERS). This system was established July 1, 1956 and its membership includes employees of state government, non-teaching staff at regional state supported universities (i.e. Eastern Kentucky University), and employees of local health departments, regional mental health/mental retardation agencies, and other quasi-state agencies. KERS includes both non-hazardous and hazardous duty benefits and contribution structures. KERS is governed by Kentucky Revised Statute 61.510 to 61.705 and Title 105 of the Kentucky Administrative Regulations.
County Employees Retirement System (CERS). This system was established July 1, 1958 and its membership includes employees of city and county governments, police and firefighters, non-teaching staff of local boards of education, circuit clerks, local library employees, and other local government agency employees. CERS includes both non-hazardous and hazardous duty benefits and contribution structures. CERS is governed by Kentucky Revised Statute 78.510 to 78.852 and Title 105 of the Kentucky Administrative Regulations.
State Police Retirement System (SPRS). This system was established July 1, 1958 and its membership includes all uniformed state police officers. SPRS is governed by Kentucky Revised Statute 16.505 to 16.652 and Title 105 of the Kentucky Administrative Regulations.
These three systems are administered under one administrative agency known as the Kentucky Retirement Systems (KRS). In addition to administering pension benefits, KRS is also responsible for the administration of retiree health benefits for members of these systems as well as disability and death benefits.
Note: The other state-administered pension plans include the Kentucky Teachers’ Retirement System (KTRS), the Judicial Retirement Plan (JRP), and the Legislators’ Retirement Plan (LRP). JRP and LRP are administered under one administrative agency known as the Judicial Form Retirement System (JFRS). These systems also administer retiree health benefits and disability/death benefits for their members.
Who Administers KRS? As provided by statute, a nine-member board of trustees oversees the administration of KRS with five trustees being elected by the membership, three being appointed by the Governor, and one being the Secretary of the Personnel Cabinet. The five elected trustees are comprised of two trustees elected by the KERS membership, two elected by the CERS membership, and one elected by the SPRS membership. Of the three members appointed by the Governor, two must have at least 10 years of “investment experience” as defined by statute and one must be knowledgeable about the

2
impact of pensions on local governments. Elected and appointed trustees serve for four-year terms and may serve no more than three consecutive terms1. The board annually elects a chair and vice-chair and the chair appoints members to various committees of the board including the investment committee, retiree health plan committee, disability appeals/administrative appeals committee, legislative & budget committee, human resources committee, and the audit committee. The current composition of the board is provided below. The board appoints an Executive Director to oversee day to day operations and to staff the needs of the systems. The current interim Executive Director is Bill Thielen and as of June 30, 2011, KRS consisted of 248 employees2.
Current KRS Board of Trustees
Thomas Elliott, Chair Governor Appointee
Dr. Daniel Bauer, Vice-Chair Governor Appointee
Jennifer Elliott Governor Appointee
Tim Longmeyer Secretary of the Personnel Cabinet
Bobby Henson KERS elected trustee
Susan Smith KERS elected trustee
Vince Lang CERS elected trustee
Vacant3 CERS elected trustee
Randy Overstreet SPRS elected trustee
Who Participates in KRS? As of June 30, 2011, 379 agencies participated in KERS and 1,402 agencies participated in CERS4. For both KERS and CERS, state statute defines the types of agencies that are eligible for participation with final approval in the process being granted or denied by the KRS board. In the case of KERS, an Executive Order declaring the agency eligible for participation is required while CERS agencies must meet statutory definitions in order to participate (the board determines if the agency meets the definition). Once an agency begins participating, all regular full-time employees hired after the agency’s participation date are required to contribute to the systems. For KERS and CERS, regular full-time means an employee who average 100 hours of work per month over a calendar or fiscal year, except that school board employees are required to average 80 hours per month over the months represented by the days worked5. All regular full-time state police officers participate in SPRS. The number of employees (often referred to as active members), former employees with accounts but not retired (often referred to as inactive members), and retired members by system is provided in the table below.
System # of Active Members # of Inactive Members Retired Members Total
KERS Non-Hazardous 46,617 38,597 38,597 123,811 KERS Hazardous 4,291 3,264 3,064 10,619 CERS Non-Hazardous 85,285 65,914 43,211 194,410 CERS Hazardous 9,407 2,774 6,468 18,649 SPRS 965 357 1,263 2,585
Total 146,565 110,906 92,603 350,074 Source: Kentucky Retirement Systems Actuarial Valuation, June 30, 2011
Employees earn service credit for months and days worked in a regular full-time position. With the exception of school board employees, all employees earn one month of service credit in the systems for every month worked in a regular full-time position. School board employees working in a regular full-time position earn service credit based upon their days worked, with 180 days worked in a regular full-time position equaling 12 months of service credit (less service credit is given for days worked less than 180).
1 Legislative changes in 2008 and 2012 set a 3-term limit. Current trustees serving a term in excess of the updated term limits are
allowed to complete their current term of office. 2 Source: Board material for the August 2011 board meeting.
3 Robert Wilcher resigned his position as CERS trustee in May 2012. Per KRS 61.645(5), the KRS board will determine by a majority
vote of the remaining trustees who will replace Mr. Wilcher for the remainder of his term. 4 Source: June 30, 2011 Kentucky Retirement Systems Comprehensive Annual Financial Report
5 Certain exceptions apply to the regular full-time requirement such as seasonal, temporary, and interim positions that are not
subject to the participation requirements. However, statute limits the duration and frequency of use of these positions by agencies.

3
Within KERS and CERS, there are both non-hazardous and hazardous duty benefits and contribution structures. In order for a job to be classified as hazardous duty, it must meet the requirements established by state law, the employing agency must request hazardous duty coverage for the position and agree to pay the higher employer contribution rates, and the KRS Board of Trustees must review and adopt the position as hazardous duty (subject to a statutory definition). In general, hazardous positions in KERS and CERS primarily cover police, fire, EMS, and corrections employees. In 2008, the definition for CERS hazardous duty positions was amended in HB 1 for employees who began participating in the systems on or after 9/1/2008. Retirement Eligibility Employees must meet certain age and/or service credit requirements before they can retire and begin receiving benefits. In KRS, the retirement eligibility requirements vary based upon type of coverage (non-hazardous or hazardous) and the date the employee first began participating in the systems. Two columns are provided in the table below, one showing the requirements to earn an unreduced benefit (no penalties) and one showing the requirements for a reduced benefit (penalties are applied and based upon how many years the employee is short of reaching an unreduced benefit).
System Unreduced Benefit Reduced Benefit
KERS/CERS Non-Hazardous
Participating Prior to 9/1/2008: Any age with at least 27 years of service; or
Age 65 with at least 4 years of service
Participating on or after 09/1/2008: Must meet rule of 87 (age+ service equals this value)
and must be at least 57 years of age; or
Age 65 with at least 5 years of service
Participating Prior to 9/1/2008: Age 55 with at least 5 years of service; or
Any age with at least 25 years of service
Participating on or after 09/1/2008: Age 60 with at least 10 years of service
Note: Reduction determined by actuary, 4.5% to 6.5% for each year short of unreduced benefit.
KERS & CERS Hazardous, SPRS
Participating Prior to 9/1/2008: Any age with at least 20 years of service; or
Age 55 with at least 5 years of service
Participating on or after 09/1/2008: Any age with at least 25 years of service; or
Age 60 with at least 5 years of service
Age 50 with at least 15 years of service Note: Reduction determined by actuary, 6.5% for each year short of unreduced benefit.
Note: Employees can also purchase different types of service credit (i.e. military service, federal service) and can use the purchased service to meet the service requirements for retirement eligibility listed above. In addition, employees of KERS/SPRS agencies and many CERS agencies receive additional service credit for accumulated sick leave at retirement which can also be used to meet the service requirements for retirement eligibility listed above. However, the ability to use purchased service and sick leave service credit for retirement eligibility has been limited for new participants over time. New participants on or after 8/1/04 cannot use most service purchases towards meeting retirement eligibility requirements, and new participants on or after 9/1/08 are further restricted. In addition, sick leave service credit for new participants on or after 9/1/08 cannot be used for determining retirement eligibility.
What Are the Benefits of Each Plan? Each system is designed to provide three types of benefits: a monthly retirement benefit for life based on the employee's salary and service (the pension benefit), health insurance benefits after retirement, and disability/death benefits. Information on each of these benefits is provided below and on the following pages.
Monthly Retirement Benefit: Since these plans are defined benefits plans, benefits are paid based on a formula established by statute which is as follows:
Final Compensation
X Benefit Factor
X Years of Service
Credit =
Annual Benefit
Service earned for employment, purchased service credit, and service credit awarded for accumulated sick
leave at retirement provided the agency participates in a sick leave program.
A percentage based upon the retirement plan, the type of service, and the timing of the member’s
service.
The average salary used for determining benefits at the time of retirement. Usually the average of the highest 3 or highest 5 years of salary.

4
Formula for Non-Hazardous Employees6
FINAL COMPENSATION BENEFIT FACTOR SERVICE CREDIT
Participating before 9/1/08: Avg. of highest 5 years of salary, must contain at least 48 months of service, includes lump-sum payments for compensatory time. Participating on & after 9/1/08: Avg. of the 5 complete fiscal years immediately preceding retirement, must contain 60 months of service (all 5 years must contain 12 months service), does not include lump-sum payments for compensatory time.
Participating before 9/1/08: KERS:
1.97%;or
2.00% for employees with 13 months service between 1/1/98-1/1/99.
CERS:
2.2% if participating before 8/1/04,
2.0% if participating on or after 8/1/04 but before 9/1/08.
KERS & CERS Participating on & after 9/1/08: Includes:
Service earned for time worked in a regular full-time position
Purchased service
Service credit for accumulated sick leave at retirement.
Years of Service Factor
10 or less 1.10%
Greater than 10, but no more than 20 1.30%
Greater than 20, but no more than 26 1.50%
Greater than 26, but no more than 30 1.75%
Additional years above 30 2.00%
Formula for Hazardous Employees FINAL COMPENSATION BENEFIT FACTOR SERVICE CREDIT
Participating before 9/1/08: Avg. of highest 3 years of salary, min. of 24 months, includes lump-sum payments for compensatory time. Participating on & after 9/1/08: Avg. of the highest 3 complete fiscal years, must contain 36 months (all 3 years must contain 12 months service), does not include lump-sum payments for compensatory time.
Participating before 9/1/08:
KERS: 2.49%
CERS & SPRS: 2.50%
KERS & CERS Participating on & after 9/1/08: Same as KERS/CERS Non-hazardous.
Years of Service Factor
10 or less 1.30%
Greater than 10, but no more than 20 1.50%
Greater than 20, but less than 25 2.25%
25 or more 2.50%
Note: In KERS and SPRS, all accumulated sick leave is converted to additional months of service credit. For CERS, the agency may adopt the standard or alternate sick leave program and must choose the amount of sick leave that can be converted. For new employees who begin participating in the systems on or after 9/1/08, the maximum amount of sick leave that can be converted to additional service credit is limited to 12 months.
The annual benefit shown in the calculations above is paid monthly to the retiree. At retirement, a retiree may choose to take a reduced monthly benefit in order to provide a monthly benefit to a beneficiary upon their death, either for a period certain or for the life of the beneficiary. The systems administered by KRS also provide for a statutory 1.5% annual increase to these monthly benefits after retirement, often referred to as the cost of living adjustment (COLA). The COLA that would have been awarded on July 1, 2012 and July 1, 2013 will be suspended under the current provisions of the biennial budget.
Note: An easy way to view the benefit structure is to look at the benefit factor as an income replacement rate. For example, the CERS non-hazardous benefit factor for many CERS employees is 2.0%. This means the formula provides 2.0% of a retiring employee's average salary for each year of service. If the employee has 30 years of service, the benefit would provide 60% of the retiring employee's average salary.
Health Insurance Benefits After Retirement: The systems also provide access to group rates on medical insurance for retired members, their spouse, and dependents. Coverage for retirees not eligible for Medicare is provided through the Kentucky Employees Health Plan, the same health plan provided to state and school board employees. Coverage for Medicare eligible retirees is provided through a plan administered by or contracted through the retirement systems which then coordinates with Medicare for delivery of health benefits. As provided by state statute, the systems also subsidize medical coverage for the retiree and in some cases for the dependents of the retiree (i.e. if the member retires with hazardous duty service credit). In general, employees participating prior to 7/1/03, receive a percentage of the premium paid based upon service credit, while employees who begin participating after that date receive a set dollar amount for each year of service credit. The table below provides
6 For KERS non-hazardous participants, the retirement windows that provided a high-3 final compensation calculation and a 2.2% benefit factor for
employees that met certain age and/or service requirements expired 1/1/09. The high-3 window also applied to CERS non-hazardous members but also expired 1/1/09.

5
details the benefits for non-hazardous and hazardous duty members.
KERS AND CERS NON-HAZARDOUS For members participating before 07/03:
Years of Service % of Premium Paid for retiree Less than 4: 0%
4–9.99 25% 10–14.99 50% 15–19.99 75%
20 or more: 100%
For new participants on or after 07/03 but before 09/08:
Minimum 10 years of service at retirement for retiree health benefit eligibility.
Benefit of $10 per month for each year of service, adjusted by 1.5% annually.
For new participants on or after 09/08: Same as before but minimum 15 years of service at retirement for benefit eligibility.
KERS & CERS HAZARDOUS, SPRS For members participating before 07/03:
Years of Service
% of Premium Paid for retiree
% of Premium Paid for spouse & dependents (hazardous service only)
Less than 4: 0% 0% 4–9.99 25% 25%
10–14.99 50% 50% 15–19.99 75% 75%
20 or more: 100% 100%
For new participants on or after 07/03 but before 09/08:
Minimum 10 years of service at retirement for retiree health benefit eligibility.
Benefit of $15 per month for each year of service, adjusted by 1.5% annually.
Spouse: $10 per month for each year of haz. service upon death of member.
For new participants on or after 09/08: Same as before but minimum 15 years of service at retirement for benefit eligibility.
Note: Since the 2005 plan year, non-hazardous retirees participating in the Kentucky Employees Health Plan have also received a partial subsidy for dependent coverage that has been provided to state and school employees participating in the plan. Almost all service purchases made on or after 8/1/04 do not count towards meeting the service requirements for varying levels of retiree health benefits listed above.
Disability and Death Benefits: Like most defined benefit plans, the systems provide benefits for those employees who become disabled or who die prior to retirement. The systems also provide death before retirement and special death in the line of duty benefits. After retirement, the benefits left to the retiree's beneficiary vary based upon the payment option selected at retirement (as previously discussed). In addition, the systems provide a $5,000 lump sum death benefit for members who retire with at least 4 years of service. Disability and death before retirement benefits are described in the table below7.
SYSTEM DISABILITY (NON-OCCUPATIONAL) DEATH BEFORE RETIREMENT
KERS Non-hazardous, CERS Non-hazardous
Minimum 5 years service to apply for benefits and approval determined by systems under criteria established by state statute.
Benefit Calculation Employees participating before 8/1/04: Service used
to calculate benefits is doubled but cannot exceed 25 years of service or age 65 (when additional service is added to their current age). Exception: employees with 25 years of service have their service increased to 27 years.
Employees participating on or after 8/1/04: Higher of benefit calculated using actual service or 20% of member's final pay.
The employee’s beneficiary is eligible for benefits if at the time of death the: Employee was eligible to retire Employee was less than age 55, was working at the
time of death, and had at least 5 years of service Employee was less than age 55, was not working at
the time of death, and had at least 12 years of service.
Benefit calculated using formula and actual service earned at the time of death. Penalties apply if the member was not eligible for an unreduced benefit at the time of death.
KERS Hazardous, CERS Hazardous, SPRS
Minimum 5 years service to apply for benefits and approval determined by systems under criteria established by state statute.
Benefit Calculation Employees participating before 8/1/04: Service used
to calculate benefits is doubled but cannot exceed 20 years of service or age 55 (when additional service is added to their current age).
Employees participating on or after 8/1/04: Higher of benefit calculated using actual service or 25% of member's final pay.
Same as above
7 Note: Employees participating in all state administered retirement systems are eligible for special benefits if they are disabled or
killed in the line of duty benefits (not described in this document).

6
Reemployment After Retirement
State statute places restrictions on KERS, CERS, and SPRS retirees returning to work after retirement with a participating
employer of the systems. As a result of HB 1, the following restrictions/requirements are applicable to employees of
these systems who retire and return to work on or after 9/1/2008:
Required Break in Employment: The employee must have a 3 month break in employment before returning to any position with an employer participating in the systems, except that hazardous KERS or CERS and SPRS retirees who return to work in a full-time hazardous duty position are only required to observe a 1 month break. If the break is not observed, the employee’s retirement is voided and all benefit payments issued in error shall be repaid to the systems. Both the employee and employer must certify that no pre-arranged agreement for the employee to return to work existed prior to the employee’s retirement.
How It works for the employee: Provided the break is observed, the employee can return to work, draw their pension, but will not contribute to the systems or earn a second pension.
How it works for the employer: If the employee has returned to work in a position that would have qualified for participation in the systems, the employer is required to pay contributions to the systems and to reimburse the systems for the cost of health insurance premiums paid by the systems for the retiree (not to exceed the cost of the single premium). If the employee takes health coverage through the employer and waives coverage with the systems, then no reimbursement is required.
Note: Prior to the passage of HB 1, retirees of this system could return to work and earn a second account. Required breaks in employment varied based upon position and system. In addition, employers were not required to reimburse the systems for retiree health costs prior to the bill’s passage.
Reciprocity Members who have service in more than one retirement plan administered by the Commonwealth of Kentucky can combine service in the plans to determine eligibility for retirement and final compensation (years of highest salary). Each system will pay a benefit based on the amount of service in that system.
Example: John was employed with a local board of education in a classified position and accumulated 10 years of service in CERS. He is now employed with the same board of education as a teacher and has accumulated 17 years of service in KTRS. John would be eligible to retire at any age with no reductions in his retirement benefits because he has accumulated a combined total of 27 years of service. His salary, which was higher during his tenure as a teacher, would be used to calculate his final compensation in CERS. John would receive a retirement check from CERS based upon his 10 years of service and a separate retirement check from KTRS based on his 17 years of service.
Taxation of benefits Federal Income Tax: Monthly benefits from all systems are subject to federal income tax. If a member made contributions with after-tax dollars (usually service purchases), then a portion of the monthly benefit at retirement will not be subject to federal income tax.
State Income Tax: All benefits attributable to service earned on or before December 31, 1997, are exempt from Kentucky income tax. The portion of the member’s benefits earned January 1, 1998 and after is subject to Kentucky income tax. However, an annual pension exclusion of $41,110 applies to this portion and other retirement income sources.
FUNDING & INVESTMENTS
How are Benefits Funded? As with any retirement plan, funding for system benefits and expenses are provided through three sources: employee contributions, employer contributions, and return on investment (see graphic representation on the following page). Employee contributions are set by state statute and do not vary. The employer contribution rate varies annually as determined by the actuarial valuation. Employee and employer contribution rates are provided on pages 9 to 11.

7
Measuring the Financial Health of the Plans and Determining Employer Contributions The retirement systems are required by statute to conduct an annual actuarial valuation of the plans. The purpose of the valuation, which is completed by an actuary hired by the systems, is to determine:
The amount of benefits to be paid out into the future. The benefits, or future liabilities, of the plans are prescribed by law and regulation and in some cases, the board of trustees. In order to calculate the amount of benefits that will be paid out in the future, the actuary must make assumptions about things that affect the plan’s money (the rate of return on investments, salary growth of employees, retiree medical inflation rates, etc.) and it’s people (when will people retire, how long will they live after retirement, etc.). Once these liabilities are determined, they are discounted to today’s dollars and separated, using an actuarial cost method (the systems uses the entry age normal cost method) into two components: the actuarially accrued liability (liability dedicated to service already earned by employees and retirees) and the present value of future normal cost (liability dedicated to future service of employees based upon assumptions).
Note: Some key assumptions in developing the liability values include the investment return assumption, payroll growth assumption, and future medical inflation. For KRS, the investment return assumption is 7.75% per annum for all pension and insurance funds except for the KERS non-hazardous and SPRS insurance funds where the assumption is 4.5% per annum. The payroll growth assumption is 4.5% annually. The medical inflation assumptions are that premiums in the state health plan and the system’s Medicare eligible plans are anticipated to increase by 10.5% and 8.5% respectively in FY 2012 trending down annually until achieving a long-term annual increase of 5% in FY 2019 and beyond.
investments$ $ $
$
$ $
$
$
$
$
$ $ $$
$
$$
$
Assets$
$
$$$
$
$
$
$ $
PENSION
FUND
$ $
benefits
expenses
employer contributions
employee
contributions
investments$ $ $
$
$ $
$
$
$
$
$ $ $$
$
$$
$
Assets$
$
$$$
$
$
$
$ $
PENSION
FUND
$ $
benefits
expenses
employer contributions
employee
contributions

8
HB 1 Funding policy for KERS & SPRS % of the actuarially required contribution paid by year
Fiscal Year
KERS Non-Hazardous
KERS Hazardous
SPRS
10-11 44% 76% 60%
11-12 48% 79% 65%
12-13 53% 83% 70%
13-14 57% 86% 75%
14-15 61% 89% 80%
15-16 65% 92% 85%
16-17 69% 95% 90%
17-18 73% 98% 95%
18-19 77% 100% 98%
19-20 81% 100%
20-21 85%
21-22 89%
22-23 93%
23-24 97%
24-25 100%
The financial health of the plan. In the valuation, the actuary reports several actuarial statistics useful in evaluating the financial health of the plans as of valuation date. The two most common actuarial statistics are: the Unfunded Liability and the Funding level. The Unfunded Liability is the dollar amount of the actuarially accrued liabilities (liabilities for service already earned) that are not covered by the actuarial value of assets. For example, the KERS non-hazardous pension fund had an actuarially accrued liability $11.182 billion as of June 30, 2011 and actuarial assets of $3.727 billion, leaving an unfunded liability of $7.455 billion. The actuarially accrued liability, and in turn the unfunded liabilities, are influenced by a variety of factors – investment returns, retirement rates, medical inflation rates, and contributions paid by employers. The funding level is the percent of actuarial assets to actuarially accrued liability. For example, the KERS non-hazardous pension fund had a funding level of 33.3% as of June 30, 2011. Another way to state this statistic is for every $1 in liabilities or benefits earned to date, the KERS non-hazardous pension fund held 33 cents in assets. Page 15 provides actuarial and other statistics for each of the systems as well as other data, and page 16 provides historical data on the financial health of the plans.
Note: The actuarial value of assets is a smoothed market value that phases in investment gains or losses for a particular year over a 5 year period.
The level of employer contributions: The employer contribution for each of the systems includes two contributions--one for pensions and one for retiree health benefits. Each of these individual contributions is comprised of two components: a payment for normal cost (the estimated cost of the upcoming year of service for active employees) and a payment to finance the unfunded liability over a specific time period (usually 30 years). Unfunded liabilities arise when the plan fails to meet established assumptions. For example, any returns above or below the assumed 7.75% rate of return for the pension funds will increase or decrease unfunded liabilities. As the unfunded liability increases or decreases, so does the cost to employers who bear the risk or reward of when the plan fails to meet the assumption established by the actuary and the board of trustees.
Funding Policies that Alter the Employer Contribution For the systems, the level of employer contributions recommended by the actuary have, or are being, adjusted based upon funding policies established by statute and by the board of trustees.
KERS/SPRS: Since 2002-2003, the amount provided in the biennial budget for employer contributions to KERS and SPRS has been less than the amount recommended by the KRS board of trustees and its consulting actuary8. In 2008, the General Assembly established a funding policy in HB 1 to reach the full actuarially required contribution for pension and retiree health for KERS non-hazardous, KERS hazardous, and SPRS by 2024-2025, 2018-2019, and 2019-2020, respectively. The policy requires an increasing percentage of the required contribution to be paid each year until the full actuarially required contribution is paid. For example, 53% of the actuarially required contribution of 44.55% for KERS non-hazardous in fiscal year 2012-2013 is 23.61% of payroll (the amounts required by the funding policy are included in the upcoming 2012-2014 biennial budget).
CERS: Since the late 1980’s, the KRS Board of Trustees has established various funding policies to incrementally
8 Some rate reductions also occurred during a few years in the 1990s but were relatively minor in relation to the current rate
reductions.
Actuarial Value ofAssets
-Actuarially Accrued Liability
= Unfunded Liabilities
Actuarial Value of Assets
÷ Actuarially Accrued Liability
= Funding Level

9
increase the employer contribution to fund retiree health benefits for all systems it administers, including CERS. In 2006, the board adopted a policy to phase-in to the full actuarially required employer contribution for retiree health benefits over a 5-year period (using fiscal year 2007-2008 as a base rate and increasing the rate over the 5-year period from FY 2008-2009 through FY 2012-2013). In 2009, the General Assembly passed HB 117 requiring a 10-year phase-in period using the same start date and extending the phase-in period through FY 2017-2018.
Employee and Employer Contribution Rates Employee contribution rates are set by statute as a percentage of the employee’s salary and do not vary. Employee contribution rates are provided in the table below.
EMPLOYEE CONTRIBUTION RATE (% OF PAYROLL)
Participating Prior to 9/1/08 Participating on or after 9/1/08 KERS/CERS
Non-Hazardous KERS/CERS
Hazardous & SPRS KERS/CERS
Non-Hazardous KERS/CERS
Hazardous & SPRS Pension 5% 8% 5% 8% Insurance 0% 0% 1% 1% Total 5% 8% 6% 9% Note: Changed for new participants via HB 1 in 2008.
Employer contributions do vary as plan experience, benefits, and assumptions change. The employer contribution rate
over different points in time, including more recent employer contribution rates is provided on the chart below and on
the charts on the following pages. These charts show the board9 recommended pension and retiree health contribution
(and the combined total) for employers in each system and the amount actually budgeted by the General Assembly (if
applicable).
Source: KRS Historical Employer Contribution Rates
9 For FY 08-09 and 09-10, the board recommended rate differs from the rate reported in the actuarial valuation (i.e., the actuarially
recommended rate- ARC) for KERS non-hazardous and SPRS due to the investment return assumption used in the actuarial valuation versus the investment return assumption used by the board to determine the employer contribution rate. For CERS, the insurance fund contribution rate and thereby the total contribution rate adopted by the board differs from the valuation rate in FY 08-09 through the current fiscal year in the charts due to the funding policies established by the board regarding a phase-in of the insurance contribution, and HB 117 passed during the 2009 regular session that extended this phase-in period.
81-82 86-87 91-92 96-97 01-02 06-07 08-09 09-10 10-11 11-12
Insurance 0.21% 0.48% 1.77% 3.15% 5.89% 6.45% 12.06% 12.33% 16.81% 16.41%
Pension 7.04% 6.97% 5.88% 5.74% 0.00% 10.68% 16.54% 18.96% 21.77% 24.30%
Total 7.25% 7.45% 7.65% 8.89% 5.89% 17.13% 28.60% 31.29% 38.58% 40.71%
Budgeted 7.25% 7.45% 7.65% 8.89% 5.89% 7.75% 10.01% 11.61% 16.98% 19.82%
0.00%
10.00%
20.00%
30.00%
40.00%
50.00%
0.00%
10.00%
20.00%
30.00%
40.00%
50.00%
Historical KERS Non-Hazardous Employer Rates as a % of Payroll
10
Source: KRS Historical Employer Contribution Rates
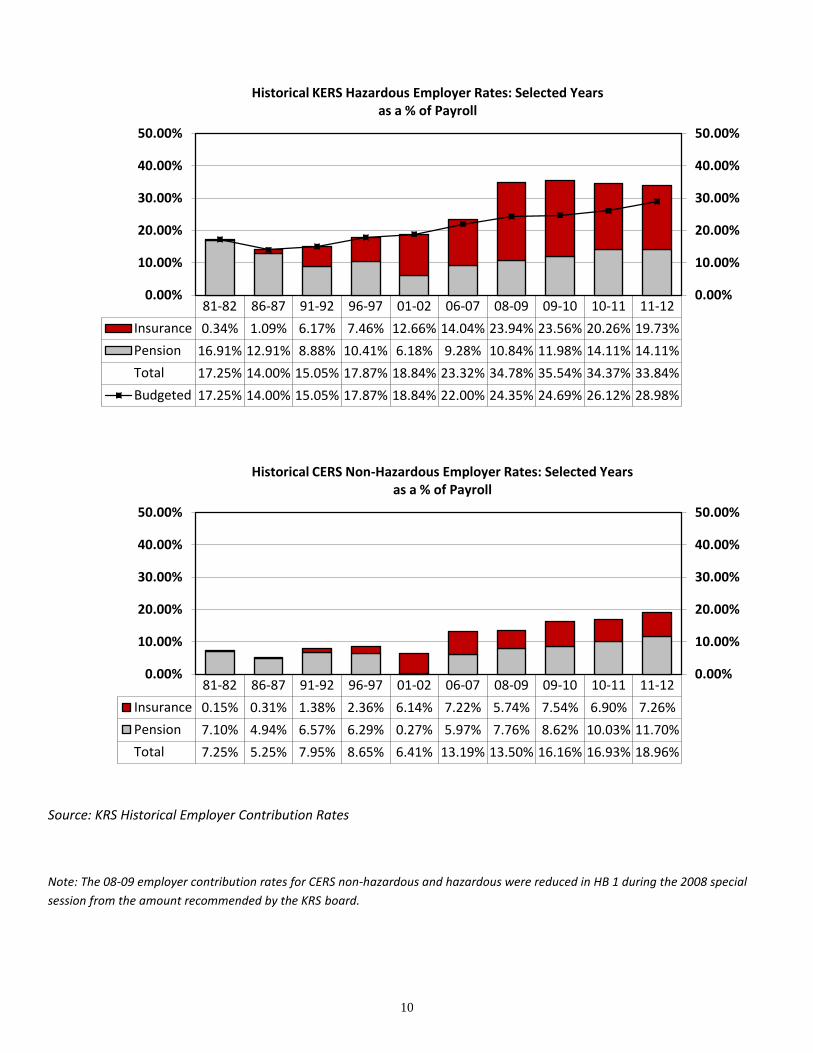
Note: The 08-09 employer contribution rates for CERS non-hazardous and hazardous were reduced in HB 1 during the 2008 special
session from the amount recommended by the KRS board.
81-82 86-87 91-92 96-97 01-02 06-07 08-09 09-10 10-11 11-12
Insurance 0.34% 1.09% 6.17% 7.46% 12.66% 14.04% 23.94% 23.56% 20.26% 19.73%
Pension 16.91% 12.91% 8.88% 10.41% 6.18% 9.28% 10.84% 11.98% 14.11% 14.11%
Total 17.25% 14.00% 15.05% 17.87% 18.84% 23.32% 34.78% 35.54% 34.37% 33.84%
Budgeted 17.25% 14.00% 15.05% 17.87% 18.84% 22.00% 24.35% 24.69% 26.12% 28.98%
0.00%
10.00%
20.00%
30.00%
40.00%
50.00%
0.00%
10.00%
20.00%
30.00%
40.00%
50.00%
Historical KERS Hazardous Employer Rates: Selected Years as a % of Payroll
81-82 86-87 91-92 96-97 01-02 06-07 08-09 09-10 10-11 11-12
Insurance 0.15% 0.31% 1.38% 2.36% 6.14% 7.22% 5.74% 7.54% 6.90% 7.26%
Pension 7.10% 4.94% 6.57% 6.29% 0.27% 5.97% 7.76% 8.62% 10.03% 11.70%
Total 7.25% 5.25% 7.95% 8.65% 6.41% 13.19% 13.50% 16.16% 16.93% 18.96%
0.00%
10.00%
20.00%
30.00%
40.00%
50.00%
0.00%
10.00%
20.00%
30.00%
40.00%
50.00%
Historical CERS Non-Hazardous Employer Rates: Selected Years as a % of Payroll

11
Note: The 08-09 employer contribution rates for CERS non-hazardous and hazardous were reduced in HB 1 during the 2008 special
session from the amount recommended by the KRS board.
Source: KRS Historical Employer Contribution Rates
81-82 86-87 91-92 96-97 01-02 06-07 08-09 09-10 10-11 11-12
Insurance 0.13% 0.99% 5.11% 6.33% 13.22% 15.10% 14.46% 16.86% 16.46% 17.85%
Pension 15.87% 13.01% 10.99% 12.36% 3.06% 13.11% 15.04% 16.11% 16.79% 17.91%
Total 16.00% 14.00% 16.10% 18.69% 16.28% 28.21% 29.50% 32.97% 33.25% 35.76%
0.00%
10.00%
20.00%
30.00%
40.00%
50.00%
0.00%
10.00%
20.00%
30.00%
40.00%
50.00%
Historical CERS Hazardous Employer Rates: Selected Years as a % of Payroll
81-82 86-87 91-92 96-97 01-02 06-07 08-09 09-10 10-11 11-12
Insurance 0.12% 1.41% 9.48% 14.21% 21.58% 21.66% 27.75% 26.64% 49.89% 54.83%
Pension 18.38% 16.84% 10.09% 12.37% 0.00% 20.64% 32.39% 35.23% 35.74% 39.80%
Total 18.50% 18.25% 19.57% 26.58% 21.58% 42.30% 60.14% 61.87% 85.63% 94.63%
Budgeted 18.50% 18.25% 19.57% 26.58% 21.58% 25.50% 30.07% 33.08% 45.54% 52.13%
0.00%
20.00%
40.00%
60.00%
80.00%
100.00%
0.00%
20.00%
40.00%
60.00%
80.00%
100.00%
Historical SPRS Employer Rates: Selected Years as a % of Payroll

12
Projected Employer Contribution Rates
KRS has also provided projections on the employer contributions rates over the next 20 years (as of the June 30, 2011
actuarial valuation). The projections show the rates under the HB 1 phase-in for KERS and SPRS and the insurance
phase-in for CERS, assumes all future assumptions are met, and also includes an annual 1.5% COLA each year (the
projections do not reflect the COLA suspension for the upcoming biennium provided by this budget). The projections for
selected future years are shown in the tables below.
Fiscal
Year
KERS Non-Hazardous KERS Hazardous SPRS
Pension Health Total Pension Health Total Pension Health Total
2011-2012 11.59% 8.23% 19.82% 12.33% 16.65% 28.98% 26.55% 25.58% 52.13%
2012-2013 14.86% 8.75% 23.61% 13.41% 16.38% 29.79% 33.24% 30.43% 63.67%
2013-2014 17.29% 9.50% 26.79% 14.89% 17.32% 32.21% 39.50% 31.65% 71.15%
2015-2016 21.47% 10.93% 32.40% 15.92% 17.81% 33.73% 49.10% 31.29% 80.39%
2020-2021 33.35% 10.97% 44.32% 18.26% 16.97% 35.23% 71.22% 30.95% 102.17%
2025-2026 44.11% 10.62% 54.73% 20.03% 14.30% 34.33% 85.05% 30.71% 115.76%
2030-2031 47.82% 10.54% 58.36% 22.79% 12.96% 35.75% 100.86% 31.04% 131.90%
Fiscal
Year
CERS Non-Hazardous CERS Hazardous
Pension Health Total Pension Health Total
2011-2012 11.70% 7.26% 18.96% 17.91% 17.85% 35.76%
2012-2013 12.62% 6.93% 19.55% 20.10% 17.50% 37.60%
2013-2014 13.39% 7.38% 20.77% 21.78% 18.70% 40.48%
2015-2016 13.50% 8.30% 21.80% 22.50% 21.09% 43.59%
2020-2021 14.18% 7.83% 22.01% 25.18% 21.31% 46.49%
2025-2026 15.61% 7.36% 22.97% 29.56% 20.00% 49.56%
2030-2031 17.82% 7.15% 24.97% 35.57% 19.63% 55.20%
Source: Kentucky Retirement Systems, Twenty-Year Rate Projections with Ad-Hoc COLAs. Prepared by Cavanaugh MacDonald
Consulting Inc.
Sources of Deterioration of Funding Levels/Growth in Unfunded Liabilities
A good deal of debate exists over the factors responsible for the deterioration in the system’s funding levels and the
growth in unfunded liabilities in recent years. In 2011, the systems actuary evaluated the different factors that have led
to the growth in higher unfunded liabilities from the June 30, 2005 actuarial valuation to the June 30, 2011 actuarial
valuation for the systems respective pension funds. These factors include investment returns less than assumed, cost of
living adjustments (which are not pre-funded), benefit increases, assumption changes, employer rate reductions for
KERS and SPRS, demographic and salary experience, and other factors (negative amortization of UAL, data corrections,
software changes). The charts on the following pages detail these factors for each system.

13
For the KERS non-hazardous pension fund, the unfunded liability
grew from $2 billion to $7.455 billion during this time period.
Over the same time frame, the funding level fell from 60% to
33.3%.
For the KERS hazardous pension fund, the unfunded liability grew
from $34 million to $211 million during this time period. Over
the same time frame, the funding level fell from 84.1% to 70.8%.
For the CERS non-hazardous pension fund, the unfunded liability
grew from $326 million to $3.288 billion during this time period.
Over the same time frame, the funding level fell from 83.6% to
63.1%.
For the CERS hazardous pension fund, the unfunded liability grew
from $343 million to $1.079 billion during this time period. Over
the same time frame, the funding level fell from 75% to 62.2%.
Source: Kentucky Retirement Systems, UAL Attribution. Prepared by Cavanaugh MacDonald Consulting Inc.
Investment Experience
$1,018
COLAs $995
Benefits $88
Assump. Changes
$690
Employer Rate
Reductions $948
Dem. & Salary
Experience $371
Other $1,345
KERS Non-Hazardous Pension Fund Factors Responsible for Unfunded Liability
Growth from 2005 to 2011
(in millions of dollars)
Investment Experience
$65
COLAs $61 Benefits
($1)
Assump. Changes
$28
Employer Rate
Reductions $12
Dem. & Salary
Experience $30
Other ($18)
KERS Hazardous Pension Fund Factors Responsible for Unfunded Liability
Growth from 2005 to 2011
(in millions of dollars)
Investment Experience
$1,053
COLAs $528
Benefits $72
Assump. Changes
$357
Dem. & Salary
Experience $261
Other $692
CERS Non-Hazardous Pension Fund Factors Responsible for Unfunded Liability
Growth from 2005 to 2011
(in millions of dollars)
Investment Experience
$331
COLAs $214
Benefits $25
Assump. Changes
$79
Dem. & Salary
Experience $61
Other $26
CERS Hazardous Pension Fund Factors Responsible for Unfunded Liability
Growth from 2005 to 2011
(in millions of dollars)

14
For the SPRS pension fund, the unfunded liability grew from $105
million to $349 million during this time period. Over the same
time frame, the funding level fell from 77.1% to 45%.
Investments & Investment Performance
Kentucky Retirement Systems invests system assets in separate pension and retiree health funds. Asset allocations and
fund performance over time are provided in the tables below. Data is as of April 2012.
1 yr. 3 yr. 5 yr. 10 yr. 1 yr. 3 yr. 5 yr. 10 yr.
Total Fund 0.09% 13.46% 2.18% 5.84% Total Fund -2.93% 14.69% 0.46% 5.54%
Benchmark 0.18% 13.49% 2.72% 5.91% Benchmark -0.92% 16.04% 0.95% 5.45%
Assumed rate of return for pension funds is 7.75%. Assumed rate of return for insurance funds is 4.5% for KERS non-
hazardous and SPRS; 7.75% for KERS hazardous and CERS.
Source: Kentucky Retirement Systems, April 2012 Investment Performance Update
Investment Experience
$53
COLAs $64
Benefits ($19)
Assump. Changes
($38)
Employer Rate
Reductions $40
Dem. & Salary
Experience $34
Other $111
SPRS Pension Fund Factors Responsible for Unfunded Liability
Growth from 2005 to 2011
(in millions of dollars)
U.S. Equity, 20%
Equitization, 0%
Int. Equity, 19%
Emerging Markets, 4%
Core Fixed Income,
10%
High Yield, 5%
Global Fixed Income, 5%
Private Equity, 11%
Real Estate, 2%
Absolute Return, 10%
Real Return, 10%
Currency Overlay, 0%
Cash, 3%
Pension Funds Asset Allocation
U.S. Equity, 22.9%
Equitization, 0.0%
Int. Equity, 18.4%
Emerging Markets,
3.2% Core Fixed
Income, 10.7%
High Yield, 4.6%
Global Fixed Income,
4.5%
Private Equity, 6.2%
Real Estate, 1.0%
Absolute Return,
8.1%
Real Return, 11.3%
Currency Overlay, -
0.1%
Cash, 9.2%
InsuranceFunds Asset Allocation

15
KENTUCKY RETIREMENT SYSTEMS FINANCIAL & STATISTICAL DATA (JUNE 30, 2011)
KERS KERS CERS CERS
Statistical Item Non-Haz. Haz. Non-Haz. Haz. SPRS Total
Pension Fund Actuarial Statistics
A. Actuarial Liability (in billions) $11.182 $0.721 $8.918 $2.859 $0.634 $24.315
B. Actuarial Value of Assets (in billions) $3.727 $0.511 $5.630 $1.780 $0.286 $11.932
C. Unfunded Liability (diff. between A & B) ($7.455) ($0.211) ($3.288) ($1.079) ($0.349) ($12.382)
D. Funding Level (% ratio of B. to A) 33.3% 70.8% 63.1% 62.2% 45.0% 49.1%
Insurance Fund Actuarial Statistics
A. Actuarial Liability (in billions) $4.280 $0.507 $3.074 $1.648 $0.438 $9.947
B. Actuarial Value of Assets (in billions) $0.452 $0.330 $1.433 $0.771 $0.124 $3.110
C. Unfunded Liability (diff. between A & B) ($3.828) ($0.177) ($1.641) ($0.877) ($0.315) ($6.838)
D. Funding Level (% ratio of B. to A) 10.6% 65.1% 46.6% 46.8% 28.2% 31.3%
Membership Data
# of Employees 46,617 4,291 85,285 9,407 965 146,565
# of Inactive Members (Not retired or working) 38,597 3,264 65,914 2,774 357 110,906
# of Retired Members & Beneficiaries 38,597 3,064 43,211 6,468 1,263 92,603
Total 123,811 10,619 194,410 18,649 2,585 350,074
Employed Member Payroll Data
Total Payroll (in billions) $1.732 $0.133 $2.277 $0.467 $0.049 $4.658
Employee Contributions (in millions) $112.32 $13.20 $148.08 $55.08 $5.26 $333.93
Employer Contributions (in millions) $308.81 $36.91 $433.61 $182.80 $21.97 $984.10
Average Salary Reported for Retirement $37,146 $31,008 $26,694 $48,792 $50,459 $31,781
Retired Member Payroll Data
Total Pension Payouts (billions) $0.858 $0.047 $0.521 $0.171 $0.047 $1.644
Total Retiree Health Payouts (billions) $0.166 $0.016 $0.137 $0.052 $0.012 $0.383
Total Payouts (billions) $1.024 $0.063 $0.657 $0.224 $0.059 $2.028
Average Annual Pension Benefit $20,436 $13,994 $10,871 $24,675 $36,839 N/A
Market Value of Assets
Total Pension Net Plan Assets (billions) $3.544 $0.511 $5.583 $1.762 $0.280 $11.681
Total Retiree Health Net Plan Assets (billions) $0.429 $0.321 $1.447 $0.773 $0.127 $3.097
Total Net Plan Assets (billions) $3.973 $0.832 $7.030 $2.535 $0.407 $14.778 Source: June 30, 2011 Actuarial Valuation; June 30, 2011 Comprehensive Annual Financial Report (CAFR)
Note: Actuarial Statistics, Membership data, Total Payroll, and Average Salary Reported for Retirement are taken from the Actuarial
Valuation. All other data is taken from the Comprehensive Annual Financial Report. Employee and employer contributions include all
contributions to the pension and insurance funds. Pension and insurance payouts include all deductions to the funds such as benefit
payments, refunds, and administrative costs.

16
Pension Funds Funding Level (%): 10 Year History Insurance Funds Funding Level (%): 10 Year History
Pension Funds Unfunded Liability (in billions of dollars) Insurance Funds Unfunded Liability(in billions of dollars)
2002 2003 2004 2005 2006 2007 2008 2009 2010 2011
KERS NH 110.4% 97.4% 85.1% 73.6% 60.0% 56.9% 52.5% 45.0% 38.3% 33.3%
KERS H 116.9% 108.1% 98.4% 92.3% 84.1% 83.6% 81.3% 74.5% 73.1% 70.8%
CERS NH 129.6% 119.7% 105.1% 94.0% 83.6% 82.1% 78.5% 71.4% 65.6% 63.1%
CERS H 111.9% 97.8% 88.8% 80.9% 75.0% 74.2% 72.9% 67.9% 65.5% 62.2%
SPRS 115.3% 99.6% 88.0% 77.1% 66.6% 63.7% 59.8% 54.8% 49.7% 45.0%
0.0%
20.0%
40.0%
60.0%
80.0%
100.0%
120.0%
140.0%
2002 2003 2004 2005 2006 2007 2008 2009 2010 2011
KERS NH 27.3% 26.5% 25.7% 22.7% 7.8% 11.9% 11.1% 11.9% 10.6% 10.6%
KERS H 57.4% 53.5% 52.3% 48.6% 34.3% 49.8% 53.2% 61.4% 63.7% 65.1%
CERS NH 22.8% 23.9% 24.0% 23.8% 16.9% 28.8% 32.6% 39.6% 40.9% 46.6%
CERS H 30.0% 28.8% 30.3% 28.0% 21.9% 31.2% 34.7% 40.9% 41.4% 46.8%
SPRS 52.5% 49.2% 48.9% 42.8% 18.1% 26.6% 27.9% 33.9% 27.9% 28.2%
0.0%
10.0%
20.0%
30.0%
40.0%
50.0%
60.0%
70.0%
2002 2003 2004 2005 2006 2007 2008 2009 2010 2011
KERS NH -$0.628 $0.169 $1.050 $2.000 $3.601 $4.089 $4.811 $5.864 $6.795 $7.455
KERS H -$0.054 -$0.029 $0.006 $0.034 $0.081 $0.092 $0.116 $0.172 $0.185 $0.211
CERS NH -$1.232 -$0.869 -$0.251 $0.326 $1.017 $1.192 $1.573 $2.262 $2.912 $3.288
CERS H -$0.158 $0.033 $0.183 $0.343 $0.505 $0.569 $0.652 $0.827 $0.923 $1.079
SPRS -$0.058 $0.002 $0.052 $0.105 $0.172 $0.199 $0.236 $0.272 $0.308 $0.349
-$2.000
-$1.000
$0.000
$1.000
$2.000
$3.000
$4.000
$5.000
$6.000
$7.000
$8.000
2002 2003 2004 2005 2006 2007 2008 2009 2010 2011
KERS NH $1.386 $1.539 $1.735 $2.073 $7.204 $4.580 $4.828 $3.973 $3.995 $3.828
KERS H $0.101 $0.132 $0.154 $0.199 $0.408 $0.253 $0.253 $0.189 $0.179 $0.177
CERS NH $1.527 $1.657 $1.853 $2.125 $3.829 $2.374 $2.414 $1.854 $1.865 $1.641
CERS H $0.546 $0.666 $0.715 $0.924 $1.506 $1.134 $1.156 $0.942 $0.982 $0.877
SPRS $0.079 $0.094 $0.101 $0.134 $0.477 $0.318 $0.321 $0.241 $0.314 $0.315
$0.000
$1.000
$2.000
$3.000
$4.000
$5.000
$6.000
$7.000
$8.000