annaal lyyttiiccaal essttuuddyy hooff sssoovv erreeiiggnn ... · theoretical framework comprising...
TRANSCRIPT

AAnnaallyyttiiccaall SSttuuddyy ooff SSoovveerreeiiggnn WWeeaalltthh FFuunnddss’’ SSttrraatteeggiieess aanndd PPoolliicciieess::
AA ccaassee ssttuuddyy ooff OOmmaann SSoovveerreeiiggnn WWeeaalltthh FFuunndd
AA tthheessiiss ssuubbmmiitttteedd ffoorr tthhee ddeeggrreeee ooff DDooccttoorr ooff PPhhiilloossoopphhyy
BByy
MMaajjiidd AAll--SSaaiiddii
BBrruunneell BBuussiinneessss SScchhooooll
BBrruunneell UUnniivveerrssiittyy
AApprriill,, 22001122

2
ABSTRACT
This thesis documents a study of the factors affecting the sustainable growth and
performance of the Sovereign Wealth Funds (SWFs). Despite the increased interest of
governments, analysts, central bankers, academics and SWF managers and the
unprecedented growth in the last two decades, SWFs research is still in its infancy.
Two main problems are: current debate between sponsoring and investee countries
about governance and transparency of major SWFs including Oman SWF; and how
these SWFs can manage their sustainable growth, performance and success rate. These
two issues are addressed in this thesis. .
An extensive review of the industry and academic literature was done in order to find
the relevant facts about the domain of SWFs. The case study research strategy was
adopted and primary data were collected by questionnaire survey and semi-structured
interviews from employees and other stakeholders of Oman SWF. Norway SWF was
analysed for the purposes of data triangulation, comparison and validation. The
theoretical framework comprising factors affecting growth, performance and success
rate was proposed and tested using multiple evidences from secondary data, interviews
and statistical analyses of the questionnaire responses.
The literature reveals that existing theories of trade, finance, economics and
management are able to resolve conflicting issues within SWFs and between
sponsoring and investee countries. Results reveal that qualitative factors such as
governance, policy and planning and quantitative factors such as structure, investment
strategy and decision making ultimately affect the long term growth and success rate of
global SWFs. It is also found that external or investee country laws do not affect the
SWFs as much as issues within the SWFs. Findings suggest that Oman SWF has
issues of concern in many aspects such as governance, transparency, accountability,
investment strategy, organisational structure, asset allocation, updating laws and policy
mechanisms; thus requiring overall restructuring and transformation of Oman SWF
into a professional organisation. This thesis makes a significant contribution by linking
theories to SWFs, an extensive literature review, a theoretical proposition comprising
factors affecting the growth of SWFs, methodological combination and creating further
research streams in the SWF domain.

3
ACKNOWLEDGEMENT
First of all, I am very much grateful to Brunel University and Brunel Business School
and Government of Oman for giving me this opportunity to carry out the doctoral
research study.
I also want to thank and express my gratitude to Prof. Zahir Irani – Head of Brunel
Business School, Prof. Ray Hackney – Director of PhD programmes and my
supervisors - Dr. Sarmad Al-Shawi and Prof. Adrian Woods for giving me continuous
guidance and helping me to solve any issue regarding research or the PhD programme.
I am particularly grateful to Government of Oman for providing scholarship for
doctoral studies.
I would also like to thank my family members, friends and colleagues who have been
supporting and infusing confidence into me to reach the finish line.
I would also like to acknowledge the support extended by executives from parliament,
councils, Central Bank of Oman, Ministry of Finance, Ministry of Trade and Industry
and Oman sovereign wealth fund for being the critical part of the project as
respondents to interviews and questionnaires.
I dedicate this thesis to my mother‘s spirit who had instilled the right values in me for
the life which has brought me to the current status of doing this research.

4
TABLE OF CONTENTS
Title page 1
Abstract 2
Acknowledgement 3
Table of contents 4
List of figures 9
List of tables 10
Key words and abbreviations 11
1 Introduction 14
1.1 Research context
1.2 Background of sovereign wealth funds (SWF)
1.3 Current trends and management of SWF
1.3.1 Current trends
1.3.2 Management issues
1.4 Oman Economy and SWF
1.5 Problem statement
1.6 Aim and objectives
1.7 Focus and significance of the study
1.7.1 Focus of the study
1.7.2 Significance of the study
1.8 Research methodology
1.9 Structure of the thesis
1.10 Conclusion
2 Literature review 31
2.1 Introduction
2.2 Definitions, history and concept of sovereign wealth funds
2.2.1 Definitions of SWF
2.2.2 History of SWF
2.2.3 Concept of SWF
2.3 Theoretical foundations of sovereign wealth funds
2.3.1 International trade theory
2.3.2 Financial management theory
2.3.3 Economics theory
2.3.4 Agency theory
2.3.5 Stewardship theory

5
2.3.6 Resource based view and resource dependency view
2.3.7 Stakeholders management theory
2.3.8 Isomorphism view
2.3.9 Strategic leadership theory
2.3.10 New mercantalism theory
2.3.11 Autonomy maximization theory
2.4 Development of sovereign wealth funds in the last two decades
2.4.1 Early SWFs
2.4.2 Trade and regulators‘ view of SWF
2.4.3 Growth of SWFs in the last two decades
2.5 Investment strategies of SWFs
2.6 The role of SWFs for sponsoring and investee countries
2.7 Effects on SWFs from barriers by investee countries
2.8 Current trends and impacts on the global finance
2.9 Implications based on the challenges of SWF
2.10 Implications of SWF investment decisions
2.11 Factors affecting SWF growth
2.12 New policy initiatives for SWFs
2.13 Importance of SWFs in the GCC region
2.14 Major inferences from literature review
2.14.1 Theoretical links to SWFs
2.14.2 Inferences about operations of SWFs
2.15 Summary
3 The conceptual framework 103
3.1 Introduction
3.2 Gaps found in the literature
3.3 Integrative framework of the study
3.3.1 Legal aspects
3.3.2 Investee country laws
3.3.3 Environmental dimensions
3.3.4 Policy
3.3.5 Sponsoring country laws
3.3.6 Structure
3.3.7 Investment deal
3.3.8 Operations

6
3.3.9 Growth of SWF
3.4 Hypothesised theoretical proposition
3.5 Operationalization of variables
3.6 Socio-economic factors
3.7 Conclusion
4 Research methodology 122
4.1 Introduction
4.2 Research objectives
4.3 Research philosophy and approach
4.4 Research strategy: The case study method
4.4.1 The case study method
4.5 Triangulation
4.6 Sampling
4.7 Data collection and analysis techniques
4.7.1 Interviews
4.7.2 Questionnaires
4.7.3 Data analyses
4.7.4 Research ethics issues
4.8 Reliability and validity
4.9 Research design summary
5 Analysing case study evidence: Secondary data 149
5.1 Introduction
5.2 Case analysis strategy
5.2.1 Objectives of the case analyses
5.2.2 Structure of the case analyses
5.2.2.1 Reasons for doing Norway SWF analysis first
5.3 Norway SWF: Government pension fund global (GPFG)
5.3.1 History and background of the GPFG
5.3.2 Current status of the GPFG
5.3.2.1 Organisational structure
5.3.2.2 Management control and government support
5.3.2.3 Strategic vision and approach
5.3.2.4 Responsible and sustainability strategy
5.3.2.5 Investment strategy and asset allocation

7
5.3.2.6 Asset allocation fundamentals
5.3.2.7 Governance standards
5.3.2.8 Transparency
5.3.3 Key performance indicators
5.4 Oman SWF: State general reserve fund (SGRF)
5.4.1 Importance of SWF to Oman‘s economy
5.4.2 History and development of the SGRF
5.4.3 Current status of the SGRF
5.4.3.1 Organisational structure
5.4.3.2 Management control and investment strategy
5.4.3.3 Governance, transparency and accountability
5.5 Comparison between Oman and Norway SWF
5.6 Summary
6 Primary data analyses 184
6.1 Introduction
6.2 Links between interviews and questionnaire analyses
Part –A: Analyses of interviews 186
6.3 Interview analysis method
6.4 Analysis of interview transcripts
6.4.1 Current situation within Oman SWF
6.4.2 Credibility of the fund: governance and transparency
6.4.3 Laws and treaties
6.4.4 Investment strategy and growth concerns
6.4.5 Decision making process
6.4.6 Changes to implement: policy, resources, people development,
investment appraisal
6.4.7 Key growth criteria
Part B: Analyses of Questionnaires 202
6.5 The field work reporting
6.6 Results of principal components analysis (PCA)
6.7 Regression analysis of dependent variable 1: Performance of SWF
6.8 Regression analysis of dependent variable 2: Success rate of SWF
6.9 Regression analysis results for dependent variables and possible solutions,
changes and impacts on progress
6.10 Hypotheses testing

8
6.11 Progress, possible solutions and changes in Oman SWF
6.12 Final theoretical framework
6.13 Findings of this research study
6.14 Support of existing theories in resolving issues of concern in SWF
6.15 Reliability and validity of the findings
6.16 Summary
7 Conclusion 250
7.1 Research summary
7.2 Implications for theory and practice
7.3 Contributions of the research
7.4 Limitations
7.5 Recommendations for global SWFs
7.6 Recommendations for Oman SWF
7.7 The restructuring plan for Oman SWF
7.8 Future scope of research
REFRENCES 264
APPENDICES 276
A Scale reliability test results
B Principal component analysis results
C Descriptive statistics and normality test results
D Multiple regression test results
E Interview transcripts
F Final questionnaire for Oman SWF
G Global sovereign wealth funds

9
LIST OF FIGURES
1.1 Proposed research stages
2.1 Developing countries & emerging markets contribution to world GDP
2.2 SWF deals quantity and value
2.3 Typical SWF transaction showing links to existing theories and factors
affecting
2.4 SWF roots in EFIM Theories
3.1 Initial theoretical proposition for sovereign wealth funds
3.2 Impacts of qualitative factors on SWF
3.3 Impacts of qualitative factors on SWF
3.4 Impacts of quantitative factors on SWF
4.1 Research approaches
4.2 Questionnaire design
4.3 Data collection methods
4.4 Research methodology elements selected
5.1 Structure of analysing case study evidence
5.2 SWF Management structure between Parliament, MoF and NBIM
5.3 NBIM Management structure
5.4 Organisational structure for risk management compliance
5.5 Asset allocation fundamentals of GPFG
5.6 Division of roles between MoF, NBIM and Independent Council on Ethics
5.7 Market value at year end 1998–2009 in billions of NOK
5.8 Net government cash flow from petroleum activities by source 1971–2008 in
billions of NOK at 2008 values
5.9 Annual inflows into the fund by asset class in billions of NOK,
current price inflows into fixed income portfolio 1996–2009
5.10 Quarterly and annualised return since inception 1998–2009 in percent
5.11 Net government cash flow from petroleum activities from 1970 to 2030
5.12 GPFG projected market value in billions of NOK at current prices
5.13 Present organisational existence of SWF under MoF
6.1 Transparency and investment approach of Top 20 SWFs
6.2 Final derived theoretical framework
7.1 Restructuring plan for Oman SWF

10
LIST OF TABLES
2.1 Various SWF sources and purposes
2.2 SWF origin in 2008
2.3 Composition and asset allocation of SWF investments
2.4 Summary from the literature
3.1 Operationalization details of framework
4.1 Final Interview sample
4.2 Support for research methods‘ validity from literature
5.1 GPFG fact sheet
5.2 Key numbers for Norway SWF
5.3 Comparison between Oman and Norway SWFs
6.1 Set of interview questions
6.2 Template of interview discussion themes for Oman SWF
6.3 Measures dropped from regression analysis
6.4 Regression analysis results for performance of Oman SWF
6.5 Pearson correlation results for Success rate of Oman SWF
6.6 Regression analysis results for dependent variable success rate of Oman SWF
6.7 Regression analysis results of dependent variable performance and three
predictors: solutions, changes and impacts
6.8 Regression analysis results of dependent variable success rate and three
predictors: solutions, changes and impacts
6.9 Summary of the hypothesis testing
6.10 Validity of the findings of this study

11
KEY WORDS
Sovereign wealth fund, governance, transparency, investment strategy, asset allocation,
investee and sponsoring countries, structure, objective, performance and growth of
sovereign wealth funds
ABBREVIATIONS
ACGA - Asian corporate governance association
ADIA - Abu Dhabi Investment Authority
ANOVA - Analysis of variance
bn - Billions
BOP - Balance of payments
BRIC - Brazil, Russia, India and China group of countries
CAP model - Capital asset pricing model
CBO - Central bank of Oman
CEO - Chief executive officer
CFIUS - Committee on foreign investments in the United States
CII - Council of institutional investors
CIC - China Investment Corporation
COFER - Composition of official foreign exchange reserves
EFIM theories - Economics, finance, international trade and
management theories
EU - European union
FDI - Foreign direct investment
FE - Foreign reserves
FER - Foreign exchange reserve
FERF - Foreign exchange reserve fund
FINSA - Foreign investment and national security act
FTA - Free trade area / agreement
FX / Fx - Foreign exchange
GAFTA - Greater Arab free trade area
GAO - Governance and accountability office
GCC - Gulf co-operation council
GDP - Gross domestic product
GIC - Global investment corporation of Singapore

12
GPF - Government pension fund
GPFG - Government pension fund global
GPIF - Government petroleum insurance fund
ICGN - International corporate governance network
ICT - Information, communication and technology
IMF - International monetary fund
KIA - Kuwait investment authority
KMO - Kaiser – Meyer – Olkin test
KPMG - Klynveld, Peat, Marwick and Goerdeler
= Founders of KPMG accounting firm created from
Merger between KMG and PMI in 1987
MENA - Middle East and North Africa
MENASA - Middle East, North Africa and South Asia
MoF - Ministry of finance
NAFTA - North American free trade agreement
NBIM - Norges Bank Investment Management
NoK - Norwegian Kroner, Currency of Norway
OAPEC - Organization of Arab petroleum exporting countries
OECD - Organization for economic co-operation and development
OGSF - Oman state general stabilization fund
OPEC - Organization of petroleum exporting countries
PCA - Principal component analysis
P/E - Price earnings ratio
PE - Private equities
PPF - Public pension fund
P & O - The peninsular and oriental steam navigation company
Now, known as P & O Nedlloyd
QIA - Qatar investment authority
RBV - Resource based view
RDT - Resource dependency theory
ROI - Return on investments
SAMA - Saudi Arabia monetary agency
SGRF - State general reserve fund
SWF - Sovereign wealth fund
SWFs - Sovereign wealth funds

13
UAE - United Arab Emirate
UK - United Kingdom
US / USA - United States / United States of America
US$ - United States dollar
VIF - Variance inflation factor
VRIN - Valuable, rare, in-imitable and non-substitutable
WTO - World trade organization

14
Chapter 1 Introduction
1.1 Research context
This thesis presents research in the form of an analytical study of sovereign wealth
funds (SWFs), their policies and investment strategies. The research study involves
two different perspectives. Firstly, this study includes analyses of underlying
theoretical patterns of development of sovereign wealth funds, their investment
strategies, operations, objectives and impacts on financial markets. This results into the
theoretical proposition formed by factors affecting growth, performance and success
rate of SWFs. Secondly, based on the global patterns and analyses of the other
successful funds outside the GCC region such as comparison between Oman and
Norway, the primary data analyses and synthesis present testing of the theoretical
proposition and the final recommendations for global SWFs in general and for Oman‘s
SWF which can lead to their sustainable growth. The research study also involves
investigations of the conceptual development of sovereign wealth funds in the form of
links with existing theories and the influence of SWF on various components such as
economy, trade, regional development, financial system and capital markets. These
analyses allow review of SWF‘s operations in detail to further recommend the
development of investment strategies and policy issues whilst preparing a set of goals
for future actions in SWFs globally and for Oman SWF. This future plan of action for
SWFs suggests what can be done by the sponsoring governments of these SWFs along
with institutional and global industry views so as to achieve the sustainable growth and
required performance. Thus, the context of the thesis is defined within the domains of
international system of SWF operations and policies along with solutions set for long
term success of SWF by identifying factors affecting sustainable SWF growth.
This would also help in realising the future strategic plan of the government of Oman
to develop non-oil dependent economy in the next decade. In addition to the above

15
mentioned context, thesis identifies political, economic, legal and financial issues
between investee and sponsoring countries. Next section explains the background of
sovereign wealth funds.
1.2 Background of sovereign wealth funds
As the name suggest, SWF is an array of financial instruments, owned by a sovereign
state, where a nation‘s savings are accumulated. For these funds, the primary focus is
on the development of a foreign portfolio of investments. Other definitions of SWFs in
the literature suggest their funding, purpose and objectives of setting up (Hassan,
2009). There is no single definition of these funds but the term ‗Sovereign Wealth
Fund‘ (SWF) was first provided by Rozanov (2005) as SWFs are created from foreign
exchange reserves earned by a sovereign state to meet specific purposes. From then on
an overwhelming response for SWFs research from academic researchers, industry
analysts and government institutes has led to the number of definitions in the literature
outnumbering the actual number of funds. In general, SWFs are large amount of funds
managed by governments and are generated from accumulating foreign exchange (FE)
reserves, commodity exports, privatization proceeds or fiscal surpluses.
The emergence of SWF has changed the underlying assumption in the international
finance world that money would always flow from developed economy countries to
emerging and developing markets that is from USA, UK and Germany to Middle East
and Asia. Central bankers outside USA in UK, Japan and China were always investing
and buying national bonds (treasury notes) from USA considering it as a safe and risk
free investments. These two aspects in the global financial markets for money flow and
secured place of investments has been fundamentally re-written and it is more
influenced by economic recession or credit crunch in the last three years. Major

16
reasons for establishment of SWFs stem from the fact that central bankers have learned
from earlier experiences that it is better to have a substantial account of money in the
foreign exchange accounts because if sufficient cash is available in readily accessible
accounts then it could help the governments during any fiscal crisis, currency
devaluation, national economic emergency and even change in the government
(Anderson, 2009). Major sources of funding to these SWFs come from oil income or
non-commodities. For example, GCC region SWFs have utilized their oil income to
establish SWFs where as China and Singapore are non-commodity based funds and are
funded from trade surpluses. SWFs serve the purpose of having necessary cash or to
meet short term requirement while investing remaining excess securely in low return
investments. The pool of SWF cash is usually separate from currency and liquidity
management (Lam and Rossi, 2010; Kotter and Lel, 2011). US treasury defines SWFs
as
―Government investment vehicles funded by foreign exchange assets that are managed
separately from official reserves. They seek higher rates of return and may be invested
in a wider range of asset classes than traditional reserves. SWFs generally fall into
two categories based on the source of their foreign exchange assets: commodity and
non-commodity funds‖ (US GAO Report, 2008, p46).
The major characteristic and issues of concern as portrayed by western governments is
the return of state power and influence within global financial system and their
political economy (Wolf, 2007; Garten, 2008; Helleiner and Lundblad, 2008). Other
key traits of SWF include high foreign currency exposure, lack of explicit liabilities,
high risk tolerance and long investment horizons (Jen, 2007; www.IMF.org, 2008;
Anderson, 2009). SWFs‘ characteristics can be defined as: state ownership, separate
management from official FE reserve, high foreign currency exposure, no explicit

17
liabilities like pension funds, high risk tolerance and probably long term investment
motives (Singh, 2008; ). Their investment choices and asset allocation strategies may
create implications worldwide for example, increasing investments in risky businesses
for high return may reduce liquidity issues in market for low risk businesses (Balin,
2010); or less inclined investment strategy for high tech, research and development
based industry would reduce development of the specific industry in the investee
country (Fernandes and Eschweiler, 2008). Thus, growth and investment strategy of
SWFs lead one to the debatable aspects of how much recipient countries can allow
SWFs influence on their industries and markets considering their bilateral relations
and; how much investments SWFs would allocate considering the risk and return
balance. For example, which investment is better from these two: US treasury notes at
low secured return or high return equities in volatile stock markers of developing
economies with more than 8% GDP growth rates. Detailed discussion of emergence of
SWFs is provided in the next chapter of the literature review. Many current issues
involve dilemma for both investee and sponsoring countries about growth, return,
transparency and protectionism which are discussed in the following section.
1.3 Current trends and management of SWF
1.3.1 Current trends
Publicly managed government institutes have large amount of assets and they are
currently influencing the global financial industry significantly while drawing attention
as an important investor of global equity. They can be categorised into three types:
sovereign wealth funds (SWF), foreign exchange reserve funds (FERF) and public
pension funds (PPF) (Mitchell et al, 2008). Their governance, investment strategies and
political value may be different but their usage in financial terms can be defined as

18
common to use them for country‘s economic growth (Bernstein et al, 2009). This thesis
discusses about sovereign wealth funds only and not any other type of funds.
Sovereign wealth funds are in existence from more than half a century but their size
and impacts have been recently increased in the last decade. Growth of SWF is evident
from total assets increased from US$500bn in 1990s to more than US$3.5 trillion as of
today (Kotter and Lel, 2011). For example, these wealth funds have contributed 35% of
mergers and acquisitions activities in 2007 and in a year span, have purchased equities
worth US$ 83bn in 183 deals for various financial and high tech institutions like
Barclays, Citigroup, Credit Suisse, Merrill Lynch and Morgan Stanley (Kern, 2007;
Drezner, 2008). According to International Monetary Fund (IMF) forecasts, SWF
assets‘ accumulation may reach more than US$ 8 trillion by 2011 (Surprisingly this
has not happened by December 2011) and US$12 trillion by 2015 respectively
continuing the current growth rate. Major reason for the growth during 2006 to 2008
may be the oil prices soaring to a level ofUS$150 a barrel because leading funds like
Abu Dhabi, Norway, Saudi Arabia, Kuwait, Oman and Qatar are oil income based
SWF (Truman, 2008; Anderson, 2009). Recent surge in the investments made by
SWFs and their sponsoring governments‘ role of high finance and high politics with
unapproved but likely inherent or apparent motives is widely criticised by American
and EU Governments (KPMG, 2007; Patelis, 2007).
On the other hand, SWF investments look large but they are actually small in size
compared to other global financial industry sectors since SWFs share less than 2% of
the total global financial assets worth more than US$ 190 trillion (Davidson, 2010).
For example, in 2007, pension funds were managing assets worth US$ 28 trillion,
mutual funds US$ 25 trillion and insurance funds US$ 18.5 trillion which make SWF
less than 5% of when compared to these funds. The total market capitalization of all

19
publicly traded companies in the world is approximately US$ 57 trillion and USA GDP
is US$ 12 trillion which proves again that SWF are not much significant in size to
other financial segments (www.swfinstitute.org, 2009; Balin, 2010).
1.3.2 Management issues
Generalization about SWF as a legal entity or their structure is not possible because
across the world, every country has different sources of funds, governance structures,
operations, investment patterns, financial policy and goals, company and laws of
institutional formation (Singh, 2008; Anderson, 2009).
Amount and investment deals‘ size of SWF may not be the issue always as known
from above discussion but policy researchers, analysts and governments of investee
countries view SWF assets‘ buying behaviour as more political rather than financial.
The reason being cited for this view is; credit crisis provided these SWF to exercise
power and existing liquidity with them to acquire strategically vital targets in investee
countries. Their acquisition pattern when analysed clearly supports this view (Drezner,
2008).
However, view point of business lobbyists is in the favour of SWF since these funds
are a way of tackling the current and any future financial turmoil, if dealt with a non-
destructive competition for growth and profitability without adding more protectionism
and having unnecessary fright from SWFs‘ investments. Just like any other growing
industry, new benchmarks of transparency, accountability, governance and other
regulatory standards can be formulated for SWF without dragging into the debate of
objecting their motives. This can be attributed to more of a development perspective
rather than political (Stiglitz, 1993 as cited in Bernstein et al, 2009). Many such issues
of transparency, best practices, ideological implications, bargaining leverage in

20
economical – political decisions and finally, the shift of global power away from
advanced and industrialized nations to developing countries are major issues emerging
out of this sudden growth and recent investment activities of SWFs (Truman, 2008).
Limited transparency and investment motives of SWFs are growing issues of investee
countries which lead investee counties to create more protectionism mechanism. This
ultimately results into the management of SWF to a sustainable growth level becoming
crucial for governments who have sponsored them and investing money to acquire
assets anticipating profitable returns from deals. These complex issues of SWF
management can be better understood from their various definitions, objectives,
purposes to set up, investment strategies and type of deals. According to Mitchell et al
(2008) sovereign wealth funds are developed by governments utilizing various
resources such as natural, taxes, fiscal or trade surpluses. SWFs usually manage assets
separately from foreign currency reserves and tend to be investing internationally and
when needed, in domestic operations, infrastructures and in stabilizing the industries.
These SWFs are at present very important to global financial world for two reasons.
Firstly, it holds liquidity worth more than US$ 3.5 trillion and other unknown figures
in their portfolios. Secondly, their performance and management impact on economy
in their own countries. Hence, these SWFs require asset increase and profitable returns
(Lyons, 2007; Chhaochharia and Laeven, 2009). In principle the financial perspective
of SWF leads them to seek higher profits, asset diversification so as to improve the
fund‘s efficiency of asset allocation and reduce risk for wealth of their citizen on
whose behalf they make investment (Chhaochharia and Laeven, 2009). But, SWF
policies of many countries in the present situation is mixed and not standardised as
they tend to invest in open economies of USA and Europe, attempts to increase their
portfolios but when it comes to receiving or allowing foreign direct investments from
other countries they turn to protectionism (Koyama and Golub, 2006). Also, the

21
transparency agenda and their investment strategies have created big concerns. It has
been repeatedly stated by Western countries that their investment objectives are
politically motivated (Summers, 2007). For example in 1988, Kuwait Investment
Authority was asked to reduce 22% stake acquired in British Petroleum (BP) to 9.9%
by UK monopoly and merger commission on the grounds that such an acquisition
would exercise considerable influence over BP. In another example, Dubai Ports
World of UAE acquired P&O British owned shipping company in USA in 2005 giving
it controls over several USA port facilities, then a year after Dubai Port World was
asked to divest the operations citing national security issues (Singh, 2008;
Chhaochharia and Laeven, 2009). These types of cases can be reduced with
standardization and common principles such as Santiago principles when followed by
both investee and sponsors of SWF. In 2007 major SWFs sent a hostile response to the
International Monetary Fund (IMF) in reply to the code of conduct compliance request
from G-7 countries. USA treasury department has persuaded two large and influential
SWF of Singapore and UAE to adhere to governance and transparency standards with
a commitment to have commercial criterion for investments rather than politically
motivated (Greene and Yeager, 2008; Anderson, 2009).
Above discussion explains that not only scope, definition and investment strategies in
managing SWF are important but concerns about transparency, decision making
policies, governance, planning also shape the growth, performance and
transformational agenda of SWF. Next section discusses current status of economy of
Oman and issues emerging for Oman‘s SWF.

22
1.4 Oman’s economy and SWF
The ruling of Oman since 70s by Sultan Qaboos has provided growth and development
to the country whilst acquiring a good reputation among GCC countries. Oman has
become a major hub of global trade, finance and economy in the Middle Eastern and
Asian region. However, country‘s major source of income is from oil and gas exports.
Therefore, government of Oman has planned series of developments in terms of policy
reforms, restructuring hierarchies and industry support to create non-oil dependent
economy. This is where the major contribution can be made by SWF of Oman. The
SWF of Oman is however affected by national culture, political economy and the
issues within SWF such governance, strategy and structure. This study attempts to find
the factors affecting and their impacts on SWF growth which would lead to create the
solutions in the form of recommendations for Oman SWF. The statistics also reveal
that Oman started SWF in 1980 however Oman SWF was not able to create a large
asset base such as Kuwait or ADIA. Oman SWF has reached to US$ 8 to 13bn here as
its competitors Kuwait and ADIA have reached more than US$ 250 billion and US$
850 billion respectively. Therefore, one must find the factors affecting growth, success
rate or overall performance of SWF which is major component of the problem
statement as discussed next.
1.5 Problem statement
Sovereign wealth funds‘ current trends of unprecedented growth, governance and
profitability issues with global debates of transparency and protectionism mechanisms
from sponsoring and investee countries make management and operations of SWFs
and their investment decisions very difficult and complex. Also, each SWF in its own

23
is affected by political economy and cultural background of respective sponsoring
country and issues within the SWF organisations. Therefore, it is very important for all
SWF sponsoring countries and their executive decision makers to know which factors
are crucial for its long term growth and success rate. Thus, this is the first problem
addressed in this thesis.
Secondly, with a significant decrease in the oil prices from its peak beyond US$ 130
per barrel to a range of US$ 40 to 60 per barrel and economic recession worldwide has
affected the income and growth of GCC region. The oil revenue dependent economies
of GCC and OPEC have less to take into SWF with more sales of oil resources. Oil
price more than US$100 a barrel during 2008 has given boost to the large assets buying
behaviour of oil income funded SWFs before the global credit crunch, however big
investments have also been made during the same period (Drezner, 2008; Truman,
2008). With economic downturn and decreased demand of oil, multiple problems have
emerged for GCC region such as sudden collapse of stock market indices, weaker
currency exchanges against British Pound sterling, Euro and US Dollar, less liquidity
for local developments and loss making transactions in SWF investments. The
government of Oman has realized that sustainable growth needs to be drawn from
development of non–oil sectors such as construction, manufacturing exports, retail,
tourism, transportation and financial services. Economies of these countries can be in
more disastrous position if oil prices falls below US$ 40 a barrel but this may not
become the reality as global oil demand increases every year. To survive further
economic downturn many GCC governments have already saved large amounts from
their excess oil revenues which has provided larger than expected liquidity to SWF
(Santiso, 2008; Farrell et al, 2008; Chhaochharia and Laeven, 2009). From this context,
what if the broader recession continues with tight credit markets, lower house prices,
lower oil demand and slow GDP growth.

24
Thus, a major question for smaller SWFs such as Oman‘s SWF with only US$ 8.2bn to
13bn is how to manage SWF better to increase financial leverage, consumption, and
profitability so as to be more sustainable before an economic recovery can happen. The
technological innovation and political stability are crucial for survival or growth in
industries and SWF. Countries with large SWF may survive by continuously
monitoring opportunities and making right choices for their investments.
During such period, the economic growth or transformation depends on how
successfully governments can formulate their policies, investment strategies and
reforms of privatization or de-regulation. How government takes actions as a regulator
of the market dynamics would decide the level of turbulence among the businesses and
industries. Other countries may not want to replicate highly leveraged debt based
economic growth as in case of development of Dubai in the last two decades since they
can see the problems of re-paying high debt or re-negotiating further finances. This
provides difficult financial outlook for GCC region. Thus, SWF as a major source of
liquidity and large cash reserves emerges as a feasible solution to manage the domestic
financial turbulence however, willingness for investments from SWF sponsoring
Governments and can they manage SWF sustainable for a longtime is again poses a big
question.
These recent financial and economic problems, SWF characteristics and current trends,
situation of Oman‘s SWF collectively enable one to formulate the following major
problems to be addressed in this thesis.
1. Which factors are vital to the success and development of SWF in general
and for Oman‘s SWF?
2. What shall be the approach to be adopted by SWFs to be more competitive
and profitable in the long term?

25
3. What changes are required in terms of new policies, reforms, preventive
measures, specialized systems or control mechanisms?
4. How can Oman‘s SWF adopt and implement new initiatives in terms of
economic policies, investment strategies and operations of SWF?
Finding answers to these specific issues from factors to implementation of
recommendations would form the basis of this research study. This study aims the
wider scope of contribution in finding what is crucial for global SWFs and also, aim to
recommend changes required by SWF of Oman.
1.6 Aim and objectives
The main aim of this research is ―to review sovereign wealth fund strategies and
policies; and to find out the factors impacting sovereign wealth fund so as to
provide recommendations for their long term growth and development‖.
Following objectives would be met in the process to achieve the main aim of the study.
a. To understand the concept of SWF in detail with existing theoretical linkages in
finance, trade, economics and management. This may help in analysing SWF
problems and findings the root causes of the problems in SWFs.
b. To find out factors significantly impacting SWF growth and success rate based
on the analyses of sovereign wealth funds.
c. To validate the factors identified based on the analyses of multiple evidences
from selected sovereign wealth funds.
d. To analyze present status of strategies and policies of Oman‘s SWF so that one
can recommend an action plan comprising new initiatives such as investment
strategies, policies and asset allocations.
26
1.7 Focus and significance of the study
1.7.1 Focus of the study
SWF has attracted much attention from researchers and governments for investments,
growth, transparency and other related issues. This is evident from the recent surge in
number of academic papers and reports from banks and investment analysts. However,
overall research in case of SWF is limited in terms of in-depth analyses of SWFs for
policies, investment strategies, global patterns, comparison of deals between SWF.
And, there is not much evidence found in the literature presented by professionals
engaged in managing or administering SWF and its relevant components.
This research study is based on the following major research themes which form the
main features of analyses in the thesis.
Scope, size and operations of SWF
Investment strategies, regulatory standards and policies of SWF
Management issues of SWF for their sponsoring countries and investment
recipients
SWF performance and its impact on global and domestic finances
Factors impacting positively or negatively the growth of SWF
This study is not directly extending the work from any previous research however it
uses the literature analysis as a foundation to develop the research, for example studies
of Pistor and Hatton (2011) about political economy of SWF; Bernstein et al (2009)
about the investment strategies of SWF; Meggison et al (2008) about the investment
patterns and performance of SWF and Mitchell et al (2008) about how to manage the
public investment funds. Such studies are recent and concentrate on analysing SWF
structure, operations, factors affecting, investment deals, investment strategy,
performance and objectives of SWF.

27
The research study is divided into three parts:
Collecting and analyzing literature and industry data to formulate the theoretical
proposition comprising factors affecting the growth and success rate of SWF
Collecting and analyzing primary and secondary data from Norway and Oman‘s
SWFs to validate the proposed framework
Preparing a set of recommendations for global SWFs and Oman‘s SWF
1.7.2 Significance of the study
The detailed literature review offers insights into the various aspects as listed in earlier
sections. This research study utilizes the secondary and primary data from SWF such
as their characteristics, performance indicators, investment strategies and patterns,
policies, operations and management issues. This thesis mainly concentrates in the
following four domains:
a. To identify the key literature and review this would contribute to the body of
knowledge.
b. To develop and validate the research framework by way of testing hypotheses
which enables addressing key research questions. The proposed framework
comprises factors affecting long term growth, performance and success rate of
SWFs.
c. To provide insights to practicing SWF professional managers to use the
findings and set of the practical and logical recommendations from this study to
improve their investment strategies.
d. To enable Oman‘s SWF to utilise the results of this study in the form of
practical recommendations with a proposed action plan to improve long term
growth.
28
e. To yield validated methodology which has further scope of research for
example, study using longitudinal data sets.
1.8 Research methodology
In this study, it is proposed to utilize both the inductive and deductive research
approach for developing and testing the theoretical proposition based on the case study
research strategy. The data collection would be done in the form of secondary data
from documents and primary data through interviews and questionnaire (Saunders et
al, 2009). The research methodology proposed for this study can be explained by both
process and stage models. According to the process model given by Philips and Pugh
(1994), the research process for this thesis can be as follows.
Back ground theory – This would enable one to identify topic, problem; to carry out
review of literature and evaluate the existing research.
Focal theory – This would enable to formulate the framework, hypotheses and to
specify the main idea of the research to push forwarding the subject area.
Data theory – This would justify appropriateness of research methods selected;
relevance and validity of the data collected and analysed to support the research aim.
Utilization of theory – This is basically an application of derived theory based on
findings and practical recommendations. Such an application validates the findings and
allows generalizations whilst correlating findings and recommendations to the existing
literature, theoretical framework, adopted research methodology and practice of the
field.
The above explained research process can correspond to various stages in the following
diagram which provides details about research activities proposed in this study.

29
Figure 1.1 Proposed research stages
Source: Philips and Pugh (1994); Saunders et al (2009)
Direct experience, Participation, current performance of Oman’s SWF & Secondary data leading
To define the research problem, aim and objectives – Background Theory
Review of Literature – Background Theory History, Evolution, Definitions and Concept of SWF;
Number of factors affecting any SWF; Current and global trends in SWF investments
Research Design– Data Theory Approach, strategy, Sampling,
Data collection and data analysis methods
Data collection – Data Theory a. Secondary data of Oman and Norway SWFs to understand factors and
investment objectives and strategies b. Interviews to understand management and operational issues in Oman’s
SWF c. Questionnaires to test hypotheses of research framework to find factors
impacting any SWF and develop further strategy from its analyses
Analyses of Findings – Data theory To analyze Secondary and Primary data
Testing hypotheses and validating factors proposed in the model based on the multiple evidences from the data analyses
For Global and Oman SWFs – Utilization of theory Final derived framework of factors affecting SWF growth
Recommendations for global SWFs Recommendations and restructuring plan for Oman SWF
Research framework – Focal Theory and Hypotheses formulation
Pilot testing the data collection instruments - Data Theory Conducted in Arabic & translated into English
Feedback from academics, managers and experts for Interview Question Set and Questionnaire

30
1.9 Structure of the thesis
This research thesis is divided into eight sections, each one described as a chapter as
follows. First chapter comprises of history, back ground and main research themes‘
overview with problem statement and significance of this study to academics and
managerial communities. Second chapter discusses academic literature and its
criticism and analyses to understand various factors related to sovereign wealth funds.
Third chapter introduces the proposed theoretical research framework based on the
literature reviewed which would be tested by primary data. Fourth chapter outlines
the selection and reasoning behind choice of all research methodology components
selected into this research. Fifth chapter analyses the secondary data of the two cases:
Norway and Oman. Chapter six analyses the results of primary data collected through
interviews and questionnaires. This chapter include testing of the theoretical
framework, analysis of findings and discussion. Finally seventh chapter is in the form
of conclusion which details the research summary, recommendations for global SWFs
and Oman SWF, implications for theory and practice, novelty and utilization of this
research, limitations encountered during the research and further research scope in the
SWF domain. Appendices include graphs and tables from questionnaire data analysis,
final questionnaire and interview transcripts.
1.10 Conclusion
This chapter outlines the scale and scope of the entire structure of the thesis. It presents
the conceptual development of the central theme of research and what is involved in
the study whilst explaining research problem, aim, objectives and significance of the
study.

31
Chapter 2 Literature review
2.1 Introduction
The aim of this chapter is to review the existing literature relevant to the roots of
sovereign wealth funds to understand these funds in detail. The chapter attempts to find
information regarding main research questions, major components and characteristics
of sovereign wealth funds (SWFs). This chapter provides analyses of SWFs history,
growth, role, investment strategies, regulations, operating standards, current trends and
their debates about impacts on the global finances. Such analyses of each different
aspect about sovereign wealth funds allows one to identify the factors affecting SWFs.
Current issues having worldwide attention in the media are governance, transparency,
accountability, investment motives which are discussed within domains of assessment
of SWFs. It shall identify key issues within the global trends about SWF such as their
influence on the economy, regional development and impacts on global financial
markets and international trade. Such a reflective and critical analysis of literature
would provide the comprehensive view of these sovereign wealth funds and its
systematic management. This section of thesis can be considered as explaining back
ground theory as it presents critical analyses of the existing literature from the previous
research studies in the academic and industry for sovereign wealth funds and their
related topics (Philips and Pugh, 1994).
This starts with the development of SWF as a pure financial institution from years back
when it was considered just another government owned national capital reserve entity.
Next sections follow entailing SWF into their importance, strategic influence and

32
different implications. This literature review chapter finally outlines the literature
analysis summarising from analyses, inferences and limitations from the literature.
First formal and official setting up of SWF dates back to 1953 and then few GCC
region SWFs started in 80s; however, much attention has been given to these SWFs
very recently by investors, analysts, governments and researchers after 2005. Much
less research is published till end of 90s for SWFs. Due to this fact this literature
review has been limited to data from the last decade. Hence, this review can be defined
as ‗post- 2001‘ research study. The next section starts the review of literature
explaining different definitions of SWFs.
2.2 Definitions, history and concept of sovereign wealth funds
This section discusses definitions, historical evolution and conceptual development of
sovereign wealth funds.
2.2.1 Definitions of SWF
Following definitions of SWF provides different perspectives of these funds‘ origin,
purpose, sources of money and their major aim or objective of starting a wealth fund.
―SWFs can be defined as government owned investment vehicles with no explicit
liabilities to their owners other than internal to the government, significant exposure
to high-risk foreign assets, and a long-term investment horizon‖(Kotter and Lel, 2011,
p.3).

33
―SWFs are the investment vehicles managing portfolios on behalf of their governments
and their investment capital is usually derived from either petroleum revenues such as
GCC region funds, Russia or Norway; or persistent current account trade surpluses
such as China or Singapore‖(Dewenter et al, 2010, p.1-2).
―SWFs are state owned investment funds set up for the investment of excess foreign
exchange reserves or natural resource export surplus. These are part of the large
collection of sovereign investment tools including state owned pension funds‖ (Zhang
and He, 2009, p.2).
―The term SWF generally describes state-owned or state-controlled pools of capital
that are actively invested, at least partially, outside the country‖ (Helleiner, 2009, p1).
“SWFs are government owned investment entities, set up for a variety of
macroeconomic purposes. They commonly take the form of long term investments of
foreign exchange assets in overseas holdings‖ (Bahgat, 2008, 2010, p.1).
―Rather than all aspects of SWFs, the crux of issue is state capitalism. That is the use
of government controlled funds to acquire strategic stakes around the world‖ (Lyons,
2007, p.1).
These definitions explain the sources of input reserves to sovereign wealth funds and
funds‘ utilisation of that input into investments. The following sections explain history
and conceptual development of SWF which enables one to understand the theoretical
links of sovereign wealth funds and their existing roots.

34
2.2.2 History of SWF
The development of transactions shifting financial power from west to east has its roots
in the re-adjustment, re-emergence and post world war balancing theories. Major
countries included in this balancing of financial power or relative decline of USA
economy‘s control over the world are BRIC group (Brazil, Russia, India, China), Japan
and an energy rich GCC or Middle East countries.
The western countries in recent years have suffered from various problems like
financial imbalances, increased dependence on service economies, ageing population
and workforce, disintegrated leadership and competition issues. However, these
problems can be solved but consequences of these issues are long term and far reaching
which can create new world order of global economy. This provides a new perspective
on the old assumption that money would always flow from developed countries to
developing countries (Hassan, 2009). This assumption has been proved wrong as these
SWF have started acquiring stakes and created investments and assets portfolios worth
over US$ 3 trillion. These funds are best understood as national investment vehicles or
state repository of wealth from the meaning of their structured name in three parts:
‗sovereign‘ – state entity or government ownership, ‗wealth‘ – savings, assets or
investments and ‗funds‘ – financial institution or financial vehicle different from
normal a bank or private equity company (Anderson, 2009; Hassan, 2009). These are
best understood as govt. owned enterprises with excess cash on hand for liquidity,
currency stabilization and investments. The idea behind these SWF creation is to keep
funds available for origin country to meet the demands of market fluctuations, cover
import bills due in a year time or other foreign liabilities. History dates back their
starting of these SWF to 1816 in France, 1953 in Kuwait and 1956 in Kiribati. Later on
in 70s and 80s major Gulf countries funds have come up. SWF have two major criteria:

35
to use excess money for reserve adequacy measures and other to make profit out of it
with minimum risk. Once, the monetary requirement of origin country is met then the
remaining excess or surplus is left for investment. But, this surplus is used in risky
investments also with short term profit making goals. Definitions applied by academia
and industry provide fair view of this concept of SWF.
2.2.3 Concept of SWF
Main participants in the financial markets are either surplus or deficit funds units.
Federal governments usually act as deficit units in this. These units control the flow of
money and other institutional operations in money and capital markets. Non-depository
institutions have a major motive of generating funds from sources other than deposits
and they have a vital role in the financial intermediation. These institutions include
banks, finance companies, wealth funds and insurance firms to name a few (Madura,
2003). These national reserve and pension funds were earlier comprised of gold
reserves before gold standard was dropped in 1930s. Then onwards, the objectives of
regulatory control and reserves for managing any future economic turbulence have
provided an origin to the concept of foreign currency reserves which are finally
branched out as investment and development funds, called as Sovereign Wealth Funds
(SWF). The term ‗SWF‘ came in the last decade but set up of SWF can be dated back
to 1953 when Kuwait launched first GCC SWF (Singh, 2008; Hassan, 2008, Pistor and
Hatton, 2011).
There is not a single overarching definition or meaning of SWF, however as Kirshner
(2009) analyses them as S + W + F, they are investment agencies– funds that deals in
maximising assets and return on the investments – wealth and is controlled or managed
by ministries of respective national governments – sovereign, which is actually owned

36
by population of particular sovereign state. SWF is a capital flow from surpluses to
recipient countries which is generated from current account surpluses. This was
followed by developed countries in 1870 as well. For example, such income has
provided surplus benefits to UK government investment account since 1870s. The
major differences between past and today‘s SWF are: a century ago, developed
countries invested funds where capital was scarce and natural resources high and hence
the high returns. Investors were mainly the private sectors. In the present scenario,
capital is moving from emerging to developed economies by SWF and investors are
majority central reserve banks and government entities. Oil is not a renewable source
and hence, it is sensible move from GCC region that profit margins of this oil income
is spread as a saving investment which can provide income when cases arise of ‗no oil
income‘ or ‗reduced oil income‘ or to tackle ‗inflated economy‘ in future. This makes
emerging markets shift their position from debtors to being creditors. Post-Asian
economy crises a decade ago, at least 10 SWF are set up and more over India, Brazil
and Japan are planning to join the same competition. Emerging markets current
account position was in surplus of US$ 685bn i.e. 1.3% of global GDP and developed
countries were running 5% of global GDP in current a/c deficits these include USA,
UK, Australia, New Zealand, Greece, Iceland, Portugal and Spain. Another evidence of
this scenario is 60% higher than the required foreign exchange reserve held by
emerging markets economies i.e. approx. US$ 3 trillion (Gieve, 2008).
Major aims of such these funds are to improve liquidity in the system while monitoring
the process and to increase the profitability and asset base as set out by regulations by
their respective Governments or ministries managing the funds. Alternatively, inferring
the basic meaning of SWF from name itself: ‗Sovereign‘ component adds the strategic
and state ownership means to these funds whereas ‗wealth‘ as a term in the SWF is
said to be more associated with creation and maintenance of different financial assets,

37
for example, stocks of equities, bonds, properties, precious metals and other financial
instruments. To a large extent, SWF can be defined as asset and investment fund
owned and managed by the government. The inflow fund sources for SWF are foreign
exchange reserves, commodity exports, privatizations proceeds or fiscal account
surpluses. Apart from wealth creation, the SWFs have major objectives of currency
stabilization, bilateral trade improvement or economic controls within the country such
commodity prices or inflation (Singh, 2008; Bahgat, 2008, 2010). It is not possible to
consider them homogeneous according to characteristics as their fund sources,
governance structures, investment patterns, objectives and operations management are
very much different. For example, Norway‘s government pension fund is not separate
legal entity from nation‘s central bank where as Korea has created another legal entity
as Korea Investment Corporation (Berstein et al, 2009).
Based on resources, they can be broadly categorised as stabilization, savings and
pension funds. Stabilization funds are set up during commodities price increase and
funds are sourced usually when prices are low. For example, reserve fund of Russia.
Savings funds are created with aim of long term wealth accumulation to manage future
liquidity requirements. Pension funds are created to provide finance for future pension
disbursements. These are directly managed and owned by governments and often
considered as SWF. Examples are Irish national pension reserve fund and Oman
Government‘s nine different pension funds (Singh, 2008; Mitchell et al, 2008).
But, these funds are not new and as history claims, the first SWF was set up in 1816 by
France, namely Caisse des Depots Et Consignations. The next fund took more than a
century gap with Kuwait investment board in 1953 and Kiribati revenue equalization in
1956, both by British administration when these countries were still operating as
38
colonies. The next wave came in 1970 – 80s when Middle Eastern oil producing
countries set up SWF. For example, Temasek – Singapore (1974), Abu Dhabi – UAE
(1976), Oman (1980) and Brunei (1983) and Norway (1990) set up reserve or
stabilization funds as investment and development vehicles. The difference between
pension funds and SWF is not always obvious as suggested by Truman (2008) while
analysing all 56 SWFs on a common scorecard. Many governments linked SWFs hold
significant stakes in the listed companies. The best examples are France and Russia,
who holds US$ 280bn and 250bn respectively in listed equities (Balding, 2008).
The concept of developing SWF is to switch ‗debt economic regime‘ to ‗credit
economy regime‘ by developing countries or emerging markets where growth and
expansion of SWF can lead to economic transformation by higher returns on
investments and increase in asset portfolio (www.Pimco.com, 2007). This has worked
well for the central banks in developing countries as SWFs are increasing US$ 500bn a
year since start of this century.
Another rationale being reason for setting up SWF by developing countries can be
utilization of accumulated foreign exchange can help protecting economy in the times
of higher capital inflow–outflow and speculative attacks on currency and to meet
challenges generated by economic, trade and financial liberalization policies. The
massive global trade differences have also become significant reason for SWF.
Following table provides few more clear examples of SWF creation sources and
purposes.

39
Table 2.1 Various SWF sources and purposes
Source
Purpose
Commodity/
Revenue
Fiscal sources Foreign exchange
(FE) reserves
Stabilizing revenue
stream
Kuwait reserve fund,
Mexico oil
stabilization fund
Public pension or
future utilization
Russian national
welfare fund,
Norway govt. global
pension fund
Future fund of
Australia, New
Zealand super
fund
Govt. holdings
management
Oman Investment
company,
Mubadala (UAE)
Temasek
(Singapore),
Khazanah
(Malaysia)
China bank holdings
managed by China
investment
corporation
Wealth or risk/return
optimization
Oman state reserve
fund,
Abu Dhabi
investment authority
(ADIA)
Govt.
Investment
Corporation
(Singapore)
Singapore FE
reserve managed by
govt. investment co.
Or Korean foreign
reserve by Korea
investment co.
Source: JP Morgan (2008)
As any increase or decrease in oil prices and GDPs of Asian economies can make or
break these SWF as they are predicted in range of US$ 5 trillion in 2012 based on the
economic downturn (Fernandez, 2008) or US$ 12 to 14 trillion in 2014 by positive
outlook and results (www.IMF.org, 2008).
It can be seen from the above table that government bodies and wealth management are
interwoven to each other. As these funds are managed by ministries (political bodies)
and are managed for economic developments of their respective countries. Therefore,
one can say that there is relation between politics and economics in the conceptual
evolution of SWF. To explore more such links of SWFs with existing theories are
reviewed in the next section of this chapter.

40
2.3 Theoretical foundations of sovereign wealth funds
The following theoretical foundations of sovereign wealth funds (SWFs) are existing
theoretical underpinnings from various subjects in business and management. Such
analyses reveal the identity of sovereign wealth funds in terms of their creation, source
of income, objectives, structure. More importantly, these theories explain the factors
affecting sovereign wealth funds and impacts on markets and industries as implications
of investments made by these funds.
2.3.1 International trade theory
International trade can be defined as an exchange of capital, goods or services between
countries. The international trade represents a major share of gross domestic product
(GDP). The factors such as industrialization, advanced modes of transportation,
globalisation, growth of multi-national corporations and outsourcing activities can
impact an international trade. Increasing international trade is required if countries
want stable economies and to continue with globalisation process. Without the
international trade, countries would have access to limited goods and services produced
within their own country; and no access to the products or services from around the
globe. Now, the trade is carried out using international currency system and exchange
rates of currencies during each transaction of export and import. This makes all
countries with either deficit or surplus in their total trade activities annually. To meet
any trade uncertainties within and outside the country, each nation‘s central bank
attempt to reserve the foreign exchange earned through the exports revenue.
Today, the international trade mechanism involves currencies, accounts, standards,
central banks, trade unions such as EU, NAFTA and GAFTA; and regulatory bodies
such as IMF and WTO. Each country attempts to reserve the foreign currencies earn

41
through the international trade because they want to be in the stable conditions of
economical components such as interests rates, own currency exchange rates with
global reserve currencies such as US dollar or Euro or foreign exchange reserves to
meet the import bills payment demand and in case of any emergency arises within the
country. For this purpose, they try to hold the current and capital accounts in surpluses
within the balance of payments (BOP) system. Foreign currency reserves and gold
reserves are considered to be two major sources of economic stability and wealth of
nations. Thus, countries with excess foreign exchange reserves go for wealth
multiplication or at least secured earnings on their reserves. This is one of the basic
purpose, countries with surplus wealth set up the Sovereign Wealth Fund. Hence,
SWFs has its first root in the foreign exchange reserve generated from favourable
international trading system of export and imports made by the sponsoring country.
Thus, accumulation of foreign exchange plays a crucial role in creating an economic
climate for the country where they can set up a SWF. For example, world‘s total
currency composition of official foreign exchange reserves (COFER) has increased
from USD 1389bn in 1995 to 9258bn at the end of 2010 and gold reserves has
increased to more than 7800bn. The rapid increases in gold and foreign currency
reserves are observed after 2002 (www.imf.org, 2011). This rise in the reserve growth
has become an international policy agenda and is viewed from different perspectives,
such as financing of fiscal deficits, increasing reserves of developing and GCC region
economies, sustainability of this foreign exchange funds and low returns within and
outside the US (Pineau et al, 2006 at European Central Bank). This accumulation of
foreign reserves through international trade facilitates main sources of funding to SWF.
An important development in the financial markets post-Asian crisis in 1997–98 is that
developing Asian economies have become surplus in their balance of payments being

42
net capital exporters from previous status of net capital importers. This transformation
came from the persistent current account surpluses maintained by developing Asian
economies through their post-crisis reforms and mechanisms to avoid another such
crisis in the future. These reserves have increased to a level beyond traditional
requirements of liquidity purposes. Thus, these economies have started to shift their
concentration from managing liquidity shortages to multiplying these reserves by
making profitable investments. Hence, this is one of the basic motives of launching
SWFs which provides a blueprint for transforming these excess reserves to profit
making assets allocations (Park and Estrada, 2011). Therefore, main aim of these
SWFs should be profit making or return on their investments as funds available for
SWFs are beyond liquidity requirements and thus do not need guaranteed but low
returns from investments such as US government debt papers. Thus, international trade
explains the formation of SWF and its income sources. On the other hand, international
trade with financial management forms international economic system which revolves
around the demand and supply of goods and money. The commercial profit seeking or
wealth creation from trade surpluses have to be balanced between risk and return with
appropriate asset allocation based on the robust investment strategies of the financial
management as explained in the next section.
2.3.2 Financial management theory
The above discussion regarding international trade allows one to understand that
governments and central banks attempt to accumulate foreign exchange reserve and
once it has accumulated beyond their threshold of required future import bills‘
liquidity, governments turn to increase their wealth by investing these foreign
exchange reserves. This principle has given rise to the countries launching sovereign
wealth funds for increasing returns (Rozanov, 2010). When it comes to the gaining
43
return on the investments in general, it has been observed by researchers that with
increase in return, the risk increases. This clearly means that low level of uncertainty
(or low risk) is proportionate to low return, whereas high level of uncertainty (high
risk) is associated with high return (Madura, 2003). This is one of the fundamental
assumptions of the modern portfolio theory which mainly categorises all investment
strategies into two types: one that maximizes return for given risk and other that
minimizing risk for expected return. Return increase or risk reduction is enabled by
allocating investments in different types of assets to create a balanced portfolio (Daniel
et al, 2001). This holds true in case of SWFs investments where a collection of
diversified portfolio of assets as a whole have less risk as compared to an individual
asset. Researchers have observed SWFs investment strategies to reveal that depending
on the decision making structure, investment capital availability and targeted returns
from the portfolio, the risk varies in the SWF investments. For example, investment
decisions made by political leaders, domestic equity prices or influence of professional
external managers have impacts on the return of investments made (Bernstein et al,
2009). The implications of the riskier approach by SWFs towards higher returns can
cause easy access to the capital for riskier businesses and tougher situation for low
return businesses (Balin, 2010). Thus, SWFs risk and return approach can cause
imbalances within the money supply system in the markets or economies if these
investments are large enough for the markets as concerned raised by analysts and
governments (Gieve, 2008). Apart from portfolio theory, other investment theories
include capital asset pricing model (CAP), arbitrage pricing theory and efficient market
hypothesis; however, their detailed analyses are not in the scope of this research study.
These theories support the decision making process of selecting assets classes and
investment deals with a main aim of higher returns at lower costs and risks (Crabbe,
1996; Chandra and Shadel, 2007). Thus, SWFs investments can have effects from

44
financial and economic factors on their return as well as, they can impacts the money
supplies and economic conditions of the markets. The next section deals with SWFs
investments and their association with demand and supply of capital in the market
economies.
2.3.3 Economics theory
The economics theory of supply and demand helps determine the status of markets,
economic conditions, prices of goods, money supplies and changes required to be made
in the monetary policy. This theory explains that consumers wants to buy more
products at a decreasing price and suppliers wants to sell more products at an
increasing price. Thus, equilibrium reaches when suppliers and consumers agree for a
price at particular quantity supplied and till then price varies in the markets for goods.
This is called economic equilibrium of price and quantity. The conditions of market
changes from equilibrium when one of the demand or supply remains unchanged and
the other attribute changes. These changes in consumers‘ demands and supplies from
businesses or governments affect the prices of the products and services (Ahlersten,
2008). Applying this concept to capital markets and financial system; one can
understand that money supplies basically work from surplus financial institutions to
monetary deficient financial institutions. For example, investors make a savings
deposit at bank to earn interest and bank loans that money to the businesses at a fixed
interest rate to earn margin and pass on to the investors. Thus, money is supplied from
individuals and banks that are in surplus to the companies requiring money (Madura,
2003). As seen from the previous discussion of the international trade theory, sovereign
wealth funds are the financial institutions with surplus foreign reserves to make
profitable investments for their countries citizens, governments and central banks.
45
These ―investments by SWFs are one type of capital flow between countries so they
have always been closely related to global imbalances in trade. When countries run
surpluses on their current account, they generate equal and opposite net capital
outflows of one sort or another and those capital flows produce an investment income‖
(Gieve, 2008, p.196; www.BIS.org, 2010).
The supplies of capital to markets from SWF can change the stock prices, costs of
capital for businesses and in turn can affect the supplies and demand of money. On the
other hand, their current and future estimated growth does not make them bigger than
2% to 6% of the global financial assets. Their current position compared to other
financial industry segments is shown in the chart below. Hence, their overall impacts
can be negligible; however, persistent foreign exchange accumulation by SWFs
sponsoring countries can create vulnerabilities in the world economy and financial
system. The advantage of SWF investments is multiplied: long term investment
horizon can help moderating financial market downturns and their strategy for higher
growth returns can bring efficiency of global asset allocation (Gieve, 2008).

46
Assets under management by SWFs and relative to other investors and size of
capital markets at the end of 2006
Source: IMF Global Financial Stability Report, October, 2007
Thus, economics theory helps to analyse the effects of SWFs investments on capital
markets.
2.3.4 Agency theory
Agency theory helps explaining the problems between principal and agent, owners and
managers, employer and employee having a fundamental assumption that each of these
parties has conflicting interests between them as well as their self interests on their
own. It is a dominant approach in the economics and finance. This is basically an issue
of motivation of agents and governance from principals in one perspective; that is
either of them blames other for not achieving their functional targets or not doing their
moral duties (Fama and Jensen, 1983; Eisenhardt, 1989). The solutions for removal of
such conflicts are mechanisms by organizations for efficient wages, profit sharing
schemes, performance measurement, bond or contractual terms, employee stock option
plans, counselling and training for competency and motivation development. The
principal – agent relationship can be affected by basic problem of organisation
47
management such as delegation of authority, bureaucratic management style or
financial incentives or performance. For example, shareholders hire top management
executives to run the corporation and their differences can be within strategy and
financial domains of what is the top priority. Thus, agency theory issues requires
governance and management control mechanisms to be in place as either side of
principal – agent is responsible and accountable for their actions within the
organisation and their results.
In the context of sovereign wealth funds, agency theory framework is observed to
replicate in three different types of conflicts. Since it is a sovereign wealth, the real
owners of the accumulated wealth are citizens of the SWF sponsoring country. Thus,
citizens are the actual principals and custodian/ mangers of the wealth that is
government officials or central bank managers are agents. Hence, it is government
officials‘ moral and professional responsibility to make SWF profitable and growing
which can help the economy of the country. The second principal – agent conflict is
between top management of SWF and employees or external managers who are hired
to run the organisation. This is same as discussed above in the agency theory. Third
type of conflict is between SWF as an investment vehicle and investment recipient
company. In this case, company avails the finance / capital in return of equity and
profit of the company to SWF. Hence in this type of conflict, the principal is an
investee company and an agent is the SWF. Thus, one can observe that in a single
transaction of sovereign wealth being invested in a foreign company, agency theory
can explain all three major types of conflicts and thus required mechanisms to control
or to mitigate those conflicts. However, there is not much evidence of academic
research in this domain of SWF in the literature. There are critics of agency theory that
it has negative impacts on corporate and national cultures and it enables the conflicts to

48
arise instead of providing solutions for it (Ghoshal and Moran, 1996; Huse, 2005). One
cannot agree with critics of agency theory, since agency theory can be viewed as a
fundamental concept which helps to increase the understanding of these principal –
agent conflicts. The evidence of these conflicts can be seen in the recent political
upheavals in the form of revolutions in Tunisia, Libya and Egypt. In these cases,
citizens are principal who entrusted the governments and ruling elites that the
economies and interests of citizens will be protected by substantial resource and
accumulated wealth; however, increasing adversaries and turmoil provides the strong
evidence to the agency theory concept. SWF can help resolving these issues, if their
legitimacy and transparency is increased and the wealth is used to mitigate domestic
issues and to signal the growth of economies and industries in these countries. This
highlights the importance of these political economies and their strong relationship
with SWF objectives, governance structures and their behaviour. There were few
protests in specific regions of Oman. These protests could have risen to larger scale
conflicts; however, Sultan Qaboos – the current ruler of Oman took the right decisions
of more reforms, committing to funds to domestic demands and complete restructuring
of the council ministers and portfolios of ministers with new and young faces having
more opportunities to serve the country. Thus, agency theory can explain the
differences between SWF management and the sponsoring countries‘ citizens and
enable to resolve the issues such as current issues in Oman and restructuring of
ministerial portfolio allocation by the Govt of Oman.
2.3.5 Stewardship theory
The alternative theory of agency theory is that, managers when allowed to act without
instructions or supervision on their own initiatives, will act with due responsibility as if
they are the stewards or custodian of the assets under their management (Barney and

49
Hesterly, 2008). This is the basic principle of hedge fund operations where investors
rely on the performance of stewards of their wealth. In the SWF context, citizens at
first rely on government as their stewards of national wealth; then top management,
central bank, or ministries rely on the recruited employees or hired external wealth
managers, investment banks as their trusted stewards of sovereign wealth or public
finances. For example, this is similar to president is expected to govern or to manage
the national administration within the domain of constitution set by country‘s legal
framework. The central bank and government officials are the stewards of the
sovereign wealth for SWFs management. This has been extensively claimed in the
literature and global practices in SWF management (Bernstein et al, 2009; Norway
GPFG report, 2010).
The stewardship theory assumes that principal would be satisfied by the agents‘ single
handed performance or collective success of agents would reflect in the organisation‘s
overall success (Davis et al, 1997). Thus, stewardship theory suggests that managers
are assumed to be self-motivated and have no vested self-interests such as corruption.
This means that goals of principals and agents are closely aligned and matching. The
only conflict arises when in reality decisions made by stewards on behalf of their
principals turned out to be not profitable, for example, GCC region SWFs lost
approximate US$100bn in banking industry investments during 2007 – 09. If
principals and agents can reconcile their differences over non-profitable decisions
made such as banking industry example of GCC SWFs then they can move forward in
pursuing organisational goals rather than putting blames on each other. Thus, success
of stewardship theories depend on the acceptance of accountability by managers and
decentralization of power and control by top management as these work together to
bring results for organisations (Barney and Hesterly, 2008). Following the stewardship

50
theory for SWF, one can understand that citizens of the sponsoring nation expect the
government and central bank to work together in the national interest. The successful
examples are SWFs of Norway, China, Singapore and Saudi Arabia where central
banks have active roles in managing SWFs and providing the legal and regulatory
mechanisms for financial and non-financial decision making (Anderson, 2010).
2.3.6 Resource based view (RBV) and resource dependency view
The resource based view is concerned with resources available to determine strategic
position of the company as compared to their competitors. Thus, fundamental principle
of the RBV is that firm can create or sustain the competitive advantage by utilizing the
resources available to the firm (Wernerfelt, 1984). The edge over competitors is
possible when these resources are valuable, rare, in-imitable and non-substitutable
(VRIN) as suggested by Barney (1991). These resources can transform the short term
advantage into long term competitive advantage for the firm if they are heterogeneous
in nature and not mobile (Peteraf, 1993) and thus, these resources become in-imitable
and non-substitutable (Barney, 1991). These characteristics of internal organisational
resources make them necessary to be important; however, they are not alone sufficient
for organisations to create sustained competitive advantage. Thus, organisations need
external resources or conditions to be favourable to sustain or to create competitive
advantage. This concept of external resources dependence is called resource
dependency theory. The resource dependency theory is based on the assumption that
procurement of external organisational resources is of strategic importance for
behaviour of an organisation. Basic argument of resource dependency theory can be
defined as organisation A‘ competitive advantage over organisation B is equal to the
organisation B‘s dependence over the organisation A (Salancik, 1979). This means that
organisations even when competing with each other are dependent on resources,

51
resources are generated within the external environment and resources required by one
organisation can be a power in the hands of another organisation. This theory attempts
to establish a direct link between competitive advantage and resource dependence
(Pfeffer and Salancik, 1978; Boyd, 1990; Hayward and Boeker, 1998). These resource
can be employees‘ knowledge or expertise about business or technology, financial
resources, suppliers alliances, information know how or an advanced technology. The
interdependency between two organisations for power of such resources would vary
based on the availability of resources, VRIN characteristics of resources, resource
allocation by an organisation, dynamic capabilities to generate or to utilise these
resources by an organisation which has these resources. The arguments of external
environment and internal resources develop these two concepts as if they are
contradictory to each other; however, they are not contradictory but they are
complementary to each other. Because, resource dependency theory (RDT) argues
about resources in the external environment which is owned by other organisation as a
power but these resources are the VRIN characteristics resources which are owned by
other organisation as explained by the resource based view (RBV). Hence, these are
two different perspectives discussing same resources an organisation can develop, own
and utilise to sustain a competitive advantage. Thus, in the context of SWFs these
resources can be country‘s accumulated foreign reserves, national and political
economy supporting the business and investments culture or profit making asset
portfolio which is lacked by other SWF. Comparing Oman SWF current portfolio
worth of US$ 8bn to 13bn with other GCC SWFs having more than US$ 250bn; it can
be said that Oman SWF requires more VRIN resources. Resource based view and
resource dependency theory explain that what is required by SWFs to grow as an
organisation and also help to analyse any conflicting issues regarding resources
development, availability and utilisation.

52
2.3.7 Stakeholders management theory
The traditional view of the firm considers that organisations‘ prime duty is to create
value for their shareholders and in the process satisfy employees, suppliers and
consumers. On other hand, concept of stakeholders theory given by Freeman (1984)
suggests that apart from these direct stakeholders: investors, suppliers, employees and
consumers; there are other parties which must be considered by organisations in their
operations and relationship management such as government bodies, political groups,
pressure groups like campaigners, trade associations or unions, associated corporations,
potential employees, potential consumers, community in which business operates and
even their competitors in the industry. This stakeholder approach of organisation is
able to explain both internal – resource based view and external – market based view
as it integrates which stakeholder group can exert how much pressure on the
management of the organisation. Also, stakeholders can be identified based on their
social acceptance, behaviour, time sensitivity and urgency of the organisation to
manage the stakeholder demands (Mitchell et al, 1997). Also, it enables the managers
to list out specific stakeholders which are crucial to the survival of the organisation – a
normative view as well as why these groups shall be treated as important stakeholders
– a descriptive view (Donaldson and Preston, 1995). The stakeholders‘ relationships
with organisations can be examined by analysing compatibility of each others‘ interests
and necessity of connections as defining attributes of the relationships (Friedman and
Miles, 2002). When analysing every stakeholder or attempting to satisfy every
stakeholder, managers in organisation come across solving inconsistencies in their
management style, behaviour, accountability and governance. Thus, stakeholders can
affect the decision making of the organisation and vice versa, decisions and policies of
the organisation can affect the specific group of stakeholders (Clarkson, 1998). The
stakeholders‘ management and decision making differs in private companies and

53
government agencies. Sovereign wealth funds will have different criteria in this regard
because their primary objective is to improve country‘s economy and portfolio of
assets to growth and profitability. SWF management have six major stakeholders:
government, citizens and industry of the SWF sponsoring country; company,
government and community of investments recipient country. Decision making of
SWF management shall be in such a way that the interests of these six types of
stakeholders are maintained. This criterion enables the development of transparency
and governance mechanisms. The major obligation for SWFs is to citizens of their own
sponsoring country; their interests are similar as investors or shareholders in the private
profit making companies because citizens are the actual owners of sovereign wealth.
2.3.8 Isomorphism view
Institution theory researchers suggest that organisations are socially constructed
templates from actions within the organisations and interactions with the environment.
Thus, they consider organisations operating with precise procedures and mechanisms.
The neo-institutionalism explains social theory as a basis while developing a
sociological view of institutions in ways that they interact and affect society, a view
different from economical threads. The theory explains using social environment
fundamental that why many organisations end up being evolved in different ways still
having same or similar organisational structures. This is defined as isomorphism view.
The concept of isomorphism was introduced by Dimaggio and Powell (1983).
Institutional theory researchers argue that organisations achieve legitimacy, stability
and resources from the environment by adopting procedures and mechanisms. Four
basic types of isomorphism achieved by organisations are: competitive isomorphism –
pressures on organisations due to market competition; coercive isomorphism –
stemming from political influence and legitimacy issues; mimetic isomorphism –

54
standard or similar responses by organisations to uncertainty or market dynamics and
normative isomorphism due to same level of professionalism. The concept of
isomorphism hold true in case of sovereign wealth funds as they attempt to imitate
each other in terms of organisational structure, political influence, asset creation and
investment strategy for growth and similar responses to western countries demand for
governance and transparency. For example, similar protectionist approach is adopted
by many GCC region SWFs in response to Santiago principles for governance and
transparency of SWF operations and investments (Anderson, 2009). Isomorphism can
increase the chances of survival together as it may reduce the impacts of uncertainty
for a group of organisations such as SWFs from a region; however, it may lead to
formation of a cartel or a group being isolated in a wider industry perspective.
2.3.9 Strategic leadership theory
Strategic leadership has two major functions: management of communication internal
and external to the organisation and refinement of decision making process
(Cornelissen, 2004). The roots of the strategic role of the leadership are in the
managerial roles (Mintzberg, 1989) and upper echelons perspective developed by
Hambrick and Mason (1984) and organisational behaviour of the firms. Hence,
decision making of the top managers is affected by many factors as explained by these
theories; however, economically rational decisions are often difficult to make as
decision making is influenced by various factors such as external environment, social
context and multi-purpose stakeholder demands. This holds true in case of sovereign
wealth funds as many sponsoring countries of SWFs do not have democratic political
economies where decisions can be influenced by non-financial motives. Therefore,
their decision making can reveal what are the values and objectives of their leaders.
The extension of this concept is called strategic leadership theory (Finkelstein and

55
Hambrick, 1996). Thus any observations regarding managerial cognition or
organisational outcomes can help predict each other (Knight et. al., 1999). This theory
gives strong emphasis to executives own orientation rather than governance conflicts
as a cause of poor performance. Thus, analyses of decision making or managerial
perception can explain the operations and predict the future of sovereign wealth fund.
Both these methods are applied as part of this study: interviewing managers and
structured questionnaire about decision making in Oman SWF.
2.3.10 New mercantilism theory
The mercantilism is considered to have economic exchange resulting in a zero – sum
gain with capital is accumulated by winner in the exchange. Gilson and Milhaupt
(2008) have defined SWFs as neo-mercantalism stating that SWFs use company level
behaviour to maximize the return for country level benefits such as economic, social
and political benefits. According to this theory SWF objectives and management
should aim country level benefits. Gilson and Milhaupt (2008) found similar
characteristics in Chinese economy, trade policy and China Investment Corporation
(CIC). This is not same for other SWFs such as Norway or GCC region funds.
Schweitzer provides alternative explanation that SWFs are imperialist – capitalist
institutions and they can exploit the capitalist system for their own. Thus, neo-
mercantalism theory is not able to explain the behaviour and structures of all SWFs.
2.3.11 Autonomy maximization theory
Sovereign Wealth Funds have received much of attention in this decade and more
during the global financial crisis as critical investors. Mixed reactions have ranged
from their political motives, state intervention and long term investors who will take on
higher risks for new technologies and higher return. The fact overlooked by investors

56
and researchers is that SWFs are deep rooted in their respective political economies of
sponsoring countries. Pistor and Hatton (2011) analyzed the four large SWFs: Kuwait,
Abu Dhabi, Singapore and China to conclude that strategies deployed by management
of these SWFs can be better explained by autonomy – maximization theory. Each of
these four SWFs are controled by political economies of decades of elite families
ruling whose grip on power is attached to the economic fortune of their country and
their ability to balance against any foreign intervention. The establishment of SWF is
to balance the demands of capital to foreign markets / governments and profit sharing
and welfare to their own citizens. Thus, setting of SWF has a major objective of
continuing grip on power and wealth of the sponsoring country for these elite ruling
families. SWFs help in protecting and maximizing their autonomy within the global
financial system and reduce the risks of any turmoil at domestic level within the
country; however, recent uprising in Middle Eastern and North African countries of
Tunisia, Egypt and Libya are the examples that benefits of accumulated wealth were
not shared to citizens of these countries. Under the concept of autonomy maximization
theory, SWFs attempts to maximize the autonomy of the ruling elite over the
management of SWF and within sponsoring country. Thus, SWFs are controlled by
government without any direct beneficiary or liability except reporting and responding
to ministry in government. Many SWFs sponsoring countries do not have democratic
political economies and thus, SWFs are not directly accountable to their citizens.
Internal structures of these SWFs make sure that they are directly accountable and
managed by ruling elite or their trusted stewards. Thus, SWFs first objective is to help
maintain the position and autonomy of ruling elites in the sponsoring country. This was
evident in the analyses of four large SWFs done in their research of SWFs management
and behavior by Pistor and Hatton (2011). Next sections review the literature of SWF
development and management in detail beyond their theoretical roots.

57
2.4 Development of sovereign wealth funds in the last two decades
This section discusses how SWFs have grown into current status of more than US $ 3
trillion from its early stage developments and how trade and regulators view SWFs.
2.4.1 Early SWFs
The SWF is not to be considered as a new phenomenon because the concept of
utilizing execess national income for long term investments is over 60 years old, with
establishment of Kuwait investment authority (KIA) in 1953 and Kiribati Revenue
Equalization Reserve Fund in 1956. The goal of the fund was to ensure that state‘s
population will benefit from revenues of their diminishing resources (Anderson, 2009).
SWF of Kuwait is an example of the commodity funds because of investing surplus oil
revenue, now having approximately US$ 250bn. The two first SWFs (Kuwait and
Kiribati) were set up so that wealth from a finite commodity source can be channelled
wisely with a vision for the future. Thus, the primary goals of the funds‘ establishments
have been reducing the fluctuations in government revenues, countering the boom-bust
cycles of oil and phosphate prices, and building up savings for future generations from
an exhaustible natural resource. The logic and motivating factors behind establishing
these funds have been based on the idea of spending some wealth on current
consumption, some on current investment and yet some saved for future generations
(Hassan, 2009). The ADIA (Abu Dhabi Investment Authority) was established in 1976,
but its foundations date back to the 1960s when Abu Dhabi was under colonial rule and
advisors to royal family managed their investments. Therefore, ADIA has global level
management and investment strategy well before its establishment (Hassan, 2009). The
underlying attribute is the same, which is to invest earnings of exhaustible natural
resources which can bring returns for the next generations to safeguard an existing
regime and to create incrementally the non-oil dependent economy structure
58
(Anderson, 2009; Oman Vision 2020 report). The first few GCC funds have been oil
income based commodity funds; however in 1981, the Singapore launched Global
Investment Corporation (GIC) which was non-commodity based whilst having its
primary aim of getting higher returns from Singapore‘s international trade imbalances.
2.4.2 Trade and regulators’ view of SWF
The owner of a SWF is a ‗sovereign‘ or a state – it is an account for the nation‘s
savings so it has to do with ‗wealth‘ but it is also a ‗fund‘ because it is a basket of
financial instruments or, in short, it could be termed as ―a state repository of wealth‖.
There is a great variety of definitions of SWFs (Hassan, 2009, p. 11) used within the
literature and practice, some of them are as follows:
―Pools of money derived from a country’s reserves, which are set aside for
investment purposes to benefit the country’s economy and citizens. The funding
of SWFs comes from central bank reserves that accumulate as a result of
budget and trade surpluses, and even from revenue generated from exports of
natural resources‖ (Hassan, 2009, p.11 from Investopedia.com, 2007).
―Some governments create special-purpose government funds, usually called
SWFs, to hold assets of the economy for long-term objectives. The funds to be
invested commonly arise from commodity sales, the proceeds of privatizations,
and/or the accumulation of foreign financial assets by the authorities‖ (IMF
Balance of payments and international investment position, www.IMF.org,
March 2008).
―At a most basic level, SWF is a mechanism for moving a country’s savings
from the present to the future. SWF can be ranging from central bank’s section
to being an independent financial corporation‖ (Ang, 2010, p.1-2).

59
There are some common characteristics of the SWFs regardless of the various
definitions. Firstly, more and more the SWFs comprise of ―alternative assets such as
stocks, property, venture fund, private equity fund or hedge fund holdings,
infrastructure assets or other non-bond type financial assets.‖ (Hassan, 2009, p. 11)
The goal is to realise higher returns from these assets as opposed to the low return
environment which has been dominant in the treasury markets (where historically the
official reserves have invested). In order to attain the higher returns, the SWF
managers can take more risks than the private companies‘ managers as the leverage of
SWF is nil as this money comes from government‘s excess reserves and not created by
issuing debt. Therefore, SWF managers can have more aggressive approach towards
profit seeking and make investment for longer term without worrying about depositors.
This is how SWFs are different from private equities, hedge funds and wealth
management banks as they do not have any liabilities or coupon redemptions like
bonds or debentures (Clark and Monk, 2009; Hassan, 2009; Ang, 2010). As a result of
this, SWFs‘ investment strategy has long term outlook with capacity to be resilient for
short term volatility.
In the most general terms, SWF can be described as a surplus capital which is a
national investment tool of its own, considered to be in excess of a country‘s foreign
reserves and thus also managed separately. These excess funds can be used in ways
which have never been common for the managers of foreign reserves. The latter have
very specific usage – typically they can provide short-term currency stabilization and
liquidity management and that has determined, in historical perspective, the preferred
size of a nation‘s foreign exchange reserve. In addition, because there is a need to
provide ready availability in times of crisis or market fluctuation, usually the practice

60
has been to invest foreign reserves in short-term ‗safe‘ markets. When a country
possesses excess monetary holdings, above the foreign reserve requirement, then they
are a surplus which could lead to increasing the currency in circulation, support
consumption, and/or be invested to meet future needs. However, in cases when such
surplus is accumulating faster than it could be used in the economy (without the risk of
currency devaluation, inflation or both), it could become a sovereign wealth fund. The
latter provides a tool for investments which do not have to immediately result in a
profit or could even generate a loss over a short period.
―This makes the sovereign wealth fund a pool of money that can be put back into
international circulation through corporate acquisitions, stock purchases, and even
real-estate speculation‖ (Anderson, 2009, p.14–17).
Consequently, the sovereign wealth fund managers can be the new instrument of
national power, making investments previously limited to hedge-fund managers, and
with the capabilities to acquire, invest and sell in a way which could profoundly affect
a competitor‘s domestic and foreign policies.
The usual accumulators of such excess funds are the oil-producing states but some
non-commodity exporting countries are also making a fortune. For example, in 2006
China had reserve assets which were 12.5 times the size of Beijing‘s short-term foreign
debt; also Japan and Korea ―had roughly twice the reserves required to defend against
a repeat of the 1997-98 Asian financial crisis.‖ Essentially sovereign wealth funds can
be used for risky investments because they supply cash without the need to secure
outside audit, partners, or tangible collateral deposits (Anderson, 2009, p. 14-18). For
examples, ADIA of UAE and GIC of Singapore are among top ten SWFs having assets
worth approximately US$875 bn and US$330 bn in 2007 (Appendix-G).

61
The few large and wealthy multinational companies which already have this option can
hardly compare to the sheer size of some of the sovereign wealth funds. Next section
discusses the importance of such bigger asset base SWFs and their growth in the last
two decades.
2.4.3 Growth of SWFs in the last two decades
SWF in the last decade has grown to a considerable in size where it can influence the
composition and participants in the global capital markets. Mc Kinsey analysts Farrell
et al (2007) suggest that new pool of investors such as GCC funds, central banks from
Asian developing economies, private equities and hedge funds from Middle East
together hold approx. US$ 170 trillion assets at the end of 2007 which may grow
beyond US$ 200 trillion by 2013 which may help strong formation of existing and new
SWFs in coming years (Farrell et al, 2007; Greene and Yeager, 2008). Rise in oil
prices to the level ofUS$150 per barrel during 2002 to 2008 has given total known
liquidity of approx.US$3.4 to 3.8 trillion in SWF as shown in Appendix G.
As one can see in the Appendix G, that SWFs are divided into mainly two sections:
first section of Oil income based SWFs which are GCC funds, Norway, Russia,
Venezuela and Indonesia; and second other non-commodities based funds such as
China and Singapore. Their collective assets are approx. US$ 3.4 trillion; however it is
far less than pension funds - US$21.6 trillion, mutual funds US$19.3 trillion and
insurance companies US$18.5 trillion. This emphasizes less influence of SWFs over
the market movements as compared to other asset classes. But these private capital
markets have continued to grow in recent years, for example private placement of
equities has been increasing at the rate of 60% whereas initial public offerings‘ growth

62
at a rate of 17% since 2002. Bulk of global foreign exchange reserve is still held in
dollars (Gieve, 2008; Greene and Yeager, 2008).
SWFs investments have earned more publicity than profit in recently which has
become a political issue in terms of foreign governments getting control over strategic
assets of an investee country, its economy and markets (Yi-chong, 2009). This went
onto emerged in democratic party primary debate in US presidential campaign between
the then Senators Hilary Clinton, Barack Obama and John Edward on 14th
January,
2008 (www.nytimes.com, 2008). This may overemphasize SWFs as a threat which
may be unnecessary and not advantageous in terms of economic advantages globally
(Kotter and Lel, 2011). Before branding SWF as a negative aspect for an investee
country, it would be necessary to look at their varying investment objectives and
strategies, their existing and long term benefits and to see if present system can be
improved for transparency and accountability (Greene and Yeager, 2008). This
unprecedented growth of SWF can be attributed to following reasons:
- Commodity prices boom and heavy tax on private commodity exporters in
SWF countries
- Accumulation of foreign reserves from current account surpluses
- Fundamental difference from monetary authorities, central banks or private
equity or hedge funds operations (Aizenman and Glick, 2008).
These reasons allow SWF to operate on long term and high risk investments creating
them as separate type of financial institution or industry. This summarily changes their
determinants and influence of global finance which is explained in the next section.

63
Most of the SWF growth is recent; hence there is a greater effort to systematically
generate data. In 1990 fund assets were estimated at US$ 500bn and new suggestions
point that SWFs may reach over US$ 10 trillion in a decade time (Jen, 2007; Hassan,
2009). Much of this growth is due to the rising price of oil and gas, and is
predominantly concentrated in producing nations: Saudi Arabia, Norway, the United
Arab Emirates (particularly Abu Dhabi), Russia, Qatar and Kuwait. However, other
important countries, such as China, have achieved trade surpluses and generated
reserves as a result of their exports.
SWFs establishment from governments around the world has increased dramatically in
the last decade. Analysts have found that out of 20 largest SWFs only seven SWFs
were there prior to 90s (Anderson, 2009). Hassan (2009) points out that 45% of the top
40 SWFs came into existence during 2000 and 2007, while 21% of SWFs were
established during 1990 and 1999. The success and assets of Singapore SWF has made
Korea and China establishing SWFs. India and Japan are considering to launch similar
non-commodity based sovereign wealth funds from their foreign exchange reserves
(Anderson, 2009).
The Asian financial crisis in 1997 which resulted in the collapse of currencies and
created fears about a global economic meltdown, led to a boom in the Asian SWFs
because Asian governments set up pools of funds to protect against currency crisis.
Firstly, it was international institutions which recommended that ―countries have
reserves that should be a multiple of their import bills‖ (Hassan, 2009, p.31). Then,
there was a significant growth in such funds, above the countries‘ immediate needs as a
result of the international trade imbalances. Exchange rates also fuelled the growth as
stronger currency rates for China and other East Asian countries‘ exports reached high

64
levels. Such excess sums of money led to the formation of SWFs which would provide
sponsoring countries the means for diversifying their reserves for asset creation in
terms of foreign investments. Particularly, the Gulf Cooperation Council (GCC)
countries, including Russia, generate resources for their SWFs from oil revenues and
these resources are far above their immediate needs. Regardless of domestic spending
and fiscal requirements, GCC countries managed to save vast sums from oil exports in
last decade when oil price was more than US $ 50 per barrel as anything more than
import bills requirement was utilized for asset accumulation (Hassan, 2009). This
created net private inflows above the official asset accumulation for many Asian and
GCC economies. Here, it is important to note that all SWFs do not have same sources
of fund. As one can see in the Appendix G, top six funds are far ahead of others in
asset base and they control more than 75% total assets owned by all SWFs. Next
section details these SWFs current investment strategies and related performance issues
stemming from their current attempts to grow their asset base as discussed above.
2.5 Investment strategies of SWFs
As defined in the previous sections, SWF is a state controlled investing entity as
contrary to state controlled operating companies which can be categorised based on
their fund sources, investment objectives and perspective of setting up SWF (Greene
and Yeager, 2008). As cited in Bernstein et al (2009), there can be three major
categories of SWF perspectives, i.e. development perspective – broader expansion
objectives with savings collection and long term view of sustainable development,
political perspective – investments made with political agenda or favouring the projects
of political leaders or ministerial decision making or agency perspective – for example
a state owned bank with an idea to maximize community welfare. Their findings of
2662 deals of SWF between 1984 and 2007 suggest that investment strategy differs

65
with ‗who takes decisions‘: political leaders or professional managers. This can even
lead to high or low return before or after investment. Also, it influences the numbers of
investments made within the country or out the country or region in case of GCC
nations. Hence, governance structure can affect the investment strategy, objectives and
performance of the fund.
Megginson et al (2009) claim from their study of 1216 investments made during 1986
to 2007 that average investment is of US$ 55million and over 30% are made in
financial firms. They suggest that there can be two rationales behind SWF investment
patterns and that affecting firm performance and value. If SWF act as passive investors
then recipient firm and SWF both loses the money and value. This is also true in case
of short term buy and hold investments by SWF. On the other hand, if long term and
large stake investments are involved then it helps both SWF and investee firm to derive
value and profitable return leading to growth from it. Therefore, it can be inferred that
better governance and transparency with larger stake involvement is necessary but it
can arise conflicts with minority shareholder and create negative influence in most
cases. There could be reason of SWF picking poor investment opportunities due to
political pressures and that leads to investments blocked in matured or deteriorating
industries with no regulatory framework.
Rose (2008) suggest while supporting this fact, existing regulations induce passive
investor behaviour to SWF which actually reduces the threat of SWF as politically
motivated investors. Passivity may be of two types: one by rule that investors cannot
buy the stake to control the issuers of securities and secondly, SWF may voluntarily do
not take any interest in engaging to management of the firm. In either case, it may
trigger the divestment by SWF in case firm could not perform and deliver the

66
profitable returns. This may turn push – pull effects in the investment patterns of SWF
as they inject the money seeking the opportunity but passivity lead to pull out the
funds. This can lead to the conclusion that SWF as a long term co-share holder is a
better perspective than highly leveraged hedge and private equity fund. In dealing with
this qualitative issues of governance, objectives and investment purpose, SWF have
become trend follower even though having US$ 3.1trillion of wealth accumulation.
Thus, SWF management shall pay at the least equal attention to pure quantitative and
financial measures of asset allocation, profitability and risk – return balance. While
these management tradeoffs happen in decision making within SWF, they fear to
disclose little information of their investment activities (Balding, 2008). This raises the
performance issues of SWF stemming from maintaining a balance between qualitative
and quantitative fund management practices and measures. Also, the performance can
be affected by in country rules and management of SWF by decision makers in
addition to regulatory frameworks and investments controlling laws such as in EU or
USA. These regulations of recipient countries and standards of sponsoring countries
are explained in detail as follows.
They differ from private equities (PE) where funds follow the managerial expertise and
every intricate details of investment receiving company is analysed by PE groups. In
case of SWF, decisions are taken by political leaders and ministers of the government
and only suggested by professional managers. This can have counter effects on the
performance of SWF investments made and management of the rest of financial
reserve. Bernstein et al (2009) found that profit earnings ratios and post-investment
performance of the industries which receive the money differ in both cases where
politicians are involved in the decision making and external managers are involved.
Bernstein et al (2009) analysed 2662 investments deals done during period of 1984 to
2007 by 29 different SWFs in various forms such as acquisitions, venture capital, PE

67
investments and other structured public firms positions. This investment strategy
difference found in their research study can be attributed to capabilities of politicians
and managers in addition to the ultimate goals of SWF as it can be social needs,
economical balance needs or political influence. In this study, it is attempted to analyse
SWFs in all three different perspectives: development, political and company. This
shall enable to provide recommendations comprising investment strategies, new
regulatory reforms and policies to strengthen the SWF system and business process in
case of Oman. Next section provides more detailed overview of these global
perspectives regarding SWF and their management in terms of policy and investment
strategies.
Major characteristics of SWFs investment strategies include being passive investors,
long term fund flow guarantee, no liabilities, minimal FDI component, no high
leverage like PE or Hedge funds and gradually moving towards diversified portfolio.
For example, GCC funds from Qatar and UAE have increased their exposure to PE
group and alterative assets. The following table shows composition and asset allocation
of selected SWFs as of December, 2006.

68
Table 2.3 Composition and asset allocation of SWF investments
Source: Singh (2008)
Focusing on the SWF‘s direct private equity investments is one way of analyzing their
investment strategies since the private equity market has greater information
asymmetries than public markets. Therefore, such an analysis exposes differences
among institutions (Lerner et al, 2009; Bernstein et al, 2009). Bernstein et al (2009)
have analysed such differences in terms of SWFs investment styles and performance;
and focused their analyses on three factors: domestic investment level, equity prices at
the deal time and size of the acquired stakes. As a result, there are six patterns
emerging with regard to SWFs (Bernstein et al, 2009, p.3), which can be summarized
as follows:
i. The high level of domestic and foreign equity prices determines directly the
likelihood of investing home or abroad respectively;

69
ii. Domestic investments happen at lower price-earnings (P/E) ratios when higher
P/E levels are outside mainly in case of Asian and GCC funds while the
opposite is true for the Western funds‘ investments.
iii. Asian and GCC SWFs to a lesser extent experience drop in the P/E ratios of
their domestic investments in a year time whilst their foreign investments see
appreciation and increasing P/E ratios.
iv. When politicians are involved in the governance or decision making, it is likely
to have higher investments domestically as compared decisions of external
managers. Bernstein et al (2009) observed ―trend chasing‖ and ―worse
performance‖ because of ―less sophisticated decision structures within these
funds or outright irrgularities in the investment process due to political or
agency problems‖. The politically motivated investments select industries with
higher P/E ratios.
v. When the variable ―propensity to invest domestically‖ is controlled for,
external managers tend to invest in lower P/E ratio industries whereas
ministerial decisions tend to invest in higher P/E ratio industries.
vi. Since, external managers invested in lower P/E ratio companies, their
investments see higher P/E rations later in the deal as compared to investments
involving politicians.
Bernstein et al (2009) state that what the various accounts by practitioners and
observers suggest is that institutional investors vary substantially in their investment
criteria and sophistication, some concluding that institutions often rely on excessively
rigid criteria or do not have ―a sufficient understanding of key asset classes.‖ The
reasons behind this is, they are connected to inappropriate incentives, e.g. restricted
compensation and autonomy for investment officers (resulting in frequent turnover),

70
choosing safe investments even with modest returns, pressure to invest in locally
sponsored projects even if the social benefits and returns again will be modest. Across
different types of institutional investors one can identify great heterogeneity in
investment strategies and returns (Gompers and Metrick, 2001 and Lerner, et al., 2007
as cited in Bernstein et al, 2009). The examples of Singaporean SWFs investing in
China and India and Norway‘s Government Pension Fund decreasing the shares of
Icelandic banks, show that the choice of certain investment strategies of SWFs, or the
abandonment of particular investment intentions, can be the result of political interests
and geopolitical strategy. Next section details how these strategies and performance
issues of SWF affect them in their role for sponsoring and investee countries.
2.6 The role of SWF for sponsoring and investee countries
This section attempts to explore the role of SWFs can play for sponsoring and investee
countries as they are interwoven with different components such as international trade
or money supply. This review would bring more policy implications and factors
affecting SWFs to the fore.
SWF are part of a tectonic shift of decoupling financial markets where growth is no
longer belongs to OECD (Organization for Economic Co-operation and Development
of 30 developed countries consortium) countries but emerging markets have more to
contribute in the form of investments made by many Middle Eastern and Asian
countries‘ SWF (Pimco, 2008). The figure 2.1 below shows the contribution of
emerging markets and developing countries to global output growth. For example, the
Latin American companies like Cemex, Vale, and Petrobras are actively worldwide
and becoming major influencers in their respective industries with expansion and

71
investments. The trend is followed by companies from Russia, India, China and South
Africa.
Figure 2.1 Developing countries & emerging markets contribution to world GDP
Sources: OECD Development Centre and IMF (2008)
Asian markets were not always on the periphery but they are re-emerging in the
context that India and China were actually contributing more than 40% of world GDP
during 1700 to 1820 then reduced to less than 10% and now again increasing and
already reached to a level of 22% expected to become 32% by 2030. In terms of capital
inflows, emerging markets received US$ 953bn and outflow was US$ 1600bn in 2007
(Santiso, 2008). In 2007 foreigners invested US$ 920bn in US markets, bonds and
govt. securities in which 39% came from emerging market economies. This flurry of
activity is attributed to consolidation of their national wealth from various sources like
commodity revenues or foreign exchange reserves leading social, financial and
economic consolidation. This is proved in figure 2.2 below from rise in the last decade
value and number deals by sovereign wealth fund management.

72
Figure 2.2 SWF deals quantity and value
Source: OECD Development Centre; based on David Marchick, Carlyle Group
Thomson Financial as mentioned in Santiso (2008)
The advantages from these deals can be materialised to both SWF and country
receiving funding only upon positive performance of the businesses. There is obvious
positive outlook on the intervention of SWF investment on businesses such as SWF
involvement can create positive atmosphere to stock market about the firm which is
receiving funds. Research conducted on 166 investment announcements during 1990 –
2009 show that there was no destabilization effects on the markets and companies
whilst SWF acquisition took place after these announcements (Sun et al, 2009). This
proves the positive financial impact of SWF investments in the stock market. For
example, Fotak et al (2008) find positive mean returns of SWF holdings in publicly
traded companies. As far as funds and investments are concerned, behaving same as
other investment vehicles such as private equities, SWF may provide improved
governance and profitability in the acquired holding by acting as monitors at the least.
Some SWF portfolio analyses suggest that they act as economic driven investors
having greater influence than expected on the global capital markets (Balding, 2008).

73
Since, SWFs are not only managed as investment vehicles but are managed by central
reserve banks and their respective finance ministries, as in the case of Oman, these
funds shall be aligned with risk reducing approach to monetary and fiscal policies,
treasury and debt management decisions leading to wide scope of government
operations. Within the country SWF is a key resource safeguarding the economic
progress and foreign currency stabilization but to achieve such a macro-economic
objective, SWF shall operate on the basis of best practices in meeting the challenges
and trade offs in the decision making for investments (Mitchell et al, 2008).
Western countries governments specifically few EU countries and USA were started
worrying about motives of SWF investment and claim that the extent of SWF
acquisitions must be regulated and controlled with full disclosure of investments by
SWF to avoid any catastrophic effects on financial markets as debate continues for
their potential impact on global finances and trade. Western countries may pay
attention to the emergence, progress and development perspective of SWF which
shows the larger section of investment activities by SWF comprise domestic
development issues (Reisen, 2008). This wave of fear in western governments is
possibly generated from the fact that 75% SWF are from Middle East and Asia and
only 15% are from OECD countries. For example, few SWFs have sole agenda of
industrial development in homelands like Malaysia‘s Khazanah (Radhi, 2008). The
debates about western countries‘ fear of low governance, transparency and objectives
of SWF investments have its roots in long standing policy issues such as EU neglecting
Gulf region except its energy needs, market access and security motives (Baabood,
2006). However there is no need to be wary of SWFs for western governments mainly
in EU and USA because improved relations between GCC and EU/USA can bring in
enormous benefits to both regions by sharing their experiences for regional

74
cooperation, economical and political reforms and business interests such as in
education, training and media beyond trade and politics (Baabood, 2009). Also, SWFs
are not only coming from GCC region as that can be seen from their worldwide origins
in table 2.2. Further, the losses made in the banking industry investments amounting to
US$ 31bn by SWFs during 2007 – 2009 are also evidence that there is no need to
spread unnecessary fear of their investments by western governments.
Table 2.2 SWF origin in 2008
Region Number
of SWFs
Total assets in
US$ billions
% of
total
Middle East 7 1533 48
Asia 9 867 27
OECD 10 489 15
Russia& central Asia 4 177 6
Africa 7 109 3
Latin America 5 23 1
Pacific Islands 6 1.2 .04
Total 47 3194
Source: Santiso (2008)
Hence, this poses two major questions for SWFs: how to invest funds for nation‘s
profit? And, if returns are low in OECD countries like what happened in USA banking
industry investments then is it wise enough to invest in short term liquid securities of
industrial countries? Many professionally managed funds have diversified their
investments towards MENASA region (Middle East, North Africa and South Asia)
which shows their major motive is to be development oriented with profit
maximisation for their investments (Summers, 2008).

75
This has happened as OECD countries have really low returns rate, for example as
calculated by a fund manager and cited in Kjaer (2008), the rerun on a dollar invested
in oil for a century long period is just another dollar more by 2005 but the same dollar
can generate 375 dollars return if invested in equities and 5 dollars if in fixed income
instruments. Hence, asset allocation and portfolio management is very important if
SWF want to be a major growth vehicle for their national economies. The simulation
conducted by European Central Bank shows that SWF asset allocation strategies are
more like a capital asset pricing model (CAPM) which is more market capitalization
based rather than liquidity base. This can results into high return – high risks strategies
and fund flow to high GDP growth countries such as Brazil, Russia, India, and China
(BRIC) group. This results into increasing role of SWFs those countries plus money
supply available to riskier businesses rather than low return less risky businesses (Beck
and Fidora, 2008; Balin, 2010). In this slow paced manner, SWFs can bring change to
the economies and market conditions rather than affecting stock markets all of a
sudden. The only issue here is: emerging markets are very volatile, commodity
dependent and exhibit low risk and high return but politically not more stable than
OECD countries. More investments for higher return to emerging markets can crate
need for financial policy restructuring in low and middle income countries of emerging
and developing markets. These fund winning countries shall understand that SWFs are
development and financing institutions with profit and long return motive. Neither
SWF are donating money nor do they have regional development goals like World
Bank. Many SWFs are professionally managed and not by ministers so they are
rational and economic driven investors (Balding 2008; Mitchell et al, 2008).
Apart from this, there is no evidence that SWF have destabilized any market. Because,
western government concerns that SWF holdings in key assets could pose threat to

76
prices, volatility in stock markets and imbalance to complete system. This may not be
true as SWF are small in size compared to other markets and institutional assets. Many
SWF have also adopted professional approach such as Norway uses globally designed
divestment process to avert price and stability pressures. Unlike hedge funds and
private equity groups, SWF do not use any debt or leveraged to raise the finances
which could prove more stabilizing than disturbing to markets. Also, SWF have long
term investment criteria with no liabilities so that they can have longer funds locked-in
period. SWF are more diversified than central banks, have no investors which would
force them to divest, have stable incoming revenue sources, all these in turn allow
SWF to contribute growth and stability in the markets and buffer against commodity
prices‘ volatility (Singh, 2008).
Sir Gieve (2008) in his speech emphasised that SWFs are a result of persistent large
global imbalances and have helped in creating vulnerabilities in the world economic
and financial systems. Major cause of this is SWF and their respective central banks
have started to invest for higher returns and for diversifying their asset allocation. This
actually shall improve global asset allocation but this is possible by increase in long
term investment vision, improved transparency and different approach by recipient
countries to collectively move towards global financial integration instead of new form
of protectionism. Much debate about SWF has focused recently on political concerns
after their steady growth in the last decade and emergence as strong financial vehicles.
Such as, do SWF help pursuing political motives or will resistance to SWF investments
can create protectionism issues.
The above discussion confirms that SWF have a critical and larger role to play in
global finance. Their present size is not considerable compared to other financial
markets. The arguments of political motives, conspiracy and lack of transparency have

77
emerged which can be resolved with co-operation between growing SWFs and
knowledge pool for financing and investments from developed countries such as USA,
UK and Germany (Santiso, 2008). The fact is that SWF help in stabilizing the markets
where they invest and based on the earnings long term higher return in their nations
also.
There are multiple reasons for creating a SWF and it is likely that its creation would
lead to wealth accumulation. One of the primary objectives of the SWF is income
stabilisation, i.e. the SWF can act as a stabiliser for the respective government,
especially with the commodity based funds. Some of the benefits for a domestic
economy are due to the fact that the government can rely on the SWF to smooth out the
discrepancies between the price of a commodity in an international market (which
price may fluctuate) and the needs of domestic spending. For example, when
commodity prices are high, governments can increase funds inflow to their respective
SWFs to reduce the events of an excessive inflation. This increased inflow however
reduces the domestic spending. On the other hand, when commodity prices are low
governments can utilize returns from the increased inflow of SWFs for fiscal purposes
such as to balance budget and provide services to population (Hassan, 2009).
According to Alberola and Serena (2008, p.326) ―SWFs are the result of a policy
action to smooth extreme economic impact—and drastic adjustments—derived from
large exogenous shocks‖.
Hence, according to economic theories SWF setting up is more beneficial as compared
to simple reserve accumulation by central banks (Ang, 2010). The SWF set up can also
benefit income transfer across generations, i.e. there is an inter-temporal effect created
by the SWF. Some of the income which is earned from the sales of commodities or
export earnings can be saved for future generations by placing it into secure assets such

78
as government securities or US treasury bills (Anderson, 2009). Alternatively, some
income can be allocated to different assets by diversifying the portfolio to reduce the
risk for meeting any future pension liabilities (Hassan, 2009). The industry sectors and
regional economies in which SWFs have invested the results tend to be value creation.
Therefore, there are certain benefits from quick and large infusions of liquidity. SWFs
are a stabilising force for sectors and economies because they are long-term investors
which do not have pressures to liquidate their holdings on short-term needs. To have
capital available for the long duration means managers can have recovery time from
short to medium economic downturns. This can have an especially positive effect on
companies with general stability but which may have been experiencing the effects of
an overall economic downturn. Another advantage of the SWFs is that, unlike publicly
listed companies, they do not have extensive processes for disclosure. So, if their
investment committees take a decision, then the SWFs can also react with a quick
decision. Thus, the combination of size and speed in times of market turbulence can
prove to be very beneficial. The recent global credit crunch example has shown how
SWFs can support the capital base of distressed companies in a situation in which even
the important banks were under threat. However, as the crisis deepened, the SWFs had
to step aside and wait for calming of the markets, while the governments via Central
Banks had to interfere and shore up or even nationalise distressed financial institutions.
In general, SWFs are not affected by market volatility as their reserves are not leverage
based whilst having no investor pressure for investments sell off. Hence, SWF as an
investor can support long term stability of investee companies (Hassan, 2009). Also,
the SWFs contribute to the stabilisation of asset prices because of their large and
prompt liquidity. There is a psychological factor when SWFs enter into a market –
when a major firm has a turn around, then other firms in the same sector are positively
affected.

79
The presence of SWFs has the effect of reducing interest rate in the investee countries
since businesses have option of funding from SWFs (Hassan, 2009). The fact of SWFs
can take a longer term view of their investments that enables them to make strategic
bets, and they can accept short-term volatility in return of a long-term gain. SWFs can
protect the costs of borrowing because their investment allows ―the firm soliciting the
investment to not disclose their troubles in public‖ (Hassan, 2009, p. 74-77).
By avoiding public disclosure the company could be saved from a possible downgrade.
Assuming the position of a recipient of SWF funds, its benefit derives from the
potential of having privileged access to the markets of the SWF‘s country. For
example, if Singapore invests in Merrill Lynch, then the latter will also receive the
support of the Singaporean authorities to access the Asian market. Also, after a
substantial investment by Singapore in Merrill Lynch, ―then if Merrill is planning to
locate a hub in the Asia region, there will be natural predisposition to locating it in
Singapore.‖
Thus, the benefits can be two-way, similar to a joint-venture undertaken across markets
– ―one of the benefits is that the outside firm gets access to new markets, along with the
added benefit of getting an infusion of capital‖ (Hassan, 2009, p.74).
SWFs have started to shift their previous two decades old policy of market engagement
through equity funds to the new investment strategy by direct acquisition of stake in
companies for example deals of Qatar Investment Authority in Barclays in 2008 during
credit crisis or deals of Citigroup or Credit Suisse by other GCC SWFs. The benefits of
old policy were more favourable for hedge funds and private equity groups as money
from SWF to their accounts were low cost debts as compared to market rates (Hassan,
2009). During March 2007 to June 2008, SWFs have invested approx. US$ 59bn in
financial institutions such as Citigroup, Barclays, Credit Suisse, Morgan Stanley,
Merrill Lynch and UBS; such a buying spree has resulted in 35% merger and

80
acquisition deals of 2007 accounted for SWF investment deals. The entry into real
estate market was also remarkable as UAE SWF bought 90% of Chrysler building in
New York in July 2008 (Farrell et al, 2008 as cited in Drezner, 2008). This shows the
―explosive growth‖ of SWFs has started raising questions and concerns over their
buying behaviour of strategic assets, regulatory – transparency and geopolitical issues
(Drezner, 2008, p. 115).
Next sections provide detailed view of how these SWFs are being regulated by
investee and sponsoring countries which may hamper their spiralled growth of the last
two decades.
2.7 Effects on SWFs from barriers by investee countries
The rise of the SWFs has provoked security concerns in the US; mainly the issues are
with respect to macro-economic imbalances and diversification of energy supply for
USA. These issues lead one to think about the influence and interdependence of Asia -
Pacific and Middle Eastern countries with USA which is the result of the SWFs
investments (Drezner, 2008).
Ultimately, these investments can have potential negative consequences, for example
adversely influencing the promotion of democracy in the developing world, while also
making global financial co-operation more unstable (Drezner, 2008, p.115-116).
This gives rise to issues related to SWFs such as corporate governance and
transparency of SWFs for western countries; limited investor rights and protectionism
frameworks of recipient countries for SWFs sponsoring countries. The problems with
insufficient transparency are even more acute when coupled with the size and
sovereignty of the SWFs. Anderson (2009) observes that since SWFs are state
extensions and are maximising the country‘s long-term strategy more than profit per
81
se, and it is exactly the emerging strategic pattern of acquisitions which is a cause of
concern (Drezner, 2008). With SWFs the missing ingredient to safeguard against
potential financial misbehaviour is ―counterparty surveillance‖ (Drezner, 2008, p.
118). This is echoed by IMF and other regulatory institutions as well as researchers
(Lyons, 2008). In a country like Norway, there are existent democracy checks (through
National Parliament) on investment strategies; however same cannot be true where
political economy is different and also, standards for governance, legitimacy,
transparency and accountability changes with every SWF, for example Russia and
China SWFs (Monk, 2009; Ang, 2010). There is a strong relationship between
characteristics of SWFs and the political situation (law, democracy, accountability
factors) of that SWF sponsoring country (Pistor and Hatton, 2011). SWFs can also
control recipient country‘s policies and capabilities by gaining control over strategic
assets or infrastructure; or by threatening the divestments. In the recipient countries,
the size of capital for companies and domestic economic interests can increase the
lobbying for SWFs investment deals acceptance. This can block any protectionism
measures from OECD countries to SWF sponsors (Drezner, 2008; Bean, 2010).
However, one can argue about the lack of evidence in the economic coercion and
interdependence literature to prove that SWFs have the capability to influence the
OECD economies because the SWFs must be significantly more powerful at the least
financially, if not technically and politically than their target economy. One of the main
arguments emerges that considering the ambiguous political configurations between
SWF sponsoring countries and the investee countries, it is possible that investee
countries would be reluctant to create policy frameworks and operational barriers that
may require these SWFs to disclose their intention. This is because at some point
liquidity and investments become more important for businesses than political agenda
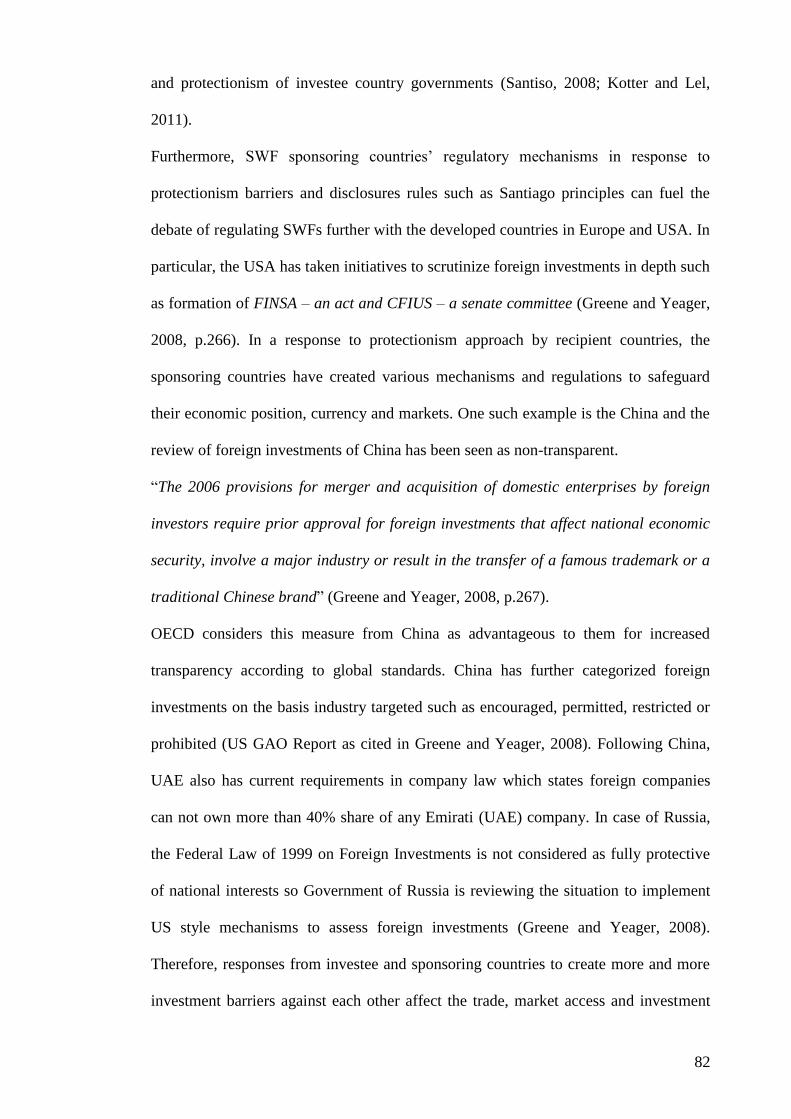
82
and protectionism of investee country governments (Santiso, 2008; Kotter and Lel,
2011).
Furthermore, SWF sponsoring countries‘ regulatory mechanisms in response to
protectionism barriers and disclosures rules such as Santiago principles can fuel the
debate of regulating SWFs further with the developed countries in Europe and USA. In
particular, the USA has taken initiatives to scrutinize foreign investments in depth such
as formation of FINSA – an act and CFIUS – a senate committee (Greene and Yeager,
2008, p.266). In a response to protectionism approach by recipient countries, the
sponsoring countries have created various mechanisms and regulations to safeguard
their economic position, currency and markets. One such example is the China and the
review of foreign investments of China has been seen as non-transparent.
―The 2006 provisions for merger and acquisition of domestic enterprises by foreign
investors require prior approval for foreign investments that affect national economic
security, involve a major industry or result in the transfer of a famous trademark or a
traditional Chinese brand‖ (Greene and Yeager, 2008, p.267).
OECD considers this measure from China as advantageous to them for increased
transparency according to global standards. China has further categorized foreign
investments on the basis industry targeted such as encouraged, permitted, restricted or
prohibited (US GAO Report as cited in Greene and Yeager, 2008). Following China,
UAE also has current requirements in company law which states foreign companies
can not own more than 40% share of any Emirati (UAE) company. In case of Russia,
the Federal Law of 1999 on Foreign Investments is not considered as fully protective
of national interests so Government of Russia is reviewing the situation to implement
US style mechanisms to assess foreign investments (Greene and Yeager, 2008).
Therefore, responses from investee and sponsoring countries to create more and more
investment barriers against each other affect the trade, market access and investment

83
decisions for SWFs and investee companies. This ultimately results into negative
effects on the growth of SWFs.
2.8 Current trends and impacts on the global finance
If one considers the amount in numbers then being it more than US$ 3.5 trillion looks
very much significant; however the assets held by all SWFs collectively is less than 5%
of what is held by other financial segments such as pension funds, hedge funds, mutual
funds and insurance companies and private equities. SWF accounts for less than 2% of
equity and bonds market globally. Morgan Stanley (2007) projections for 2012 by the
fastest rate consideration also do not take SWF beyond 6% of global financial assets.
Since having no commercial liabilities as such like private investors, during the
economic crisis time, SWF have positive effects on markets to reduce the pressure of
liquidity issues. They play vital role as a stabilizer in saving the firms with their
investment at the time of stressed markets (Gieve, 2008).
According to the IMF foreign currency reserve data, the overall share of US dollar as a
foreign reserve currency worldwide has declined from 68.1% to 64% during 2003 to
2007 (Greene and Yeager, 2008; www.imf.org, 2008); still global foreign exchange
reserve (FER) currency is US ($) dollars. The dollars share of FER can decrease more
as money flow into SWF from oil and other commodity exports by MENASA region
economies. Lyons (2007) in his testimony to US senate committee on banking said
that if central banks were to switch reserves to match the countries with which they
have trading accounts, they would require to sell an amount to a level of US$ 1.39
trillion, that is approx. 25% of global FE reserves. This FE reserve accumulation
system has decreased US long term interest rates and rates of investments from petro-
dollars. Also, exporting countries have inflationary pressure. Five out of six GCC

84
countries have their currency reserve pegged to US dollar. Kuwait has started to
diversify its currency portfolio from 2007 to higher yielding rates which could lead to
significant effect on US current account. These facts and figures show that sovereign
wealth is shifting away from US dollar (Greene and Yeager, 2008; Santiso, 2008).
Major numbers of GCC and Asian countries have not limited their investments in
OECD (Organization for Economic Co-operation and Development of 30 developed
countries consortium) countries. The institute of international finance has reported in
2007 that foreign investments of GCC SWFs have become global during 2002 to 2006
as 20% outflow was to Europe and 11% each to MENA and Asian regions. As the
unrest grows in the two forms for SWF, getting branded as politically motivated
investment vehicles from western governments and losing money like US banking
investments in billions during 2007– 09, they tend to find alternative routes of
channelling the money into profitable investments. In doing so, SWFs have started to
shift away from the dollar and also more inclined towards aggressive asset categories.
That shows SWF have started to move investments from low return and government
debt to higher return – high risk assets and to leave the traditional investment style of
fixed and equity deals (Greene and Yeager, 2008). So far, no research study has made
firm conclusion about effects and impacts of SWF on global financial markets but
research shows SWF impact on individual firm performance and it has been debated to
that extent and other governance and investment strategy issues of SWF. These issues
are covered in the next topic of discussion.
2.9 Implications based on the challenges of SWF
The last two decades have seen exponential growth of SWFs from less than US $
500bn in 1990 to current approximate US $ 3500bn; and more large economies like
India and Japan may join the race of developing profitable SWFs. Morgan Stanley
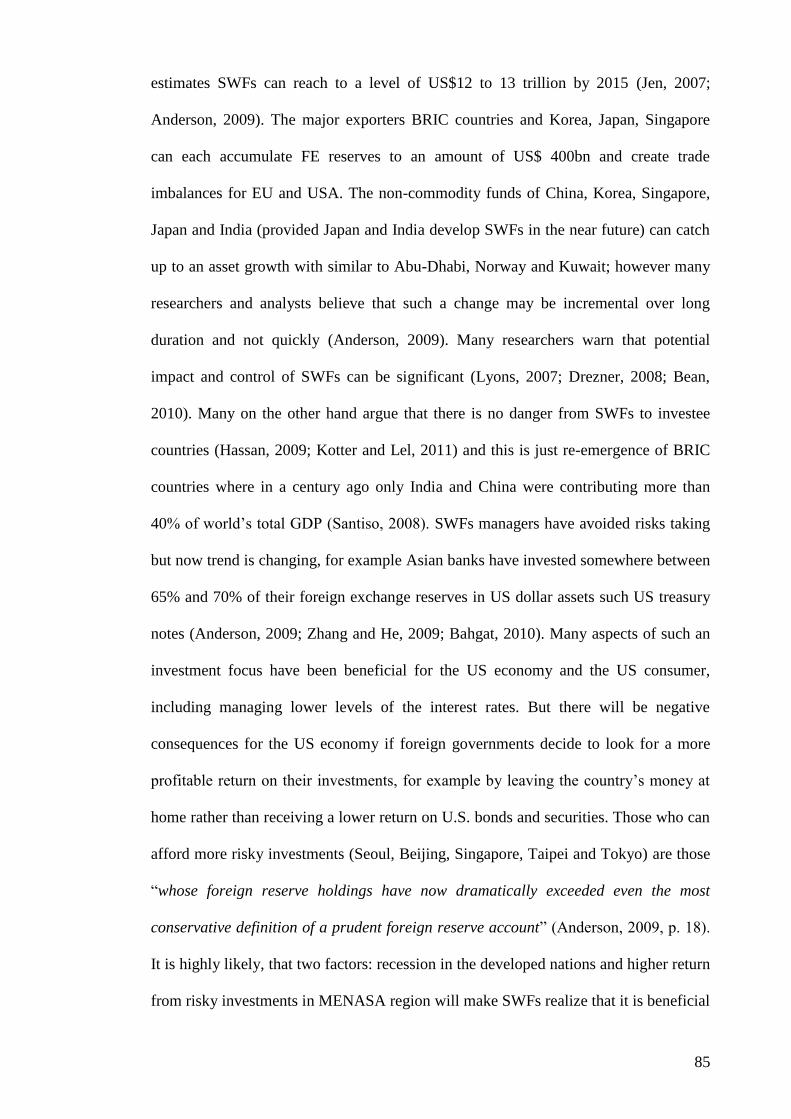
85
estimates SWFs can reach to a level of US$12 to 13 trillion by 2015 (Jen, 2007;
Anderson, 2009). The major exporters BRIC countries and Korea, Japan, Singapore
can each accumulate FE reserves to an amount of US$ 400bn and create trade
imbalances for EU and USA. The non-commodity funds of China, Korea, Singapore,
Japan and India (provided Japan and India develop SWFs in the near future) can catch
up to an asset growth with similar to Abu-Dhabi, Norway and Kuwait; however many
researchers and analysts believe that such a change may be incremental over long
duration and not quickly (Anderson, 2009). Many researchers warn that potential
impact and control of SWFs can be significant (Lyons, 2007; Drezner, 2008; Bean,
2010). Many on the other hand argue that there is no danger from SWFs to investee
countries (Hassan, 2009; Kotter and Lel, 2011) and this is just re-emergence of BRIC
countries where in a century ago only India and China were contributing more than
40% of world‘s total GDP (Santiso, 2008). SWFs managers have avoided risks taking
but now trend is changing, for example Asian banks have invested somewhere between
65% and 70% of their foreign exchange reserves in US dollar assets such US treasury
notes (Anderson, 2009; Zhang and He, 2009; Bahgat, 2010). Many aspects of such an
investment focus have been beneficial for the US economy and the US consumer,
including managing lower levels of the interest rates. But there will be negative
consequences for the US economy if foreign governments decide to look for a more
profitable return on their investments, for example by leaving the country‘s money at
home rather than receiving a lower return on U.S. bonds and securities. Those who can
afford more risky investments (Seoul, Beijing, Singapore, Taipei and Tokyo) are those
―whose foreign reserve holdings have now dramatically exceeded even the most
conservative definition of a prudent foreign reserve account‖ (Anderson, 2009, p. 18).
It is highly likely, that two factors: recession in the developed nations and higher return
from risky investments in MENASA region will make SWFs realize that it is beneficial

86
to invest either at home or restructure their portfolios which are currently dominated
with mainly US treasury notes. China is likely to be the primary beneficiary of the
transition and change in investment patterns as their foreign exchange reserve is more
than US $ 1.5 trillion (Anderson, 2009). Because the oil income based GCC region
SWFs (like their counterparts) do not need to show a return immediately, they can deal
with higher levels of risk by taking a long-term approach to investing. For example,
analysts at the Abu Dhabi Investment Authority justify their 14% allocation of fund‘s
portfolio to emerging markets‘ equities based on their assessment that atleast 33%
global growth in coming years would come from emerging markets. This figure can
even grow according to the current investment patterns of CIC and Temasek Holdings
(Anderson, 2009). Another trend forecasted by the McKinsey Global Institute is the
increased flow of capital between Middle East and Asia which is evident in a growth
rate of 22% during 2001-2005 at cash flow on US $ 15bn in 2006 alone. At this rate it
could reach as high as US$ 300bn by 2020 (Barton and Boer, 2007; Zhang and He,
2009). The Middle Eastern and Asian SWFs are not only seeking markets abroad but
also increasingly keen on investing (and stimulating investment) in the domestic
markets. Some of the choices made by the SWFs have led to policymakers including
the governments of US, France and Germany express concerns about macro and micro
economic impacts of SWFs (Mitchell et al., 2008). With the growth of GCC region
SWFs, developed OECD countries have increased protectionism. However the factual
evidence suggests a different perspective, for example, UK, Japan and Germany are
three leading countries for investments in the USA and 94% of foreign assets in US are
owned by 25 industrialized and democratic OECD member countries (Eizenstat 2006
as cited in Anderson, 2009). Mitchell et al (2008) point out that the exact magnitude of
SWFs impacts is unknown; however SWFs are far smaller than existing currency
stabilization and pension funds. Alberola and Serena (2008) state that SWFs can

87
increasingly contribute to global trade imbalances provided commodity and oil prices
continue to be at high levels. The new SWFs formation may take place as Asian
economies have increasing trade balances and accumulation of foreign exchange
reserves. Such a trend can lead to increased growth for SWFs (Alberola and Serena,
2008). On the other hand, debt economies of developed countries may face higher
costs of financing and negative trade balances due to growth of SWFs (Truman, 2007;
Alberola and Serena, 2008; Gieve, 2008; Anderson, 2009).
Another issue as argued by Truman (2007, 2008) is globalized and developed
economies have private companies larger than government enterprises and government
decision making is supported by private agencies where as in SWFs sponsoring
countries total control is in the hands of government decision making agencies such as
MoF or Central banks. This again leads to management influence on governance,
transparency and accountability on part of SWFs. Drezner (2008) warns that SWFs
may not disrupt macro-economy or security of the country however SWFs can
influence overall governance and co-operation levels in the global financial system and
can diminish the power of developed economies in the coming years. This fear also
may not be true, if one can analyse the political and economic structures of regions
such as Gulf, EU, America and South Asia. These regions require the growth of one
another as they depend of one another for needs such as energy, markets, security,
currency stability through trades and fiscal – monetary balances (Baabood, 2006 and
2009). Thus, it is in the best interests of investee and sponsoring countries to reduce
barriers or protectionisms for SWFs investments and consider SWFs as market friendly
investors whilst helping sponsoring countries‘ governments to implement governance
and transparency reforms.

88
2.10 Implications of SWF investment decisions
This section analyses different views on the positive and negative implications of
SWFs in the global economy, politics and capital markets which may emerge as a
result of their continued growth or divestments from world markets.
a. Because of assured long term and adequate capital into stock markets from SWF,
companies may see higher demand of their stocks and thus increased liquidity in
the market while lower costs of capital for businesses resulting ultimately in the
higher equity prices. Any collective divestments by group of funds and political
instability in SWFs sponsoring countries can create market risk leading to
operational and liquidity risks. SWF growth may increase demands for the
investment banking industry, asset managers and advisors (Chhaochharia and
Laeven, 2009; Balin, 2010).
b. The high return high risk, profit seeking investment strategy by SWF will provide
easy access to capital for riskier businesses and a tougher access to capital for low
return, low risk investment opportunities, for example Government bonds. On a
larger scale, this can skew the global capital distribution to riskier investments
(Balin, 2010).
c. Major funds such as the Abu Dhabi Investment Authority, China and Russia have
ruled out seeking any national security interest or political objective through their
SWFs. And to assure this, these SWFs have opted for professional management
style, hired professionals and crafted their investment strategy for profit seeking
as number one priority. However, their policy of invisible investments and asset
allocations in specific equities have raised concerned within western governments
(Balin, 2010; Pistor and Hatton, 2011).
d. Less opacity in the investments infuses speculative behaviour in the financial
markets. However, if recipient countries and their companies demand compliance

89
to strict disclosure rules then these investments will be eventually visible within
annual reports of investee companies, even if they are not visible in the documents
of the funds. This will attach a price tag to investments‘ announcements while
bringing speculation and increased volatility to stock markets of recipient and
sponsoring countries both (Truman, 2008; Balin, 2010; Dixon and Monk, 2010).
e. The more SWFs grow in their asset size and geographical reach, the more will be
the demand of reciprocity or openness in their transaction which may bring a
crackdown on these funds through number of laws, operational principles and
protectionism tactics from investee countries similar to Santiago Principles in
2008 (Santiso, 2008).
f. Unless there is consideration of making SWFs investments a separate industry
status like private equity or hedge funds, these funds may continue to exert legal,
political and administrative load for regulatory organizations like security and
exchange commissions, central banks and IMF.
g. The impacts on financial market prices and government bond yields generated
from SWFs capital flows is difficult to measure and to quantify. No rigorous
research study has been performed to address these issues. However, the literature
suggests that SWFs can affect the asset prices and exchange rates through changes
in price or risks. These effects developed from SWF demand (e.g. equities) or
supply (e.g. government bonds) can be considerable when the demand curve in
the respective markets is downward-sloping (Beck and Fidora, 2008).
These implications are resulting impacts of SWFs investments in the foreign assets. As
one can see, these implications do not pose any direct security threats but like any other
industry has effects from its investments. These implications can have more profound
effects on the emerging market economies due to lack of proper regulatory frameworks
and many companies requiring capital. In addition to this, effectiveness of these wealth
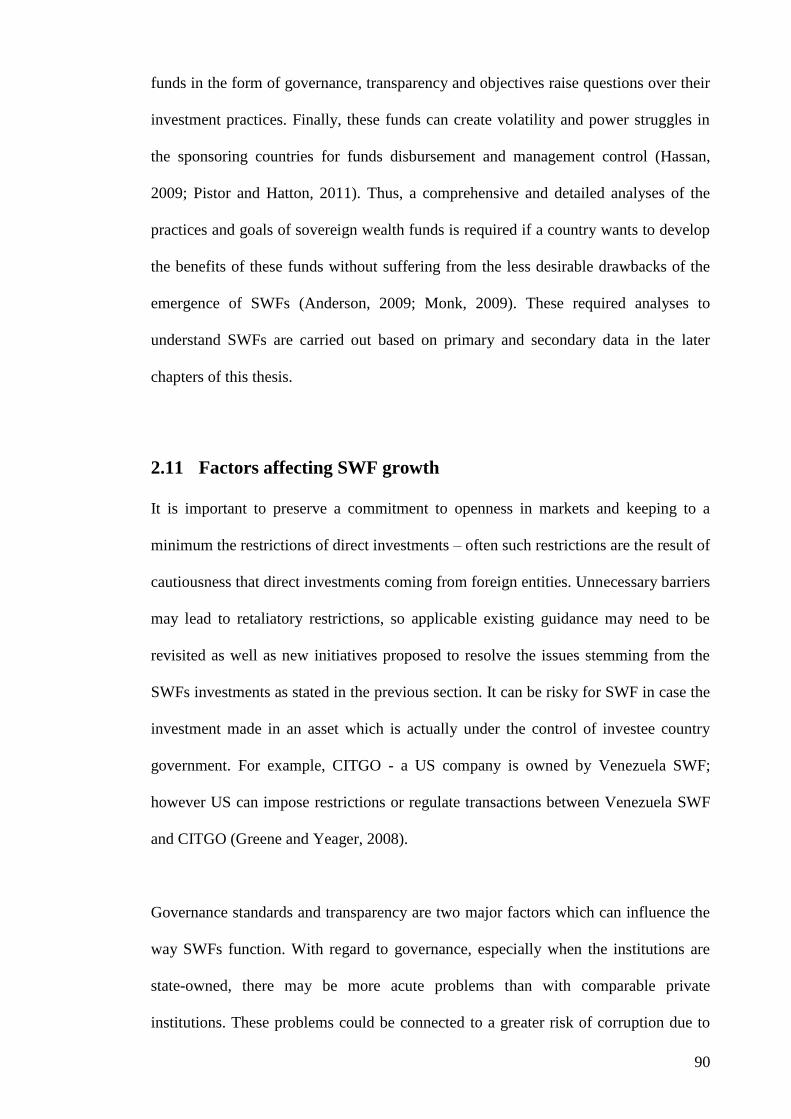
90
funds in the form of governance, transparency and objectives raise questions over their
investment practices. Finally, these funds can create volatility and power struggles in
the sponsoring countries for funds disbursement and management control (Hassan,
2009; Pistor and Hatton, 2011). Thus, a comprehensive and detailed analyses of the
practices and goals of sovereign wealth funds is required if a country wants to develop
the benefits of these funds without suffering from the less desirable drawbacks of the
emergence of SWFs (Anderson, 2009; Monk, 2009). These required analyses to
understand SWFs are carried out based on primary and secondary data in the later
chapters of this thesis.
2.11 Factors affecting SWF growth
It is important to preserve a commitment to openness in markets and keeping to a
minimum the restrictions of direct investments – often such restrictions are the result of
cautiousness that direct investments coming from foreign entities. Unnecessary barriers
may lead to retaliatory restrictions, so applicable existing guidance may need to be
revisited as well as new initiatives proposed to resolve the issues stemming from the
SWFs investments as stated in the previous section. It can be risky for SWF in case the
investment made in an asset which is actually under the control of investee country
government. For example, CITGO - a US company is owned by Venezuela SWF;
however US can impose restrictions or regulate transactions between Venezuela SWF
and CITGO (Greene and Yeager, 2008).
Governance standards and transparency are two major factors which can influence the
way SWFs function. With regard to governance, especially when the institutions are
state-owned, there may be more acute problems than with comparable private
institutions. These problems could be connected to a greater risk of corruption due to

91
lower salaries, problems suggested by agency theory such as trust, legitimacy, (Monk,
2009) excessive control of political elite (Pistor and Hatton, 2011) and lack of
accountability (Truman, 2008). Therefore, addressing these issues with an appropriate
set of policies would be advantageous to both investee and SWF sponsoring countries
to meet their investment deal objectives. As suggested by Greene and Yeager (2008),
these SWFs require specific guidelines to be followed in the matters of responsibilities
allocation within the fund and with stakeholders; investment policy objectives;
governance and disclosure compliance; risk management and their operational
autonomy from political influence. Lack of transparency or any such attribute as
mentioned above can significantly influence the way SWFs make their investment
deals. In turn, these deals and SWFs both may attract scrutiny from financial regulators
and central government administration of investee countries. The issue of transparency
can be resolved by having mechanisms in place for organisational structure,
governance, information disclosure and other institutional procedures (Greene and
Yeager, 2008; Truman, 2008; Santiso, 2008; Anderson, 2009).
On the other hand, even if the best principles of transparency are implemented, is there
any guarantee that it would solve the problem for investee and sponsoring countries?
For example, Norway‘s SWF GPFG invests only if companies are socially responsible
otherwise GPFG divests from them. It does not look for that Norwegian government
can influence companies and social policies in other countries through their SWF for
billions of dollar investments. At the same time in reply to Norway SWF investments,
these investee companies and governments of other countries do not interfere
Norwegian politics (Simms and Tomisawa, 2007 as cited in Anderson, 2009). Thus, it
is difficult to differentiate between best practices in company management and
politically aimed investment agenda. Hence, SWFs‘ transparency does not guarantee

92
promotion of non-political agenda (Anderson, 2009). Zhang and He (2009) provide an
analysis of the internal weaknesses of China investment corporation (CIC) with the
three major factors affecting the fund being vague orientation, mixed investment
strategies and the bureaucratic management. It is unknown who the real shareholder of
the fund is, as well as how much capital it owns, its debt is around US$ 200bn—this
has led to certain disadvantages such restricting its ability to make free long term asset
allocation and create low return – low risk steady income portfolio such as GPFG or
SAMA. Here, the issues of decision making and organisational structures come to the
fore. Mitchell et al (2008) and Bernstein et al (2009) suggest that involvement of
political leaders in decision making tend to influence the two outcomes of the
investments heavily: firstly where the investment would go – domestic or foreign; and
secondly which industry or nation would get priority for the investments. Recent study
by IMF found that most of the GCC funds lack a clear investment strategy and have
large variation of governance, transparency and accountability (Ter-Minassian, 2007 as
cited in Bahgat, 2008). Global markets not only may be affected by investment or
divestment announcements of SWF but also can be affected by SWF decision making
and how they address macro and micro economic indicators at domestic level. Hence,
for the benefits of all involved stakeholders in the SWFs investment transactions, the
improvement is suggested in governance and transparency along with investment
strategy, fiscal measures and organisation structural developments for SWFs (Ilahi,
2007, as cited in Bahgat, 2008). Following such debates in the global financial
markets, both sponsoring and investee countries governments have taken the new
policy initiatives which are reviewed in the next section.

93
2.12 New policy initiatives for SWFs
There have been many initiatives, responses, and policy proposals as a reaction to the
growth and increasing number of SWFs. USA treasury, IMF and OECD are working
together to develop framework for the SWFs to control and assess the influx of foreign
investments by SWFs (Zhang and He, 2009). The objective of this model would be to
enable SWFs to become transparent, predictable, responsible and accountable to their
population and investee countries (Truman, 2008). The response to Santiago principle
was hostile from many large SWFs and CIC of China has hinted absence from the
negotiation for the above said model as well to maximize its own interests (Zhang and
He, 2009).
Singh (2008) explains that voluntary codes for the SWFs by IMF, investee countries
code by OECD, formation of International working group of sovereign wealth funds
(IWG) have resulted into Generally Accepted Principles and Practices (GAPP) of
SWFs known as ‗Santiago principles‘. This set of 24 Santiago Principles covers issues
of laws, governance and investment policies to risk management of SWFs (Singh,
2008; Anderson, 2009). The voluntary nature of the Principles makes their
implementation dependent upon member-countries. There is a proposition to create a
permanent international body for SWFs. The major issues within the Santiago/ GAPP
are transparency, public disclosure, stability and non-commercial objectives of SWFs.
There have been proposals for World trade organisation (WTO) to manage and to
regulate SWFs (Singh, 2008). OECD (2008) report calls for investee countries
authority to be active in stating what is required for their national security, however
report does not say about any instance in which the SWFs acted with objective of
political goals. European Union has also come up with its own standards of
transparency, accountability, asset allocations, investments, size and sources of funds,

94
governance structures, overall objective and risk management policies to be disclosed
by all SWFs (Singh, 2008; Lyons, 2008; Truman, 2008). The USA has created its own
mechanism of FINSA and CFIUS (Anderson, 2009; Hassan, 2009). After the detailed
overview of SWFs in general and their global trends, the next section discusses
importance of SWFs in the GCC region.
2.13 Importance of SWFs in the GCC region
All GCC region SWFs have accumulated assets and foreign exchange reserve from oil
exports. This simply applies that when average oil price is declining in a year, their
foreign investments capacity and liquidity to manage domestic demand reduces. In this
case, their breakeven point of oil exports quantity and oil price increases, sending
shock waves to GCC economies and large projects having vast debt leverage. Thus, it
is not wise for these GCC SWFs to invest in riskier assets for higher return when their
earning is correlated to global growth and oil prices (Setser and Ziemba, 2009). The
big four GCC SWFs are ADIA, SAMA, KIA and QIA. For example, a gap of even few
US dollars per barrel between paying imports and earning oil exports corresponds to
billions of net trade balance increase in GCC region‘s foreign assets, roughly split
evenly between SAMA and other five SWFs of GCC according to their oil exports.
According to historical data, if oil averages US$ 50 per barrel, then GCC region
requires interests and dividend income to support the imports. At US$ 75 oil price per
barrel, they add US$ 140bn and at more than US$ 100 per barrel, GCC region gets
flushing inflow of money. When production and prices fell, the revenues are reduced
very much for GCC region. Thus, any capital spending would require sales of the
assets hold by these SWFs. Following chart shows estimated GCC purchases of foreign
assets at different projected oil prices (Setser and Ziemba, 2009).

95
Source: Setser and Ziemba, 2009
Thus, SWFs are an important source for each country in GCC region to save and to
accumulate the wealth. Therefore, SWF created based on oil income will have their
size of fund and capital availability to invest hinge critically on the price of oil. Due to
lack of transparency, their actual wealth and asset projection is difficult (Seznec,
2008). Production costs, cut and decreased oil prices would create problem for GCC
funds and protectionist measures or total oppose of GCC investments in western
countries such as Europe and USA will take these investors to other countries such as
emerging economies in Asia (Lyons, 2007; Karake-shalhoub, 2008; Monk, 2009).
Hence, SWFs are not only important for GCC region but their importance is worldwide
for every country aiming financial gains and a better economy.

96
2.14 Major inferences from literature review
This section explains the major inferences in terms of theoretical links of SWF to
finance, economics and management as well as lists the major studies enabling the
development of theoretical proposition. The gaps found in the literature are explained
in the next chapter of theoretical framework development.
2.14.1 Theoretical links to SWFs
According to the theoretical linkages of SWFs with existing theories reviewed in
section 2.3 of this chapter, it can be inferred that these theories contain the roots of
SWF development, investment strategy and decision making. To understand how these
theories relates to the sovereign wealth fund, the following figure 2.3 shows a critical
transaction showing all involved stakeholders, their decision making for a standard
investment decision. The figure 2.3 also shows the path of decision making, theoretical
links and factors generated from each link affecting SWF.
The figure 2.3 shows the path of SWF formation to investee companies receiving
money in the centre connected by arrows downwards; whereas from sides this
transaction is connected by arrows explaining where each existing theory can influence
the decision path. The figure also shows in each theory box that which factors affect
this component of the decision path.

97
Figure 2.3 Typical SWF transaction showing links to existing theories and factors
affecting
Citizens of the country crating
and supporting oil / commodity
export
Government accumulating
foreign exchange reserves from
export revenue of trade
Investment recipient companies
and governments create
mechanisms to protect from
negative impacts
Companies in foreign countries
receive the capital as an
investment from a SWF
Employees and Managers work
for a SWF for its growth and
profitability
Government creating a SWF to
create assets and profits on the
invested capital
Agency theory issues
of conflict between
citizens & government
Governance,
transparency
Money supplied into
foreign market meeting
demand for business
capital according to
Economics theory
Investee country laws,
exchange rate,
investment deal
Stewardship theory of
citizens trusting
government as
accurate stewards
Decision making,
structure, policy,
planning
International trade theory
issues of creating reserves
Trade balance, National
security, Economic policy
Financial theories of
return and risk for
allocating capital
Asset allocation,
Investment deal
Resources of human
capital and market
opportunities
Purpose, Asset
allocation, decision
making
Agency theory issues of conflicts
between government – managers;
Stakeholders management and
decision making issues
Decision making, Structure,
Political influence, Governance
Stakeholders‘
management
issues between
SWF and investee
companies
Planning,
decision making

98
The following figure 2.4 reveals that sovereign wealth funds have their roots in the
existing economics, finance, international trade, and management theories. The figure
2.4 also shows that how each existing theory is contributing in the development and
operations of sovereign wealth funds.
Figure 2.4 SWF roots in EFIM Theories
Economics
Demand and
Supply of money,
goods and
technologies
Sovereign Wealth Funds Economics theories have links to effects on SWF and impacts generated from SWF.
Their deals, size and decisions must be reviewed for this.
Financial theories are attached to SWF investment behaviour, decisions, objectives
and utilization of finances. This will help to understand their impacts on global
industries and capital markets.
Trade theories allow to study the motives, structures, laws and political economy
of the SWFs and sponsoring countries.
Management theories enable ones to analyse the organisational structure, decision
making process, governance, managerial behaviour, conflicts and outcome of
actions taken for SWFs.
Finance
Risk – Return,
Portfolio return,
Cost of capital
and Asset
allocation
strategies
International
Trade
Balance of
payment, Currency
stabilization,
Trade and treaties,
Economics theories
help to study the
consequences of
investments deals
leading to supply of
money into markets
and industries of
sponsoring countries.
The profitability and
growth is possible if
return is high and
cost of capital is low
for SWF. This
requires review of
investment behaviour
and assets‘
performance.
Positive trade
balances allow the
foreign exchange
reserves to grow.
Decisions of FDI
impact the local
currency stabilization
and industries. This
is attached to oil or
commodities prices.
Management
Agency theory,
Stewardship theory
Resource based view
and resource
dependency view,
stakeholders,
leadership theory
These theories explain
the behaviours of top
management, hired
managers, their
conflicts, management
style and decision
making. Their analyses
reveal structure,
decisions and outcome
of this behaviour.

99
2.14.2 Inferences about operations of SWFs
Following table 2.4 shows key points relevant to the successful operations of sovereign
wealth funds. These inferences are for all SWFs and not specific for any sponsoring
country. This summarises the literature review about SWFs analyses of investment
deals, strategies, buying behaviour or setting up objectives. These major inferences
help in aspects: firstly, it enables identifying gaps in the literature and secondly,
finalising the factors affecting SWF management.
Table 2.4 Summary from the literature
Authors
and Year
Source Main Inferences Factor affecting
SWF
Kotter and
Lel, 2011
Journal of
financial
economics
SWFs can be defined as passive institutional
investors in terms of their characteristics, effect
on target company‘s performance. SWFs‘
transparency influences investment activities and
their impact on investment recipient company‘s
market value.
Policy, planning,
sponsoring country
laws, governance,
transparency
Sornarajah,
2011 Asian Journal of
International Law Development and quick changes in the laws for
SWFs Sponsoring country
laws, Objectives,
Planning Park and
Estrada,
2011
Asian Journal of
International Law Valuable role of Santiago Principles for SWFs Policy, Planning,
Objectives, Laws
Pistor and
Hatton,
2011
Nellco legal
repository Autonomy maximisation theory explaining
political economy dynamics of established
SWFs
Structure, Purpose,
Governance,
Decision making Thomas and
Chen, 2011 Journal of
contemporary
China
A case of China's Sovereign Wealth Funds:
origins, development, and future roles Sources, objectives,
Heaney et
al, 2011 Australian
Journal of
Management
A case of Temasek holdings, Singapore SWF.
Temasek has a predisposition to invest in firms
that are relatively large and have few director
block holders. The incentive to invest also
increases in firms with lower systematic risk and
with compensation schemes.
Investment strategy,
Asset allocation,
Risk management,
Clark and
Monk, 2010 The Pacific
Review A case of GIC, Singapore. They make case for
SWFs positive aspects during the financial crisis. Governance,
transparency, Less
protectionism Jory and
Hemphill,
2010
Thunderbird
International
Business Review
The positive effects and role of SWFs in global
financial intermediation Planning, Asset
allocation
Balin, 2010 Asian- Pacific
Economic
Literature
The impacts of global financial crisis on SWFs Investment strategy,
Decision making,
Governance

100
Paulson, A.,
2009
The Federal
Reserve Bank of
Chicago Monthly
Research Letter
Long term advantage of both sponsors and
investee countries, Increased transparency can
boost higher returns and confidence to both
parties involved
Governance,
transparency, laws
of investee and
sponsoring
countries Bertstein et
al, 2009; Lerner et
al, 2009
National Bureau
of Economic
Research
SWFs are more likely to invest at home when
domestic equity prices are higher and invest
abroad when foreign prices are higher.
Politicians invest more at home at higher P/E
ratios where as external managers tend to invest
abroad at lower P/E ratios which increases
managerial performance better than politically
motivated investment decisions.
Investment deals,
investment strategy,
sources, purpose,
performance of
SWF
Chhaochhar
ia, V., and
Laeven, L.,
2009,
www.ssrn.com Investment allocation tends to follow countries
with similar culture. Cultural bias in the
investment is pronounced in SWF strategies.
This leads to favourable responses from market
in the form of increase in share prices of
investment recipient companies.
Investment strategy,
profitability, growth
of SWF
Megginson
et al, 2009
www.ssrn.com Conflicts between minority shareholders and
SWFs are reported due to agency costs. SWFs
have abnormal investment patterns and loss
making portfolio.
Planning, decision
making, asset
allocation,
performance of
SWF Baabood,
A., 2006
and 2009
Gulf research
centre
www.grc.ae
Policy implications at regional levels in EU and
GCC can affect the investments and trade and
ultimately impacts the growth of SWFs.
Policy, Laws and
treaties, Trade
balances
Karake-
Shalhub,Z., 2008
Thunderbird
International
Review
Local economies in middle east saved due to
petro dollar reserves, sustainable growth, limited
leverage and limited debt exposure.
Issues in the GCC
region funds:
governance, growth,
profitability Bahgat, G., 2008
International
Affairs, Blackwell
Publications
SWFs are a threat to national security is a
mistaken perception. Voluntary disclosure by
SWFs about their governance, investment
objectives and asset allocations would bring
transparency and resolves the issues to the
advantages of both sponsoring and investee
countries.
National security,
governance,
transparency, asset
allocations,
objectives
Drezner, D.
W., 2008
Journal of
International
Affairs
SWF are at crossroad of high finance and high
politics. SWFs were helpful during economic
crisis. Global markets can be affected if GCC
region become democratic political economies.
Changes in policy, decision making
sophistication and authority decentralization are
key to SWFs growth.
Policy, planning,
purpose, objective,
sources of funds,
governance and
transparency
Lavelle, K
C, 2008
Journal of
International
Affairs
Emergence of SWF enterprises may generate
multiple informal market institutions since every
market and enterprise has different relationship
to the state.
Sponsoring country
laws, objectives
Chesterman
, S., 2008
American
University
International Law
Review
Ethics, complicity and responsibility issues can
set the direction for transparent behaviour and
compliance to law in the context of SWF
operations.
Transparency,
accountability and
laws

101
Hayward,
P., 2008
Banking and
Financial
Services Policy
Report
The development of SWF and emerging
economic trends suggest no threat to financial
and capital markets from these funds.
Investment strategy,
operations,
structure
Blundell-
Wignall et
al, 2008
Financial Market
Trends, OECD Major concerns related to SWFs are objectives,
impacts on exchange rates and asset prices,
governance and transparency.
Objectives,
Governance and
transparency
Portman, C,
2008
Oxford
Economics,
Economic
Outlook.
SWFs are less than 2% of US$ 190 trillion
global total traded securities but they contribute
significantly. Lack of transparency and
investment strategies by most SWFs are worries
to the developed countries.
Transparency,
investee country
laws
Aizenman, J
and Glick,
R, 2008
National Bureau
of Economic
Research
SWF tries to maximise expected utility and opts
for a risky foreign asset. Transparency may
affect level of asset base and investment
independence in decision making.
Transparency,
decision making
Greene, E.
F. and
Yeager, B.
A., 2008
Capital Markets
Law Journal Differences in policies, investment objectives
and responses to these may prove detriment to
cross-border investments and world economy.
Legal aspects,
investee country and
sponsoring laws and
protective
mechanisms Fotak et al,
2008
www.ssrn.com Rapid growth rates and lack of transparency are
issues of great concern. Long term investment
strategies are characterized by political pressures
and size of holdings. Deteriorating firm
performance is noted in 2 years of immediate
equity investments.
Performance of
SWF, investment
strategy, effects of
SWF on investee
companies equity
Mitchell et
al 2008
National Bureau
of Economic
Research
working paper
Comparison between foreign exchange reserve
funds, sovereign wealth funds and public
pension funds suggests that SWFs have different
corporate governance practices and country
specific characteristics. SWFs are large publicly
held pools of assets with increasing role in
global investments.
Purpose, structure
and decision making
of funds;
governance and
political influence
Beck, R.
and Fidora,
M., 2008
European Central
Bank, Euro
System
No impact found on stock markets by SWF
investments or their exits. Traditional CAPM
type investment approach may take higher
inflows to developing and emerging economies
because of problems in return on assets and
investments.
Investment strategy,
asset allocation and
performance of the
fund
Santiso, J,
2008
EMNET working
paper, OECD
Development
centre
10% portfolio allocation by SWFs to developing
economies over next decade can generate
inflows of US$ 1.4 trillion which is higher than
total 30 OECD countries development aid.
Investment strategies seek performance and solid
returns. Sovereign wealth funds (SWFs) can
become sovereign development funds (SDFs).
Investee and
sponsoring country
laws, profitability of
the SWFs
Balding, C.,
2008
www.ssrn.com SWF calculate size by assets across countries – a
misleading concept, till date followed a rational
economic driven investment strategy while
diversifying portfolios based on asset classes and
geographical regions, do not have large impacts
yet on international markets.
Investment deal,
asset allocation,
deal size, operations

102
Gieve, J.,
2008
Dy. Governor of
Financial
Stability Speech
for Bank of
England
Growth of SWF is result of global trade
imbalances. This growth has helped
vulnerabilities of current economic downturns.
SWFs‘ long term investment horizons and asset
allocation efficiency can moderate future
financial downturns. To reduce protectionism by
recipient countries, SWF sponsors shall increase
some transparency.
Trade balances,
governance,
transparency,
protective
mechanisms
Monk, A.
H. B., 2008
www.ssrn.com Several developed countries see SWFs as threat
to their markets. Trust, legitimacy and
governance play crucial role in recasting the
image of SWFs.
Governance,
accountability,
purpose
Truman, E.
M., 2007 Pearson institute
of international
economics
SWF needs greater transparency and
accountability Governance,
Transparency,
Accountability Kern, S., 2007
Deutsche Bank
Research Advantages: liquidity and development of asset
management and investment banking services Implications: market stability, corporate
governance, national interests.
Governance,
National security,
Investment strategy, Objectives
Lyons, G., 2007
Journal of
Management
Research
Investment approach and level of transparency
adopted by SWFs are the key issues deciding
strategic behaviour and further implications to
market and economy.
Governance, Transparency, Accountability, Investee country
laws, National
Security
2.15 Summary
This chapter reviewed the concept and development of sovereign wealth fund and their
links to the existing theories in trade, finance, economics and management. Major
inferences show that each segment of SWF management can be analysed with the help
of existing theories. The literature about SWF management shows that their
investments are beneficial to both sponsoring and investment recipient countries.
Collectively all SWFs are big asset base at US$ 3.5 trillion compared to private equity
and hedge funds industries. Developing SWFs as an industry would be advantageous
to all counties and regulators. The chapter outlines factors affecting SWF and impacts
of SWF on the markets; however their growth is restricted by many external and
internal dimensions which are discussed as factors affecting SWF in detail in the next
chapter.

103
Chapter 3 The conceptual framework
3.1 Introduction
In previous chapters, the research problem and aim of this thesis are defined. Then,
relevant literature was reviewed and evaluated for finding crucial links between
problem and aim of this study. The basis for the theoretical development in this chapter
is the delineation of the research problem and the review of literature in the previous
chapters. The theoretical background of investment strategies, portfolio management,
economic policy formulation, organizational structure and environmental dimensions
such as trade and legal aspects generated from literature are carefully reviewed and are
applied in developing the concept. This chapter proposes the theoretical framework
based on the inferences and gaps established from the literature review within the
domain of sovereign wealth funds management and their links to existing theories. A
set of research hypotheses is proposed for each factor affecting the SWF‘s sustainable
growth as a basis of the initial theoretical research framework. The research framework
mainly comprises factors affecting SWF as independent variables and performance and
success rate of SWF as components of growth of SWF as a final dependent variable.
These variables are then operationalized to measure them with data collection based on
the questionnaires from SWF managers and stakeholders. Since this section deals with
the development of specific framework and hypotheses development, this can be
considered to be the focal theory explanation in the research process according to the
process model concept given by Philips and Pugh (1994).
Following section outlines gaps found in the literature which enables one to propose
the initial theoretical framework which comprises various factors impacting
performance and success rate of any sovereign wealth fund.

104
3.2 Gaps found in the literature
The inferences from academic literature in the previous chapter provide confirmation
to existing theoretical perspectives. This literature inferences support the theoretical
proposition mentioned in the next section whereas this section details the gaps found in
the literature related to management, operations and growth of SWFs. These gaps as a
part of problem have enabled the process of developing the initial theoretical
proposition consisting factors affecting SWF.
1. Measures applied by governments and regulatory organisations are many such as
Santiago principles; however they do not collate with each other to bring the right
factors to the identification for problems faced by investments from sovereign
wealth funds (Epstein and Rose, 2009; Yi-Chong, 2009; Bean, 2010).
2. Although there are numerous studies that have examined oil prices, investment
deals or case studies of sovereign wealth funds; there is no study carried out to test
the impacts of various factors on the growth of SWF. Thus, all such factors found
in literature are not validated through deductive study. This research study aims to
investigate the impacts and relationship of various dimensions on the growth of
SWF. This is a necessary step in taking forward the body of knowledge within the
domain of SWFs which is acknowledged by many notable researchers and they
have explained this task as a further scope in their research (Mitchell et al, 2008;
Truman, 2008; Bernstein et al, 2009; Clark and Monk, 2010).
3. Previous research studies have not been empirical in their testing of various factors
such as governance, transparency, accountability, size, structure. Previous research
found in the literature is mainly the analysis of secondary data or literature about
sovereign wealth funds such as historic investment deals or stock prices of the
companies where in SWFs have invested. Therefore, this study aims to investigate
them based on hypothetico- deductive method using both primary and secondary

105
data through interviews, questionnaire survey, reports and documents (Balding,
2008; Chhaochharia and Laeven, 2009; Balin, 2010).
4. There have been theoretical reflections about asset allocation, return on investment
portfolio and growth of SWF (Gintschel and Scherer, 2008), but actual growth is
rarely measures based on the constructs such as factors which can affect the growth
of SWF. Every third article within existing literature focuses on the arguments
about transparency and governance issues of GCC regions SWFs and their motives;
however, the challenge is to carry out in-depth study of a few SWFs and find out
the why and how of their investment strategies (Lam and Rossi, 2010). Thus,
findings of this study can help potential and current SWF managers, governments
and regulatory agencies to support the growth of SWF as an industry.
5. The SWF phenomenon is new and recently caught the attention of researchers
mainly after 2005 when all SWFs‘ total assets grew beyond US$ 1trillion. Because
of this surge of attention from financial analysts and industry, the available
literature is more of a news analysis rather than scientific or theoretical studies.
There has not been any framework developed in the existing literature to analyse
the factors affecting on the management, growth and performance of SWF in more
than 150 articles and reports reviewed between 2005 and 2011.
6. It is still unclear after decade of research about SWF what investee countries want
and what sponsoring countries want. Which resources apart from capital are
required for either side of the investment deal to create successful bilateral relation
are not known.
7. None of the studies have linked the SWF operations and management to theories
economics, finance, trade and management as done in this study. Hence, this
research study attempts to clarify such inferences from the literature and come up

106
with evidence based recommendations about impacts of various factors on the
growth of SWF.
Based on the above discussed gaps found in the literature, the conceptual framework as
a theoretical proposition is developed for this research study as shown later in the next
section. In the proposed theoretical framework, factors which are the independent
variables has been categorised into two groups of qualitative and quantitative. If there
is any inherent relationship or causality between these independent variables or factors
affecting SWF, then it would emerge during the analyses of primary data.
3.3 Integrative framework of the study
The primary method of any scientific research and investigation is the hypothetico-
deductive method. Theories based on the research processes of induction and deduction
can help researchers to analyse, to explain and to understand the phenomena.
Observations and preliminary information gathering like literature review has helped to
formulate a conceptual proposition as mentioned in figure 3.1 (Saunders et al, 2009).
The testing phase of this theoretical framework about factors affecting SWF is done by
testing the hypotheses made in the proposed framework. Secondary data is also used to
indentify how many of the proposed factors are addressed by Norway and Oman
SWFs. The statistical analyses of results determine whether data supports the
hypotheses made or not.
3.3.1 Legal aspects
Issues raised by OECD or western countries‘ governments for SWF having hidden
political, social and strategic agenda in their recent investments can be assessed based
on their management practices, a qualitative view. Such as standards proposed by

107
World Bank as governance, accountability and investment practices (GAI factors).
Mitchell et al (2008) defined these three set of fundamental principles as: Governance
– a process by which SWF manages an objective of maximising the welfare of and
resolves any conflict among stakeholders; accountability - a process of reporting the
results of governance and disclosing to stakeholders; and investment practices means
having a system in place to develop investments to balance risk and return while giving
attention to liabilities. These GAI factors constitute ‗corporate governance‘ which can
affect the performance and credibility of the sovereign wealth funds (Gompers et al,
2003). Analysts and researchers have commented about lack of transparency in SWF
deals. The transparency for SWF in this context means the disclosure of information
like purpose, results, deals, portfolio of holdings at regular duration. But, disappointing
responses are received from major SWFs as their priority is to maintain commercial
interest first and disclosure second (Rose, 2008). USA style company disclosure laws if
followed for SWFs, then it would make these financial institutions much transparent in
their investment deals (Truman, 2007). Better corporate governance can lead to
increased performance and valuation of the company which can be applied to SWF in
the form of a company perspective. Also, in the countries where ministers have more
influence than managers, the legal aspects are proven to be weakened during decision
making against the forces of bureaucracy (Klapper and Love, 2004). Call for strong
corporate governance and SWF management practices based on structure, governance,
transparency, accountability and behaviour is argued by Carmichael and Palacios
(2003) and Truman (2008). Many such research studies examining policies of
transparency and accountability have argued that any improvement in financial
disclosure and reporting system can enhance the performance of the organization and
protect the investor interests. As a main finding for this variable, ‗legal aspects‘ of

108
SWF can be divided into three major dimensions of governance, transparency and
accountability. Their hypotheses can be defined as follows.
H1a: The better governance increases the growth of SWF.
H1b: More transparency provides more confidence from investment recipients
leading to higher growth prospects.
H1c: More accountability towards investee and sponsoring countries creates better
system of managing SWF thus creating favourable conditions for growth of SWF.
3.3.2 Investee country laws
In addition to concerns raised over political view and transparency of the recent surge
in SWF investment deals in US, EU and OECD countries, these recipient countries
have formulated various laws for sovereign investments and foreign direct investment
citing the reasons of maintaining their security of the economy and the national
sovereignty. Control mechanisms such as voting rights, board involvement, deal size,
investment period and announcement regulations are very popular among investee
countries companies. Investment barriers and disclosures laws are formed as part of
government initiatives such as: foreign investment and national security act (FINSA)
by USA in 2007; committee on foreign investment in the USA (CFIUS) overseeing
FINSA, foreign investment law in 1996 by France; foreign exchange and foreign trade
control law by Japan allowing to block more than 10% investment by any SWF and
Germany‘s foreign trade and payments act (Greene and Yeager, 2008).
Such barriers until accepted by SWF sponsoring countries can have negative effects on
SWF investments. For example, in a mixed response to such rules and concerns, few
SWFs have started to shift their investment to MENASA region preferring higher risk
for higher returns as these regions have commodity based growth. Unless there is a

109
common consensus over these mechanisms, barriers and laws over concerns of national
and economic securities, there may not be a sign of positive effects on investment
growth but it can increase the distance between investee and sponsoring countries trade
relations.
H2: National security concerns tend to increase investment barriers and control
mechanisms’ negative influence over the growth of SWF.
3.3.3 Environmental dimensions
Environmental forces such as competition between many SWFs, confidence of
investee countries and trade balances may prove bigger than laws and investment
barriers mechanisms. Flow of capital and currency adjustments from surpluses to
deficits have always proved to have huge impacts on world financial system and the
global economy. For example, countries with large deficits can have rapid reversal of
capital flows. Same way, large foreign exchange flows into the country are not easy to
sterilise. This can contribute to build up of foreign reserve in the large amounts but also
the increase in the inflationary pressures (Gieve, 2008). This is just the effect of trade
imbalance and increasing reserves. Other issues like competition between SWF can
affect the deal terms, size, investment duration or any other terms of agreement on
investments. Positive effects of such deals can lead to increased bilateral trade and
even agreements. Geographical location of the country like Oman at the mouth of the
gulf and achievement of higher global ranking in peace, stability and reduced
corruption compared to other countries can increase confidence worldwide for the
country and SWF as a responsible investment vehicle. Hence, major dimensions of
environmental forces can play major role in investment practices and strategies of SWF
management. Hypothesis regarding very important dimension of trade balance can be
stated as:
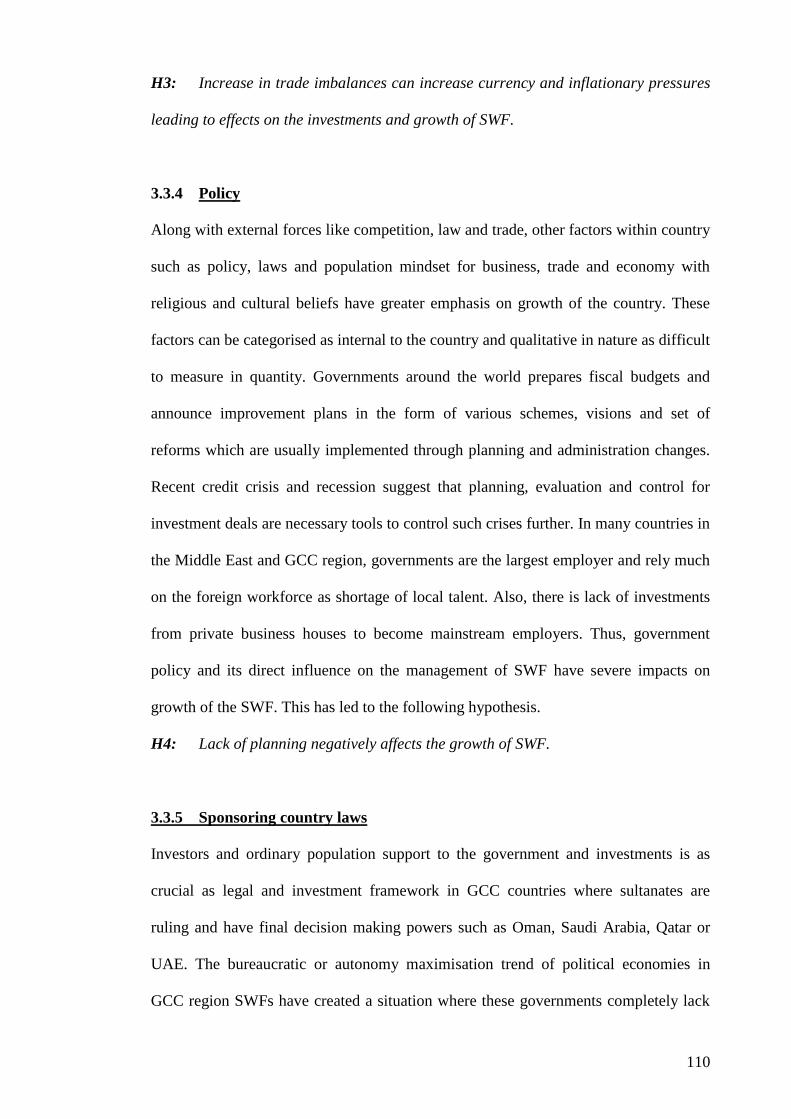
110
H3: Increase in trade imbalances can increase currency and inflationary pressures
leading to effects on the investments and growth of SWF.
3.3.4 Policy
Along with external forces like competition, law and trade, other factors within country
such as policy, laws and population mindset for business, trade and economy with
religious and cultural beliefs have greater emphasis on growth of the country. These
factors can be categorised as internal to the country and qualitative in nature as difficult
to measure in quantity. Governments around the world prepares fiscal budgets and
announce improvement plans in the form of various schemes, visions and set of
reforms which are usually implemented through planning and administration changes.
Recent credit crisis and recession suggest that planning, evaluation and control for
investment deals are necessary tools to control such crises further. In many countries in
the Middle East and GCC region, governments are the largest employer and rely much
on the foreign workforce as shortage of local talent. Also, there is lack of investments
from private business houses to become mainstream employers. Thus, government
policy and its direct influence on the management of SWF have severe impacts on
growth of the SWF. This has led to the following hypothesis.
H4: Lack of planning negatively affects the growth of SWF.
3.3.5 Sponsoring country laws
Investors and ordinary population support to the government and investments is as
crucial as legal and investment framework in GCC countries where sultanates are
ruling and have final decision making powers such as Oman, Saudi Arabia, Qatar or
UAE. The bureaucratic or autonomy maximisation trend of political economies in
GCC region SWFs have created a situation where these governments completely lack

111
any governance, transparency, policy and laws for their respective SWFs. Therefore,
when these countries responded to the demand of USA and other OECD countries for
more transparency in SWF investments, these SWFs have provided mixed responses in
terms of having own legal mechanisms or shifting their assets allocation to other higher
return but high risk investment projects (Santiso, 2008). For example, China, Russia
and UAE which are in top 10 SWFs, each of them have created its own framework
which needs prior approval for every FDI transaction. For example, China revised its
‗catalogue‘ in November 2007 for industry investment guidance and their 2006 act for
merger and acquisition process; Russia has prepared 1999 federal law of foreign
investment; and UAE has 40% limit of foreign company ownership in local companies
(Greene and Yeager, 2008). These laws are response to developed countries‘ concerns
over national and economic securities because of these SWFs‘ growth and political
stability. Not only size and amount of deals worry the western governments but level
of secrecy and accountability matter more. Analysing the top 22 SWFs, Lyons (2007)
found that only US, Canada, Singapore, Malaysia and Norway have high level of
transparency whereas GCC countries SWF have very low level of transparency.
Oman‘s SWF has the lowest level of transparency with other funds such as Brunei,
ADIA, Kuwait, Taiwan and Venezuela. Oman‘s SWF approach is also much
conventional compared to UAE, Qatar, Singapore and China‘s strategic approach. This
can have large impact on Oman‘s own resources allocation, protectionism and market
dynamics within country and raises questions about the need of financial and political
stability. The government of Oman in such a scenario shall take positive stance on
reforms and reduce the bureaucracy and provide the right frame of investment and
legal aspects leading to political, financial and national stability. This can directly
affect SWF as it is much clear with presence of such mechanism that where should

112
money flow, how much and when. Thus, following hypotheses can be defined for the
objectives of SWF sponsoring countries.
H5: Political objectives can affect the transparency and;thus treatment of SWF by
investee countries which can affect the growth of SWF.
3.3.6 Structure
Apart from set of qualitative factors in and out of the country, SWF itself as an entity
have complex issues, start from the purpose of setting up SWF to the final decision
making expertise and usage of sophisticated tools. Since, these are the factors which
can be easily categorised and measured in numbers, they are considered quantifiable.
As known from the detailed literature review about SWF, the structure of the SWF
consists of its purpose of setting up, its ownership, command or hierarchy chain,
sources of input funds and objective of utilization of funds. As Lyons (2007) said GCC
region SWFs falls into the category of much conventional, very less strategic approach
and very low transparency approach funds. This categorization allow one to think
about who influences these SWFs, what is the purpose of setting up SWF. On one side,
GCC region governments attempt to create non-oil dependent economies and on the
other hand, the same government capitalizes maximum benefits from the oil and gas
prices and demand as exporters. This revenue is again used to fund SWFs‘ multi-
billion investment deals. Therefore as argued by Singh (2008) and Bernstein et al
(2009), the key factors in the successful management practices of SWF is their
purpose, objective and decision making ownership. Thus, basic structure of SWF sets
the direction of remaining aspects of managing SWF.
H6: A SWF should have a clear purpose which enables more efficient and
transparent management, positively affecting the growth of the SWF.
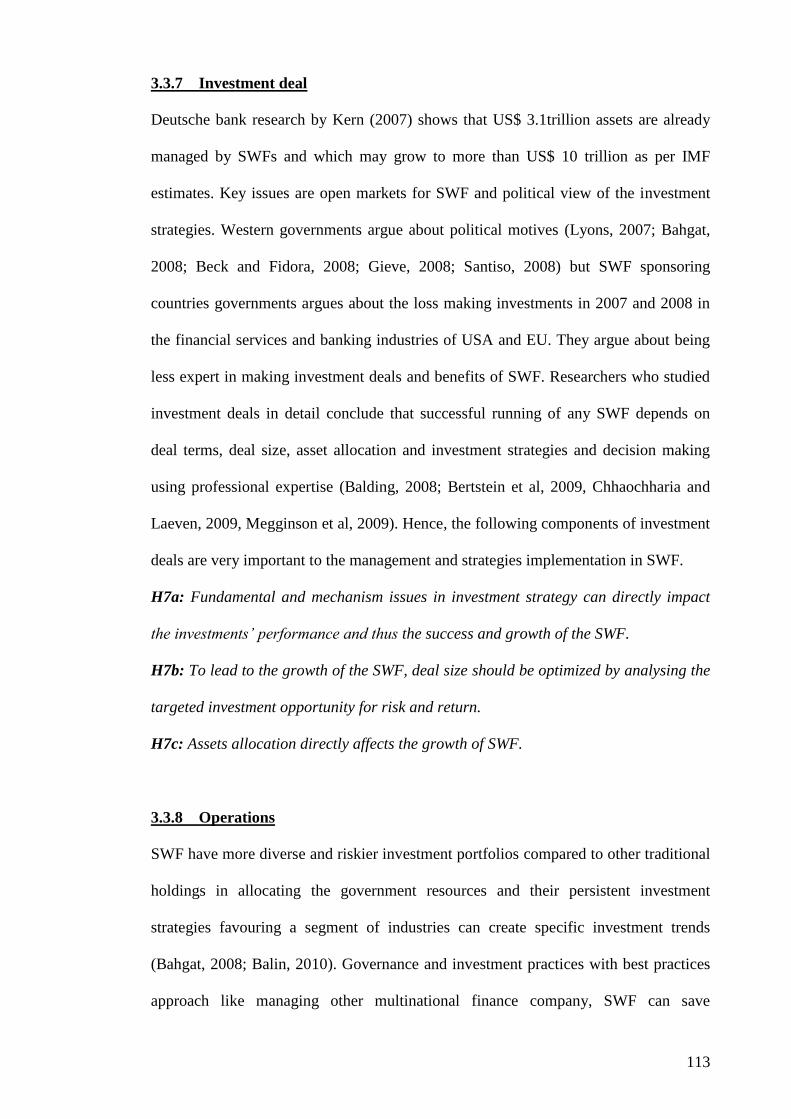
113
3.3.7 Investment deal
Deutsche bank research by Kern (2007) shows that US$ 3.1trillion assets are already
managed by SWFs and which may grow to more than US$ 10 trillion as per IMF
estimates. Key issues are open markets for SWF and political view of the investment
strategies. Western governments argue about political motives (Lyons, 2007; Bahgat,
2008; Beck and Fidora, 2008; Gieve, 2008; Santiso, 2008) but SWF sponsoring
countries governments argues about the loss making investments in 2007 and 2008 in
the financial services and banking industries of USA and EU. They argue about being
less expert in making investment deals and benefits of SWF. Researchers who studied
investment deals in detail conclude that successful running of any SWF depends on
deal terms, deal size, asset allocation and investment strategies and decision making
using professional expertise (Balding, 2008; Bertstein et al, 2009, Chhaochharia and
Laeven, 2009, Megginson et al, 2009). Hence, the following components of investment
deals are very important to the management and strategies implementation in SWF.
H7a: Fundamental and mechanism issues in investment strategy can directly impact
the investments’ performance and thus the success and growth of the SWF.
H7b: To lead to the growth of the SWF, deal size should be optimized by analysing the
targeted investment opportunity for risk and return.
H7c: Assets allocation directly affects the growth of SWF.
3.3.8 Operations
SWF have more diverse and riskier investment portfolios compared to other traditional
holdings in allocating the government resources and their persistent investment
strategies favouring a segment of industries can create specific investment trends
(Bahgat, 2008; Balin, 2010). Governance and investment practices with best practices
approach like managing other multinational finance company, SWF can save

114
themselves from growth decline and political interference (Mitchell et al, 2008). Lack
of knowledge, skills and investment expertise can be developed between investee and
SWF sponsoring countries with co-operation and common legal framework worldwide
(Greene and Yeager, 2008; Santiso, 2008). Lack of system, tools and professional
manager‘s utilization can be major barriers in the success of SWF (Zhang and He,
2009). Thus, any operational weakness can reduce the efficiency of investment strategy
and the effectiveness of overall growth of SWF. Therefore, following hypothesis is
formulated.
H8: Use of expert knowledge systems and research in the decision making process
prior to deal finalization will result in successful deals and increased investment
opportunities resulting in the growth of SWF.
3.3.9 Growth of SWF
In the last decade many research studies have attempted to study the concept of
sovereign wealth funds, however these studies have not analysed the sustainable
growth of SWFs as a dependent variable. Two basic components for any SWF to grow
are: first profitability or performance of portfolio or investments made and second, the
worldwide acceptance and image of the particular SWF so that it can attract investment
opportunities. Thus, investment performance and success rate of SWF are critical for
an overall sustainable growth of SWF. In this research study, relationships between all
independent variables - factors affecting and this dependent variable of growth of SWF
are analysed. The growth of SWF is measured in two components: investment
performance and success rate of SWF.
The measures obtained from literature for investment performance are policy, fund‘s
benchmarking with other funds, development, divergence, economic contribution of

115
fiscal issues and overall rate of return achieved. The measures obtained from literature
for success rate of fund are qualitative in nature or non-financial as they lead to the
overall image, acceptance and development prospects of the SWF. These measures for
success rate include talent, population‘s integration, trade decisions, consumer markets
availability and any increase in governance and transparency, laws and regulations
reforms. Both components‘ measures are backed up by research studies which
analysed SWFs for different variables such as China SWF by Zhang and He (2009); all
global SWFs by Lyons (2007), Truman (2008) and Anderson (2009); OECD study of
SWFs by Santioso (2008); A case of Abu Dhabi SWF by Abdelal (2009); Norway
SWF by Caner and Grennes (2010); A case of Singapore‘s SWF - Temasek Holdings
by Clark and Monk (2010) and Heany et al (2011); Big four – Kuwait, Abu-Dhabi,
Singapore and China SWFs by Pistor and Hatton (2011). The above mentioned eight
factors (independent variables) affecting SWFs are divided in the following framework
based on whether they are quantifiable or not, thus categorizing them into quantitative
or qualitative group. The dependent variable is sustainable growth of SWF.

116
Figure 3.1 Initial theoretical proposition for Sovereign Wealth Funds
Source: Inferences from and Gaps in the Literature
Major factors are conceptualized as independent variables while defining hypotheses
and proposing the initial theoretical framework. This hypothesized theoretical
proposition is then operationally defined to measure these variables. Only upon
defining their measures through indicators, one can measure the strength of
relationship between independent and dependent variables and their statistical results
lead one to test the developed hypotheses.
Strategic Restructuring Plan
Required Long Term Economic policy
New investment policy & regulations
Performance Benchmarking for
Wealth Funds
Creation of human capital advantage
Sustainable Growth of SWF from
Investment Performance and Success rate of the
fund
QUALITATIVE Legal aspects (H1)
Governance
Transparency
Accountability Investee country laws (H2)
National Security Environmental dimensions (H3)
Trade Balances Policy (H4)
Lack of Planning Sponsoring country laws (H5)
Political Objectives
QUANTITATIVE Structure (H6)
Purpose Investment deal (H7)
Investment strategy
Deal size
Asset Allocation Operations (H8)
Decision Making

117
3.4 Hypothesized theoretical proposition
The hypothesised model for this research study is shown below according to the
sequence of the hypotheses. The proposed framework is divided into three sements as
explained below for the ease of understanding. The arrows depict inter-relationships
between these constructs; and primary data responses in the form of questionnaires will
be analysed to test these hypothesised relationships.
Figure 3.2 hypothesises direct influence of first set of qualitative factors such as
governance, accountability, investee country laws and trade balances on the growth of
SWF which are considered as independent variables. Research hypotheses H1 – H3
suggest that dimensions such as legal aspects, laws and environmental forces can
influence the decision making within the SWF. Thus, these variables will have direct
effects on the growth of the fund. This set of hypotheses H1 – H3 assumes that there is
positive relationship between increase in governance, transparency, accountability and
compliance to laws, ultimately resulting in higher growth of SWF.
Figure 3.2 Impacts of qualitative factors on SWFs
Figure 3.3 hypothesises an association between the 2nd
set of qualitative factors of
policy and laws of SWF sponsoring countries to country‘s SWF. Research hypotheses
H4 – H5 suggest that dimensions such as planning, policies and objectives of setting up
QUALITATIVE Legal aspects
Governance
Transparency
Accountability Investee country laws
National Security Environmental dimensions
Trade Balances
H1 to H3
Sustainable Growth of SWF in terms of
Investment Performance and
Success rate of the fund

118
SWF by government of sponsoring countries can affect the dimensions of the
sustainable growth of SWF. This set of hypotheses H4 to H5 assumes that there is
positive relationship between independent variables of better policies and appropriate
planning and investments performance and success rate of the fund in terms of size and
credibility.
Figure 3.3 Impacts of qualitative factors on SWF
Figure 3.4 hypothesises an association between the quantitative factors of structure,
decision making and investment deals of SWF to the growth of SWF. Research
hypotheses H6 – H8 suggest that dimensions such as quantitative factors have positive
impacts on performance and overall success of SWF and thus on the growth of SWF.
Figure 3.4 Impacts of quantitative factors on SWF
deal
QUALITATIVE Policy
Lack of Planning Sponsoring country laws
Political Objectives
H4 to H5
QUANTITATIVE Structure
Purpose Investment deal
Investment strategy
Deal Size
Asset Allocation Operations
Decision Making
H6 to H8
Sustainable Growth of SWF in terms of
Investment Performance and
Success rate of the fund
Sustainable Growth of SWF in terms of
Investment Performance and
Success rate of the fund

119
3.5 Operationalization of variables
The process of operationalizing variables refers to the concept where these variables
can be directly or indirectly measured. Concepts are the building blocks of the
theoretical framework and research is conducted around them. Once measured,
concepts provide the relationship and meaningful information between variables.
Measurement in the analytical study such as this one becomes necessary in quantitative
techniques because to delineate fine differences between the different characteristics in
question; to provide a consistent device for analysing the distinctions between patterns
and to create the basis for precise estimation of the degree of relationship between
variables and concepts used (Neuman, 2006; Bryman and Bell, 2007). Indicators are
then employed through number of questions to measure the concept directly or
indirectly depending largely on the qualitative (perceptual nature) or quantitative
(numbered nature) type of the concept. To measure a concept one can utilize as many
indicators as possible to extract the exact meaning or quantity of the strength of
variable (Neuman, 2006; Bryman and Bell, 2007).
In this framework, factors are already grouped as qualitative or quantitative in nature
which makes it easy to apply measures to them. Selection of these factors and their
dimensional concepts are justified with supporting evidences from literature citing
required references and hence, not replicated again here in the discussion. Table 3.2
provide the operationalization details about indicators and scales applied in case of
each factor and related hypothesis based on the conceptual framework in figure 3.1 and
the questionnaire (Appendix F).

120
Table 3.2 Operationalization details of framework
Factor affecting
SWF
Hypothesis
number
Dimension(s) Type of Indicator(s) Scale applied
Legal aspects
H1 Governance
Transparency
Accountability
Perceptual questions Likert
1= strongly disagree
TO
7 = strongly agree
Investee country
laws H2 National security
Perceptual questions Likert
1= strongly disagree
TO
7 = strongly agree
Environmental
dimensions
H3 Trade balances
Perceptual questions Likert
1= strongly disagree
TO
7 = strongly agree
Policy
H4 Lack of planning
Perceptual questions Likert
1= strongly disagree
TO
7 = strongly agree
Sponsoring
country laws H5 Political stability
Perceptual questions Likert
1= strongly disagree
TO
7 = strongly agree
Structure
H6 Purpose of SWF
Direct questions and
Perceptual inquiry
Likert
1= strongly disagree
TO
7 = strongly agree
Investment deal
H7 Investment
Strategy
Deal Size
Asset allocation
Direct questions and
Perceptual inquiry
Likert
1= strongly disagree
TO
7 = strongly agree
Operations
H8 Decision making
Direct questions and
Perceptual inquiry
Yes / No measure
And
1 to7 Likert scale
Source: Neuman, 2006; Bryman and Bell, 2007; Saunders et al, 2009
3.5 Socio-economic factors
Apart from the eight independent variables or factors affecting shown in the conceptual
framework, there is one more category of factors that is social and economical factors
within the sponsoring countries. Literature in social science, human resource
management, economics and business culture has proven that such factors can affect
the way business is carried out. Since these are proven concepts in the literature, they
are not included as hypotheses in the framework. However, top management‘s

121
interviews may reveal the necessary information regarding these factors and their
effects. Such factors may not seem affecting SWF directly but these factors allow SWF
investments to be successful when made in the projects within the sponsoring country.
Also, changes at such root level allow country to realise benefits in the long term and
increases investee country confidence about national development and economic
growth in attracting foreign investments. Hence, these socio-economic dimensions are
critical to the success of in-country investment strategy of SWF and outlook of the
development to foreign countries. For example, culture and religious beliefs can lead
to social cohesion and harmony which can increase confidence in business. Business
traditions like Islamic finance give more opportunities to local population to come
forward with innovative investment opportunities thus opening avenues for SWF.
Hence, considering this context of factors actually critical for SWF, only eight factors
are accounted in the framework.
3.6 Conclusion
This chapter has detailed the conceptual theoretical proposition about which factors
can affect the most critically to sustainable growth of any SWF. The developed
hypotheses about each factor and its operationalization are explained in detail. The
next chapter would describe the research methodology selected and applied in this
research study.

122
Chapter 4 Research methodology
4.1 Introduction
This chapter describes the selection of research methods and the reasoning for adopting
these methods. The chapter applies the focus of sovereign wealth fund, research
questions, objectives defined in chapter one and developed hypotheses in the previous
chapter as a basis to select the research methods. Main components of the research
methodology selected are research philosophy, research approach, research strategy
and research design comprising sampling, data collection and data analysis methods
within the scope of this research study. Therefore, this section is data theory
component of the research process model given by Philips and Pugh (1994). It has
been has attempted to limit the effects of errors, biases and limitations and to maintain
the research ethics protocol during the entire study. Next sections in the chapter explain
these features in detail.
4.2 Research objectives
The previous chapter of the proposed conceptual framework mentioned the major
factors affecting the SWF. The main aim of analysing these factors and strength of
their relationship with dependent variables of performance and success rate of
sovereign wealth fund is to find out the remedial measures in terms of which factors to
be addressed first by the SWFs to improve their growth prospects. In doing so, the
proposed initial framework has been conceptualized as variables of two categories,
qualitative or quantitative. Thus, central theme of this research and research objectives
enable one to choose an appropriate stance of how to carry out the research and
applying which methods. The following sections describe details about the
methodological approach adopted in this thesis.

123
4.3 Research philosophy and approach
This section provides the rationale for using ‗interpretivism‘ and ‗positivism‘ research
philosophies and a mixed research approach combining: ‗inductive‘ study through
qualitative analysis of secondary data, interviews, and ‗deductive‘ study using
quantitative analysis of data obtained through questionnaires (Saunders et al, 2009).
Literature review has examined various factors affecting growth of sovereign wealth
funds which revealed that little research has been carried out in terms of both
qualitative and quantitative variables in a specific SWF context. Thus, indepth analyses
of academic literature and industry data about SWFs led to the conceptual framework
as proposed in the previous chapter three of this thesis. These qualitative analyses and
formation of conceptual framework suggest that interpretation and meanings are
applied to build the proposition. This process is closely matches the components and
application of interpretivism philosophy and an inductive research approach (Neuman,
2006).
In addition to this, mainly research philosophy depends upon the way it is attempted to
address the research problem such as development, refinement, extension or testing of
theories (Easterby-Smith et al, 2009). This study is about the development and testing
of the conceptual framework consisting growth of SWF and factors affecting it. The
acceptable standards and views of every research make the methodology and research
process distinct. The research philosophies in the management influence the research
design and processes, the way research is carried out for example, it leads to a major
question of which is first, theory or data (Neuman, 2006; Easterby-Smith et al, 2009).
Research philosophy relies on two aspects: how much world can perceive an idea of
research issue and up to what extent one can analyse, understand and infer the

124
meanings from the data to develop the body of knowledge (Saunders et al, 2009).
These can be further categorised into three different philosophical viewpoints called:
positivism, interpretivism and realism. In this study, a combination of research
philosophies interpretivism and positivism is applied. Interpretivism application is
justified in analysing literature and developing the conceptual framework whereas
positivism is justified in testing the proposed framework and hypotheses generated
based on the causal relationships in the framework.
Interpretivism is defined as an alternative to the positivism orthodoxy. This philosophy
applies the details of the situation to understand the reality or the reality working to
create the situation as argued by Remenyi et al (1998 as cited in the Saunders et al,
2009). Interpretative theorist attempts to find the meaningful explanation of an event or
a fact within a research context specific to the subject. This allows information to be
interpreted to analyse the topic. Neuman (2006) defines the interpretivism as
―it is the systematic analysis of socially meaningful action through the direct
detailed observation of people in natural settings in order to arrive at
understandings and interpretations of how people create and maintain their
social worlds‖.
Use of a single type of philosophy may create over dependence on one type of data or
unidirectional inferences; thus keeping in sight this reason of data and biases, it was
decided to use both philosophies in this study (Bryman and Bell, 2007). Hence,
reducing an over dependence on the single philosophy is one of the reason of adopting
mixed methodologies and also, it is the requirement of subject such as SWF concept
which requires exploration at first to develop the framework and then analysis and
testing to refine the concept. Qualitative aspects and current status of management
issues can be the best understood by discussion with managers and decision makers of

125
SWF. Thus, qualitative analyses of interviews and secondary data are adopted as
compared to quantitative analyses in the form of statistical tests for questionnaire data.
Positivism stands for the application of the scientific methods to study social research.
With this type of positivism, researchers prefer working with an observable reality and
try to make law like generalization at the end of analyses of findings (Saunders et al,
2009). Contrary to the interpretivism, positivism usually demonstrates the causality
which can be proved or can be tested by deduction of hypotheses. However, positivism
requires that theoretical concepts are operationalized first before any measurement
process takes place and; results may be generalized through statistical analyses which
need the large number of units of analysis in the samples (Easterby-Smith et al, 2009).
Positivism is a highly structured methodology which normally produces objective facts
and establishes the truth like experimental research of observations, facts and numbers.
On the other hand, interpretivism derives meanings and values without having direct
relation between subjects and objects (Williams and May, 1996). The realism or
positivism has an underlying assumption of considering the reality and the existence of
what is already being known to use in the analyses with events, entities and structures
included in the research field. It is considered to be independent of research beliefs and
values that can be a bias to the quality of feedback from respondents (Easterby-Smith
et al, 2009).
These research philosophies of interpretivism and positivism are closely aligned to
main research approaches inductive and deductive respectively. More clear the
adoption of a research approach, more clarity it would bring in developing or testing
the concept (Sekaran, 2003; Neuman, 2006). Inductive approach is defined as a process
which takes inferences from data analyses to formulate or to develop the theory

126
whereas deductive approach is about taking this developed or proposed concept or
theory to data for testing the proposition for impacts, causal relationships or defining
measurements using statistical analyses such as correlations or regression of structured
data for example questionnaire data in this study (Neuman, 2006).
Both these approaches are selected in this study. Literature review and its qualitative
analyses leading to development and proposition of the conceptual framework is the
inductive approach of this research study. The deductive approach is applied in the
form of testing the proposed framework from qualitative analyses of secondary and
interviews data and statistical analyses of primary questionnaires data of Oman SWF.
In addition to formation and testing of theoretical proposition, these approaches enable
to find more perspectives regarding investment strategies and management issues as
part of developing the proposition which leads to the methodological triangulation and
rich information exploration (Bryman and Bell, 2007; Easterby-Smith et al, 2009).
Development of conceptual framework proposition based on the review of academic
literature and industry data about SWFs is result of the application of inductive
approach in this study as shown below.
The deduction approach allows one to test the proposed conceptual framework based
on the analyses of secondary data and primary data through interviews and
questionnaires from selected case studies of SWFs which is shown below.
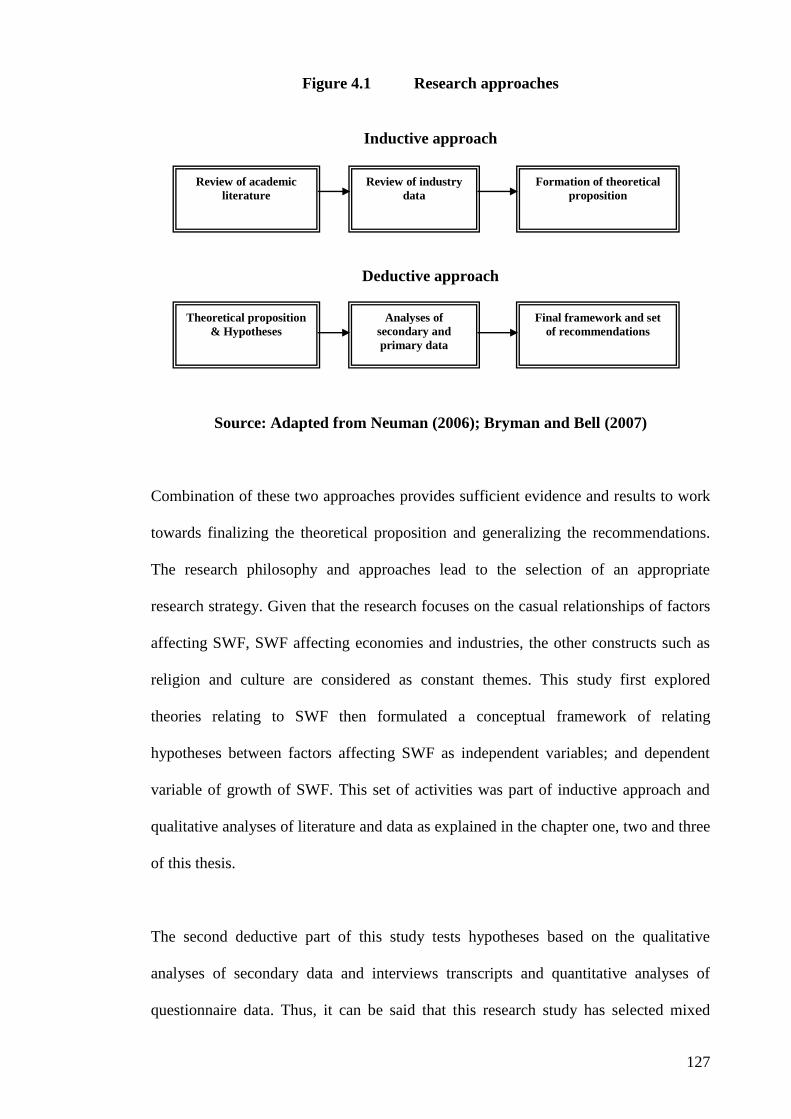
127
Figure 4.1 Research approaches
Inductive approach
Deductive approach
Source: Adapted from Neuman (2006); Bryman and Bell (2007)
Combination of these two approaches provides sufficient evidence and results to work
towards finalizing the theoretical proposition and generalizing the recommendations.
The research philosophy and approaches lead to the selection of an appropriate
research strategy. Given that the research focuses on the casual relationships of factors
affecting SWF, SWF affecting economies and industries, the other constructs such as
religion and culture are considered as constant themes. This study first explored
theories relating to SWF then formulated a conceptual framework of relating
hypotheses between factors affecting SWF as independent variables; and dependent
variable of growth of SWF. This set of activities was part of inductive approach and
qualitative analyses of literature and data as explained in the chapter one, two and three
of this thesis.
The second deductive part of this study tests hypotheses based on the qualitative
analyses of secondary data and interviews transcripts and quantitative analyses of
questionnaire data. Thus, it can be said that this research study has selected mixed
Review of academic
literature
Review of industry
data
Formation of theoretical
proposition
Theoretical proposition
& Hypotheses
Analyses of
secondary and
primary data
Final framework and set
of recommendations

128
methods approach. The next step in the research process after finalizing the research
philosophy, approach and types of analyses is to decide which strategy can be
implemented to carry out the research. This is explained in the next section.
4.4 Research strategy: The case study method
It has been said that empirical or analytical studies are carried out to answer the
research questions. Hence, research design is conducted in a context where it becomes
congruent with its theoretical underpinning (Ghauri and Gronhaug, 2002). This
selection of research design is preceded by an appropriate research strategy for the
topic under investigation. Knowing the course of research study such as philosophical
stance or research approach applied such as mixed methods allows one to finalize the
research strategy – a plan of how to carry out the research study keeping in view the
aim and key research questions. This study has done literature review and industry data
analysis to formulate the initial conceptual framework proposition and collects primary
and secondary data to test this proposition according to the deduction approach
application. The data used to test the theory is collected from respondents attached
directly and indirectly to Oman SWF. The purpose is to seek solutions about which
factors affect the growth, success rate and investment performance of SWFs and once
these factors are known then how to utilize them for the sustainable growth of any
SWF.
Primary and secondary data is sourced from Oman SWF by different data collection
methods however it concentrates on a single unit of analysis Oman SWF. Apart from
deduction approach using descriptive statistical tests to finalize the conceptual
framework, Norway SWF is also analysed to compare with Oman SWF for the factors
selected in the framework plus other organisational attributes such as size and

129
structure. The cross case comparison allows to ascertain what are the issues within
Oman SWF and what can be done to achieve best performance for Oman SWF. This
type of research design selection is the most suitable under the case study research
strategy where in-depth exploration of each unit of analysis is necessary.
4.4.1 The case study method
Yin (2009, p.13) defines case studies as ―an empirical inquiry that investigates a
contemporary phenomenon within its real life context especially when the boundaries
between phenomenon and context are not clearly evident‖.
Cutler (2004) classifies case studies according to their purpose and utility such as
teaching cases for discussion and debates; historical cases for information storage and
retrieving; diagnosis cases used in professional practice and finally, research cases for
investigation activities. Yin (2009) categorises case studies based on the type of
research they are deployed into such as exploratory case studies for structured or
deductive approach research, descriptive case studies to describe the effects or impacts
and the explanatory cases to explain for example a company‘s business process. Case
studies provide a holistic view of the process such as investment or decision making in
the company like sovereign wealth funds in this study. Case studies are detailed
investigations into a complex entity that signifies the uniqueness of case study and are
important tool to make theoretical contribution.
In this thesis, case studies are important because constructs and linkages are not
developed as SWF is a new concept and its body of knowledge is not developed in
terms of any particular SWF theory. However, in this case it is attempted to develop
explicit hypotheses based on the conceptual framework formulated from literature and
industry data. Thus, case studies can help to develop the research and knowledge
further for the concept of SWF (Eisenhardt, 1989; Barr, 2004). Case study research
130
strategy enables large amount of data collection rich in description and analyses for
specific perspectives for example performance of group of SWFs. Thus, conceptual
and causal relationships between different constructs or variables can be understood
such as factors affecting growth of SWFs in this study. Case studies can be utilized as a
combination research strategies with experimental or survey research. Case study
research can be defined as an experimental or an analytical investigation of phenomena
in practical context where barriers between phenomenon and context are blurred and
multiple sources are used to get data (Miles and Huberman, 1994; Neuman, 2006; Yin,
2009). Case studies are selected over other methods when comprehensiveness of
understanding is required more than statistical analyses and current information
regarding a phenomenon or a theory is inadequate. Hence, it is a powerful method to
study contextual factors like what drives country and SWF to the growth and what
business process or investment strategy must be followed (Miles and Huberman,
1994).
In this study, the selected case units are SWFs of Oman and Norway. Both these SWFs
have investments made on a global scale and its profitability can impact to the balance
sheets of their respective country‘s investment portfolio. Other data from Oman and
Norway SWFs are analysed in the next chapter of secondary data analyses.
4.5 Triangulation
As defined by Robson (2002) triangulation, a concept taken from engineering is
applied by management researchers in the measurement of constructs to reduce any
chance of errors because lack of methodological rigour, data sources, observations or
theories. This concept of triangulation in management was introduced by Webb et al in
1960s and Denzin in 1970s as mentioned in Bryman and Bell (2007). The application

131
of triangulation technique is about utilizing multiple observers, theoretical
perspectives, data sources, methodologies, approaches and analyses to identify and to
minimize the impact of errors in the complete research process. For example, if
authenticity of a data source is low then better to apply data triangulation and collect
data from multiple sources. In this way, triangulation helps researchers to increase the
validity of the findings and thus becoming confident about the generalizations and
recommendations made, thus increasing the contribution and usage of the research
done (Miles and Huberman, 1994). Since, this is not laboratory experiments research,
one can implement four types of triangulation in this study:
(1) Data triangulation – collecting from questionnaires, interviews and secondary data;
(2) Methodological triangulation – using both inductive and deductive approaches;
(3) Theoretical triangulation – proposed framework as consider maximum possible
variables in both quantitative and qualitative categories derived from key inferences
from the literature review, of possibly all recent perspectives on sovereign wealth
funds research; and
(4) Data Analyses triangulation – using multiple analyses and evidences to test
hypotheses such as regression, descriptive statistics, interviews, secondary data of
SWFs and literature support (Neuman, 2006; Bryman and Bell, 2007).
4.6 Sampling
Sampling is a vital function of the research process in finalizing the data collection
plan as a major activity of research design. Researcher should take sufficient number of
units of analysis as a representative sample drawn from population domain which
finally provides required data for the analysis purposes in the research inquiry
(Sekaran, 2003). Sampling enables the selection of a representative sample of the
population because it is rarely possible that whole population is utilized as a sample.

132
Thus, sampling techniques categorised as probability and non-probability are known
for enabling data collection process to be practical in terms reducing cost, time and
complexities. Samples can be further classified based on different criterion applying
different stratums, filters, clusters, randomness and proportion. Probability sampling
refers to the method of selecting units from population in such a manner that all units
of population will have equal probability of getting selected in the sample (Saunders et
al, 2009). Probability sampling is selected for this study because Oman SWF has
smaller population of employees and other stakeholders. The population of respondents
for this case study of Oman SWF is formed by employees and management
stakeholders attached to it directly and indirectly, such as advisors, ministers and all
levels of organizational hierarchy. Sample size can be calculated based on number of
variables in the framework (Pallant, 2010) or based on the margin of error (Saunders et
al, 2009).
Stevens (1996, p.72) recommends about 15 responses per independent variable
whereas Tabachnick and Fidell (2007, p.123) suggest minimum 50 + 8m variables
having m = number of independent variables. In this study, there are eight independent
variables as mentioned in the conceptual framework in previous chapter. Thus,
according to these variables based formulae, this study requires either 15x8 = 120 or
50+ 8 (8) = 114 responses as sufficient number to carry out statistical tests using SPSS
software (Pallant, 2010).
The main problem in getting 114 or 120 responses is that there are not many executives
working within Oman SWF in middle and top management. Therefore, it would be
advantageous to get maximum possible responses from middle management through
questionnaires and from top management through interviews.

133
The other method to determine the sample size is based on the level of accuracy
expected. The larger sample enables reduction in errors and increases validity for
making generalizations as they represent larger proportion of population (Sekaran,
2003). As mentioned in Saunders et al (2009, p.210) ―the larger the sample size lower
the likely error in generalising the population; therefore probability sampling is a
compromise between the accuracy of the findings and time and money invested in the
collecting, checking and analysing data‖
Thus, sample size calculation is governed by level of certainty required, tolerable
margin of error, type of analysis to be undertaken and available size of the population
(Saunders et al, 2009)
In this study, total available stakeholders and employees attached directly or indirectly
to Oman SWF are not more than 400. This is not a large population and also response
rate can be low for questionnaire survey. Therefore, maximum possible respondents
from this population would be contacted for questionnaire survey. According to 5%
margin of error and 400 respondents‘ population, one requires a sample size of only
168 (Saunders et al, 2009; p.212). Hence, the minimum number of responses required
is between 114 and 168 according to both methods of sample size calculation.
Apart from questionnaire survey, data will be collected through interview as well from
top management executives, advisors and ministers because they can provide first hand
information for factors and issues affecting the successful operations of SWF. Thus for
interviews, ministers and top executives in relevant parliamentary level departments
are approached, in the range of 30 to 40 persons. From 40 potential interviwees
contacted, following sample of 20 interviewees agreed to take part in the interviews.

134
Table 4.1 Final Interview Sample
Interviewee
number
Interviewee
Designation
Relation or
Responsibility to Oman SWF
1 Al-shura council speaker Law and policy making for country in
conjunction with parliament
2 General secretary state council Law and policy drafting and
implementation in conjunction with
parliament
3 Dy. CEO Employee in Oman SWF
4 General director of investment
development
Inevstment activities with Oman SWF
5 General director – financial audit Auditing of Financial agencies
6 General director – investment
planning
Investment planning for Oman
7 Vice-chairman – Shura council Law and policy making with parliament
8 Economic expert –
Al-Shura council
Research expert who can advise SWF
9 Technical expert –
Al-Shura council
Technology expert who can advise SWF
10 Economic researcher –
State council
Research expert who can advise SWF
11 Economic researcher –
State council
Research expert who can advise SWF
12 Dy. CEO IT authority Planning and IT expert
13 Economic expert – State council Research expert who can advise SWF
14 Economic researcher – MoF Research expert who can advise SWF
15 Political researcher – Oman
News Agency
Can help for bilateral relations and trade
with other countries
16 Director – National Economy
Ministry
Can advise for planning of governance and
Revenue mechanisms of SWF
17 Member – Al-Shura council
Planning and policy making
18 Employee – Royal Office Repoting to Sultan, can advise for planning
19 Employee – Royal Office Reporting to Sultan, can advise for
administration
20 Executive – Internal security Can advise on national security issues
Desing and process of data collection done using questionnaire and interviews are
explained in the next section.
135
4.7 Data collection and analysis techniques
Data collection is a vital component of research design as it enables the researcher to
develop or to test the theories. The usual instruments of data collection are
questionnaires, interviews, observations, experiments, discussions, archived documents
and historical transactions. Data can be classified as primary or secondary. Primary
data is collected by researchers themselves whereas secondary data is data sourced
already published or existing information. Both categories of data have issues of
reliability and validity embedded in them due to data collection instruments, scale
applied, authenticity of data sources, biases from respondents or researchers.
Therefore, multiple data collection in the form of use of different data collection
instruments or many sources of data helps the researchers to reduce errors and increase
the validity of the results. This is called data triangulation application (Saunders et al,
2009). It is proposed to collect both primary and secondary data from SWFs and also
utilize two data collection instruments: questionnaires and interviews. The deduction
process of testing the hypotheses of the conceptual framework will have evidence
collected from three sources: secondary data from SWFs‘ websites and reports,
primary data through interviews and questionnaires.
4.7.1 Interviews
The first issue to be resolved for data collection through interviews is how structured
the interview should be. According to the classification based on a level of structure, in
this study semi-structured interviews are utilized which is closely aligned with guided
open interview style (Easterby-Smith et al, 2009). In this study, interviews are used in
the data collection process to explore and to extract more in-depth information from
top management and ministers about SWF.

136
The following interview protocol and set of interview questions were prepared as a
guideline to conduct the interview process without any bias from interviewer. The
confidentiality, academic purpose of the research and no recording of responses were
conveyed to the interviewees in advance to minimize the interviewee bias (Sekaran,
2003; Bryman and Bell, 2007).
Semi-structured interviews with open ended questions would enable to extract
maximum possible information about SWF and get rich description required for
deduction of conceptual framework through multiple data sources, as compared to the
structured interviews and close ended questions in the interviews (Bryman and Bell,
2007). The variation or pattern emerging out of data and willingness of respondents to
reveal detailed information are more evident in semi-structured and flexible style of
interviewing which keeps the interviewees at ease (Sekaran, 2003; Neuman, 2006).
Errors are attempted to be minimized in the interview data collection by applying
various techniques such as open ended and less impactful questions, appropriate tone
of the discussion, practicing the interviews in both languages English and Arabic,
advance approvals and agreed meeting times, flexibility in the order of questions,
conveyed confidentiality and academic purpose of the interviews in advance to
interviewees. Analysis of interviews is done using categorising, coding and
transcribing the data collected from interviews (Saunders et al, 2009). Conducting
interview requires much ethical, morality and interviewer bias control since
interpretation and recording of responses is done by interviewer alone and not by
respondent as in the case of questionnaire where respondent selects the answer. Thus,
interview process needs a protocol as mentioned below.

137
Interview Protocol
Type of Interviews : Personally administered, face to face and semi-
Structured
Interview duration : 45 minutes to 90 minutes
Level of interviewees: Decision making in Wealth Fund and Ministry of
Finance (For example, under-secretary, member of
parliament, chief executive officer, general manager)
No. of executives : total 30 to 40 executives from all relevant departments
in sample
Purpose and style : Information exploring and extraction by medium level
probing
Place of interview : Department office or conference room
Language : English and Arabic as suited to the respondents
Confidentiality : It is explicitly made clear to the respondents that
purpose of the research is academic.
Morality and Ethics: Each respondent would be requested for interview in
advance and data collection would proceed on the receipt
of written consent from each participant.
Recording responses: Interviewer will explain to each interviewee that the
interview needs to be recorded for the study. In addition
to giving consent for conducitng the interview, each
interviewee would be asked to give a written consent for
recording the interview.
Information exchange: Few questions for selected topics are prepared in advance
where as rest of the discussion may take its own course.
Type of questions: Open ended, describing and explaining situation or
process
End of interview: Thanking the respondents for their time and contribution.
Providing them interviewer‘s contact details in case they
wish to receive brief summary of the research. Interview
transcripts are given in Appendix E.

138
4.7.2 Questionnaires
Management researchers usually make use of questionnaires in the survey research
however questionnaires can be useful in the case study research strategy too.
Questionnaires are mainly a structured form of pre-set questions with different scales
to measure variables. For example, Likert scale of 1 to 7 designed and applied for this
study (Neuman, 2006; Yin, 2009). Questionnaire is widely used and approved form of
data collection when one wants to collect large data in short time from many
respondents. Also, questionnaire‘s importance is increased over the time with more
statistical tests and software are developed in the support of questionnaire for example
SPSS. Recent developments include questionnaires sent by emails or filled online on
the websites due to internet technology developments (Dillman, 2000; deVaus, 2002).
Questionnaires are advantageous over interviews in terms of time, cost, location,
analysis and overall ease of data collection process (Sekaran, 2003; Saunders et al,
2009). The design of questionnaire in terms language of questions, scale applied, order
of the questions, respondents understanding of questions can impact the quality of data
it generates for analysis. Also, the data analysis techniques such as statistical tests and
the use of software shall be known in advance prior to collecting data through
questionnaires (Bryman and Bell, 2007; Saunders et al, 2009).
Question types
The Likert scale of 1 to 7 is applied instead of 1 to 5 to provide more choice of answers
and to get exact views of respondents about SWF. The same scale is applied to all
questions for better comparison, analysis and ease of understanding for respondents.
Set of 10 questionnaires were launched initially as a pilot study to check how the
respondents feel while answering the questions. This was done in the form of sending
questionnaires to experts and managers for their comments about design and content of

139
questionnaire. Considering these comments, final questionnaire is designed as
explained in figure 4.2. Major points to remember while designing questions are: no
negative words, no use of acronyms and multiple meaning phrases, no abbreviations
used, no use of emotionally loaded questions, to the point direct measurements, clear
explanation of ethics, confidentiality and academic purpose and simple language
(Saunders et al, 2009; Pallant, 2010). Following diagram provides the necessary
procedure adopted for designing the final questionnaire for primary data collection.

140
Figure 4.2 Questionnaire Design
Adapted from Neuman (2006); Bryman and Bell (2007); Saunders et al (2009)
Such a design procedure followed for questionnaire minimizes the occurrence of errors
and reduces any influence of biases thus, increasing validity of the data and results.
The following diagram summarises the data collection methods and its further use in
the analyses.
Author’s experience & participation in Govt. administration & management
Key inferences from Literature review
Research methods of Questionnaire design
Initial secondary data from SWF of Oman
Launching questionnaire in UK & Oman for expert comments
Design of final questionnaire in English and Arabic version
Personally administering the questionnaire on selected sample
for collecting data to test proposed hypotheses
Formulating Draft Questionnaire
Modify questionnaire based on feedback & responses’ comparative Analysis for final addition/deletion
Translation and analysis of responses from UK having a. Experts’ comments
Translation and analysis of responses from Oman having b. Managerial comments

141
Figure 4.3 Data collection methods
Adapted from Bryman and Bell (2007); Saunders et al (2009)
4.7.3 Data analyses
Analysis of Interview transcripts
Interview transcripts are analysed in three steps. First, major themes from each
question and framework of factors are drawn to structure the flow of analysis.
Secondly, notes made during each interview are converted into transcript or main
message from the interviewee. Finally, this transcript is then explained and understood
based on the content analysis using theme structure derived in step one (Saunders et al,
2009). This sequence with detailed interviews analysis is in the sixth chapter of this
thesis.
Questionnaires 1. Probing 2. Closed ended 3. Decisive questions
Information SWF, Trade reports And data from Oman and Norway
Primary Data Collection
Data collection method
Responses provide
Findings include
Secondary Data Collection
Finalizing the factors
affecting and their impacts
on SWF
Provide insights and
emerging patterns
Analyses for SWF
management and
investment strategies
Interviews 1. Description 2. Impact words
3. Explanatory
4. Perspectives
Specific answers Measure dimensions and Test hypotheses
Facts, figures and trends provide investment patterns and important factors applied
Descriptive and meaningful answers provide what is required in SWF as their feedback

142
Analysis of Questionnaire responses
The data analysis is carried out using descriptive statistics and other parametric and
non-parametric statistical tests. However this requires prior coding, screening and
cleaning of the data in a structured format using the software, in this case it is SPSS
version 18. This is needed if any inconsistencies are left in the questionnaires by
respondents or in creating data files from the filled questionnaires. The SPSS software
manual by Pallant (2010) is followed for carrying out various required tests on
questionnaire data. The sequence of test include feeling the data, checking reliability
and validity, reducing the data using principal component analysis (factor analysis) and
analysing the data based on the correlations and multiple regression test results. These
are explained as follows.
Mean, mode, standard deviation, range and variance results are obtained for main
independent and dependent variables. An inter-correlation matrix of all variables of the
framework is obtained, irrespective of their relations to hypotheses developed. These
descriptive statistics provide feel for the data which is a measure of central tendency to
see their dispersion or cluster formation as a group of variables.
Choosing a correct statistical analysis of data for testing hypothesis and relationship
between variables is one of the most important tasks in the data analysis (Neuman,
2006). Factor analysis allows one to condense a large set of variables such as eight
major factors affecting the growth of SWF as mentioned in chapter three. These large
set of variables can be scaled down to smaller and manageable number of dimensions
and factors (Tabachnick and Fidell, 2007). This is done by expressing their correlation
and analysing their clusters of related items. This is commonly used for developing
scales and measures (Pallant, 2010). Discriminant function analysis can be applied in
this case as one explores the predictive ability of a set of independent variables, on the

143
dependent measures such as success rate and performance of SWF. Canonical
correlation may help in this case when one wants to analyse the relationship between
two groups of factors as divided by qualitative and quantitative. Use of multiple
regression analysis is made to measure overall predictive ability of all factors on the
dependent variables of success rate and performance of Oman SWF. The group of
analyses would facilitate the testing of strength, causal relationship, fitting in the
framework and their impact on one another for all variables in the theoretical
framework made (Tabachnick and Fidell, 2007).
4.7.4 Research ethics issues
This research involves human participants in the data collection by interview and
questionnaire responses. Therefore, it must acknowledge the conformity to the basic
principles and rules of ethics. Four basic principles are autonomy, non-malfeasance,
beneficence and justice. Autonomy involves respect and safeguard to persons and
their protection against abuse and harm. Non-malfeasance is an obligation not to inflict
harm or risk as a result of the research. Beneficence is an obligation to maximise
benefits and minimise harm. Justice is about treating people well and having right
morale that is equal opportunity. Adhering and maintaining these principles form
following ethical procedure for data collection (Korac-Kakabadse et al, 2002).
Ethical trade off can be generated from the code of conduct followed by organizations.
For example, freedom of information may reduce the privacy or information sharing
may hamper confidentiality. Hence, this project has followed a rational strategy of
research ethics. Confidentiality is assured to respondents beyond the point of identity
known. Secondly, anonymity is assured to all respondents in the main thesis document
if they wish, which increases their confidence to provide best judged details of Oman

144
SWF and reduces any bias. The Brunel university ethics committee approval is also
obtained prior to primary and secondary data collection.
4.8 Reliability and validity
The key issues for any research findings are acceptance by peer review based on its
validity, reliability and generalizability. Validity refers to the measures applied for
variables closely corresponding to reality; reliability refers to the same measures
yielding the similar or same results if applied on other occasions and generalizability
refers to what extent the findings of research completed confirm or contradict the
existing body of knowledge. These definitions of three key issues pertain to the
positivist stance of deductive approach adopted for testing the conceptual framework
adopted in this study (Neuman, 2006; Easterby-Smith et al, 2009). Reliability of scale
and measures applied can be known from results of consistency and stability tests such
as Cronbach‘s Alpha coefficient. The value of Cronbach‘s Alpha reveals that how the
measures applied are correlated which develops the scale. It ranges between 0 and 1;
however 0.7 is considered minimum to confirm the reliability of the scale applied.
Validity measures can be obtained by principal component analysis or factor analysis
as these tests suggest how many measures really predict a variable and correspond to
predict the particular variable (Pallant, 2010).The scale validity reveals the accuracy of
variables‘ operationalization that dimensions applied to measure the variables are
really measuring them. Different statistical tests are carried out to measure types of
validity such as content validity, criterion validity and construct validity (Pallant,
2010).
In addition to the data and instruments, the appropriateness of the methodological
selection in the research process plays a pivotal role in the reliability and validity of the
findings. The selection of research methods relating to research philosophy, strategy

145
and data collection is supported by the evidence of those methods‘ applications for
SWF research by previous research studies. The following table 4.2 shows the
applications of case study research strategy, secondary data and questionnaires applied
in the previous research studies in the field of SWF.
Table 4.2 Support for research methods’ validity from literature
Research
method
applied
Previous researchers who applied
same method
Source of the literature
Case study
research strategy
involving case of
SWFs
China SWF analysed by Thomas and
Chen, 2011 Temasek holding case by Henry et al,
2011 GIC, Singapore case by Clark and Monk,
2010 Four cases of Kuwait, Abu Dhabi,
Singapore, China SWFs by Pistor and
Hatton, 2011 Norway‘s ethical case by Chesterman,
2008 Cases of GCC SWFs by Setser and
Ziemba, 2009 A case of SAMA by Smith Diwan, 2009
22 SWFs analysed to study 7 factors by
Lyons, 2007
Journal of Cntemporary China
Australian Journal of
Management The Pacific Review
Nellco Legal Scholarship
Repository, Columbia Law
School International Law Review
Council on Foreign Relations
Geopolitics
Journal of Management
Research
Use of only
secondary data as
main source of
data for analyses
Problems in China SWF by Zhang and
He, 2009 Trust, legitimacy and governance
discussion from secondary data cases by
Monk, 2009 Analyses of Petro China and Temasek,
Singapore SWFs in nationalism context
by Lavelle, 2008 Study of investment and governance
practices of top SWFs by Ainina and
Mohan, 2010 Study of 358 investments announcements
made from 24 SWFs by Kotter and Lel,
China World Economy
New Political Economy
Journal of International Affairs
Journal of Asia-Pacific
Business Journal of Financial
Economics

146
2011 Asian SWFs analyses for self regulation
and Santiago principles by Park and
Estrada, 2011
Asian Journal of International
Law
Use of
questionnaires /
Interviews as
data collection
instruments for
primary data
Studying all funds with questionnaires to
develop ranking by Truman, 2008 Statistical analyses to determine
governance by Aizenman and Glick, 2009 Discussions about role of WTO in SWF
by Mattoo and Subramanian, 2009
Peterson Institute for
International Economics The International Finance
The World Economy
4.9 Research design summary
Research design components include planning actual study in terms of location,
representative sample from population, doing data collection and carrying out data
analyses. Thus, research design is one very vital component of any research study as it
separates the research understanding and research actions taken, that is research design
is actual implementation of all selected components of research methodology. The
complete research methods selection is mentioned in the figure 4.4 below (Saunders et
al, 2009). A broad area of research interest is identified based on the industry and
academic literature observations made.
a. Research context, problem definition, main aim and research objectives of the
study are clearly defined.
b. The first phase of secondary data is gathered in the form of literature review and
industry information for sovereign wealth funds.
c. Factors affecting success and growth of sovereign wealth funds are clearly
identified leading to formation of the proposed theoretical framework comprising
independent and dependent variables.
d. Hypotheses are stated and variables are operationalized.

147
e. A scientific research design is planned in terms of data collection, analyses and
their interpretation methods.
f. Deduction approach enables the acceptance and rejection of hypotheses, findings
are discussed and solutions to research questions for sovereign wealth funds and
specifically for Oman SWF are answered.
g. Research report is written in the form of doctoral level thesis.
Previous sections in this thesis have clearly stated research context, problem, literature
review, theoretical proposition and philosophical position; thus next step is to carry out
data collection and data analyses as per the research design planned (Saunders et al,
2009). The different research phases selected in this study are revealed in following
figure 4.4
Results of descriptive statistical tests, regression analysis carried out for questionnaire
data and transcripts of selected interviews are displayed in Appendices A to E. No
personal information of respondents is collected in this study unless voluntarily
disclosed by respondents. Following figure shows selected research elements adapted
based on research design explained by Saunders et al (2009).

148
Figure 4.4 Research methodology elements selected
Adapted based on the research onion by Saunders et al (2009)
Positivism & Intrepretivism Philosophy Deductive and Inductive Mixed Approach
Case study Research Strategy
Cross sectional Time Horizon
Quantitative & Qualitative Analysis
Probability Sampling for Questionnaire
data collection
Data Collection 1. Contacting key executives 2. Obtaining secondary data of Oman SWF 3. Obtaining data of Norway SWF 4. Collecting data through interviews 5. Collecting data through questionnaires 4.
Data Analysis 1. Analyses of secondary data 2. Coding interview and questionnaire data 3. Qualitative analyses of interview data 4. Statistical analyses of questionnaire data 5. Results, analyses and validation of findings 6. Recommendations based on data analysis
149
Chapter 5 Analyzing case study evidence: Secondary data
5.1 Introduction
Previous chapters explained the literature review, theoretical proposition, hypotheses
formulation and research methodology applied in this study. This chapter presents the
analyses of the secondary data obtained from two sovereign wealth funds: Oman and
Norway. It has been attempted to find the answers for research problem; to achieve the
research process objectives mentioned in the chapter one and to assess whether any
substantiating evidence exists to support the hypotheses developed in the theoretical
proposition. First, both cases are analysed separately and then the comparison between
two cases is done. The case analyses offer detailed description and explanation about
how these SWFs operate and invest. Their comparison offers insights into where these
funds are positioned as compared to other funds, global regulations and industry
benchmarks. The analysis of Norway SWF case also serves as part of triangulation
applied in the data collection which ultimately increases the validity of the research
findings.
This section also pertains to data theory process as the secondary data analyses in this
section enable to meet the research objectives set out in this thesis (Philips and Pugh,
1994; Yin, 2009). The case of Norway SWF is utilized here as a benchmark based on
their investment strategy, financial performance and worldwide acceptance of their
governance and behaviour. The findings of this comparison are utilized to develop an
action plan for restructuring Oman SWF and simultaneously the comparison provides
evidence to further hypothesis testing. The secondary data for both funds were
collected from their official websites, annual reports, presentations for investors and
sustainable development reports, strategies and government records. Secondary and

150
primary data collected from both case funds are cross sectional and not longitudinal
which further restricts the scope of generalization (Bryman and Bell, 2007).
5.2 Case analysis strategy
Selected SWFs are analyzed in a way that they can be compared for various attributes
and each research issue. For example, organizational structure, decision making
process, investment strategy, management control, governance, asset allocation and
deals, investment rights and regulations, objectives and perspectives of setting up these
funds. Both case funds will be analyzed for the factors mentioned in the theoretical
proposition which will generate a comparison between the proposition based on the
theory and the industry practices followed by these sovereign wealth funds. This will
help in testing the hypotheses and developing an implementation procedure for
recommended action plan within Oman SWF (Yin, 2009).
5.2.1 Objectives of the case analyses
The major objective of this chapter is to execute the research strategy as mentioned in
the methodology chapter by conducting secondary data collection and interpreting the
findings of data analyses obtained for both case funds. This part of the thesis becomes
the integral section of the deduction process for testing the theoretical proposition as
explained in the chapter four (Neuman, 2006). This facilitates to find answers to
research problem and issues defined in the chapter one. These research issues are
associated to constructs defining variables which formed the theoretical proposition.
Hence, discussion and answers to these research issues underpin the sovereign wealth
funds‘ overall functioning. Findings from secondary data in this chapter may generate
different views about various components of SWF which can help review of the SWF
as a phenomenon (Eisenhardt, 1989; Yin, 2009).

151
5.2.2 Structure of the case analyses
This chapter follows the sequence of the data collection, coding and display;
interpretation of displayed data; analyses, findings, discussion and comparison. The
next chapter also follows the same logic for analysing primary data. This chapter ends
with summary of findings based on the comparison between Oman and Norway SWF.
The flow of the chapter is shown in the figure below.
Figure 5.1 Structure of analysing case study evidence
Adapted from Yin (2009)
These case analyses would enable to support or reject hypotheses made in the proposed
theoretical framework. However, these SWFs are analysed as a company analysis; thus
the order of hypotheses or factors proposed in the framework is not exactly followed.
The case are analysed in the following order and wherever necessary the hypotheses
support or rejection is discussed and finally summarised as well.
SWF case analysis attributes Hypothesis tested
Background
Organisational structure ------------------------------ structure and purpose (H6)
Management control and Govt. support ------------ policy (H4), decision making (H8)
Strategic vision -----------------------------------------policy (H4), decision making (H8)
Responsibility & Sustainability strategy ------------transparency, accountability (H1)
Investment strategy ------------------------------------investment deal (H7)
Asset allocation fundamentals -----------------------investment deal (H7)
Governance standards ---------------------------------governance (H1)
Transparency -------------------------------------------transparency (H1)
Performance indicators -------------------------------where does it stand globally
Priorities for SWF -------------------------------------possible solutions
Secondary
Data from
Norway
and Oman
SWFs
Case
Analysis
Strategy
and
Structure
Analyses of SWF 1
+
Analyses of SWF 2
+
Comparison between
SWFs
Conformity with
literature
+
Recommendations
and Summary
(Included in the
conclusion chapter)

152
5.2.2.1 Reasons for doing Norway SWF analysis first
At the time of literature review and initial secondary data collection it was revealed
that there was much less literature and official data available for Oman SWF. There
was no data available regarding investment deals, management information or annual
reports of Oman SWF. Thus, to compare the standard and globally accepted practices
of SWF, it became necessary to review a data rich and SWF of Norway prior to
analysing Oman SWF with its negligible data availability. Also, the case of Norway is
utilized to increase the reliability and validity of the findings (Eisenhardt, 1989; Yin,
2009)
5.3 Norway SWF: Government pension fund global (GPFG)
The case of Norway‘s sovereign wealth fund is analysed in the order of its evolution,
expansion, investment strategy, growth in the assets base and governance mechanism
as follows. Current name of SWF set up by Norway is Government Pension Fund –
Global (GPFG) which is managed by Ministry of Finance and Norges Bank Investment
Management (NBIM). Thus, hereafter Norway SWF will be mentioned as GPFG in
this chapter and further.
5.3.1 History and Background of the GPFG
It was just before Christmas in 1969 that news Norway had found oil in the North Sea.
Over the years, Norway accumulated wealth from the oil proceeds and multiplication
of investment returns in the last two decades.
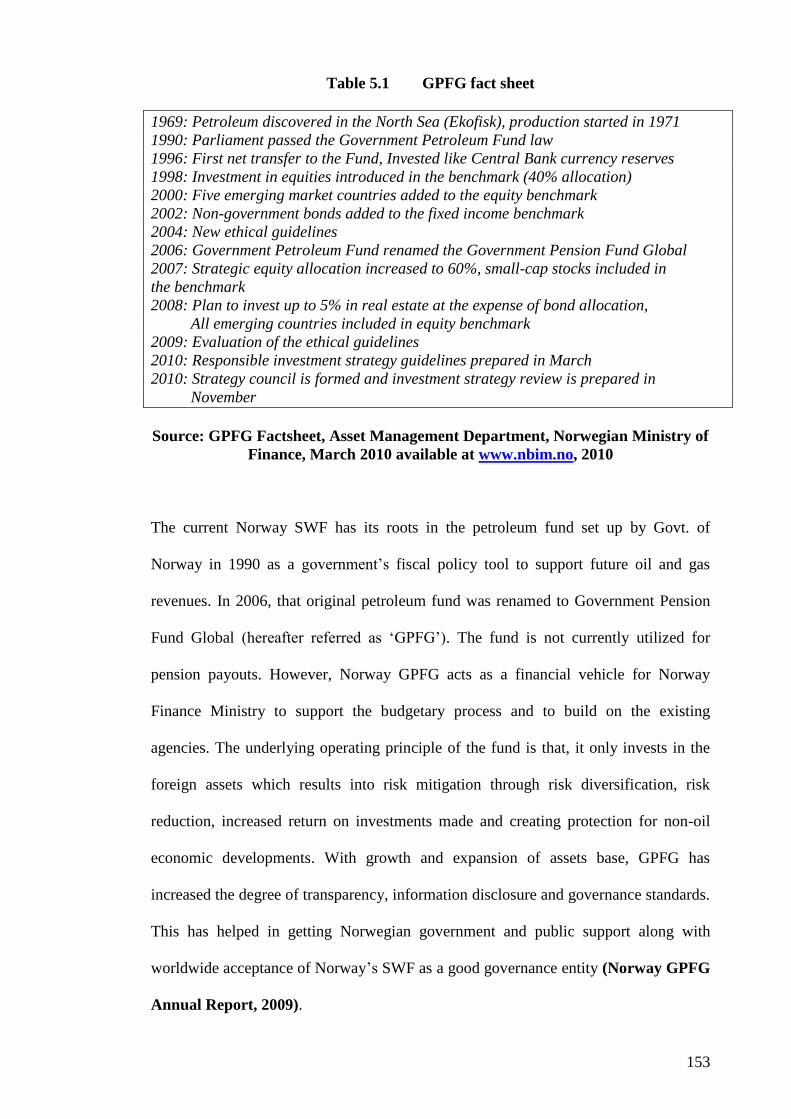
153
Table 5.1 GPFG fact sheet
1969: Petroleum discovered in the North Sea (Ekofisk), production started in 1971
1990: Parliament passed the Government Petroleum Fund law
1996: First net transfer to the Fund, Invested like Central Bank currency reserves
1998: Investment in equities introduced in the benchmark (40% allocation)
2000: Five emerging market countries added to the equity benchmark
2002: Non-government bonds added to the fixed income benchmark
2004: New ethical guidelines
2006: Government Petroleum Fund renamed the Government Pension Fund Global
2007: Strategic equity allocation increased to 60%, small-cap stocks included in
the benchmark
2008: Plan to invest up to 5% in real estate at the expense of bond allocation,
All emerging countries included in equity benchmark
2009: Evaluation of the ethical guidelines
2010: Responsible investment strategy guidelines prepared in March
2010: Strategy council is formed and investment strategy review is prepared in
November
Source: GPFG Factsheet, Asset Management Department, Norwegian Ministry of
Finance, March 2010 available at www.nbim.no, 2010
The current Norway SWF has its roots in the petroleum fund set up by Govt. of
Norway in 1990 as a government‘s fiscal policy tool to support future oil and gas
revenues. In 2006, that original petroleum fund was renamed to Government Pension
Fund Global (hereafter referred as ‗GPFG‘). The fund is not currently utilized for
pension payouts. However, Norway GPFG acts as a financial vehicle for Norway
Finance Ministry to support the budgetary process and to build on the existing
agencies. The underlying operating principle of the fund is that, it only invests in the
foreign assets which results into risk mitigation through risk diversification, risk
reduction, increased return on investments made and creating protection for non-oil
economic developments. With growth and expansion of assets base, GPFG has
increased the degree of transparency, information disclosure and governance standards.
This has helped in getting Norwegian government and public support along with
worldwide acceptance of Norway‘s SWF as a good governance entity (Norway GPFG
Annual Report, 2009).

154
5.3.2 Current status of the GPFG
This GPFG established in 2006 is Norway‘s Sovereign Wealth Fund responsible for
investments in the foreign assets and is governed and controlled by Ministry of
Finance, Government of Norway. The GPFG is for investments in the foreign assets
whereas, in 2006 the National insurance scheme fund was renamed as ‗Government
pension fund – Norway‘ (hereafter referred as ‗GPFN‘) which would deal with local
investments and national issues. The monetary sources to GPFG comprise of income
from petroleum activities and return on the fund's investments. The operational
management of GPFG is delegated to Norges Bank which manages this SWF as per
regulatory and governing frameworks set out by Ministry of Finance. The following
attributes explain the current status of GPFG, its strategy and operations (Norway
GPFG Annual Report, 2007).
5.3.2.1 Organisational structure
The government of Norway has prepared active management framework in the pension
fund act. The formal responsibility of the fund management rests with Ministry of
Finance (hereafter referred as MoF) wherein operations are managed by the Norwegian
central bank (Norges Bank) through their investment arm Norges Bank Investment
Management (NBIM). The MoF and NBIM have a written agreement for shared roles
to manage GPFG. Investment strategy is governed by MoF issued guidelines for
responsible investments, ethics and sustainability. The main aims of the fund are to
ensure that oil wealth advantages reach to the future generations and wealth is
multiplied, secured and utilized ethical ways acceptable to wider society (GPFG
Annual Report, 2009; NBIM Annual Report, 2009). The relationship structure between
the government of Norway, the ministerial department and Norges Bank is as shown
below.

155
Figure 5.2 SWF Management structure between Parliament, MoF and NBIM
Source: GPFG Global Annual report, 2009, p.10/91
The NBIM as shown above is responsible for day to day functioning and investment
operations of GPFG. This management again affected by the Norges bank operations
and organisational hierarchy. At the NBIM, this management has been divided again
into four major sections of executive board, committees, CEO, compliance and senior
managers‘ leadership group. The executive board with seven members appointed by
the King in council is a body responsible for Norges Bank‘s operations. The following
figure reveals this NBIM hierarchy with their functions are mentioned for each
respective department. All guidelines and strategies are laid down by executive board
which may receive expert advisory from MoF, NBIM or external consultants (NBIM
Global Annual Report, 2008).
The value addition by GPFG is done through an active management framework
wherein owners‘ long term interests are protected through applying business strategy

156
whilst minimizing the resources spent. In addition to GPFG, NBIM has other portfolios
to manage such as central bank to banks in Norway, foreign exchange reserves of
Norway and Government Petroleum Insurance Fund (GPIF) from Ministry of
Petroleum and Energy. NBIM has different governance model which differs as
compared to other portfolios of Norges Bank. NBIM‘s executive director and CEO
reporting to executive board are monitored by Governor of the board. This executive
board and MoF together set guidelines for investment thresholds for GPFG about size
and risk of the investment deals. Based on this policy, NBIM has implemented new
risk management framework in 2009 about identifying, assessing and mitigating four
different risks: credit, market, counterparty and operational risk. GPFG monitors each
risk‘s limits on monthly, quarterly and annually basis (www.NBIM.no, 2011). NBIM
follows performance based remuneration policy for all employees at NBIM managing
GPFG. Norway parliament has supervisory council of 15 members to oversee Norges
Bank operations and compliance with rules which includes GPFG management by
Norges bank investment management (NBIM). This ensures that operations are carried
out in accordance with applicable laws, agreements, decisions, guidelines and other
rules. This supervisory council organises audit and approvals of Norges bank budget.
For example, Deloitte AS and Norges Bank prepared separate audits and submit to this
supervisory council. Then, the Office of the Auditor General audits and performs
checks on GPFG to see their operations and management is in accordance with
applicable legislation and instructions (NBIM global annual report, 2008).
Therefore, above discussion reveals that organisational structure has paved way for
governance mechanisms and transparent disclosures to work. Thus in case of Norway
SWF, the hypothesis H6 about structure and clear purpose is supported.

157
Figure 5.3 NBIM Management structure
Source: GPFG Global Annual Report, 2009, p.11/91
5.3.2.2 Management control and government support
As discussed in the previous section, management control of GPFG rests with the
Government of Norway through a channel of parliamentary supervisory council to
Ministry of Finance to Norges bank executive board to Norges bank investment
management department. In the last decade, Norway government has taken measures
and issued guidelines for the provisions on the management of GPFG. Following major
amendments and additions were done based on responsible, sustainable and ethical
investment strategy reviews and came into practice as of 1st March, 2010. These
amendments were issued to main Government Pension Fund Act, 2005 (MoF GPFG
Management Report, 2010).

158
“Section 1 The Government Pension Fund shall support government saving to finance
the National Insurance Scheme’s expenditure on pensions and support long-term
considerations in the use of petroleum revenues‖ (GPF Act, 2010).
“Section 2 The Government Pension Fund is managed by the Ministry of Finance. The
Fund comprises the Government Pension Fund Global and the Government Pension
Fund Norway. The Government Pension Fund Global (GPFG) is deposited in an
account at Norges Bank. The Government Pension Fund Norway (GPFN) is deposited
with Folketrygdfondet. The counter value for both GPFG and GPFN is managed under
rules laid down by the Ministry of Finance‖ (GPF Act, 2010).
“Section 3 Income to the Government Pension Fund Global consists of the net cash
flow from petroleum activities, which is transferred from the central government
budget, the net results of financial transactions associated with petroleum activities
and the return on the Fund’s capital‖ (GPF Act, 2010).
As evident from the above discussion, Norway government has made it clear the
decision making flow, firm management control and strict audit and supervision. The
compliance of risk management adheres to the following organisational structure.

159
5.4 Organisational structure for risk management compliance
Source: GPFG Global Annual Report, 2009, p.59/91
One can see that Norway SWF management has passed act about how investments and
other managerial decisions are made. Thus, Norway GPFG has both policy planning
and decision making mechanisms present in their day to day operations. Therefore,
hypotheses H4 and H8 respectively for policy and decision making factors in the
proposed framework are supported in this case.
5.3.2.3 Strategic vision and approach
The main aim of GPFG is to provide funding for the National Insurance Scheme
pension payments and to multiply sovereign wealth keeping in view the long-term
investment considerations of petroleum revenues. The robust management and
investment strategy by Norway government will ensure that Norway‘s oil wealth
benefits reach to all current and future generations. The government of Norway has
created decision making hierarchy to oversee the operations and management of

160
GPFG; however, it is not a separate legal entity, it does not have own management
board or administrative staff. Thus, GPFG is still a department of Government of
Norway. The government‘s approach is to be the best managed fund with the highest
governance and ethical standards in the world. This leads to implement the global
practice in all aspects of the Fund management and striving to achieve this. The size
and available funds allow MoF to exercise the hybrid asset allocation portfolio to get
the best risk – return ratio for the investments. The strategic approach of the fund is in
the line with long term investment style with sustainable profits as a main aim and no
influence of political objectives. This is evident from fund not investing in any weapon
and ammunition manufacturing companies and divested funds from any such
companies. More about this approach is discussed in the governance standards as a
separate attribute (Strategy council report by Dimson et al, 2010). This discussion
reveals that Norway GPFG top management has appropriate policies planning and
decision making controls in place which again support hypotheses H4 and H8.
5.3.2.4 Responsible and sustainability strategy
GPFG‘s responsible and sustainable investment strategy is echoed by Minister of
Finance; Sigbejern Johnsen in his 2010 foreword for the strategy when he confirmed
that long term profitability of GPFG relies on how much sustainable development in
economic, environmental and social terms GPFG can make (GPFG Strategy, 2010).
As a first step towards being the best managed fund, ethical guidelines were formulated
in November 2004 for GPFG. These guidelines were prepared on basis of
recommendations from the government appointed Graver committee report in 2003.
The committee report was instrumental in providing two basic perspectives to GPFG
management:

161
a. The fund should achieve high return on the investments made which would
enable Norway‘s future citizens to benefit from the country‘s oil wealth.
b. The fund would attempt to protect the rights of the community affected by
companies in which GPFG makes investments.
This investment ethics view prompted to create two investment requirements by GPFG
to exercise as part of their deals with investee companies: exercise of ownership rights
as an investor in the investee company and exclusion of companies or divestments
from those deals wherein investee companies cannot follow ethical guidelines for
example ‗no child labour‘.
To follow such strategy, GPFG have to utilize the instruments, they have as an investor
to contribute to such ethical and responsible business practices. However, being a
professional advisor, the fund may not be able to uphold all the ethics commitments
like a nation in the bilateral trade or foreign policy. In doing so, the fund can lose the
credibility as a good investor and can brand themselves as an over-active equity owner.
Thus, fund has to balance between promoting ethical and sustainable standards and
seeking profitable returns. Norway GPFG has ethical guidelines in place since 2004,
however GPFG management state in their strategy report that work is still in the early
stage requiring rapid responses and attention by Norway and other SWFs. After
evaluation in 2009, the committee has introduced new measures in 2010.
The part of responsible investor strategy includes extending oil wealth benefits for a
longer duration and sound return to future generations of Norway on the internal basis
whilst being an effective and permanent investor in many major and global companies.
GPFG has a responsibility for promoting corporate governance and safeguarding
environmental and social concerns. If these investee companies cannot be sustainable

162
in their business profitably then GPFG may find it difficult to ensure financial returns
for Norway. Thus, profitable and sizable financial returns over the time depends upon
how much GPFG can influence the sustainable development economically,
environmentally and socially in the investee companies and countries while
maintaining the legitimacy and transparency in their deals and efficient functioning of
other countries‘ economies, industries and capital markets (GPFG Responsible
Investment Strategy, 2010).
In this manner, the fund policies may influence the business practices of the investee
companies and factors related to corporate governance, employee rights, environmental
protection which in turn will increase sustainability of the firms and returns for
Norway GPFG. This responsible and ethical investment strategy comprises a range of
tools such as international collaboration and research to develop the best practices,
investment tools, active ownership and exclusion of companies due to guidelines
issued by GPFG management. The capabilities that convert this responsibility strategy
into the targeted outcome is through investment strategy for funds allocated to different
asset classes and deals following this laid down responsibility, ethics guidelines and
governance standards (NBIM Financial Stability Report, 2009). Next two sections
discuss these aspects in detail about GPFG.
Norway being one of the most ethical investing SWF, they strictly follow human
rights, social responsibility and pollution control standards. They make the investee
companies accountable for following the same. In the past, Norway SWF has made
many divestments because of these issues. Hence, one can say that in case of Norway
SWF hypothesis H1 is supported for accountability and transparency.

163
5.3.2.5 Investment strategy and asset allocation
The income into GPFG from oil revenue is phased gradually into the Norwegian
economy to derive the benefits of responsible investments and ethical guidelines; to see
growth in the all parts of the economy while achieving economic stability in the short
and long term. The capital of GPFG is placed in the foreign securities which ensures
back up against reducing natural resources, tight national budgets, the exchange rate
risks and inland political instability. The foreign investments assure hedging of the risk
by asset classes spread and high financial return. It allows national government to
protect the economy from the effects of variable national revenue. Also, money in
GPFG accounts is neither earmarked against any particular expense accounts nor it has
any claimant or owner of the asset except Norway as a sovereign country and its
government. Proceeds are passed onto economy of Norway through money transferred
to the national budget and amount is decided by following annual budget preparation
based on the following fiscal rule (MoF on GPFG Management, 2009; Dimson et al,
2010).
―The fiscal rule is a plan for a smooth, gradual increase in the spending of oil
revenues in line with the expected real returns on the capital in GPFG, estimated at 4
per cent of the Fund capital. The exact percentage may vary from year to year,
depending on the economic situation or in the event of unexpectedly large changes in
the value of the Fund. Separating spending from income accumulation is crucial in
order to successfully transform temporarily high petroleum incomes into a permanent
increase in welfare‖ (Norway Annual Budget Fiscal Policy, 2010).
The investment decisions taken by GPFG management are mainly according to a
benchmark index determined by the finance ministry. This list shows how much of the
fund should be initially invested in each individual security. Such a list is based on

164
commonly used indices. Norges Bank is allowed to deviate from this list but within the
limits set by the Ministry of Finance. This deviation is termed by GPFG as an active
management. The usual benchmark index consists of 60% equities and 40% fixed
income allocation of assets. The target for real estate allocation for GPFG is to reach
5% in gradual increments (GPFG Annual Report, 2009).
The significant component of the investment strategy decision making is to have wide
array of diversified investments which reduce risk and increase the profitability of the
fund using different regions, industries, asset classes and companies. For GPFG, such a
strategy has worked well since its inception to the end of 2007 in terms of average
annual return. GPFG incurred losses in 2008 due to poor equities performance during
global credit crisis however made strong recovery in 2009 with fund reaching to the
highest return since its establishment. Such a large scale recovery in 2009 proved to
GPFG management that no change in required in the estimated 4% real rate of return
on the portfolio. Fund‘s assets are spread over thousands of equities and bonds in the
international financial markets thus risk is hedged in the form of diversification and
minimum return. Also, fund does not have any debt obligation which requires the sale
of assets thus, investment strategy not only aims to control yearly fluctuations in return
and it aims for higher yield on the portfolio. Some individual investments can make
losses however the idea of investment strategy and asset allocation strengths is to
ensure that total sum of investments results into higher financial gains with decreasing
risk. Long term robustness of strategy helps passing through times of crisis such as
global credit crisis in 2008 – 09. A short term view would have created sale of assets
when prices were falling in 2008. The active management concept of allowing
deviation from benchmark index is to achieve the return in excess of what could have
been the return if investments were made exactly as per the benchmark index. This is

165
under review as active management is supposed to reduce the risk but experience of
2008 – 09 during the crisis shows different results (GPFG Annual Report, 2009; NBIM
Global Annual Report, 2009).
The strategy council experts Dimson et al (2010) for GPFG has attempted to improve
investment strategy after 2008 – 09 experience and four major characteristics or goals
of new strategic direction are: firstly GPFG is responsible for wealth accumulation to
Norway citizens; secondly MoF is responsible to manage GPFG; thirdly GPFG is long
term investor with no liability and high capacity to bear risks and finally GPFG targets
highest possible return. This strategy can be implemented having pre-requisites are
fulfilled such as effective control and mitigating of operational risk, responsible
investment, behave and seek advantage of being large and long term investor and
implement best possible governance standards. This strategy and pre-requisite
fundamentals have led GPFG management to:
―accept higher risk for earning higher return, expand exposure to fixed assets, develop
various forms of insurance selling” (Dimson et al, 2010; p.7).
However, this strategic shift may lead GPFG to a riskier asset portfolio, more risk
exposure and volatility as evident from the discussion of their new investment strategy
and beliefs. This may change asset allocation fundamentals included in the current
investment strategy as well which is discussed in the next section.
5.3.2.6 Asset allocation fundamentals
GPFG has inflow of funds from oil, gas and petroleum revenues whereas outflow is
required to meet non-oil budget deficits. Thus, GPFG is integrated with government
budget and any asset allocations to GPFG reflect the budget surpluses. Outflow from
the fund is regulated through fiscal policy guidelines that non-oil budget deficit shall

166
correspond to real rate of return 4% for GPFG. Two major asset allocation categories
of equities and fixed income for GPFG are shown in the following figure. The next
stage of allocation is based on the regional and industry groups within the specified
category of asset.
Figure 5.5 Asset allocation fundamentals of GPFG
Source: GPFG Global Annual Report, 2009, p.25/91
With stringent standards followed in the asset allocation and robust investment strategy
as discussed above, one can say that results of Norway GPFG growth over the last two
decades are affected by it. Thus, hypotheses H7a, b and c about the investment deal,
size, and strategy and asset allocation are supported in this case.
5.3.2.7 Governance standards
Norway GPFG has strict governance standards for their operations of their fund. In
addition to this GPFG demands equal treatment of shareholders and well being of
financial markets from investee companies. In the past GPFG management has voted
against the irrelevant remunerations without performance of the company. Also, GPFG
does not believe in same person being CEO and Chairman of the board in the investee

167
companies. GPFG management understand that better regulation may lead to better
corporate governance which can increase stability in the financial markets. Thus,
GPFG receives regular input from MoF and Norges Bank such as participation of
GPFG in the preparation of the corporate governance standards through International
Corporate Governance Network (ICGN), collaborations with Council of Institutional
Investors (CII) and the Asian Corporate Governance Association (ACGA) (Sustainable
strategy report, 2008; MoF GPFG Management Report, 2009).
The demand of GPFG to investee companies for following corporate governance
standards and making companies managing boards accountable for their decision
making bring the effectiveness in the company working and also help in protecting
shareholders‘ rights which ultimately safeguards the assets of SWFs as an investor.
GPFG as an investor expects that companies disclose the information and be
transparent in their deals and operations such as carbon disclosure and forest footprint.
GPFG also prepares expectations documents for each company before taking
investment decision and companies must disclose information about children‘s rights,
climate change, water management and any other risk factors. If company cannot make
major changes in their policies or production than as a last resort GPFG takes decision
of excluding such companies and divest any investments already made. In the past,
GPFG has excluded companies producing weapons or tobacco or seriously violating
human rights since 2006. If new information about company is received than GPFG‘s
ethics council may review the divestment decision taken on previous information. This
is clearly shown in the following diagram of division of roles. GPFG uses number of
instruments as a responsible investor promoting governance and transparency which
integrate with environmental and social issues. These instruments are: collaborating

168
with global stakeholders to develop the best practices, investment programmes, climate
research, active management framework and voting rights, collaboration between
investors, or as a last resort exclusion of investee companies or divestment decisions
(GPFP Responsible Investment Strategy Report, 2010).
Figure 5.6 Division of roles between MoF, NBIM and Independent Council on
Ethics
Source: GPFG Responsible Investment Strategy Report, 2010, p.14/32
5.3.2.8 Transparency
These SWFs manage monies on behalf of their population in the respective countries.
Thus, transparency and information disclosure is essential for people to have trust in
the government officers and politicians taking decisions about the SWF management.
The second source of transparency demand is investee companies and their countries‘
governments. In case of GPFG, the MoF reports to the storting on every aspect such as
169
revenue, investment deals, financial prospects, any changes in strategy, developments,
risks, costs overall performance. MoF also publishes advice and reports received from
Norges bank and any external consultants; quarterly and annual reports on GPFG and
its management including list of meetings and all investment deals made. The Norges
bank publishes the recommendations of the council on ethics. Hence, management
board of GPFG and Norges bank have high degree of transparency in their dealings of
investments made and disclosure of information as a SWF. The overall image of the
fund is characterised by this level of transparency within the sponsoring and investee
country stakeholders. This increases the confidence of investee companies and capital
markets positive sentiment on receipt of market information associated to such SWF
investment announcements (MoF on GPFG Management Report, 2008 and 2009).
The above discussion about governance and transparency reveals that Norway SWF
growth and performance is affected by these standards. The effects can be positive or
negative both as Norway SWF many a times decided to divest following the standards
after making demands to investee company boards. Thus, hypothesis H1 about
governance, transparency and accountability is supported in this case.
5.3.3 Key performance indicators
The main purpose of setting up SWF is to utilize the earnings and FE reserves to have
higher return on their investments. Hence, success of this fund can be measured in
terms of its market value, net cash flow, annual inflows, annualised return and total
return. These indicators are plotted in the following graphs. Their analyses suggest that
GPFG made profit in the equity and fixed income markets which helped to increase
market value of fund in 2009. The fund posted a return of 25.6% (NOK 613bn) which
was down by -23.3% in 2008 when security markets collapsed worldwide due to

170
current credit crisis. GPFG had higher return of 4.1% as compared to 4% portfolio
benchmark in 2009. As shown in the graph of market value, it has increased by 365bn
kroner to 2640bn kroner. This success has been built on the return on the investments
which is reflected in the lowest capital transfer at 169bn kroner since 2004.
Figure 5.7 Market value at year end 1998–2009 in bn of NOK
Source: GPFG Global Annual Report, 2009, p.18/91
Figure 5.8 Net government cash flow from petroleum activities by source
1971–2008 in bns of NOK at 2008 values
Source: Ministry of Petroleum and Energy, Norwegian Petroleum Directorate;
GPFG Global Annual Report, 2009, p.66/91

171
Figure 5.9 Annual inflows into the fund by asset class
Bns of NOK, current price inflows into fixed income portfolio 1996–2009
Source: NBIM, GPFG Annual Report, 2009, p.67/91
Figure 5.10 Quarterly and annualised return since inception 1998–2009 in
percent
Source: GPFG Global Annual Report, 2009, p.20 /91

172
Table 5.2 Key numbers for Norway SWF
Size of GPFG in 2009 is NOK 2640bn that is equivalent to USD 457bn
Since 1.1.98 10-year 5-year 3-year 2009
Average Average Average
Total return in % (in FX basket) 4.66 3.47 3.79 0.15 25.62
…of which manager excess return 0.25 0.17 -0.03 -0.41 4.10
Net real return in % 2.70 1.38 1.54 -1.95 23.45
Source: MoF GPFG Management Report, 2010
The key numbers above shows the overall long term returns are low as compare to the
benchmark portfolio, however the market value of GPFG in 2009 was NOK 2757bn
which was more than annual GDP of Norway or corresponds to approximately NOK
570,000 per capita. Globally GPFG has been recognised as major financial institutional
investor and value of the fund is considered to have been 1% of the total value of the
world‘s listed companies at the end of 2009 and 4.4% of the total value of Norwegian
companies listed on Oslo Stock exchange. GPFG of Norway has strong competitors
like ADIA (UAE), China, Saudi Arabia (SAMA) and Kuwait who are all above USD
250bn. In the last decade Norway GPFG has reported 14 times negative return on
quarterly results which reveals that GPFG still needs improve from its current status of
financial success and low growth.

173
Figure 5.11 Net government cash flow from petroleum activities
from 1970 to projected value till 2030 NOK per barrel and
billions of NOK at, 2010 values
Source: Ministry of Finance, Government of Norway National Budget, 2010
Figure 5.12 GPFG projected market value in billions of NOK at current prices
Source: Ministry of finance, Government of Norway National budget, 2010

174
5.4 Oman SWF: State General Reserve Fund (SGRF)
This section provides details about Oman‘s economy, the sovereign wealth fund of
Oman (called here after SGRF) and analysis of Oman SWF.
5.4.1 Importance of SWF to Oman’s economy
The country of Oman is located in the Gulf region having strategic importance in the
international and regional trade from the long time and has acquired a dominant
position in the Gulf Co-operation Council (GCC). Large natural resources of oil and
gas, long standing cultural heritage and good political ties with countries around the
globe have earned an important place in the global trade, finance and economy for
Oman. Peaceful and stable governing of the country from 1970 onwards by Sultan
Qaboos along with development efforts and careful liberalisation approach by Oman
has created an admiring place for Oman in the GCC and global politics. Oman is
clearly well positioned with current development, economic transformation process
and major breakthroughs like Free Trade Agreement (FTA) with USA implemented
from January 2009. Oman has one of highest recognition in the region by scoring as
25th
on the global peace index, 41st in overall transparency index and 57
th in business
climate by World bank in 2008 (The Report OMAN, 2009).
The Government of Oman is in its seventh five year development plan, has created a
long term strategic vision for 1995 to 2020. Implementation of a recent privatisation
program has led to a surge of growth in local and foreign investments in industrial
sectors such as power and water. The goals of the plan include increasing and
accelerating economic transformation by enhanced focus on natural gas production,
tourism industry development, non-oil exports, development of human capital,

175
expansion of information, communication and technology (ICT) sector while
upgrading nation‘s overall infrastructure.
The country‘s major wealth creation or income source is still from petroleum and
natural gas resources i.e. oil and gas account for more than 90% of Oman‘s total
exports of goods and services. To provide a safeguard against low oil prices in the
world market, Govt. of Oman was one of the first nations in the region to establish a
state general reserve fund (SGRF) which is also known as Oman state general
stabilisation fund (OGSF) in 1980. This was the starting point of Oman‘s Sovereign
Wealth Fund (SWF) in 1980 which now comprises of four different funds: state
reserve fund, petroleum fund, national infrastructure fund and another fund started in
2006 named as Oman Investment Fund (www.SWFinstitute.org, 2011). These four
funds are under direct management of Ministry of Finance whereas other nine pension
funds which have only within the country investment permission are managed by their
respective functional ministry. For example, during high oil prices in 2008, approx.
US$150 a barrel, Oman‘s SWF added US$2.2bn to oil reserve fund which has been
estimated to have assets within the range of US$ 8.2bn to 13bn in September 2007.
Since, the creation of state reserve fund, Govt. has created twelve more funds as
explained above to protect the budget and to diversify investments for long term
growth and to deal with any future financial implications in the country (The Report
OMAN, 2009). Few recent moves of privatisation such as restructuring of power
transmission, postal services and solid waste management sector are in the process.
This shall increase competition for local companies to grow, to increase the availability
of more cost-effective and efficient services, foreign direct investments and freeing up
state finances for other essential and developmental projects. 5% to 6% GDP growth
has been maintained in the last five years as reported by Central Bank of Oman. Oman
has proven petroleum reserves of approximately 4bn barrels. This is a finite source and

176
therefore Oman government aims to transform the oil dependent economic position
into the multi-channelled and non-oil dependent economy like other developing and
industrialised countries around the globe. The government of Oman aims for the
country to become a major exporter with a particular emphasis on the manufacturing
industries.
Hence, the strategic aim of achieving economic balance and sustainable growth
depends on human resources development, economic diversification and private sector
development as laid out in the vision for Oman 2020. But, current polices have
inherent impediments to growth which is proven by slow growth of last three decades
of Oman SWF as compared to other GCC member countries whose SWFs have grown
more than hundreds of billions. Therefore, the major challenges for Oman and its
government are:
1. Increasing fiscal deficit in the general budget and declining financial reserves
2. Over dependence of the national economy on oil and oil price is largely
influenced by external financial market trends, economic and political forces
3. Finite oil reserve for the next two decades
4. Prominence of government role in other industries reducing opportunities like
private investors and innovation through increased competition
5. Lack of suitable monitoring and control mechanisms in financial and other
sectors
6. Weak integration between oil and other supporting sectors leading to low
quality output compared to international standards and industry benchmarks
7. Low efficiency and ineffective utilization of available resources
8. Labour market imbalances as increased foreign labours and low local
participation

177
9. Less significance to human capital development and few professions
10. Incapacity of local labour force to match global demand by technological
advances (Vision 2020 for Oman, 2007)
On one hand, the establishment and successful running of sovereign wealth fund seems
to be a promising solution for Oman. On the other hand, this wealth fund draws its
input from oil income. Hence, oil prices in global market and oil reserves with Oman
plays a significant role in the achievement of Vision 2020 for Oman. The impact on
SWF income from oil revenue can have magnified effects. For example, just one
standard deviation shock in the oil prices can take revenue decrease to 6% of GDP
when oil revenue is just 20% of GDP (Devlin and Titman 2004; Mitchell, et al 2008).
From these statistics, one can infer the turbulence effect of oil prices to Oman and its
SWF wherein oil revenue is more than 90% of their GDP. Countries like Chile and
Venezuela have designed their funds to offset such price fluctuations. Sometime,
during low oil prices, these governments may have to shut down the SWF investments
made during high oil prices if businesses are not performing well. This is costlier than
making wrong investments. This again becomes a major issue for decision makers in
the government and businesses. To reduce such effects, SWF shall have appropriate
investment strategy, profitable investments and steady inflow of the funds (Devlin and
Titman, 2004).
For country such as Oman, the profitable returns, growth and currency stabilization are
crucial to the direct impacts on the economy and lives of their population (Swensen,
2009). For example, if SWF is small compared to other countries and still a single
largest source to balance the financial system then it has two major problems:
managing the stability of the fund and maintaining the low profile without disclosing
strategic information unless big funds follow the lead. This is exactly the case of

178
Oman‘s SWF. This makes one to think about operating mechanism of decision making
and overall management within SWF. Hence, these practical challenges reveal the
importance of SWF for Oman‘s economy. One such attempt is made in this thesis by
analysing Oman‘s SWF in comparison with other well developed and profitable SWF.
The next section explains case analysis of Oman SWF.
5.4.2 The history and development of the SGRF
The Sultanate of Oman launched this State General Reserve Fund (SGRF) in 1980 by
Royal decree to manage the country‘s wealth from oil income, return from investments
and foreign exchange reserves of the Sultanate of Oman. SGRF is owned by Sultanate
of Oman and is managed by the Ministry of Finance (MoF). The monetary sources of
SGRF are foreign exchange reserves from oil and gas exports revenue and current
assets holding is worth approximate US$ 8.2bn to 13bn. The operational management
of SGRF is managed by Ministry of Finance (MoF). There are no regulatory
mechanisms applied by MoF and no such information is known to any other
government department.
The main problem in collecting secondary data was that SGRF has very low
transparency and degree of disclosure. This has resulted in no information about Oman
SWF in the public domain such as ‗no published reports‘ of any kind. Oman SWF
(SGRF) is not monitored by any government department except the Ministry of
Finance. This is known from initial discussion with Oman SWF employees. The effort
was made to get as much as possible information related to SGRF from reports of other
government departments such as Central Bank of Oman (CBO). The following
attributes explain the current status of SGRF, its strategy and operations.

179
5.4.3 Current status of the SGRF
The SGRF is analysed below for the same attributes of structure, management style,
governance, transparency, investment strategy, asset allocation and performance same
as in the case of Norway SWF to compare them.
5.4.3.1 Organisational structure
The Government of Oman has not applied any management or regulatory framework in
their wealth fund act. The formal responsibility of SGRF management rests with
Ministry of Finance (hereafter referred as MoF) where decisions are taken by the
discretionary powers of Minister of Finance. The funds inflow and outflow is
administered by Central Bank of Oman (CBO). However, SGRF is not treated as a
separate entity as in the case of Norway. SGRF has less than total 100 employees.
These employees are working for Ministry of Finance and they are not trained for
managing SWF, its investment deals or operations. There is no written agreement over
the shared roles of MoF and CBO however they are jointly responsible for managing
the SWF.
The main objectives and strategy of SGRF are not clear but the aim is to utilize the
income from the proceeds of oil, gas and petroleum products‘ revenue. Thus, it is the
responsibility of MoF and CBO to ensure the increase and profitable returns on the
investments made. The income from SGRF should reach to the population of Oman.
The following diagram show as on date relationship structure between Government of
Oman, Ministerial departments and Central Bank of Oman.
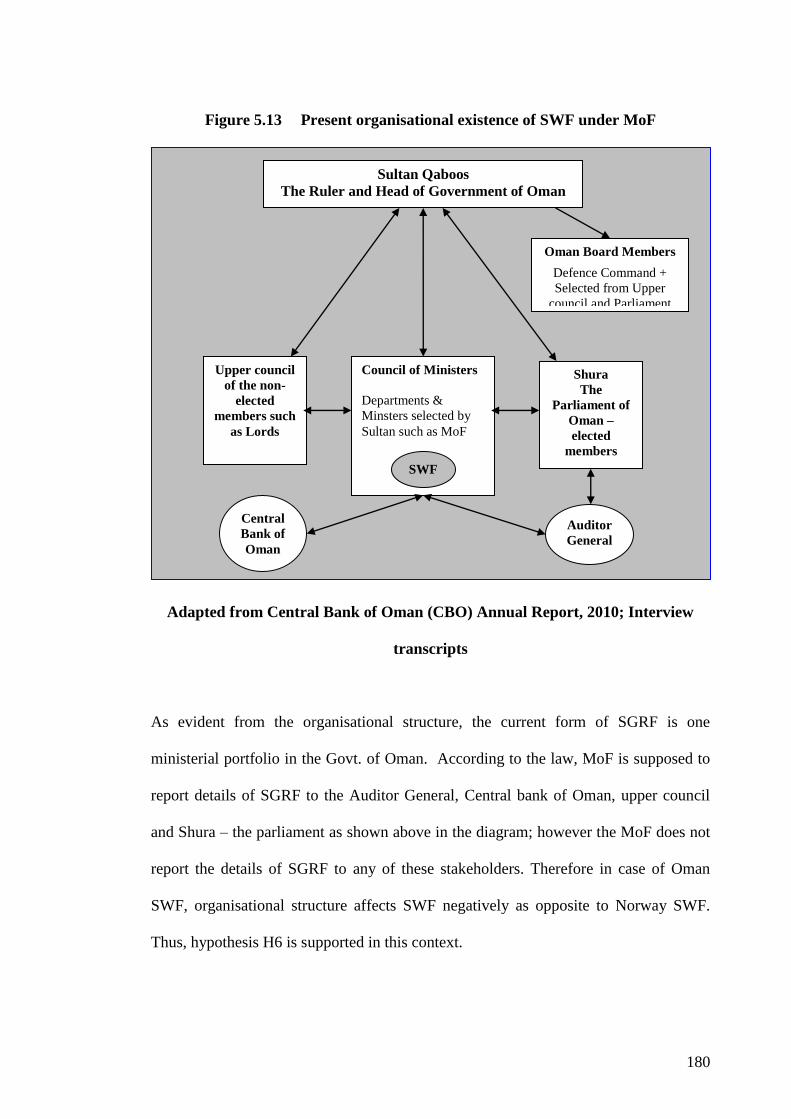
180
Figure 5.13 Present organisational existence of SWF under MoF
Adapted from Central Bank of Oman (CBO) Annual Report, 2010; Interview
transcripts
As evident from the organisational structure, the current form of SGRF is one
ministerial portfolio in the Govt. of Oman. According to the law, MoF is supposed to
report details of SGRF to the Auditor General, Central bank of Oman, upper council
and Shura – the parliament as shown above in the diagram; however the MoF does not
report the details of SGRF to any of these stakeholders. Therefore in case of Oman
SWF, organisational structure affects SWF negatively as opposite to Norway SWF.
Thus, hypothesis H6 is supported in this context.
Sultan Qaboos
The Ruler and Head of Government of Oman
Shura
The
Parliament of
Oman –
elected
members
Council of Ministers
Departments &
Minsters selected by
Sultan such as MoF
Upper council
of the non-
elected
members such
as Lords
SWF
Auditor
General
Oman Board Members
Defence Command +
Selected from Upper
council and Parliament
Central
Bank of
Oman
181
5.4.3.2 Management control and investment strategy
The SGRF has full support of the Government of Oman and Sultan however there is no
management control mechanism in the place. The only investment strategy component
implemented by SGRF is the limit on the inflow of the fund from oil income which is
currently 15%. The limit can be increased when oil prices are high which would enable
the asset base expansion, portfolio creation and the increased return. The other
fundamentals such as investment appraisal, asset allocation, measurement and
benchmarking of the performance of SGRF are missing from the current policies of the
MoF. Thus, current management and investment strategy requires the
$transformational and strategic changes in Oman SWF (Observations made in Oman
SWF, 2011).
5.4.3.3 Governance, Transparency and accountability
As evident from the above discussion of management style and very weak – unplanned
investment strategy it is easy to infer that employee skills are not utilized to grow the
fund. In addition, the MoF does not allow any other department or council to have
input in managing SGRF. Other government departments and top management of SWF
do not have up to date and accurate details about what is happening in Oman SWF.
There are no reports published in the public domain as well. Thus, governance and
transparency almost do not exist within the management of Oman SWF. No employees
or decision makers are held accountable if Oman SWF makes a loss in the investment
deal. Thus, profitability is a serious issue for SGRF.
As evident from no availability of data and absence of investment strategy and
governance, one can confirm that Oman SWF is largely affected by such attributes.
Thus, in this context hypotheses regarding governance (H1), policy (H4), structure
(H6), investment strategy (H7) and decision making (H8) are supported. Norway SWF

182
also supported these hypotheses however those were with the positive effects of these
attributes as maintained by Norway SWF.
5.5 Comparison between Oman and Norway SWF
The following table shows the comparison between Oman and Norway. Norway SWF
has scored high on each attribute and it is an ideal example from the competing
Norway SWF for Oman SWF. The priorities in the form of recommendation for these
SWFs based on their analyses and comparison are followed in the next sections. The
main priority difference between these SWFs is what Norway needs is reduction of
overdone mechanisms to grow further whereas what Oman SWF needs is to create
basic investment strategy and governance framework to accomplish the fund‘s
objectives further.
Table5.3 Comparison between Oman and Norway SWFs
Item Oman SWF Norway SWF Year started 1980 1990
Current worth In US$ billions 8.2 to 13 375 to 500
Major source of funds Oil and gas Oil and gas
Managed by Ministry of finance Ministry of finance
and Norges Bank
Truman scorecard ranking for structure,
governance, accountability, transparency
and management behaviour
20 / 100 92 /100
Organizational structure Present Present
Management control Absent Present
Government support Yes Yes
Strategic vision – approach Absent Present
Responsibility – Sustainability strategy Absent Implemented
Investment strategy Absent Implemented
Asset allocation fundamentals Random Mechanism based
Decision making Random As per policy
Governance standards Low High
Transparency level Low High
Overall performance achievement Not achieved Partly achieved
Sources: Secondary data from GPFG, Norway and SGRF, Oman; Truman (2008);
Anderson (2009)

183
5.6 Summary
The recommendations based on Oman and Norway SWFs analyses individually carried
out in this chapter are mentioned in the final conclusion chapter of the thesis.
It can be summarised that both of these SWFs support hypotheses from initial
theoretical framework proposed in chapter three; however, Norway SWF supports
these hypotheses as these attributes are managed and they adding value to Norway
SWF whereas Oman SWF do not have any of these mechanisms in place and same set
of attributes is negatively affecting the growth of Oman SWF.
Results of hypotheses support and evidence from these analyses are utilized in the
finalizing the framework in the next chapter of the thesis.

184
Chapter 6 Primary data analyses
6.1 Introduction
Chapter five described the detailed analyses of secondary data of Oman and Norway
SWFs. This chapter presents the analyses of the primary data obtained from Oman
SWF by conducting interviews and questionnaires. This chapter is divided into two
parts. Part A is describes interviews analyses and Part B does same for the
questionnaires.
Interview template is prepared based on the pre-set interview question set which was
used to conduct interviews. Based on this template, interview transcripts as listed in the
appendix E are analysed. This section is also part of the data theory as it utilises
primary data from interviews to find solution for research problem defined earlier in
the thesis (Philips and Pugh, 1994). Data collection using interviews was done before
collecting data through questionnaire so as to know in detail about Oman SWF and
maintaining the same order interview data is analysed first. Twenty interviews were
conducted and no recording was done during interviews. The transcripts are prepared
from the notes taken during interviews. These transcripts are produced in the appendix
E.
As mentioned in the secondary data of Oman SWF, it is known that there is no separate
recruitment section for Oman SWF and SWF does not have large number of
employees. Oman SWF is managed as a part of Ministry of finance and has very low
transparency. Thus to study Oman SWF in detail, it is very much necessary that if
direct employees are not available then information is sourced from relevant
stakeholders of the SWF such as members and employees of other government

185
departments, Shura council, state council, parliament, auditor general‘s office and
central bank of Oman. In this manner, twenty different stakeholders were interviewed
from various departments of Government of Oman.
The part B of this chapter represents quantitative and qualitative analyses of
questionnaires responses. This discussion leads one to build findings, validation,
recommendations and understand implications for theory and practice. Findings are
described, evaluated and compared with the previous research in the field of sovereign
wealth funds in general and growth of Oman sovereign wealth fund. Thus, this section
can be said to be part of data theory in this thesis according to Philips and Pugh (1994)
model of research process.
Questionnaire responses analyses are is divided further into three steps: first step
explains which statistical tests are carried out and their results; second step details the
finalization of the proposed framework based on the analyses of findings from
statistical tests results, descriptive statistics of questionnaire responses, interview data
and secondary data and academic literature. Finally, third step is to derive the
framework and check the validity of the findings.
The hypotheses made in the framework are tested based on the analyses of
questionnaires and interviews data analyses. The relationship between each factor
affecting and dependent variable growth of SWF is analysed using regression analysis.
The growth of SWF is defined as combination of two components in the proposed
framework: investment performance and success rate of the fund. Therefore, regression
analyses are performed for each component as detailed in the next sections of this
chapter.

186
6.2 Links between interviews and questionnaire analyses
Interview findings are obtained from the top management executives whose
departments are related in one or the other form to sovereign wealth fund of Oman.
Their views represent top priorities of policy changes required for restructuring Oman
SWF overall whereas questionnaire respondents are from middle and operational
management of these government departments. Hence, questionnaire responses
represent the operational, implementation and output related issues of managing
sovereign wealth fund of Oman. Thus, interview and questionnaire findings together
support the assessment of variables mentioned in the proposed framework. In addition
to this, table 6.2 shows that interview template themes are related to variables in the
proposed framework which is tested by analysing questionnaire data. Therefore, any
acceptance or rejection of hypotheses would be based on the questionnaire data
analyses and interview findings as well.
Part A: Analyses of interviews
6.3 Interview analysis method
Generally, interviews consists data of meaningful information expressed through
words, pattern and impacts (Saunders et al, 2009). Such data requires analysis
conducted through conceptualisation as it contains a collection of information in non-
standardised category. This would require one to categorise and unitise the data from
interview transcripts (Miles and Huberman, 1994). This is a challenging process when
one analyses a case study based on the interview evidence (Yin, 2009). Less structured
data from interviews needs an active interpretive approach as a major analysis
dimension. Adopting this approach allows one to transfer the nature of the qualitative
information, comprehend and understand them. To carry out a rigorous analysis of
interview transcripts, one shall identify key themes and patterns emerging from the

187
data to verify the conclusions. The general process followed for this is in the order of
categorising, unitising, recognising and developing the conclusions (Miles and
Huberman, 1994; Saunders et al, 2009). The same procedure is attempted here by
creating a template from the following set of the interview questions.
Table 6.1 Set of Interview Questions
1. Would you tell something about the current situation of sovereign wealth funds
position worldwide?
2. Where do you think, we at Oman SWF stand in comparison to others in terms
of credibility?
3. As mentioned in media from last two or three years, does Oman SWF have low
governance or transparency in its operations and investments process?
4. Is there any need for tit-for-tat approach between investee countries (recipient of
funds) and SWF sponsoring countries in creating barriers and new legal
systems to prevent each other?
5. As a separate entity from government administration, what are the improvement
points in Oman SWF?
6. One thing is always said in financial industry that Oman and other GCC funds
started together but our fund has not grown more than 10bnUS$, why so?
7. Does Oman SWF have any particular issues with investment strategy and
policies as reasons for underperformance?
8. How does the decision making process work in our SWF?
9. Where do we need to improve or to implement changes? Is it policy, resources,
people development, investment appraisal?
10. What do you consider are key criteria for sustainable growth of Oman SWF?
11. Where do you see Oman SWF in the medium or long term future?
From the highlighted features of interview questions following discussion themes are
extracted to get information related to them from interview transcripts and literature to
compare them.

188
Table 6.2 Themes of interview analyses
1. Current situation (Idea about SWF, H3)
2. Credibility through governance or transparency (H-1, H3)
3. Laws and treaties (H-2, H-4, H-5)
4. Investment strategy and growth concerns (H7, H8)
5. Decision making process (H8, H6, H7)
6. Changes to implement: policy, resources, (Restructuring, H4)
people development, investment appraisal
7. Key growth criteria (Dependent variable)
8. Future of the fund and points to improve (Recommendations)
As one can see these interview discussion themes are basically help to determine the
acceptance or rejection of hypotheses H1 to H8 along with discussion of restructuring
solution from the interview findings and potential of key growth criteria such as
profitability, investment portfolio performance and success rate of SWF decision
making. In the next section, above mentioned eight themes are analysed from the
twenty interview transcripts mentioned in Appendix E.
6.4 Analysis of Interview transcripts
This section analyses Oman SWF on the following points which are pertinent to its
future growth and success.
6.4.1 Current situation within Oman SWF
As evident from the voice of all twenty interviewees Oman SWF has a central decision
making authority which rests with government department: Ministry of Finance (MoF);
however, all major decisions are taken single handed by Minister of Finance. Other
councils such as Shura, Audit committee, Ministries or Parliament do not have any
control over it right now. Hence, one can say that the appropriate decision making
structure does not exist within Oman SWF and it completely lacks professional

189
management system in their decision making process. Previous research regarding this
suggests that having no professional management system in place or decisions made by
political leaders have significant impacts on the returns of the investment decisions
made by them (Bernstein et al, 2009). This approach of Oman SWF can be described
as a political perspective. This perspective argues that politicians have personal interest
to pursue their own goals and investment decisions taken by them on behalf of state
owned institutes or banks and these decisions are inclined towards the inefficient but
politically desired projects, such as maximizing employment to stay in power or
financing favoured enterprises (Shleifer and Vishny, 1994; Mitchell et al, 2008).
Political leaders or powerful elites holding control over SWFs portray their biased
decision as country level benefits maximisation; however the main aim is to retain the
control over the investment vehicle and money thus maximising their autonomy (Pistor
and Hatton, 2011). This is one of the main reasons that GCC SWFs and Oman SWF
score low on reputation and popularity scales such as Truman (2008) scorecard.
A political perspective in all decisions during all three decades can have significant
impacts on the return of portfolio. That may be the very reason why Oman SWF is at
US$ 8 to 13billion, which is lagging behind other countries in the region by 50 to 100
times. ADIA (United Arab Emirates) approximately 800bn, SAMA (Saudi Arabia)
approximately 500bn and KIA (Kuwait) approximately 300bn have in assets and
wealth creation. They all started SWF together almost three decades ago. Interviewee
(18) suggested that around the globe many SWFs are managed by finance ministries
(MoF) and central banks, hence, it is not a major issue that Oman SWF is managed by
MoF. The problem is that how we are operating and not being serious about
profitability of the fund. One must remember that there is no single owner of this
money; this belongs to all citizens of Oman. The agency or stewardship of the
monetary reserves then becomes crucial for the whole country. Hence, it is policy

190
makers role to decide how much reserves are adequate and what can be done with them
if a balance of payment crisis comes on. The answers to such questions would help the
Government of Oman to set up basic policies and operational framework for SWF (Das
et al, 2009 IMF working paper). In this scenario, single handed management by Oman
MoF raises more questions about its SWF credibility which is measured in terms of
governance, transparency and accountability in the wealth fund industry as discussed in
the next section.
6.4.2 Credibility of the fund: Governance and transparency (H-1)
Interviewee (11) mentioned that credibility is a momentary issue for Oman SWF
because there is no organizational structure and transparency right now. Once
restructuring is done, the fund will not have any problem of governance and credibility
because the business and national culture of Oman has good values and high morale.
That is how Oman has scored high in the world competitiveness, corruption and
business confidence indices compared to other GCC region countries. However,
Keynes (1933) stated long ago that international cash flows have political elements and
Cohen (1986) made a similar argument that high finances and high politics are
inseparable. In a time of exponential growth of SWFs worldwide, the claim rests with
SWFs to prove a point that their investment decisions do not carry any politically
biased agenda (Clark and Monk, 2010). USA Senator Schumer (2008) said that the
bottom line of SWF investments is that investee country governments have no
knowledge whether SWFs are investing purely on economic motives. These
researchers and practitioners suggest that SWFs have issues of credibility of their
actions inherent in their investment decisions. And, these SWFs target assets
strategically through large pool of foreign exchange reserves from oil or commodity
income. The US Govt. Accountability Office (GAO, 2008), Truman (2008) and

191
Anderson (2009) suggest that credibility or reputation of SWFs can be measured in
terms of transparency, governance and accountability. These three components make
up the overall reputation or credibility of these SWFs. Also, the institutional structure
and setting up objectives adopted by the sponsoring country can reveal more about the
credibility and purpose. Because, SWFs are likely to differentiate and evolve according
to their national cultures and their respective places in a world of contested power and
influence (Clark and Monk, 2010). Current unplanned operations and single handed
management is reflected in the following comparison between two case studies SWFs
Oman and Norway shows that Oman has a very low score on the credibility.
Comparison between Oman and Norway SWFs
Compared for Oman SWF Norway SWF
Established in 1980 1990
Operating as State general Govt. pension
reserve fund fund – global
Main Income source Oil and gas Oil and gas
Current size in US$ 8 to 13bn 375bn
Best practice score achieved in Truman’s score card
Structure 50 94
Governance 0 100
Accountability & 18 100
Transparency
Behaviour 0 67
Overall score = 20/100 92/100
Source: Truman, 2008
As confirmed from the interviewee responses, the causes for such a low credibility
score as shown above in the comparison for Oman SWF arise from complete lack of

192
organisational structure; no reporting on investment and return; no reporting on reserve
inflow and outflow of SWF; no planning for budget – investments or portfolio return;
no professional assets or profit protection management. These problems come from
two basic elements within SWFs. One is disclosure and other is new mercantilism
(Gilson and Milhaupt, 2008). Disclosure issue is about being transparent in releasing a
true account and information to the public domain. Many developed countries funds do
this and they score high on Truman‘s score card; for example – Norway and Singapore.
This is completely absent in Oman SWF as stated by Interviewee 1 that
―Parliamentary committee for economy and finances in Oman should have received
separate reports, plans and budgetary details from SWF management but there is
none‖. In addition to these, issues of no control over decision making and no
knowledge of how fund is operating were voiced by other interviewees 7, 15 and 19.
Oman SWF has never published annual report regarding their investment transactions.
This is evident from the following figure 6.1 where Oman SWF compares too much
low on a transparency scale with other GCC funds whereas Norway and Singapore are
on the positive side of the transparency scale.

193
Figure 6.1 Transparency and investment approach of Top 20 SWFs
Source: Standard and Chartered Bank Research Report, 2007
This is like a chain reaction in the investment industry. ‗No disclosure‘ leads to ‗zero
transparency‘ which again leads to speculation about governance and reduces trust in
the markets about the SWF. Interviewees stated that low credibility score of Oman
SWF emerges from less transparency and no information availability to Omani citizens
or foreign governments or companies. When company adopts such policy it reflects in
the employee behaviour and organisational culture while no one is accountable. The
more of this chain reaction works more it harms investors, fund and reputation of the
sponsoring country (Monk, 2009; Clark, 2009; Anderson 2009).
Interviewee 16 suggested that ―main function of the state council is to take part and to
support better governance through its operating mechanism and fundamental
principles‖ such as overseeing the governance and transparency of Oman SWF but
there is no control over it in the present system. Thus, governance and transparency are
at the lowest possible level for Oman SWF and employees are not accountable or
Commodity
Non-
commodity

194
responsible as they are not allowed to make any decisions as managers or custodians of
the SWF. This takes overall credibility of Oman SWF to a very low level in the
investment markets. Such a low credibility leads to an issue of new mercantilism which
again reduces the credibility of Oman SWF. In the developed and democratic political
economies, individual companies‘ profit maximisation is encouraged. Governments are
prohibited to shift the profit maximisation from companies to state. Various rules and
mechanisms are designed in WTO and EU for this. Contrary to this in some major
developing (China) or monarchist countries (GCC Region) adopt the state capitalism
that is new mercantilism (Yi-Chong, 2009). In this system, state takes the role of an
organization whose benefits are to be maximized wherein government acts as a direct
participant, coordinator or controlling stakeholder (Gilson and Milhaupt, 2008).
Developed economies believe that free trade and competition amongst companies
within industries increases their respective GDP levels. In the case of developing and
emerging economies having SWFs, states act through SWFs holding the equity of
operating companies and attempt to be in the industry competition. Then, these SWFs
ensure that investments results in the maximization of economic, social and political
benefits of the country (Gilson and Milhaupt, 2008). Hence, these SWFs compete with
advanced companies or banks or investment banks in the investments field. In this
way, Oman SWF has become a part of new mercantilism; however they are not able to
maximize any benefits of state capitalism characteristic since there is no accounting
within Oman SWF (Gilson and Milhaupt, 2008, Pistor and Hatton, 2011). Thus, it can
be inferred from the discussion that governance and transparency are major attributes
right now affecting the growth of Oman SWF. This supports the hypothesis H-1 in the
framework and related factors impacting SWF. Therefore, Oman SWF has to
restructure and to create a governing mechanism based on laws within the

195
administration and support of other countries in trade through bi-lateral treaties as
discussed next.
6.4.3 Laws and treaties (H-2, H-4, and H-5)
At present there are no law or regulation within SWF or treaty with any other country.
That means Oman SWF is not benefiting from any credit crisis investments and asset
creation when most of the assets are undervalued which may provide huge return in the
next decade or so. Also, the absence of legal structure allows many lapses on the part
of SWF management with MoF and for employees within the SWF as they become
unaccountable for their actions. As suggested by Interviewee 10, both MoF and Oman
SWF do not have any strategic objectives laid out except Vision 2020 prepared by
Govt. of Oman but that is in the perspective of the whole country. Interviewee 6 adds
that there are no ethical guidelines, no evaluations or audit of actions – decisions
taken, no risk management tools. Government of Oman still runs finances based on old
systems of central command chain and thumbs rules for decision making‖. Interviewee
17 who works in parliament knows the IMF response to SWF growth and he expressed
concern over increasing protectionism from either side: SWF sponsoring governments
and investee countries governments mainly Europe and America. Thus, interviewee 17
agreed with an idea of setting up an overarching global SWF regulatory body which
can facilitate resolving any issues between both sides and also help in research and
development. This will directly reduce the task of creating favourable mechanisms
through laws and treaties by many governments around the world (Greene and Yeager,
2008; Kotter and Lel, 2011). Other funds such as Norway, Singapore and Kuwait
operate on the basis of planned investment strategies, regulations, and disclosure
principles (Greene and Yeager, 2008; Chhaochharia and Laeven, 2009), whilst
regularly reporting to their respective central banks or government committees and
have trade treaties with other countries to attract investments (Rose, 2008). These legal

196
and trade mechanisms enable them to increase their reputation which results into
increasing return and asset base. As confirmed by Interviewees, Oman SWF does not
have any of these initiatives. Unless these basic and required initiatives are in place,
any advanced steps of asset allocation principles and investment strategies preparation
would not help Oman SWF. The first need of Oman SWF is legal and organisational
structure to be built.
The above discussion reveals that every investee and sponsoring country is creating
mechanisms which ultimately work as barriers rather than growth enablers. This was
found in the literature as well. This supports the hypotheses H-2, H-4, and H-5 which
states that investee country laws, sponsoring country laws and policy making heavily
impact the growth, performance and success rate of any SWF.
6.4.4 Investment strategy and growth concerns (H-7)
As stated by Interviewee 1 ―Oman SWF has is no fixed limit on how money will come
to SWF from oil income or how the return of SWF investments will be reinvested.
There is no audit, annual budget planning and investment return reconciliation
process in managing Oman SWF‖. In addition to this, the Ministry of Finance which
manages Oman SWF right now, neither wants to consult any other government
departments, nor wants to utilise the services of consultants, asset managers or
investment banks for investment strategy and growth (Interviewee 3). This is part of
the major irregularities found in the operations of Oman SWF. The investment
decisions are not analysed for any risk or return; however the MoF randomly decides
the allocation of funds in the transactions purely based on either the political agenda or
trade relations in the investee country. This affects the profitability and growth of the
funds (Interviewee 1). As known from the literature, the basic objective of setting up
the sovereign wealth fund is to multiply the surplus income of accumulated foreign

197
reserves. Hence, their investment strategy should be handled in such a way that would
enable the growth in assets and return on investments made (Gintschel and Scherer,
2008). This would be possible when a fund has designed a governing mechanism, for
example Norway SWF has fixed rules for inflow and outflow of money to and from
SWF. Contrary to this, Oman SWF does not have any investment strategy. Since,
SWFs do not disclose much their objectives whether political, strategic or financial;
they remain unknown to the public (Summers, 2007; Gieve, 2008). This tendency of
political influence or non-financial basis for decision making may lead to the investor
biases for the investments being made. Chhaochharia and Laeven (2009) suggest from
their study of 40,000 foreign equity investments by SWFs during 1997 – 2007 that
SWFs tend to invest outside their countries where in areas with which they share
religion and culture, but which offer different industries than those in the sponsoring
country. Thus, SWFs seek industry diversification but have bias for the familiarity of
the culture. This may help in gaining information advantages or give a psychological
advantage of feeling cultural affinity. They also observed similar bias by mutual funds
and other global institutional investors in their asset allocation; however SWFs have
pronounced bias for the culture. The other finding in their study revealed that when
SWFs announces such investments then share prices of the investee companies respond
favourably in the stock markets. This rise in the share price may be the reason that
investee market expects the SWFs to bring expertise and governance leading to the
growth for that company. And, when SWFs do not necessarily have a reputation for
governance such as many GCC funds, the announcements of SWFs taking a stake can
act negatively on the stock market‘s performance. This effect has been voiced by many
academics and analysts (Gieve, 2008; Balin, 2010). Since Oman SWF does not have
any organisational structure or investment strategy in place, it requires an overhaul in
these aspects along with organisation design and development issues. These issues are

198
basically arising from Oman SWF not having decision making structure comprising
board of directors and middle and operational level employees. For example, another
GCC fund ADIA (UAE) has low governance score as transparency is very low due
very limited disclosure; however, ADIA employs expert employees from more than 40
countries and 1200 staff manages ADIA which has only 30% staff which are local
UAE citizens (www.adia.ae, 2011). SWF investment objectives reveal their
overarching investment strategy and primary goals; however fundamental differences
in asset allocations can have underlying existence even among SWFs of similar
professionalism or political economies (Dewenter et al, 2010; Hong, 2010). For
example, this can lead to competition between similarly structured SWFs such as
China and Singapore; or Kuwait and Abu Dhabi (Pistor and Hatton, 2011). The recent
global crisis and protectionist behaviour of Western governments might have changed
SWF‘s asset allocations in ways but they may not be ideal or justified by financial
management theories in all cases. Thus, it is imperative for SWFs to regularly monitor
macro-economic risk assessments for countries whose SWFs is important for economic
growth as a stabilizer in the capital markets (Kunzel et al, 2010; www.IMF.org, 2011).
The shift of investments to Asian developing markets and MENASA region may
increase if western government continue their attitude towards governance and
transparency demands (Interviewee 16). What interviewees conveyed is that
investment strategy fundamentals are missing from Oman SWF‘s strategy, if any. This
really matters in the time when other funds within and outside GCC regions are
competing for valuable assets to make investments. Thus, responses from interviewees
support the hypothesis H-7 about investment strategy, deal and asset allocation. Such a
detailed response and investment planning requires a robust decision making structure
and process as discussed next.

199
6.4.5 Decision making process (H - 8)
The Oman SWF is managed by the Ministry of finance and mostly all the SWFs
around the world are overseen by either their central banks or finance ministries.
Hence, there is nothing wrong with Oman SWF getting managed by the finance
ministry. The problem is in the content and implementation approach which stems
from the rest of the organisational structure. Thus, the problem for the Oman SWF
decision making is that only one person, the Minister of Finance, is making the
decisions. In this manner, Oman SWF is not operating and administered as an
investment agency but as an individual decision maker‘s portfolio. The authority is
totally centralised and there is no employee participation (Interviewee 10). Also, MoF
does not seek any employee participation or does not invite any other government
department to collaborate (Interviewee 20). Also, it is evident from almost all
responses of interviewees that finance minister keeps decision making to himself and
no one else has any control (Interviewees 1, 2, 5, 9, 18 and 20). Therefore in
management terms, Oman SWF has a top-down traditional organisational hierarchy
and communication structure. Other SWFs which are reviewed in the literature have an
organisational structure and professional employees or hired consulting wealth
managers working for SWFs; for example, ADIA, Norway, Temasek or SAMA.
Therefore, this area of Oman SWF also requires serious restructuring. On the other
hand, the reason why decision making structures are so complex in these SWFs might
be the control their ruling elite wants to exert over the fund and thus control the
community. This can be well explained by the autonomy – maximization concept in
which authorities taking decisions for SWF want to maximize their autonomy by
having control over SWF through reporting structure suited to them and at the same
time exploiting financial strength of the foreign reserves around the globe. This has

200
been examined and found in the four case studies of Abu Dhabi, Kuwait, China and
Singapore SWFs (Pistor and Hatton, 2011).
The above discussion reveals that organisational structure and decision making
appropriateness are crucial to the success and performance of SWF. Therefore, analysis
supports the hypothesis H-8. Particularly, in case of Oman such a decision making
structure serves the purpose for the finance minister. From this discussion of current
situation in Oman SWF, it is evident that Oman SWF needs an overhaul restructuring
in terms of each aspect of organisation design in addition to special requirements of
creating a profitable and growing investment vehicle.
6.4.6 Changes to implement: policy, resources, people development and
investment appraisal (Links to restructuring solution)
This section of the discussion does not deal with any hypothesis; however it reveals
that Oman SWF requires overall restructuring; hence it supports the proposed solution
of the restructuring plan as mentioned in the final conclusion chapter in this thesis.
The first change required is to create a reporting structure for Oman SWF (Interviewee
2, 17). This is in terms of making SWF overseen by Oman central bank/ ministry with
reports audited by main audit council and guidelines prepared by the Shura and
Council of ministers. In this way, the decisions made by Ministry of Finance would be
reviewed by other departments and council thus bringing accountability in the
operations of Oman SWF (Interviewees 10, 14).
Once this basic framework is prepared then, next step would be to decide which
information and when Oman SWF would like that information to go to public domain
through online reports, official filing of annual reports and financial statements to the
audit and revenue authorities of Government of Oman (Interviewees 4, 18). This would

201
increase the governance and transparency creating a good image of SWF among all
stakeholders: employees, citizens and foreign governments who are more concerned
about these issues (Interviewees 7, 12, 20).
Third step would be to recruit the best talent who can move Oman SWF forward with
profitability and growth while increasing the asset base (Interviewee 1, 3). This has
been done by other GCC funds such as ADIA, SAMA and KIA who have more
employees from around the world as an expert working for them. This will help in
creating the competitive and international level work culture (Interviewee 18).
This group of expert employees may help in crafting a robust investment strategy and
optimal asset allocation for Oman SWF (Interviewee 5). Thus, a complete
organisational restructuring of Oman SWF in terms of reporting structure, policies,
information communication, recruitment and investment strategy would help to
improve the intangible attributes such as governance, transparency and accountability
while brining the tangible growth and profits.
6.4.7 Key growth criteria
The above discussion about Oman SWF and previous sections analyses about Norway
and Oman from its secondary data reveals that Oman SWF needs to set up policies and
investment mechanisms which would then make SWF capable of profitable growth.
Hence, Oman SWF has key criteria which can lead to sustainable growth profits in
years to come can be based on their achievement of organisation restructuring,
governance and transparency mechanisms, human capital development and appropriate
asset allocation based on the robust investment strategy.

202
Part B: Analyses of Questionnaires
6.5 The field work reporting
The data collection through questionnaires was personally administered to collect
responses from SWF and other government department employees. More than 350
respondents were contacted to respond and 153 questionnaires were finally received.
The questionnaires were personally administered which enabled the accuracy and
completeness of responses. The first phase of primary data collection was conducted
through 20 face to face semi-structured interviews of senior management employees in
Oman SWF and Govt. of Oman. Semi-structured interviews were conducted for in-
depth analyses of issues pertaining to governance, decision making and to know
mainly what is happening in Oman SWF. The objective of questionnaire data was
measurement and correlations assessments between variables whereas objective of
interviews data was to explore and to explain.
6.6 Results of Principal Components Analysis (PCA)
A total of 153 questionnaire responses were received from 350 questionnaires
launched. All 153 questionnaires were coded into an excel worksheet. Each
questionnaire has four parts section A, B, C and D. Regression analysis is deployed for
sections A, B and C whereas pie charts are produced to analyse responses of section D
which contains multiple choice questions about decision making process of Oman
SWF.
The coding has been done in the following style for each question in the questionnaire.
For example, the first question in the questionnaire is about main objectives of the
SWF then their entries read as follows: The first five characters consists from the what
is the measure about and then last three characters belong to the main variable they are
measuring, in this case it is objectives so rounded off as OBJ.

203
Question in the main questionnaire
1 Main objectives
EXPENOBJ REVENOBJ DVLEPOBJ CHANGOBJ RETRNOBJ STABLOBJ BILTLOBJ PLTCLOBJ DEMNDOBJ
All above dimensions coded as above were entered for their responses value from each
questionnaire responses in the excel file and then transferred to statistical software
SPSS. The total questions in each questionnaire are 155 which has in total 140
dimensions measuring independent variables which is quite large for use in the
multiple regression. Therefore, principal component analysis is applied as a tool for
reducing the data if any measures are found not required to be included in the
regression analysis. The results of principal component analysis are given in Appendix
B (Pallant 2010).
PCA generates several diagnostic plots, such as the bi-plot, loading plot, score plot and
scree plot. The useful measure from PCA results is Kaiser-Meyer-Olkin test of
sampling adequacy whether factor analysis or PCA is needed to be carry out or not.
The required limit is 0.6; however, the researcher has used 0.4 as most of the results
have been reported for this test range between 0.4 and 0.6 (Pallant, 2010). The PCA
results in Appendix B include KMO test, total variance explained, scree plot, un-
rotated component matrix, communalities and component score coefficient matrix. The
Eigen values of more than 1, scree plot elbow shape change (change in the gradient of
the graph showing the appropriate Eigen value), components extracted and their
coefficient values have enabled to decide which measures to be considered in further
analysis or to be dropped from calculation of variables values for regression.
The PCA was run separately for each individual construct in the questionnaire (the
questionnaire grouped the indirect measures in the form questions on scale of 1 to 7
Likert scale, each with a defined theme. In order to preserve the integrity of each

204
construct the PCA was carried out individually for each construct with the aim of
reducing the number of questions in each construct. A number of extracted principal
components revealed several combinations of measures and explain how much
variance is explained by each measure and principal component. The decision to retain
or to drop the measures for a construct was based on variance explained value of
correlation coefficient of measures and component structure. The threshold of
coefficient was considered at 0.4 in this case. Two dependent variables in the
framework are performance and growth (success rate) of Oman SWF.
The following measures were discarded from the questionnaire responses before
proceeding to the regression analysis based on their results from principal component
analysis. These measures were either not reflected
Table 6.3 Measures dropped from Regression analysis
Question Construct Measured dropped from regression analysis
1 Main objectives REVEN OBJ
1 Main objectives RETRN OBJ
2 Structure DECIS STR
6 Global Laws FAIRG LAW
6 Global Laws WEAPN LAW
14 Asset allocation CAPTL ALO
17 Investment Strategy MKTRS GLC
17 Investment Strategy STAFC GLC
17 Investment Strategy LACPL GLC
Since only 9 measures are reduced, it can be seen that data is not reduced considerably.
The single component structure is not used to retain or to drop the measures but has
analysed all extracted factors, plots generated and their coefficient values pattern from
the results of principal component analysis keeping in view not only statistical
significance of the measures but the substantive importance as well (Neuman, 2006).

205
Once the measures for regression analysis were finalized, the average value of each
construct was calculated. The 25 questions in the questionnaire represent indirect
measures of 12 independent variables, 2 dependent variables and 3 possible intervening
variables. Thus, many overlapping constructs according to their relevance were
grouped together to measure single independent variable. Finally, 17 variables in the
framework were analysed for relationship between them applying multiple regression
test.
Multiple regression is the most appropriate test as the research question testing the
framework is: how much of the variance in the set of dependent variable – susntainable
growth of SWF can be explained by the set of independent variables such as laws,
planning, objectives. Also, the regression results in this study show that which of the
independent variables has greater impacts on the growth of SWF as a better predictor
of these dependent variable. Following results were obtained in each case. Multiple
linear regression tests require conditions of normality, linearity, homoscedasticity
and independence of residuals, which are satisfied as shown in the following plots
and Appendix D. The results for dependent variable 1 and dependent variable 2 from
each graph of versus order, distribution, fit and normality suggest that these regression
conditions are met in each run of the linear regression (Pallant, 2010).
6.7 Regression analysis for dependent variable 1: performance of
SWF
As shown in the appendices C and D, the normal probability plot is almost strainght
line and scatter plot is rectangularly distributed with most of the scores around zero
point which collectievly suggest that assumptions of outliers, normality, linearity,
homoscedasticity and indepedence of residuals are satisfied from the regression results
(Tabachnik and Fidell, 2007; Pallant, 2010). Multi-collinearity can be explained from

206
correlations table in appendix D. Coefficient table shows two important columns
tolerance and VIF. None of the tolerance values are below 0.10 and VIF values above
10. Hence, independent variables are not highly correlated between them. ―Tolerance
value explains how much of the variability of the specified independent is not explained
by other independent variables. VIF is the variance inflation factor which is the inverse
of tolerance value‖ (Pallant, 2010, p.183).
No group of independent variables are highly correlated except governance and
transparency 0.686, purpose and investee country laws have 0.699 correlations which
indicate a strong relationship, implying that they impact each other. Therefore, the
condition of multi-collinearity is met. On the other hand, none of the independent
variables are significantly correlated to the dependent variable of performance of
Oman SWF as the highest correlation is 0.143 between decision making and
performance. However, governance, accountability, investee country laws, lack of
planning, investment strategy issues and deal size shows negative correlations which
state their inversely proportionate variation with performance of SWF.
In the coefficients table, two most important columns are standardized coefficients
Beta values which indicate the contribution of each independent variable to make
dependent variable. None of the values in the table is more than 0.4 – the usual limit
specifying contribution strength. The significance column has ‗no value less than 0.05‘
which explains that none of the variable is making any significant contribution towards
the regression equation. This may be due to overlap between independent variables in
the model (Tabachnik and Fidell, 2007; Pallant, 2010).

207
The regression model summary as shown below for performance as a dependent
variable shows that R square value is 0.062 which means that model is able to explain
only 6.2% variation in this case. This is not significant. Also, ANOVA table for
dependent variable 1 shows the significance value .678 which again does not match the
criteria of p<0.0005. Hence, these independent variables and their measures do not
predict any change in the performance of the SWF as a dependent variable. Therefore,
the results of Multiple Linear Regression for dependent variable performance of SWF
is not predicted by set of independent variables significantly and thus, do not support
any of the hypotheses in the framework.
Table 6.4 Regression analysis results for performance of SWF
Model R R square Adjusted R
square
Std. Error of
the Estimate
1 .249 .062 - 0.018 0.659
ANOVA
Model Sum of squares Df Mean square F
Regression 4.025 12 .335 23.773
Residual 60.780 140 .434 Significance
Total 64.805 152 0.678
Dependent Variable: Performance of SWF
6.8 Regression analysis for dependent variable 2: success rate of
SWF
As revealed from the straight line normal probability plot, rectangularly distributed
scatter plot, all tolerance values above 0.1, and VIF values below 10 that assumptions
of outliers, normality, linearity, homoscedasticity and indepedence of residuals are
satisfied from the regression results in Appendix D2 for independent variables and

208
success rate (or growth) as a dependent variable (Tabachnik and Fidell, 2007; Pallant,
2010).
As shown in table 6.5 of correlations results from multiple linear regression analysis,
many of the independent variables are significantly correlated to the dependent
variable of success rate of SWF as the highest correlation is -0.673 between lack of
planning and success rate. However, accountability, sponsoring country laws, lack of
planning, investment strategy issues show negative correlations which state their
inversely proportionate variation with the success rate of SWF.
In the coefficients table, other two important columns are standardized coefficients
Beta values which indicate the contribution of each independent variable to make
dependent variable. The usual significance limit is 0.4 or more, however in this case
variables such as governance (0.351), transparency (0.267), purpose (0.391) and
decision making (0.125) contributes more than other independent variables to make the
success rate of SWF. The significance column has no value less than 0.05; however
governance (0.068), planning (0.093) and asset allocation (0.59) can be considered
significant to an extent as compared to significance values of other independent
variables. Other variables not contributing much to regression equation of success rate
can be attributed to the overlap between independent variables in the model (Tabachnik
and Fidell, 2007; Pallant, 2010). Following table 6.5 provides correlations results
generated as an output of multiple linear regression analysis test in SPSS.

209
Table 6.5 Pearson correlation results for Success rate of SWF
Correlations
Pearson
Correlation
SUCC
ESSR
ATE
GOVER
NANCE
TRAN
SPAR
ENCY
ACCO
UNTA
BILIT
Y
INVE
STEE
LAW
S
TRAD
EBAL
ANCE
PLAN
NING
SPON
SORL
AWS
PURP
OSE
INV
EST
RAT
EGY
DEA
LSIZ
E
ASS
ETA
LLO
CAT
DECI
SION
MAK
E
Success Rate 1
Governance 0.508 1
Transparency 0.086 0.686 1
Accountability -0.256 -0.101 -0.084 1
Investee Laws
0.478 -0.048 -0.01 0.06 1
Trade Balance 0.038 -0.312 -0.29 0.098 0.093 1
Planning -0.673 0.194 -0.039 0.21 0.034 -0.464 1
Sponsor Laws -0.108 0.048 -0.013 -0.191 -0.048 -0.196 0.222 1
Purpose 0.389 0.193 0.111 0.016 0.699 0.059 0.321 -0.133 1
Invest Strategy -0.074 0.009 -0.019 0.125 0.067 -0.067 0.055 -0.092 0.037 1
Deal Size 0.048 0.211 0.149 0.005 -0.019 -0.109 0.054 -0.038 0.126 0.031 1
Asset
Allocation 0.037 -0.027 -0.075 0.089 -0.044 0.058 0.282 -0.233 -0.011 0.101 -0.132 1
Decision
Making 0.074 0 0.007 0.244 -0.041 0.063 0.378 0.239 -0.054
-
0.109 -0.072
-
0.034 1
The model summary for success rate as a dependent variable shows that R square value
is 0.536 which means that model is able to explain 53.6% of variation in this case
which is again significant. Also, the following ANOVA table for success rate as a
dependent variable 2 shows the significance value 0.0056 which does not satisfy
condition of p<0.005, however it is can be considered significant to an extent. Hence,
asset of selected independent variables and its measures predict any change in the
success rate of SWF as a dependent variable. Therefore, results of multiple linear
regression reveals that dependent variable success rate of SWF can be predicted by
independent variables significantly supporting selected hypotheses for independent
variables which are considerably correlated to success rate.

210
Table 6.6 Regression analysis results for dependent variable success rate of SWF
Model R R square Adjusted R
square
Std. Error of
the Estimate
1 .732 .536 0.507 0.498
ANOVA
Model Sum of squares Df Mean square F
Regression 5.034 12 .237 112.78
Residual 31.745 140 .267 Significance
Total 36.779 152 0.0056
Dependent Variable: Success rate of SWF
6.9 Regression analysis results’ for dependent variables and
possible solutions, changes and impacts on progress
In the final questionnaire, a set of three questions explored any hidden dimensions or
relationships amongst dependent variables with issues about change, progress and
possible solutions. These stem from secondary data and the existing status of Norway
and Oman SWFs. These three set of questions were divided into possible solutions,
changes required and impacts on progress. The regression analysis was carried out
twice with each dependent variable of performance and success rate for these three
variables.
The following tables show that performance is not significantly impacted or cannot be
predicted by three independent variables of solutions, changes and impacts. Table 6.8
model summary of success rate as a dependent variable shows that 42.7% variance in
the success rate can be explained by these three variables however significance of their
correlations is very low having a significance value of 0.077 which is much more than
the limit of 0.005.

211
Table 6.7 Regression analysis results of dependent variable performance and
three predictors: solutions, changes and impacts
Model R R square Adjusted R
square
Std. Error of
the Estimate
1 .220 .049 0.029 0.6433
ANOVA
Model Sum of squares Df Mean square F
Regression 3.144 3 1.048 2.533
Residual 61.661 149 .414 Significance
Total 64.805 152 0.0059
Table 6.8 Regression analysis results of dependent variable success rate and three
predictors: solutions, changes and impacts
Model R R square Adjusted R
square
Std. Error of
the Estimate
1 .681 .427 0.413 2.29
ANOVA
Model Sum of squares Df Mean square F
Regression 7.970 3 2.998 67.417
Residual 33.399 149 1.224 Significance
Total 41.369 152 0.077
Dependent variable: Success rate of SWF Predictors: Possible solutions, change
and impacts on progress
Based on the above mentioned results of principal component analysis and multiple
linear regression analysis, testing of proposed hypotheses is discussed in the next
section.
6.10 Hypotheses testing
The previous two sections have helped to reduce the data and to analyse the
relationship between independent variables and dependent variables. The regression
models signify the statistical substance of the proposed framework; however it does not

212
take into account the majority voice of respondents for each factor as data reduction
does not take into account variables beyond certain Eigen value. This does not mean
that rest of answers do not have any significance in this research study. Therefore, one
would also utilize the descriptive statistics and interview findings for each important
variable in the framework and plot the responses mean to understand its significance.
Thus, each hypothesis is tested and discussed with the help of five types of supporting
evidence: regression analysis results, interview findings, descriptive statistics,
secondary data and literature. This is the evidence of triangulation application in terms
of data collection and methodology. This increases the validity and reliability of the
findings and recommendations further as it reduces chances of errors and biases. For
regression results‘ evidence, values for dependent variable 2: success rate is only
considered as that of the significant model which can explain variance in the
sustainable growth of SWF.
H1a: Better governance increases the growth of SWF.
H1b: More transparency provides more confidence from investment recipients
leading to higher growth prospects.
H1c: More accountability towards investee and sponsoring countries creates better
system of managing SWF thus creating favourable conditions for growth of SWF.
This first hypothesis is about the positive influence of governance reforms on
developing and applying mechanisms to increase governance, transparency and
accountability. It states that increased governance can lead to increased transparency
in the transactions and accountability acceptance by managers of SWF, ultimately
resulting in the better management of the SWF. An improved corporate image will lead
to overall worldwide acceptance in the financial markets as an institution to trust its
investment deals. In turn, this governance and transparency may increase the internal
employees‘ morale and performance both as their accountability for the actions taken
on behalf of the fund would increase.

213
The correlation value of 0.508 between governance and success rate of Oman SWF in
the above table 6.5 suggests that governance mechanisms can help SWF to grow. The
current status of Oman SWF from the following graphs reflects the same that
employees (questionnaire respondents) agree on the requirement of Oman SWF need
of reforms and increased governance and transparency. Thus, respondents have
confirmed that there are no mechanisms or regulatory frameworks in place either
within the SWF or in any other agency for SWF.
In addition to this, interviewees have agreed that there is no governance mechanism in
place, there are no disclosures made; managerial roles are not defined; and there is no
investment strategy in place. This reveals current status of Oman SWF having no
monitoring from any government department as suggested in the interviews. There are
no annual or performance reports published by Oman SWF. No deals data is disclosed
except funding in flow and out flow maintained by Central Bank of Oman.
4. Governance reforms
2.31.6 1.3 1.3 1.2
0.0
1.0
2.0
3.0
4.0
5.0
6.0
7.0
GO
VER
RFM
DIS
CLR
FM
DEC
ISR
FM
RO
LESR
FM
OV
ERA
RFM

214
As a result of no data availability and less transparency, the financial analysts have
classified Oman SWF with other well known GCC funds in the category of ‗No
disclosure fund‘ as shown in the table below.
The correlations values of success rate with independent variables in table 6.5 reveal
that governance (0.508) affects the success of Oman SWF more than transparency
(0.086) and accountability (-0.256). Transparency and accountability are not strongly
correlated with success rate as evident from these correlation values; however a strong
governance mechanism in place can increase the transparency and accountability in the
SWF as an outcome of governance implementation as seen in the case of Norway SWF
(GPFG). Interviewees suggested that as of now in Oman SWF there are no governance
5. Transparency
1.9 1.5 1.3 1.3 1.2 1.30.0
1.0
2.0
3.0
4.0
5.0
6.0
7.0
AN
OU
NTR
N
RET
RN
TRN
REG
ULT
RN
BN
CM
RTR
N
RTN
GST
RN
EVA
LUTR
N
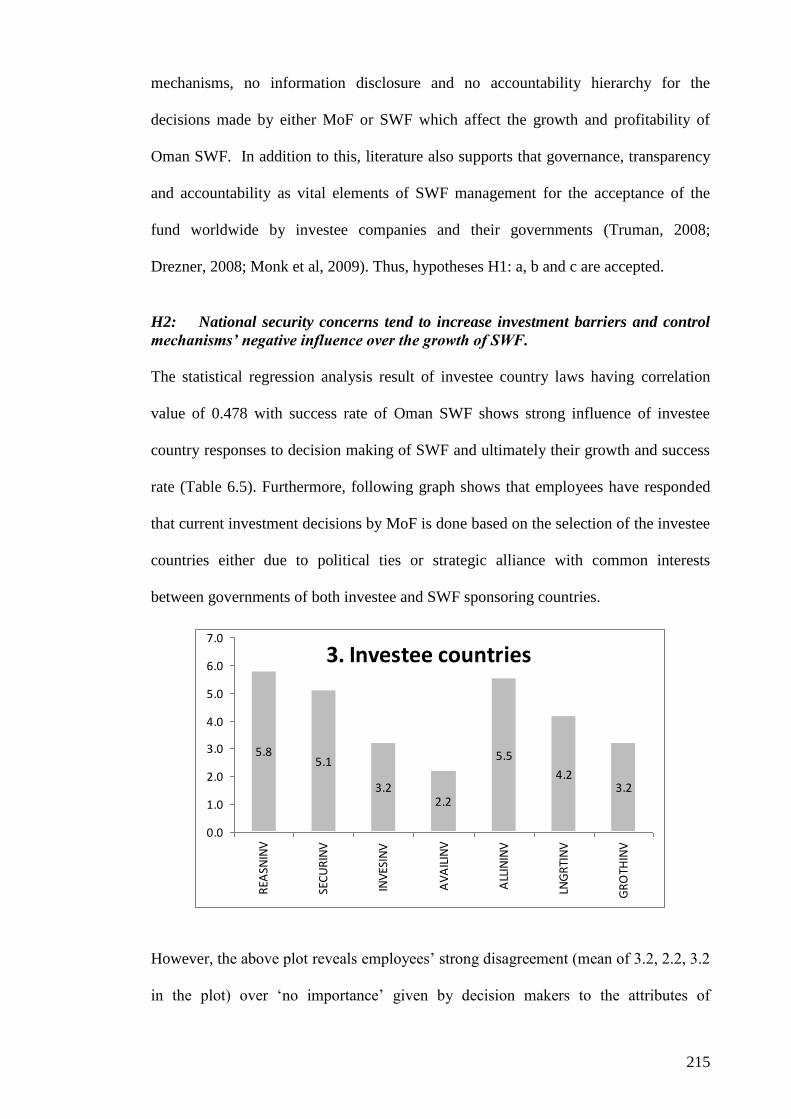
215
mechanisms, no information disclosure and no accountability hierarchy for the
decisions made by either MoF or SWF which affect the growth and profitability of
Oman SWF. In addition to this, literature also supports that governance, transparency
and accountability as vital elements of SWF management for the acceptance of the
fund worldwide by investee companies and their governments (Truman, 2008;
Drezner, 2008; Monk et al, 2009). Thus, hypotheses H1: a, b and c are accepted.
H2: National security concerns tend to increase investment barriers and control
mechanisms‟ negative influence over the growth of SWF.
The statistical regression analysis result of investee country laws having correlation
value of 0.478 with success rate of Oman SWF shows strong influence of investee
country responses to decision making of SWF and ultimately their growth and success
rate (Table 6.5). Furthermore, following graph shows that employees have responded
that current investment decisions by MoF is done based on the selection of the investee
countries either due to political ties or strategic alliance with common interests
between governments of both investee and SWF sponsoring countries.
However, the above plot reveals employees‘ strong disagreement (mean of 3.2, 2.2, 3.2
in the plot) over ‗no importance‘ given by decision makers to the attributes of
3. Investee countries
5.85.1
3.22.2
5.5
4.23.2
0.0
1.0
2.0
3.0
4.0
5.0
6.0
7.0
REA
SNIN
V
SEC
UR
INV
INV
ESIN
V
AV
AIL
INV
ALL
ININ
V
LNG
RTI
NV
GR
OTH
INV

216
investment environment, meaningful long term investments, growth and development
prospects while selecting the country for investments. The same was evident from the
responses of interviewees that current decision making by MoF has no investment
strategy to appraise the deals before finalizing the investments, for example investment
made in 2007 by Oman SWF to buy 30% stake in a bank in the Bulgaria. In addition to
these interviewees 11 and 12 clearly stated that developed countries should not worry
about myths of national security for two reasons. First, in the business world, the trade
needs of each country is so large that no one can afford to lose investments or markets
Second, Oman requires large amounts of investments within the country to develop
non-oil economy to benefit existing and future populations. Thus, for example there is
no surplus capital to buy strategic island in Pacific. This hypothesis is about the
formation of laws within the funds recipient (investee) countries. For example, in case
UAE‘s investment vehicle buying more than 10% in a company which owned strategic
ports of USA. The case had drawn much attention and US govt. intervention in the
matter finally led to divestment citing the security concerns (Drezner, 2008). In a
response to this, many funds have diverted their investments into riskier investments in
Middle East, North Africa and South Asia (MENASA) region. Thus, such control
mechanisms can influence the investment decisions and deal amounts ultimately
affecting growth of SWF. For this very reason, investee countries shall analyse the
issues in the form of S + W + F analogy given by Kirshner (2009) which explains
investee country governments about what is their problem of power of politics, wealth
or fund policies. Also, there should be asset allocation strategy such as Norway‘s SWF
to restrict investments to particular region or in a specific currency to a limit. Thus,
with support of primary and secondary data, the hypothesis H2 is accepted.

217
H3: Increase in trade imbalances can increase currency and inflationary
pressures leading to effects on the investments and growth of SWF.
The regression result shows very low correlation between trade balances and success
rate to a level of 0.038 which conveys the low level relationship of this predictor
variable to growth of SWF. Thus, statistical analysis does not support this hypothesis.
However as shown in the following plot, employees are not able to decide. The reason
might be their personal profile characteristics or the question being related to the core
knowledge of economics and trade theories. One of the objectives of asking the
employees about the trade balances was to confirm their understanding of sovereign
wealth fund roots and fundamentals for Oman SWF.
The responses of interviewees suggest their feedback about trade balances is positive
as they were concerned with the lack of mechanisms for monitoring the foreign
exchange reserve spent by Oman SWF. The interviewees were from top management
who are involved in the policy making so they have concerns regarding the economy,
currency rate and inflation situation in Oman. However, none of the interviewees was
critical about the trade balance effects in SWF directly. On the other hand, trade
balance is the difference in the earnings in capital and current accounts of the country
through exports and imports. The increased trade balance allows the country to reserve
the earned foreign exchange which in turn is available to utilize as funding to the
sovereign wealth fund (Gieve, 2008). Hence, volume of the trade between two
8. Trade balances
4.5 4.1 4.0
0.0
1.0
2.0
3.0
4.0
5.0
6.0
7.0
BILA
TBA
L
CURN
CBA
L
TRA
DEB
AL

218
countries and their respective exchange rates of currencies can affect the trade balance
(Alerbola and Serena, 2008). The increased trade balance through higher trade volume
increases the production demands for export goods within the sponsoring country, thus
increasing GDP in case of exporters attempting to meet the demand. As a known fact,
literature of economics and trade theories supports this hypothesis as well. From the
secondary data comparing Oman with Norway SWF reveals that Norway has fixed
spending or funds inflow limits from foreign exchange reserves accumulated through
trade balances at Norges Bank. Therefore, if any SWF wants to grow and become
profitable then they shall control the income and investment of the funds professionally
like Norway. Thus, interviewees‘ feedback, secondary data and literature allow
accepting the hypothesis H3.
H4: Lack of planning negatively affects the growth of SWF.
The regression results for lack of planning and absence of a specific plan supports the
hypothesis with -0.673 correlation value between lack of planning as a predictor
variable of success rate of growth of Oman SWF. However, the negative sign of
correlation clearly suggest the inversely proportionate variation between lack of
planning and success rate as anticipated. Any increase in lack of planning would
decrease the success rate not only for Oman SWF but for any other profit making
organisation which is evident from existing management theories. However, the overall
contribution of lack of planning towards success rate of SWF is low with standardized
beta coefficient of – 0.092. In addition to regression results, the following plots of
mean for each answer suggest the respondents‘ agreement about existing lack of
strategic and investment planning situation in Oman SWF. The same has been echoed
by interviewees that current decision making system is managed single handedly by
Minister of Finance and appraisal of the decisions is not merit based. The
administration of Oman SWF is totally un-organized to a level where Deputy Chief

219
executive of SWF does not have annual or performance reports of the investment
portfolio (Interviewee 3).
The support of this hypothesis from primary data is equally supported by secondary
data of Norway SWF and literature of investment strategy and planning that with a set
of appropriate appraisal tools for investments in financial assets can improve the
returns on the investments (Chhaochharia and Laeven, 2009). Hence, one can accept
hypothesis H4 in the current context.
H5: Political objectives can affect the transparency and thus the treatment of
SWF by investee countries which can affect the growth of SWF.
The regression result of 0.102 for sponsoring country laws do not support this
hypothesis based in the correlations results mentioned for the dependent variables 1
and 2. However, following plot 6 of responses about global laws mean results show the
9. Investment planning
5.0
6.8
2.9
4.9
6.85.9 5.9
6.7
0.0
1.0
2.0
3.0
4.0
5.0
6.0
7.0
SHO
RTPL
N
BIA
SSPL
N
APR
SLPL
N
ABS
NCP
LN
DPE
ND
PLN
AD
MIN
PLN
SKIL
LPLN
TRA
INPL
N
11. Specific plan
5.86.9
2.92.2
6.9
0.0
1.0
2.0
3.0
4.0
5.0
6.0
7.0
DEP
TSSP
L
PLA
NSS
PL
RISK
SSPL
LQU
DTS
PL
AG
ND
ASP
L

220
agreement of employees that right now Oman SWF does not determine whether these
companies in which they are investing follow basic global laws in significant areas of
concern. These areas include human rights, equal employment opportunities, and
pollution control; as well, they do not check for such violations as the use of child
labour and the use of money laundering. The plot 12 of sponsoring country shows that
employees agree that laws in SWF sponsoring country for investments require
updating; however there are no direct effects found.
On the other hand, many a times Oman SWF rejects the foreign investment because of
lack of sufficient information on global markets, absence of external help such as
investment banks or issues of bi-lateral trade with the particular investment recipient
country. The rejections of foreign investments do not happen because of priorities to
industries within the country, wars, unrest of political instability; since, Oman‘s
6. Global laws
3.33.8 3.7
2.3
3.8
2.0
3.8
0.0
1.0
2.0
3.0
4.0
5.0
6.0
7.0
HMRG
TLAW
CHLD
LLAW
EQUL
TLAW
FAIR
GLAW
POLU
TLAW
WEA
PNLA
W
MLA
UNLA
W
12. Sponsoring country laws
6.36.9
4.1 4.1
6.7
0.0
1.0
2.0
3.0
4.0
5.0
6.0
7.0
UPDA
TSCL
OLD
LSCL
CURN
LSCL
FAVO
RSCL
OBJ
CTSC
L

221
economy and politics both were unaffected by global financial crisis and strong
visionary leadership of current Sultan Qaboos from 1970s. Thus, employees agree for
reasons mentioned for this hypothesis.
The interviewees agreed for lack of clear objectives and planning along with main
reason of single handed management for Oman SWF not adhering to global laws of
following strict ethical standards. For example, Norway SWF does not invest in the
companies who supply or manufacture weapons of any kind or create biological
pollution or global warming. Oman SWF does not have any governance or such social
responsibility policies outlined. Thus, with support of primary and secondary data, one
can accept hypothesis H5.
H6: A SWF should have a clear purpose which enables more efficient and
transparent management, positively affecting the growth of the SWF.
The regression results are not very high but considerable positive correlation value of
0.389 is found for a relationship between the objectives and structure of funds as
predictor variables of growth of the fund as a dependent variable (Table 6.5). The
following plots of mean of answers to question 1 and 2 of the questionnaire suggest
that employees strongly agree that objectives and management structure of the fund
clearly impact the growth. Interviewees also supported the same perspective stating
that currently objectives of the fund are not directed by investment or profitability
goals, instead of that objectives are targeted by political motives from MoF or
15. Rejection of foreign investment
5.2
2.2
5.7 5.8 5.6
3.64.2
0.0
1.0
2.0
3.0
4.0
5.0
6.0
7.0
LWRT
NRJF
PRIO
RRJF
CLO
BJRJ
F
SINF
ORJ
F
ABAG
NRJF
CNSF
IRJF
WAR
SSRJ
F

222
ministries satisfying strategic demands of funds from governments of developed
countries. Literature supports the same view such as Mitchell et al (2008), Berstein et
al (2009) and Chhchhoria et al (2009) that management and further growth of the SWF
in general are rooted to their objectives of setting up and organisational structure
including decision making and investment strategy.
Thus, based on the overall support of all types of evidences from primary and
secondary data one can accept the hypothesis H6.
H7a: Investment strategy fundamental and mechanism issues can directly impact the
investments‟ performance and thus success and growth of SWF.
The hypothesis is not supported by regression results as stated in the previous sections
of regression analysis as investment strategy has negative and negligible correlation of
– 0.074 with dependent variable of success rate. However shown in the following plot,
employees have strongly disagreed that current decisions are made in the favour of
1. Main objectives
2.1
5.0
2.33.0
5.0 4.85.7
6.8 6.8
0.0
1.0
2.0
3.0
4.0
5.0
6.0
7.0EX
PEN
OBJ
REVE
NO
BJ
DVL
EPO
BJ
CHA
NG
OBJ
RETR
NO
BJ
STA
BLO
BJ
BILT
LOBJ
PLTC
LOBJ
DEM
ND
OBJ
2. Structure of the fund
6.65.7
6.9 6.6 6.8 6.9 6.9
0.0
1.0
2.0
3.0
4.0
5.0
6.0
7.0
PURP
SSTR
OBJ
CTST
R
OW
NER
STR
SOU
RCST
R
STYL
ESTR
DEC
ISST
R
CNFL
TSTR

223
growth and profitability of the fund such as considering risk, returns, guaranteed
income, technology transfer or long term investment. By their strong disagreement,
employees have confirmed that currently Oman SWF does not have any investment
strategy, does not make use of capital project appraisal methods. The same has been
echoed by interviewees that present management of Oman SWF requires overall
restructuring. One can see from the cases of Norway, Singapore, China, ADIA, Kuwait
that these funds have primarily concentrated on returns on their investments through
robust investment strategy, asset allocation, help from global experts such as
investment banks and wealth managers. Literature also supports the strong presence of
investment strategy, international level human capital to maintain the sustainability and
profitability of the SWF (Aizenman and Glick, 2009; Setser and Ziemba, 2009).
On the basis of overall evidences from questionnaires, interviews and secondary data
the hypothesis H7a is accepted.
16. foreign investment favoured
2.8 2.51.9
3.9 4.12.8
2.2
0.0
1.0
2.0
3.0
4.0
5.0
6.0
7.0
LRIS
KFFV
SUBS
TFIF
GRN
TDFI
F
DU
RABF
IF
GD
MN
DFI
F
COM
PTFI
F
TCTR
NFI
F
17. Global special companies
3.9 3.9 4.0 3.9 3.9 3.8
0.0
1.0
2.0
3.0
4.0
5.0
6.0
7.0
MKT
RSGL
C
NAVI
LGLC
INCR
TGLC
STAF
CGLC
ABTE
MGL
C
LACP
LGLC
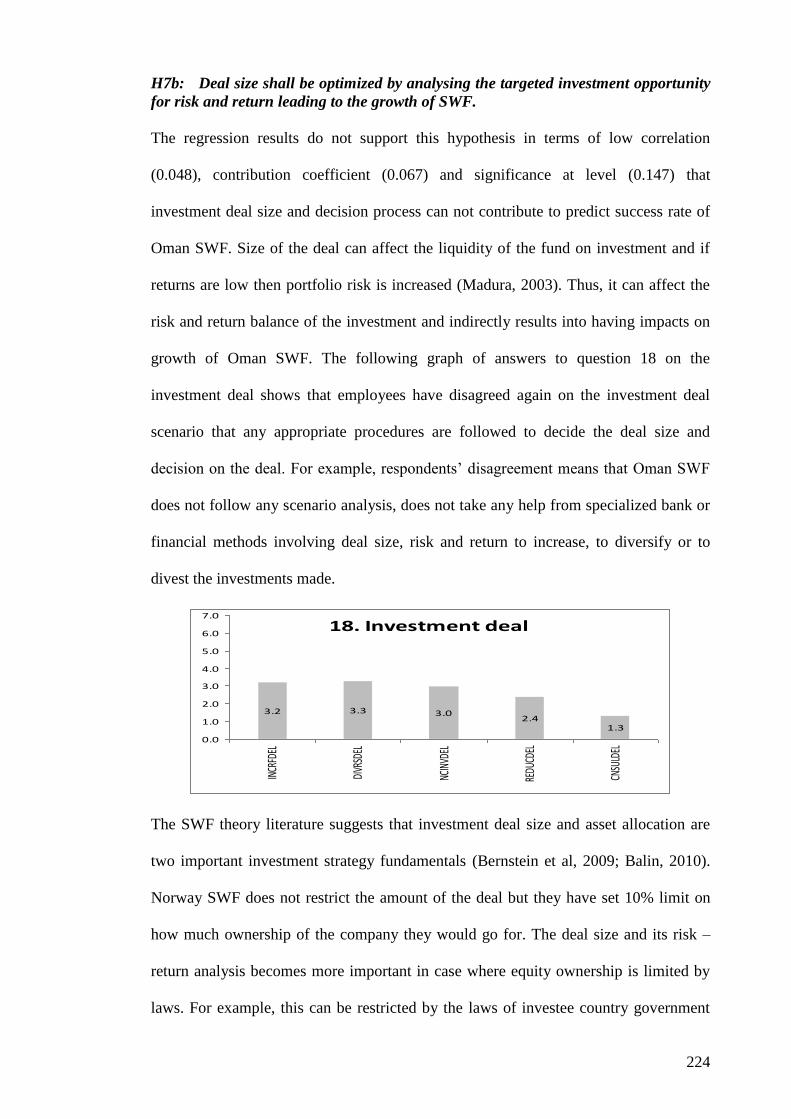
224
H7b: Deal size shall be optimized by analysing the targeted investment opportunity
for risk and return leading to the growth of SWF.
The regression results do not support this hypothesis in terms of low correlation
(0.048), contribution coefficient (0.067) and significance at level (0.147) that
investment deal size and decision process can not contribute to predict success rate of
Oman SWF. Size of the deal can affect the liquidity of the fund on investment and if
returns are low then portfolio risk is increased (Madura, 2003). Thus, it can affect the
risk and return balance of the investment and indirectly results into having impacts on
growth of Oman SWF. The following graph of answers to question 18 on the
investment deal shows that employees have disagreed again on the investment deal
scenario that any appropriate procedures are followed to decide the deal size and
decision on the deal. For example, respondents‘ disagreement means that Oman SWF
does not follow any scenario analysis, does not take any help from specialized bank or
financial methods involving deal size, risk and return to increase, to diversify or to
divest the investments made.
The SWF theory literature suggests that investment deal size and asset allocation are
two important investment strategy fundamentals (Bernstein et al, 2009; Balin, 2010).
Norway SWF does not restrict the amount of the deal but they have set 10% limit on
how much ownership of the company they would go for. The deal size and its risk –
return analysis becomes more important in case where equity ownership is limited by
laws. For example, this can be restricted by the laws of investee country government
18. Investment deal
3.2 3.3 3.02.4
1.3
0.0
1.0
2.0
3.0
4.0
5.0
6.0
7.0
INCR
FDEL
DIVR
SDEL
NCIN
VDEL
REDU
CDEL
CNSU
LDEL

225
such as not more than 10% stake allowed by the foreign companies in strategic assets
of the country such as in pharmaceutical, aviation or petroleum industry. Thus, on
overall support and broad base of evidences, the hypothesis H7b is also accepted.
H7c: Assets allocation directly affects the growth of SWF.
This hypothesis is supported by regression results plus acceptance of previous two
hypotheses H7a and H7b since investment strategy and deal size calculation take into
consideration asset allocation as an integral component. The regression results show
low correlation of 0.237 but higher contribution of 0.290 and significance of
contribution of 0.059 (Table 6.5 and Appendix D).The following graph shows that
employees disagree that Oman SWF applies or utilizes any of the asset allocation
fundamentals such as capital utilization or integration with world markets. Therefore,
they agree that asset allocation is necessary component for Oman SWF to increase its
profits. How SWFs allocate their assets to maximise their profits is a well researched
subject in the SWF literature. As discussed in chapter five, Norway SWF has robust
asset allocation mechanism which fuels the return on their investments. Norway SWF
management still wants to improve their investment strategy. These facts and
evidences collectively support this hypothesis. Hence, one can accept the hypothesis
H7c and with that all three components of H7 hypothesis are accepted.
14. Allocation
3.0
1.12.2
1.4
5.2
0.0
1.0
2.0
3.0
4.0
5.0
6.0
7.0
CAPT
LLRG
INCM
EALO
STA
TSA
LO
MRK
TSA
LO
LWRT
NRJ
F

226
H8: Improve the decision making by use of expert knowledge systems and
research prior to deal finalization, more will be the successful deals and increased
investment opportunities resulting in the growth of SWF.
The regression results do not support this hypothesis with results of low correlation
value at 0.074 and low contribution coefficient at 0.125 (this should be more than
minimum 0.30) and low significance at 0.117 (this value should be less than 0.005)
between decision making by SWF management and success rate of the fund. However,
global practice of large and successful SWFs such as Norway, ADIA, SAMA, Kuwait
suggest the vice –versa and advocate the better decision making can help increasing the
opportunities. The graph for question 10 confirms employees‘ agreement that Oman
SWF does not integrate their investment with other GCC funds because past
experience is not good for investment co-operation and the rest of the reasons are
attributed to political, cultural and administrative fundamentals. This was also
confirmed by interviewee 3 (Dy. Chief executive of Oman SWF) that pervious co-
operation with other GCC funds have not turned out well.
In the following plot of question 19, employees agree that operational efficiency of the
SWF depends upon the reliable decision making based on the research and systematic
process prior to an investment deal finalization.
10. Integrate investments
5.9 6.2
3.8
5.35.9
3.3
0.0
1.0
2.0
3.0
4.0
5.0
6.0
7.0
REA
SNIN
T
DIF
RNIN
T
SULT
NIN
T
NG
HBR
INT
HEL
PLIN
T
SIZE
SIN
T

227
The respondents‘ disagreement in the following graph signifies that currently Oman
SWF does not make investments based on the risk management, financial returns
guarantee, deal size, asset class or security of the funds invested in the country. This
means currently Oman SWF do not make use of any fundamental of financial
management and investment strategy in the investment decisions.
Based on the three components discussed above - integrating investments, operational
efficiency and investment decisions, one can accept the hypothesis H8. However this
decision making hypothesis was discussed in detail and there was separate section
included in the questionnaire with another set of question as section D of the
questionnaire. The major aim of this thesis is to find the factors affecting SWF growth;
20. Investment decision
6.3
3.0 2.6 2.8
1.3
5.4 5.3
0.0
1.0
2.0
3.0
4.0
5.0
6.0
7.0
VOLU
MIN
D
RISK
MIN
D
GURN
TIND
SECU
RIND
ROIN
VIND
SIZE
OIN
D
ASSE
TIND
19. Operational efficiency
5.05.8 5.7
0.0
1.0
2.0
3.0
4.0
5.0
6.0
7.0
SYST
EEFN
RELA
BEFN
RSRC
HEFN

228
however an additional objective is to improve the growth, investment performance and
success rate of Oman SWF. As evident from the secondary data, interviews and
questionnaire findings, it can be confirmed that Oman SWF requires complete
restructuring. This restructuring would be transformational for Oman SWF which
further requires detailed understanding of how decisions are made within Oman SWF
currently. Thus, next section analyses the decision making process of Oman SWF
based on the responses received in the section D of the main questionnaire which
would supplement the detailed discussion of the hypothesis H-8.
It analyses how decision making process works in Oman SWF. Each question is
associated with various stages of decision making within the SWF. Responses to each
question are presented in the form of pie charts to easily interpret feedback of the
employees and stakeholders of SWF.
The following pie chart suggests that recipient countries (investee countries) do not
approach first to the SWF but they contact first Government ministry which is
supported by the second chart about large amount deal
Recipient countries approach first to SWF
Yes in most
cases , 15%
No, very rare ,
81%
Depends on
case, 4%

229
Once in contact with Ministry or SWF, clients are required to submit documents so that
investment decision can be made before finalizing deal in a meeting with the recipient
country government or company directly. The following chart shows mainly four
documents however, Oman SWF should seek documents such as quality,
manufacturing or organisational performance or policies report. These documents are
more for internal stakeholders and thus not very much forward looking but provides
true context of the company and how is it doing. Also, it is better to compare new
company with the similar industry investment already in the existing portfolio, if
available any in the same industry sector.
Whom does client contact first in large amount deals?
Top
management ,
5%
Departmental
heads , 3%
Clients
representative
to SWF , 3%
Govt. Ministry ,
89%
SWF requires which documents from clients for
investment decision
Project report ,
15%
Company
report , 23%
Annual report ,
33%
Investor
presentations,
29%

230
From the previous discussions, we know that there is no investment strategy followed
by Oman SWF right now. This is reflected in the following charts showing randomly
taken decisions by MoF for short term profit goals. Thus, there is no stable income or
no strategic asset is created from the SWF investments made. This is an additional
evidence which proves Oman SWF requires robust investment strategy.
More evidence of random selection of investments can be found in the following chart
as employees confirm the biggest factor affecting the investment decisions is political
motive. As one can see financial return has the lowest priority in Oman SWF as
confirmed by employees.
SWF aims investment opportunities for
Continuous
stable income
6%
Short term
liquidity plus
profit
87%
Currecy
stabilization
5%
Strategic
assets
2%

231
The present decision making structure is investee country client contacts MoF and then
MoF passes on the instructions to SWF; and then SWF deals with client. In this
scenario, SWF just acts as administrative agency and not as a professional investment
vehicle. Thus, Oman SWF requires overall restructuring of the organizational,
reporting and monitoring structure.
The post deal management responsibility of the clients and asset management and
returns monitoring is with Government ministry and not with SWF. The chart also
shows no professional services were used.
Factors affecting the investment appraisal
Avantage over
other SWF, 4%
Financial return
, 5%
Bilateral trade
w ith country,
14%
Political motive ,
77%
Current organizational hierarchy
1%
95%
2%
2%
Client to SWF - MoF - SWF - Client
Cilent to MoF - SWF - Client
SWF to MoF - Client - SWF
SWF to Client - MoF - SWF
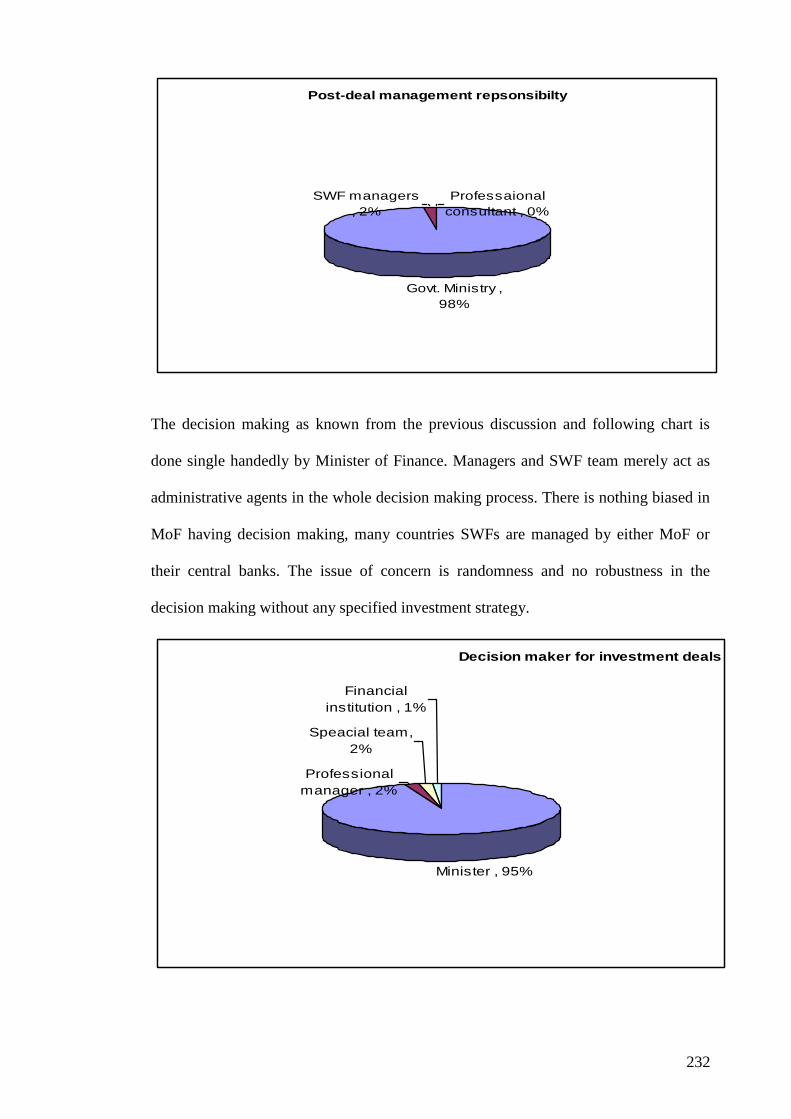
232
The decision making as known from the previous discussion and following chart is
done single handedly by Minister of Finance. Managers and SWF team merely act as
administrative agents in the whole decision making process. There is nothing biased in
MoF having decision making, many countries SWFs are managed by either MoF or
their central banks. The issue of concern is randomness and no robustness in the
decision making without any specified investment strategy.
Post-deal management repsonsibilty
Govt. Ministry ,
98%
SWF managers
, 2%
Professaional
consultant , 0%
Decision maker for investment deals
Minister , 95%
Professional
manager , 2%
Speacial team,
2%
Financial
institution , 1%

233
The reporting hierarchy conveys previously discussed organisational structure that
MoF instructs the decisions to SWF.
The following chart again shows a drawback in the investment planning of Oman SWF
as 60% earning goes back to the treasury instead of larger share going for re-
investment. This might be the major reason why Oman SWF is lagging behind at US$
8 to 13bn where as other GCC funds have gone to be of size more than US$ 200bn to
US$ 850bn.
The reporting hirarchy / divestment process
Ministry decision
to SWF , 98%
SWF request to
Ministry , 2%
Any other
structure , 0%
Uitlization of profit form SWF
Re-inevstment
into SWF, 7%
Transfer to
Govt. A/c , 60%
Dirrect to
Projects , 33%

234
The reasons for Oman SWF divesting their investments are quite different from
Norway or other larger SWFs. In case of Oman SWF, the main reason for divestments
is political relations with the governments of other countries.
Thus, these decision making process charts as discussed above re-affirm the discussion
of previous sections about restructuring requirements of Oman SWF in addition to
decision making being crucial for any SWF. Thus, hypothesis H-8 can also be accepted
with this form of evidence from section D of the questionnaire.
The separate supporting literature is not included as a chart or table however it is
embedded in the hypotheses testing as one category of evidence. Also, very few studies
are empirical and mostly they are literature analyses or secondary data analyses. This is
the reason why statistical results of this study have not been easily compared with other
research studies in the field of SWFs.
6.11 Progress, possible solutions and changes in Oman SWF
In the questionnaire with independent and dependent variables for the framework, a
different set of three independent variables was embedded which measured the future
scope of the growth of Oman SWF based on what employees think that can be impacts,
possible solutions, changes required and tools to improve the growth of Oman SWF.
Reasons of SWF divestment
Trade relations
, 20%
Political
relations , 40%
Decreasing
asset value ,
30%
Depreciating
currency , 10%

235
The regression analysis for these three independent variables was done separately for
two dependent variables of performance and success rate and their results are tabulated
previosuly in section 6.9, appendices D3 and D4.
The regression results of these variables are positive with dependent variable 2: success
rate with correlations of 0.464 for possible solutions, 0.364 for changes and 0.264 for
impacts on the progress. Their standardized beta coefficients explain strong
contribution from these factors with values of 0.41 (solutions), 0.31 (changes) and 0.25
(impacts) with low significance for solutions and changes but high significance of the
contribution for impacts at level of 0.003 < 0.005 (Tables in Appendix D4).
The first graph in this section is about the factors impacting progress of Oman SWF.
From the following graph 24, it is evident that employees agree about bureaucratic
decision making hierarchy such as SWF management by MoF, absence of regulatory
frameworks, lack of strategic planning and non-utilization of any research skills
negatively impact the growth of Oman SWF. This is why Oman SWF has not achieved
the progress same as other SWFs of Norway, ADIA or Singapore.
24. Impacts on progress
5.85.2 5.7 5.8 5.5 5.5
4.83.6
5.8
0.0
1.0
2.0
3.0
4.0
5.0
6.0
7.0
BURE
AIM
P
RSKA
VIM
P
ABS
PSIM
P
LACS
PIM
P
SKIL
LIM
P
DEC
ISIM
P
LOCA
LIM
P
SPEN
DIM
P
MN
AG
EIM
P

236
The possible solution to this problem can be seen from strong agreement of 153
respondents in the following graph 22. The possible solutions according to the voice of
employees can be: finalizing investment objectives, specifying growth and return
targets, developing legal and governance mechanism, developing the international
level human capital, increased use of research and world markets information and
heavy punishment for frauds and transgressions. This will allow SWF and employees
to grow together and increase the governance, transparency and accountability.
The following changes are also strongly agreed upon by employees for fund‘s financial
management such as increase the fund inflow available for overseas investments,
increase local and emerging markets investments. This might be because of many
SWFs in GCC region lost billions due to credit crisis in the developed countries during
2007 - 2009.
22. Possible solutions
6.4 6.45.5
3.9
5.46.2 6.1 5.9 6.2
0.0
1.0
2.0
3.0
4.0
5.0
6.0
7.0
INCR
IPSS
PLA
NG
PSS
NLA
WSP
SS
COO
PSPS
S
OU
TSRP
SS
DVE
LPPS
S
RSRC
HPS
S
ASE
SSPS
S
SAN
CTPS
S

237
A number of possible solutions and changes would lead to improvement for the Oman
SWF. The necessity of making these changes was strongly acknowledged by the
employees, as illustrated in graph 25 of dependent variables. Included among the
changes are: development of Oman‘s work force, stronger cultural and religious
integration of the population, enlargement of consumer markets based on various
demographic characteristics, enhancement of transparency, and greater professionalism
in work ethics.
These possible solutions and changes are also strongly supported by top management
which is evident from interviews data. For example, Interviewee 1 suggested the
changes across the board in Oman SWF and implementation of professional
management and investment practices. Interviewees 2, 6, 9, 10 and 15 stressed the
need of appropriate reporting, appraisal and information disclosure systems. Dy. CEO
of Oman SWF (Interviewee 3) recommends overall changes in terms of policy,
strategy, decision making and reporting structure. Interviewees 5, 9 and 10 strongly
supported that Oman SWF should make use of professional talent and take actions to
develop the local talent to the global level of expertise. Changes in leadership,
investment strategy, asset allocation and reduction in portfolio risk by increasing
23. Changes
5.5 5.6 5.7 5.9 6.1
0.0
1.0
2.0
3.0
4.0
5.0
6.0
7.0
AM
ON
TCH
N
INCO
VCH
N
INCE
MCH
N
INCL
CCH
N
TRA
NSC
HN

238
geographical spread of investments are recommended by interviewees 8, 11, 12 and 13.
Changes in the fund inflow, asset allocation, budgeting, approvals, governance
structures, policy and planning are voiced by interviewees 6, 8, 15, 16 and 17.
Therefore, it is proved from the regression of results of impacts, changes and possible
solutions with success rate of SWF and interviewees data that proposed restructuring
plan for Oman SWF in terms of long term economic policy, new investment strategy,
performance benchmarking and development of human capital advantage is agreed and
accepted by top management (from interviewees), employees and other stakeholders
(from questionnaires) of Oman SWF. The restructuring plan for Oman SWF is
explained in the next chapter of conclusion.
6.12 Final theoretical framework
The following table shows the overall presentation of hypotheses results and confirms
that all hypotheses are accepted on the basis of regression results, descriptive statistics
and the collective support and multiple evidences from interview results, secondary
data, literature and current SWF managerial practices. The table includes only primary
data results about hypotheses in addition to the column of final acceptance or rejection
of the hypothesis. All hypotheses are accepted based on the support from either of the
previously mentioned bases. An exception to this is hypothesis 3 about environmental
dimension of trade balances. This hypothesis is accepted based on the secondary data
and literature considering the substantive significance of positive current account trade
balances in increasing the foreign reserves which would enable any country to launch
SWF.

239
Table 6.9 Summary of the hypothesis testing
Hypothesis Regression
Results
Descriptive
Statistics
Interview
Results
Final
Acceptance or
Rejection
H1: Legal aspects
Governance
Transparency
Accountability
Supported for
Governance
only
Supported Supported Accepted
H2: Investee country laws
National security
Supported Supported Supported Accepted
H3: Environmental
dimensions
Trade balances
Not supported Neutral Neutral Accepted
H4: Policy
Lack of planning
Supported Supported Supported Accepted
H5: Sponsoring country laws
Political stability
Not supported Supported Supported Accepted
H6: Structure
Purpose / Objective
Supported Supported Supported Accepted
H7: Investment deal
Investment Strategy
Deal Size
Asset allocation
Supported for
Asset
allocation only
Supported Supported Accepted
H8: Operations
Decision making
Not supported Supported Supported Accepted
As one can see from the hypotheses testing that regression analysis are carried out for
each dimension of growth of SWF: investment performance and success rate of SWF.
The regression model of performance is rejected based on the low degree of correlation
and variance; however there is enough substantive significance of investment
performance dimension revealing its necessary contribution for growth of SWF from
other evidences of interviews and secondary data (Seth et al, 2009). Hence, all
hypotheses are accepted based on the regression analysis results of success rate as
dependent variable and investment performance is still included in the final framework
as shown in the next section.
Since all the hypotheses are accepted, there is no change between an initially proposed
theoretical framework and the finally derived framework. Therefore, the following

240
framework is the final theoretical framework derived based on the hypothetico-
deductive method. The utilization of this finalized framework brings implications,
contributions and further avenues for the research which is discussed in the concluding
chapter.
Figure 6.2 Final Derived Theoretical Framework
The above mentioned framework has been derived based on the analyses of multiple
regression results and descriptive statistics first and then weighing them with the other
forms of compelling evidences such as interview findings, industry data and literature.
The validity of the acceptance of all hypotheses is increased by comparing the research
findings with the previous studies as done in the coming section of this chapter.
Strategic Restructuring Plan
Required Long Term Economic policy
New investment policy & regulations
Performance Benchmarking for
Wealth Funds
Creation of human capital advantage
Sustainable Growth of SWF
in terms of Investment
Performance and Success rate
of the fund
QUALITATIVE Legal aspects (H1)
Governance
Transparency
Accountability Investee country laws (H2)
National Security Environmental dimensions (H3)
Trade Balances Policy (H4)
Lack of Planning Sponsoring country laws (H5)
Political Objectives
QUANTITATIVE Structure (H6)
Purpose Investment deal (H7)
Investment strategy
Deal size
Asset Allocation Operations (H8)
Decision Making

241
The statistical techniques such as principal component analysis and multiple regression
analysis have enabled to evaluate various components of relationship between factors
affecting growth, success rate and performance of SWF. Not all results of regression
analyses have supported each hypotheses; however this type of hypotheses are found to
be supported by other forms of evidences as stated in their analyses and table 6.9 as
above. Table 6.9 presents the finalization of framework mentioned in the above figure
6.3. The method of analysing each hypothesis with multiple forms of evidence has
given valuable insights about relationships among these variables and how they
influence management and operations of any SWF. This is detailed in the findings of
this research study in the following section.
6.13 Findings of this research study
This section summarises the findings of this research study. These findings refer to the
final framework and align the research aim and objectives with the findings.
The qualitative factors such as governance, transparency, accountability, sponsoring
and investee country laws, planning and policies and trade environment affect the
sovereign wealth fund decision making to make foreign investments which can directly
impact overall growth of SWF.
Governance was found to be a high impact factor which can ultimately enable the
transparency and accountability in the SWF. Thus, it is necessary to have governance
mechanisms in place such as Norway SWF which has scored high in all such attributes
and same is demanded by Oman SWF stakeholders.

242
Policy making and planning affect range of issues within SWF wherein national
security concerns may be a myth created by political leaders or a debate in media since
SWF investments can have positive impacts on the industry which needs long term
funds in the investee countries. Also, there is no such evidence found in the literature
or primary data that SWFs have negative impacts on the capital markets of investee
countries however their persistent inclination for specific industrial segments can
imbalance the money supply. For example, considering profitability as only investment
criteria would lead SWFs to riskier investments which would create liquidity shortage
for safe but low yield businesses.
On the other hand, when asset allocation is not appropriate, there are examples of
SWFs losing the value of the investments for example GCC SWFs losing approax. US
$ 40bn in the banking industry during 2007 – 09 credit crisis. SWFs are vital to the
economies of sponsoring countries and investee countries depending on their
contribution to the trade balance of the country. Therefore, utilization of SWFs for
increasing trade and economic benefits is possible if both sponsoring and investee
countries create common mechanisms in terms of laws and treaties instead of creating
barriers and protectionism to the bi-lateral trade. This shifts one from qualitative
factors to quantitative factors of investment strategy and decision making components.
The quantitative factors such as purpose, structure, deal size, asset allocation, trade
balances and decision making are equally important as qualitative factors to the SWF
growth. Both of these findings about qualitative and quantitative factors affecting
growth of SWF are supported by multiple forms of evidences.

243
Decision making by political leaders or decisions based on political objectives rather
than financial motives can impact the profitability of the SWFs. This is evident from
interviews data, questionnaire data and equally supported by the literature. This
decision making should allow other attributes to be workable or advantageous for SWF
such as investment strategy and organisational structure as these two are vital for
setting up objectives and appraisal of the investments which can ultimately reflected in
the assets yield and growth of the SWF. Deal size is one of the main components to be
utilized by the SWFs for analysing investment opportunities as governance
mechanisms of sponsoring countries may restrict deal size or equity shareholding and
same can be protected by investee countries‘ governments and companies. For
example, Norway SWF has 10% limit to buy equity of the any company, or UK
competition commission asked Kuwait SWF to divest anything over 10% holding in
British Petroleum. Thus, deal size in terms of percentage and amount is critical
component affecting growth of SWF.
A detailed literature review revealed that existing finance and management theories
can help in resolving conflicting issues within the SWFs, between SWFs or with their
stakeholders as discussed in detail in the next section.
From Oman SWF data, it is found that there is lot of resentment within SWF
employees and other government departments because of heavy influence and single
handed decision making by Ministry of Finance. Top executives and employees of
SWF and other government departments have clearly suggested that Oman SWF
requires complete restructuring or transformation in terms of policy, planning,
governance mechanisms, decision making and investment strategy. The restructuring
plan for Oman SWF is explained in the final conclusion chapter of the thesis.

244
According to the primary data analyses and current situation of Oman SWF, the future
of sovereign wealth fund of Oman relies heavily on how restructuring plan will be
managed by the Government of Oman. The current set of issues of concern mainly
arises from lack or complete absence of many vital attributes such as planning,
policies, structure, audit and budgetary control, professional investment strategy and
research based decision making. The current investment decisions by Minister of
Finance are random, without any risk – return appraisal and preferably containing
political biases. On the other hand, because of this non-professional management style
adopted by Oman SWF, the fund is losing out to competitors and quite large SWFs
namely, UAE, Saudi Arabia, China, Norway, Singapore and Kuwait funds in the
recession period when assets are undervalued and cheaply available to buy. Missing
this investment period would create again a larger gap between Oman SWF and these
global SWFs. Therefore, for a future of successful assets growth and consistent
profitable returns on the investment portfolio, Oman SWF has to act now to bring in
professional management and develop the organisation.
6.14 Support of existing theories in resolving issues of concern in
SWF
In the literarure review section, the exsiting theories of trade, finance, management and
economics are discussed as being the basis of SWF and to understand the concept of
SWF in detail. These theories can support and help resolving issues within SWF
management. To understsnd the utilization of theories for SWF, the example of Oman
SWF is analysed based on the primary data from interviews and questionnaires.
It can be observed from responses of executives from SWF, councils, central bank of
Oman, government committees and ministries for questionnaires and interviews that

245
there is strong resentment about how Oman SWF is getting managed. These
respondents are government employees and at the end of the day they are citizens of
Oman as well. Also, the conflict is evident from recent protests against the government
reported in the media and the government‘s immediate response in terms of re-
allocation of ministerial portfolios. Thus, there are two types of conflicts within
sponsoring country: between actual owners‘ population and MoF; and between MoF
and employees of SWF. The fundamental reasons can be issues of trust, integrity,
legitimacy or intent which basically stems from lack of governance. These issues
match with Agency theory explained in the literature review. Agency theory deals with
principal – agent conflicts which can help to analyse and to resolve such issues based
on analyses.
The second issue is that Oman SWF is one of the least transparent SWFs worldwide
and having ‗no governance mechanism‘. The issue of governance can be tackled by
applying tools of stakeholders management and decision making decentralization
theories which empower employees to take on more responsibilities and be
accountable for their actions. Hence, application of stakeholder management and
decision making theories for top management would help to resolve the governance
issue.
The third issue is complete lack of investment strategy, asset allocation planning and
use of investment appraisal tools and risk management methods. Therefore, Oman
SWF must implement financial management theories to prepare a robust investment
strategy which can ultimately help to increase the return on the investment deals made.

246
The fourth issue is the credibility of the Oman SWF which is very low as compared to
Norway and Singapore SWFs. The internal issues for credibility can be governance
and transparency; however investee country trade relations and legal mechanisms of
protecting domestic economy and industry can also affect the bilateral relations with
other countries. Oman has no issue of bilateral trade relations; however improvement
in governance and transparency may increase the credibility of Oman SWF.
Therefore, one can see that issues such as of Oman SWF can be resolved for any global
SWF utilizing the agency theory, stakeholder management theory, decision making
theory and financial management theories and help to improve its structure,
governance, transparency, credibility or profitability ultimately leading to growth of
SWF.
6.15 Reliability and validity of the findings
The reliability of the findings is a measure of consistency in the longitudinal time
horizon, accuracy of measurement, replicability of findings for same constructs under
different research setting. Thus, stability and similarity of the findings on a consistent
scale can be defined as the reliability for the research carried out (Neuman, 2006;
Pallant, 2010). The statistical measure of the reliability of the sample is usually
calculated by Cronbach‘s alpha which is 0.638 (normal value) and 0.692 (based on
standardized items). The scale and sample is reliable when Cronbach‘s alpha is
between 0.7 and 0.9. Hence in this case it can be said that reliability is achieved.
The validity of the findings refer to the dimensions applied fitting, predicting and
correlating and contributing to the construct or dependent variable they are measuring
collectively. In terms of statistics, this can be explained from factors or principal

247
component analysis and regression results. Some of the independent variables are not
correlating or contributing to measure performance or success rate of SWF. However,
their further verification is done by data analyses from other sources such as interview
transcripts and already published literature.
The important feature of the validity checks are: Does a novel argument in the findings
or proposition have any evidence, does refuting the existing argument of the literature
by the researcher have any evidence or how much is the similarity or differentiation
between existing and new findings. The following table of findings of this case study
and their support from the literature by similar findings confirm the validity of this
research study‘s recommendations and conclusion.
Table 6.10 Validity of the findings of this study
Variable Findings in this study Existing research
supporting this study
Governance Transparency Accountability
Governance is the dominating predictor of the growth
of SWF. Transparency and accountability is affected
by governance mechanism and do not affect directly
the growth of SWF.
Lyons,2007; Drezner,
2008; Fotak et al, 2008;;
Portman, 2008; Truman,
2008; Dixon and Monk,
2009; Monk, 2010;; Clark
and Knight, 2010; De
Bellis, 2010; Kotter and
Lel, 2011
Investee
country laws National security concerns tend to increase investment
barriers and control mechanisms‘ negative influence
over the growth of SWF. SWFs are not a threat to
developed economies.
Bahgat, 2008; Greene and
Yeager, 2008; Hayward,
2008; Kirshner, 2009
Trade
balances Trade balances do not directly impact the performance
and growth of SWF; however accumulation of FE
reserves over the time shifts balance of power to
developing and emerging economies SWFs.
Gieve, 2008; Alerbola and
Serena, 2008
Lack of
planning and
policies
This varies inversely with success rate and growth of
SWF
Chhaochharia and Laeven,
2009; Ang, 2010;
Sonarajah, 2011

248
Sponsoring
country laws
and political
objectives
Political objectives hamper the governance. Increase in
sponsoring country laws in response to protectionism
by developed investee countries would again reduce
growth of SWF. Sponsoring countries needs simple
governance mechanism and legal framework which
increase the ease of business and robustness of
performance, success and growth of SWF.
Drezner, 2008; Fotak et al,
2008; Portman, 2008; Park
and Estrada, 2011; Pistor
and Hatton 2011;
Structure and
purpose Governance and investment strategy mechanisms
would infuse the organisation of activities in the
SWFs. However, politically motivated investments or
objective to launch SWFs are barriers to long term
growth of SWFs.
Mitchell et al, 2008;
Bernstein et al, 2009;
Chhaochharia et al, 2009;
Pistor and Hatton, 2011
Investment
strategy: deal
and asset
allocation
Asset allocation, deal size and announcements can
affect the profitability of SWF and investee company
both. Oman SWF requires complete restructuring of
investment strategy and asset allocation fundamental
which strongly influence the growth of SWF.
Kern, 2007; Balding, 2008;
Santiso, 2008; Aizeman
and Glick, 2009; Balin,
2010; Paulson, 2009;Setser
and Ziemba, 2009;
Dewenter et al, 2010
Decision
making Current decision making is influenced by MoF or
political elites want to maintain the control over wealth
and power. Better the decision making by use of expert
knowledge systems and research prior to deal
finalization, more will be the successful deals and
increased investment opportunities.
Drezner, 2008; Mitchell et
al, 2008; Anderson, 2009; Pistor and Hatton, 2011
6.16 Summary
This chapter provided insights into what mangers and top executives related to SWF
think that is necessary to improve any global SWF in addition to Oman SWF for its
growth, credibility, strategy and decision making. The evidence to this was obtained in
the form of analyses of secondary and primary data. These multiple evidences also
enabled the testing of initially proposed theoretical framework.
This chapter has documented the results and data analyses of interview and
questionnaire data. Thus, analyses carried out based on the five different types of
evidences have enabled to finalize the proposed framework. The final framework can
be utilized by any SWF in the context such as objective to increase growth, or having
issues of concern for any factor mentioned in the framework. The results of this study

249
are compared to a possible extent with recent literature during finalizing the proposed
framework as there is no such empirical study carried out for analyzing the factors
affecting growth sovereign wealth funds. The use of statistical tests such as principal
component analyses and multiple regression analyses have increased the reliability and
validity of the conclusions and recommendations made.
The next and final chapter of this thesis provides concluding remarks and
recommendations in the form of research summary, limitations, implications for
academia and industry managers of SWF with further scope of extending this type of
research for sovereign wealth funds.

250
Chapter 7 Conclusion
7.1 Research summary
This chapter summarises the research and explain the contribution, implication and
further research scope arising from this thesis whilst considering its limitations. Based
on the findings of this study, recommendations are made for global SWFs and in
particular a restructuring plan for Oman SWF. According to Philips and Pugh (1994),
this chapter contains the utilization of theory which is strongly correlated to the
background, focal and data theories.
The research design combined data collection and analyses units, such as multiple data
sources, multiple analysis techniques deployed and multiple evidences utilized
enabling to test hypotheses. Secondary data was obtained from two SWFs Norway and
Oman whereas primary data was obtained only from Oman SWF in the form of 20
semi-structured interviews of top management and 153 questionnaire responses of
middle and operational level employees.
A surge in SWF investments has prompted the interests of various stakeholders in the
concept, deals and debate surrounding SWFs around the globe. Since, natural resources
are finite, becoming depleted overtime. In particular, GCC region economies are
interested in developing non-oil income based industries and markets in which SWF
would be a main catalyst. With unprecedented growth from US$ 500billion to
3.5trillion has brought many managerial issues of concerns to the domain of SWFs.
The major constituents to these problems are growth, governance, transparency, laws
and protectionism, polices and planning, trade balance, investment strategy and

251
decision making. This research study focussed on such factors affecting the
performance and success rate as two components of sustainable growth of SWFs.
The major challenges for SWFs and governments of sponsoring and investee countries
are: how to make these SWFs sustainable, how to utilize their financial leverage
appropriately to have lasting benefits for economies and how to manage them as an
industry while minimizing the conflicts between stakeholders on the either side of
investment deals. Thus, the research findings of this thesis about crucial factors for
growth would help SWF managers and governments to address such challenges.
A specific solution such as a restructuring plan for Oman SWF is an additional output
this research study. The analysis of findings about factors affecting growth of SWFs
and case analyses of Oman and Norway have enabled to prepare such a roadmap for
restructuring Oman SWF. This restructuring plan would bring a permanent solution to
Oman SWF because in the current scenario, no executive knows what is going in the
Oman SWF as there are no governance mechanisms or regulations in place, and no one
is accountable for loss of foreign exchange reserves in the investments.
7.2 Implications for theory and practice
The research findings arising from this study have many theoretical and practical
implications for academia and SWF business practitioners‘ communities respectively.
The study provides a set of important implications for global SWF managers and
government of Oman. It is important to know the wider implications of making SWF
investments – divestment decisions, making laws and barriers decisions, creating
governance and increasing transparency and utilizing the findings of this study. These
implications can either be positive or negative for SWFs, investee companies,

252
governments of sponsoring and investee countries, economies and markets of these
countries, SWF managers, researchers and theoretical body of knowledge of SWFs.
SWF investments announcements can bring positive outlook for stock prices of the
investee companies but depending on the deal size and reputation of SWF attached to
it, the market can have negative effects. Secondly, if the investments of high risk –
high return is followed by SWFs then money supply can be imbalanced between low
return stable firms and high return riskier businesses. Large numbers of SWF
divestment decisions can also negatively impact the markets and industries in the
investee countries. Continuous large overseas investments can also hamper the growth
of sponsoring country economies as cash available for local projects is reduced. Hence,
investments and divestments both can have positive or negative implications.
To reduce such negative impacts, investee and sponsoring countries create laws and
barriers which result in protectionism, reducing the trust and trade between investee
and sponsoring countries. This reduction in trust and trade has negative impacts on the
growth of a SWF. To create growing and profitable SWF, one may argue to create
governance mechanisms which would bring transparency and accountability within
SWF decision making and operation; however overdoing this may hamper the actual
tasks of creating profits and valuable asset base such as the case of Norway. Norway
SWF‘s conventional and overdone mechanisms along with divestment policies have
resulted in loss making deals in many quarters during the last decade. On the other end,
increased transparency and accountability would increase investors‘ confidence about
the governance in Oman business which may attract more foreign direct investmemts
(FDI) to Oman. This would again help SWF growth as government will have two
options: either invest profitably in FDI supported projects or invest in foreign equities

253
as liquidity demand would decrease domestically as FDI inflow increases. Therefore,
increased transparency and goevrnace has macro-economic benefit suhc as FDI increse
as well which ultimately can support SWF growth.
The findings of this study are based on the multiple data, analyses and evidences
found; and hence, it would have positive implications if one makes use of these factors
and findings in SWF management practice. For academic researchers, positive
implications are further research streams, development of SWF as a theory and
availability of validated framework which can be applied or utilized in different
research contexts. Also, the existing theories can be correlated as foundations of SWF
concept which again widens the scope of research.
The another implication arises from the possible generalizations of the findings of this
study for all SWFs worldwide which would enable the governments and regulators to
reach in creating an overarching institute for managing and monitoring all SWFs
together as a separate industry.
7.3 Contributions of the research
This thesis makes theoretical contribution to the body of knowledge in terms of
literature analyses, conceptual framework, research findings, methodologies applied
and further scope of the research.
The literature analysis suggests a strong relationship between streams of economics,
finance, trade and legal foundations and a concept of sovereign wealth fund. In
addition to this, a systematic review of literature of the last decade of SWF conceptual
development and their management also forwards the body of knowledge.

254
The conceptual framework is developed based on the extensive literature review and
industry data whose findings are validated based on the multiple sources of evidence;
hence the conceptual framework derived from hypotheses testing is one of the major
contribution and novelty from this thesis.
The major findings about governance mechanism, laws and protectionism, trade
balances, investment strategy, deal size and asset allocation backed up by evidences
from literature, industry data and primary data are contributing to the theoretical
refinement of SWF as a phenomenon (Partington, 2002).
There are not many empirical studies found in the literature which have applied
combined philosophies and mixed method approaches within the analytical frame of
study. Hence, application of such a methodology with support of triangulation in itself
become is another contribution to research domain of SWF concept.
The conceptual framework, applied methodology and research findings create a set of
opportunities for the future researchers and thus set a direction of research streams
entailing SWF as a theory. Since SWF is a complex subject requiring in-depth
understanding of existing theories, the outcome of this research study would be utilized
over the long term. This is because nature and context of any research are two major
attributes affecting the level of complexity of the research studies (Neuman, 2006).

255
The practical contribution is made in terms of findings about the factors affecting SWF
and the recommendations to global SWFs and Oman SWFs. Furthermore, Oman SWF
is presented with a restructuring plan as it was one of the objectives in this research.
The recommendations for global and Oman SWFs are made as a foundation to long
term incremental changes which make them feasible and easy to implement.
Recommendations for global SWFs are sourced from findings of this research study
and conceptual framework developed for growth of SWF. Thus, implementing these
recommendations would bring the improvement in the success rate and investment
performance of the SWF which would make a huge contribution towards uplifting the
SWFs in the global financial markets.
Oman SWF analyses for its secondary and primary data have enabled to prepare the
recommendations and its further restructuring plan. The implementation of these
recommendations and restructuring plan would bring the required changes in Oman
SWF in terms of organizational structure, investment strategy, planning, governance,
transparency and development of human capital. This would definitely be welcomed
by the interviewees and employees who voiced their resentment in their responses for
what is the current situation of Oman SWF. Thus, it would be one of biggest practical
contribution of this thesis.
This thesis makes an additional practical contribution by proposing SWF to be
considered as a separate industry such as having an overarching body to monitor and
regulate the SWF issues. The current portfolio and long term growth forecast for SWFs
is in the range of US$ 7 to 10 trillion in next 5 years from its existing asset

256
accumulation of approximately US$ 3.5 trillion which supports its industry status
proposition.
7.4 Limitations
The research limitations of this study can be categorised as research design and
theoretical limitations. The design limitations include low availability of secondary
data about Oman SWF; low response rate of questionnaires and limited number of
SWF cases. However these design limitations are taken care of by applying data and
methodological triangulations which make the impacts of these limitations negligible
on the research findings and their reliability and validity. The issue of limited number
of cases was nullified by a systematic review of literature which has many articles
reviewed containing various cases of large and global SWFs such as SAMA, ADIA,
CIC, Temasek, Norway and KIA. Hence, there was no need to increase number of
cases in the secondary data analyses.
Low significance of statistical results is removed by support of multiple evidences in
testing hypotheses. The methodological rigour and precision such as an application of
triangulation in the research work reduces such limitations and limitations fade away
over the time with the increasing use of findings of this study. Therefore,
generalization of findings is possible and these findings can be applied to any SWF
who has similar contextual issues.
7.5 Recommendations for global SWFs
A number of possible solutions and changes would bring Oman SWF having good
management style, investment strategy and governance in place. However, it would
need following decisions to be made for the long term success rate of Oman SWF.

257
First, the existing theories of economics, finance, international trade and business
management can be applied to understand the concept of SWF and to resolve any
conflicts arising in the SWF operations. Thus, it is recommended to utilize the
closely established link between theories and practical SWF activities for
strengthening the SWF.
Second, it is a myth that SWFs can affect global capital markets, since their total
asset base is only US$ 3.5 to 4 trillion which is almost negligible when compared
to hedge funds, insurance funds or pension funds. Therefore, second
recommendation is not to be afraid of SWFs, as they were much helpful during
the global credit crisis.
The empirical testing of the proposed framework found that qualitative and
quantitative factors are equally important and complementary to each other for the
growth of SWF. Therefore, SWF managers should concentrate on developing and
maintaining the culture of high level of professionalism, transparency and
accountability along with primary focus on the profitability and return on the
investments (ROI).
The example of Norway‘s negative quarterly returns on multiple occasions in the last
decade and the changes made in asset allocation policies raises questions over SWF‘s
traditional investment style, overdone governance mechanisms and strict divestments
policies which ultimately reduced the resilience of Norway SWF to market turbulence
and potential basic risks. Thus, global SWFs managers shall be able to identify, manage
and communicate different risks which affect the rate of return.
The losses made by GCC region funds, Norway and Temasek during financial crisis
revealed that the risks factors within the fund management of the fixed income portfolio

258
had not been appropriately identified and communicated. Few of these funds have strong
management control and governance mechanisms having a solid foundation. These
losses lay the foundations for improvement in such mechanisms or restructuring of the
funds. Hence, new mechanisms should direct the investment strategy based on weighing
expected returns against expected risk and usefulness of active management in
exploiting the characteristics of SWF.
We have seen the huge amount of rules, regulations and frameworks in the case of
Norway. If all SWFs and their sponsoring countries start developing these many rules
and in response to that there would be more of the same action by investee countries,
then the growth, performance and ease of operations are affected for all SWFs.
Therefore, it is proposed to develop a new global regulatory agency which can resolve
such conflicts between SWFs and investee companies or between the two
governments.
Further testing of this research study may be done using more data and different
research designs. Positive confirmations to such further research studies regarding the
same set of variables may increase the validity of this research. Hence, it is
recommended to researchers that findings and factors of this study are to be tested and
to compare the results.
7.6 Recommendations for Oman SWF
This section details the specific recommendations for Oman SWFs from based on their
secondary and primary data analyses. The restructuring plan for Oman SWF is given
separately in the next sections of this chapter.

259
The comparison between Norway and Oman SWFs suggests that first priority for
Oman SWF (SGRF) is to improve its organisational structure, by putting a robust
investment strategy and governance mechanism in place as part of reporting system,
monitoring and management control. This would further require sourcing and utilizing
the local and international talent in the process. This is the first step of restructuring the
organisation.
The next important step for SGRF is to start investing in the profitable deals. This is
possible by infusing culture of quality and developing the wealth management skills of
global level expertise. The large and successful funds in and outside the GCC have
made use of wealth managers such as investment banks, banks, advisors or research
analysts. This would help in returning to the profitability and accumulation of required
human capital over the years. Thus, SGRF requires actions to be taken for these
priorities first.
The two recommendations above are possible to implement by turning the Oman SWF
into a separate organisational entity rather than keeping it in its current form as a
department within the finance ministry. Also, it would start to have its own
organisational capabilities and resources developments when given the autonomy to
function professionally rather than under strict political influence. Many SWFs around
the world have become successful in this manner for example, Temasek and ADIA.
One can conclude that Oman SWF needs huge amount of hard work to grow, get
earning and expand. This is possible by collective efforts of government and
employees of SWF. The restructuring and investment strategy are keys to the further

260
success; however it is the governance, transparency and accountability as the major
traits of the organisational culture would add the sustainability to Oman SWF.
On implementation of recommendations appropriately, governance and transparency
standards may improve which would also increase investors‘ confidence worldwide.
This can ultimately results into increase in the foreign direct investments (FDI) inflow
to Oman. Increased FDI would eventually support the goals of Oman SWF about
bringing economical improvements.
7.7 The restructuring plan for Oman SWF
The findings from the analyses of primary and secondary data suggest that Oman SWF
requires overall restructuring of the organisation design mainly: planning, staffing,
controlling and monitoring. The planning function would bring changes in the
investment planning, strategic planning and internal business processes. The staffing
function would bring changes in the human capital attraction, training, development
and retaining the right talent. The monitoring function would enable the induction of
regulatory, reporting and control mechanisms in place which are currently absent now.
This would ultimately bring governance, transparency and accountability to the
organisation and make the decision making focussed and un-biased. The major aim of
this restructuring plan is to make the organisation‘s image more transparent, introduce
professionalism in the working culture of the SWF and increase the profitability of the
SWF. Therefore, one would suggest three levels of changes need to be introduced:
strategic, transformational and incremental. Transformational level changes would
bring the changes at the top level including leadership. The strategic changes would
include the policies and strategies of the SWF and incremental changes would be
brought to the core operations. The incremental changes would be implemented in a
phased manner and not a big bang introduction because phased manner of

261
implementing changes would reduce the organisational inertia in the form of
employee‘s resistance against the change.
The following self-explanatory diagram 8.1 reveals the complete restructuring plan.
The restructuring plan includes focus on profitability, organizational development,
leadership and monitoring and control. The profitability and leadership focus are part
of planning function as mentioned above which would provide new strategies and
policies to Oman SWF for example, development of new investment strategy, asset
allocation mechanism or deploying sustainability standards. The organizational
learning focus is part of the staffing function improvement which would see
development and accumulation of global level expertise through in-house development
and outsourcing. The monitoring and control would be done through developing
standards, code of conducts, effective decision making structure and benchmarking the
performance of Oman SWF with leading international SWFs.
Figure 7.1 Restructuring plan for Oman SWF
Adapted based on the analyses of findings
Profitability Focus
New Investment strategy and
policies
Asset allocations and ROI
targets
Market research and global
intelligence
Leadership Focus
Corporate strategy
Policy issues with other funds
and regulators
Corporate social responsibility
Organizational Learning Focus
Human capital development
Training and assessment
Zero tolerance for transgressors
Outsourcing global expertise
Monitoring and Control Focus
Mechanisms for governance and
accountability
Transparency and information
disclosure
Decision making and reporting
Performance measurement
Sustainable
Growth of
SWF

262
The implementation of this restructuring plan would be done by Government of Oman
which is not in the scope of this research study.
7.8 Future scope of research
Based on the findings of this research study, new research avenues emerging from the
debates of the proposed concept and research design context can be detailed as a scope
of further research streams in subject domain of sovereign wealth funds.
Future research can examine whether other SWFs and different demographic profiles
of respondents can influence the structure and composition of the dimensions
measuring growth, success and performance of the SWF.
This newly established research stream can focus on the sampling of the survey and
interviews which can be higher, or arranging other methods of data collection such as
focus groups comprising managers from each different SWF and wealth management
experts from central banks and investment banks. This will be beneficial for academic
researchers and SWF managers to know the differences between various investment
strategies under which their decision making is affected and why.
SWF management was found to be affecting the growth based on the decision making
strategies and employees‘ skills availability. Future researchers may increase their
attention to these aspects to identify any changes in the other factors affecting the
growth of their funds.
The another research avenue can arise from the time line of the data as this study
collected cross-sectional data where as next step can be to adopt a grounded theory

263
research strategy and study in depth causal relationships based on the longitudinal
research design.
Further research applying qualitative and longitudinal methods or more case studies
would be useful to test the findings of this study. Also, one can involve samples from
other countries which will see the comparison between SWFs based on the differences
across cultures, business dynamics and national settings.

264
References
Abdelal, R., 2009, Sovereign wealth in Abu Dhabi, Geopolitics, 14, 317–327
Aizenman, J., Glick, R., 2008, SWF: Stylized facts about their determinants and
governance, working paper published in December 2008, Available on
http://www.nber.org/papers/w14562
Alberola, E., Serena, J. M., 2008, Reserves, sovereign wealth funds and the resilience
of global imbalances, Economic Notes by Banca Monte dei Paschi di Siena SpA, 37, 3,
315–343
Anderson, E. C., 2009, Take the money and run, Westport: Praeger Security
International
Ang, A., 2010, The four benchmarks of sovereign wealth funds, Columbia business
school ad NBER, available at: http://ssrn.com/abstract=1680485
Baabood, A., 2006, EU-Gulf political and economic relations: Assessment and policy
recommendations, Gulf research centre, Available at http://www.grc.ae/index.php?
Baabood, A., 2009, Gulf-Europe relations: constraints and opportunities, A chapter in
the Gulf year book 2008–09, Gulf research centre,141–155, Available at
http://www.grc.ae/index.php?
Bahgat, G., 2008, Sovereign wealth funds: dangers and opportunities, International
Affairs, 84, 6, 1189–1204
Bahgat, G., 2010, Sovereign wealth funds: an assessment, Global Policy, 1, 2, 162–171
Balding, C., 2008, A Portfolio analysis of SWF, University of California, Dept. of
Economics, Published on June 6th
, 2008, Available at http://ssrn.com/abstract=1141531
Balin, B. J., 2010,The impact of the global economic crisis on sovereign wealth funds,
Asian – Pacific Economic Literature, doi: 10.1111/j.1467-8411.2010.01246.x,The
Australian National University and Blackwell Publishing Asia
Barney, J. B., 1986, Strategic Factor Markets: Expectations, Luck and Business
Strategy, Management Science; 32, 10, 1231–1241
Barney, J. B., 1991, Firm resources and sustained competitive advantage, Journal of
Management, 17, 99–120
Barney, J. B., Hesterly, W. S., 2008, Strategic management and competitive
advantages, New York: Pearson Prentice Hall
Barton, D., Boer, K. D., 2007, Tread lightly along the new Silk Road, The Mc Kinsey
Quarterly, March 2007 issue

265
Bean, B. W., 2010, Attack of the sovereign wealth funds: Defending the republic from
the threat of sovereign wealth funds?, Research paper 08–01 legal studies research
paper series of Michigan state university, college of law
Available at http://ssrn.com/abstract=1537323
Beck, R., Fidora, M., 2008, ‗The impact of SWF on global financial markets‘,
European Central Bank, Occasional papers 91, published in July 2008, Available at
http://www.ecb.int/pub/pdf/scpops/ecbocp91
Bernstein, S., Schoar, A. and Lerner, J., 2009, ‗The investment strategies of sovereign
wealth funds‘, Working paper 14861, National Bureau of Economic Research,
Cambridge, Available at http://www.nber.org.papers/w14861
Bhagwati, J., 2008, Sovereign wealth funds and implications for policy, Testimony
before The US Senate Foreign Relations Committee, June 2008, 1–11
Blundell-Wignall, A., Hu, Y., Yermo, J., 2008, Sovereign wealth and pension fund
issues, Financial Market Trends, 94, 1, 111–219, Paris, OECD Publishing
Blundell-Wignall, A., and Wehinger, G., 2008, Sovereign wealth funds in an evolving
global financial system, Paper presented in the conference hosted by Centre for
Applied Macroeconomic Analysis on 25–26 Sep., 2008, Sydney
Boyd, B.,1990, Corporate linkages and organizational environment: A test of the
resource dependence model, Strategic Management Journal, 11, 6, 419–430
Bryman, A., Bell, E., 2007, Business research methods, 2/e, Oxford: Oxford University
Press
Butt, S., Shivdasani, A., Stendevad, C., 2008, Sovereign wealth funds a growing global
force in corporate finance, Journal of Applied Corporate Finance, 20, 1, 73–83
Carmichael, J., Palacios, R. J., 2003, Managing public pension funds: A framework,
Paper presented to 2nd public pension fund management conference, World Bank,
Washington DC May 2003
Chandra, S. 2003, Regional economy size and the growth instability frontier: evidence
from Europe, Journal of Regional Science, 43, 1, 95–122
Chandra, S., Shadel, W. G., 2007, Crossing disciplinary boundaries: Applying
financial portfolio theory to model the organization of the self-concept, Journal of
Research in Personality, 41, 2, 346–373
Chesterman, S., 2008, The turn to ethics: disinvestment from multinational
corporations for human rights violations—the case of Norway‘s sovereign wealth fund,
American University International Law Review, 23, 577–615
Chhaochharia, V., Laeven, L., 2009, ‗Sovereign wealth funds: their investment
strategies and performance‘, Paper available at http://ssrn.com/abstract=1262383

266
Clark, G. L., 2009, Temptation and virtues of long term commitment: the governance
of sovereign wealth fund investment, Electronic copy available at http://ssrn.com
/abstract=1349123
Clark, G. L., Knight, E. R. W., 2010, Temptation and the virtues of long term
commitment: The governance of sovereign wealth fund investment, Asian Journal of
International Law, 1–28, doi:10.1017/S204425131000007X
Clark, G. L., Monk, A. H. B, 2010, Government of Singapore investment corporation
(GIC): insurer of last resort and bulwark of nation-state legitimacy, The Pacific
Review, 23, 4, 429–451
Cohen, B. J., and Council on Foreign Relations, 1986, In whose interest?: International
banking and American foreign policy, London: Yale University Press
Cornelissen, J., 2004, Corporate communication: a guide to theory and practice,
Thousand Oaks: Sage Publications
Crabbe, O., 1996, International financial markets, London: Prentice Hall
Creswell, J., 2003, Research design: Qualitative, Quantitative and Mixed methods
approaches, 2/e, Thousand Oaks: Sage Publications
Cutler, A., 2004, Methodical failure: the use of case study method by public relations
researchers, Public Relations Review, 30, 3, 365–375
Daft, R., 1983, Organizational theory and design, New York: West
Daniel, K. D., Hirshleifer, D., Subrahmanyam, A., 2001, Overconfidence, arbitrage,
and equilibrium asset pricing, Journal of Finance, 56, 3, 921–965
Das, U. S., Lu, Y., Mulder, C., Sy, A., 2009, Setting up a sovereign wealth fund: some
policy and operational considerations, IMF working paper 09/179
Davidson, S., 2010, Should we worry about sovereign wealth funds?, Policy, 26, 3, 37
– 41, Spring issue
Davis, J. H., Schoorman, F. D., Donaldson, L., 1997, Toward a stewardship theory of
Management, Academy of Management Review, 22, 1, 20–47
De Bellis, M., 2010, Global standards for sovereign wealth funds: The quest for
transparency, Asian Journal of International Law, Doi: 10.1017/S2044251310000123,
1–34
Denzin, N. K., 1970, The research act, New York: McGraw-Hill
Devlin, J., Titman, S., 2004, Managing oil prices risk in developing countries, World
Bank Research Observer, 19, 1, 119–139, Spring issue, Available at
http://ssrn.com/abstract=873728
Dewenter, K. L., Han, X., Malatesta, P. H., 2010, Firm values and sovereign wealth
fund investments, Journal of Financial Economics, 98, 256–278

267
Dillman, D. A., 2000, Mail and internet surveys -The tailored design method, New
York: John Wiley and Sons
Di Maggio, P. J., Powell, W. W., 1983, The iron cage revisited: Institutional
isomorphism and collective rationality in organizational fields, American Sociological
Review, 48, 147–160
Di Maggio, P. J., Powell, W. W., 1991, Introduction in The new institutionalism in
organizational analysis edited by Walter W. Powell and Paul J. DiMaggio, Chicago:
University of Chicago Press
Dixon, A., Monk, A.H.B., 2010, Rethinking the sovereign in sovereign wealth funds,
Available at: http://ssrn.com/abstract=1652701
Donaldson, T., Preston, L. E., 1995, The stakeholder theory of the corporation:
concepts, evidence and implications, Academy of Management Review, 20, 1, 65–91
Drezner, D. W., 2008, Sovereign wealth funds and the (in) security of global finance,
Journal of International Affairs, Fall/Winter issue, 62, 1, 115–131
Easterby-Smith, M., Thorpe, R., Jackson, P. R., 2009, Management research, 3/e,
London: Sage publications
Eisenhardt, K., 1989, Agency theory: An assessment and review, Academy of
Management Review, 14, 1, 57–74
Eizenstat, S., 2006, Testimony before the house committee on homeland security on
the CFIUS process and foreign investment in the US, Washington DC on 24th
May
2006
Epstein, R. A., Rose, A. M., 2009, The regulation of sovereign wealth funds: the
virtues of going slow, The University of Chicago Law Review, 76, 111–134
Fama, E., Jensen, M., 1983, Separation of ownership and control, Journal of Law and
Economics, 26, Winter issue, 301–325
Farrell, D., Lund, S., 2007, The new role of oil wealth in the world economy,
McKinsey Quarterly 16: 12, Available at www.mckinseyquarterly.com
Farrell, D., Lund, S., Gerlemann, E., Seeburger, P., 2007, ‗The new power brokers:
How oil, Asia, Hedge funds and private equity are shaping global capital markets‘,
Published by McKinsey Global Institute in October 2007, Available at
www.mckinsey.com /mgi/publications/The_New_Power_Brokers
Farrell, D., Lund, S., Sadan, K., 2008, The new power brokers: Gaining clout in
turbulent markets, Mc Kinsey Global Institute, July 2008 publication, 9–10
Fernandez, D. G., Eschweiler, B., 2008, ‗SWF: A bottom up primer‘, JP Morgan
Research, May Global issue, Singapore
Finkelstein, S., Hambrick, D., 1996, Strategic leadership: Top executives and their
effects on organisations, Minneapolis: West Publishing Company
268
Flick, U., 2002, Qualitative research: An introduction, London: Sage publications
Fotak, V., Bortolotti, B., Meggison, W., 2008, ‗The financial impact of sovereign
wealth fund investment in listed companies‘, MIMEO, June issue
Freeman, R. E., 1984, Strategic Management: A stakeholder approach. Boston: Pitman
publications
Friedman, A. L., Miles, S., 2002, Developing stakeholder theory, Journal of
Management Studies, 39, 1, 1–21
Friedman, T., 2008, ‗Preqin Sovereign wealth fund review‘, Preqin Limited, London
Ghoshal, S., Moran, P., 1996, Bad practice: A critique of the transaction cost theory,
Academy of Management Review, 21, 1, 13–47
Gieve, Sir J., 2008, SWF and global imbalances‘, Bank of England, Speech in
Quarterly Bulletin 2008, Q2
Gilson, R. J., Milhaupt, C. J., 2008, Sovereign wealth funds and corporate governance:
A minimalist response to the new mercantalism, Stanford Law Review, 60, 5, 1345–
1369
Gintschel, A., Scherer, B., 2008, Optimal asset allocation for sovereign wealth funds,
Journal of Asset Management, 9, 215–238
Gompers, P., Metrick, A., 2001, Institutional investors and equity prices, Quarterly
Journal of Economics, 116, 229–259
Greene, E. F., Yeager, B. A., 2008, SWF – a measured assessment, Capital Markets
Law Journal, 3, 3, 247–274
Hambrick, D. C., Mason, P. A., 1984, The organisation as a reflection of its top
managers, Academy of Management Review, 9, 2, 193–206
Hassan, A., 2009,A practical guide to sovereign wealth funds, London: Euromoney
Books
Hayward, M. L. A., Boeker, W., 1998, Power and conflicts of interest in professional
firms: Evidence from investment Banking, Administrative Science Quarterly, 43, 1, 1–
22
Hayward, P., 2008, Sovereign wealth fund investment in US financial institutions: too
much or not enough?, Banking and financial services policy report, 27, 5
Heany, R., Li, L., Valencia, V., 2011, Sovereign wealth fund investment decisions:
Temasek holdings, Australian Journal of Management, 36, 1, 109–120
Helleiner, E., Lundblad, 2008, The geopolitics of sovereign wealth funds: An
introduction, Geopolitics, 14, 2, 300–304

269
Hong, L., 2010, Depoliticization and regulation of sovereign wealth funds: A Chinese
perspective, Asian Journal of International Law, 1–20, doi: 10.1017 /
S204425131000010X
Hubbard, D., 2007, How to measure anything: Finding the value of intangibles in
business, New Jersey: John Wiley and Sons.
Huse, M., 2005, Accountability and creating accountability: A framework for
exploring behavioural perspectives of corporate governance, British Journal of
Management, 16, 1, 65–79
Jen, S., 2007, The definition of a sovereign wealth fund, Morgan Stanley, Available at
http://www.morganstanley.com/views/gef/archive/2007
Jen, S., 2007, How big could sovereign wealth funds be by 2015?, Morgan Stanley
Global Research, Published May 4
Johnson, S., 2007, The rise of sovereign wealth funds, Finance and Development, An
IMF Publication, 44, 3, 56–57, September issue
Jory, S. R., Perry M. J., Hemphill, T. A., 2010, Shanghai, Dubai, Mumbai or
Goodbye?, Review of Economic and Business Studies, 4, 103–124
Jory, S. R., Perry, M. J., Hemphill, T. A., 2010, The role of sovereign wealth funds in
global financial intermediation, Thunderbird International Business Review, 52, 589–
604
Karake-shalhoub, Z., 2008, Private equity, Islamic finance and sovereign wealth funds
in the MENA region, Thunderbird International Business Review, 50, 6, 359–368
Kerlinger, F. N., 1992, Foundations of behavioural research, 3/e, Orlando: Holt,
Rienhart and Winston
Kern, S., 2007, Sovereign wealth funds: State investments on the rise, Deutsche Bank
Research, Published September 10th
, Available at http://www.dbresearch.com
Keynes, J. M., 1933, National self sufficiency, Yale Review, 22, 755
Kjaer, K., 2008, Turning oil wealth into financial assets: the case of Norway, in
Johnson-Calari, J. and M. Rietveld, eds., Sovereign wealth management, London,
Central Banking Publications, 189–202
Kirshner, J., 2009, Sovereign wealth funds and national security: The dog that will
refuse to bark, Geopolitics, 14, 305–316
Klapper, L. F., Love, I., 2004, Corporate governance, investor protection and
performance in emerging markets, Journal of Corporate Finance, 10, 5, 703–728
Korac-Kakabadse, N., Kakabadse, A. and Kouzmin, A., 2002, Ethical considerations in
Management Research: A truth seeker‘s guide, in Essential skills for Management
Research, Sage Publications, London

270
Kotter, J., Lel, U., 2011, Friends or foes? Target selection decisions of sovereign
wealth funds and their consequences, Journal of Financial Economics,
doi:10.1016/j.jfineco.2011.03.007
Kunzel, P., Lu, Y., Petrova, I., Pihlman, J., 2010, Investment Objectives of Sovereign
Wealth Funds—A Shifting Paradigm, IMF Working paper, WP11/19
Lam, R. W., Rossi, M., 2010, Sovereign wealth funds – Investment strategies and
financial distress, Journal of Derivatives and Hedge Funds, 15, 4, 304–322
Lavelle, K. C., 2008, The business of governments: Nationalism in the context of
sovereign wealth funds and state owned enterprises, Journal of International Affairs,
Lerner, J., Schoar, A., Wongsunwai, W., 2007, Smart institutions, foolish choices?:
The limited partner performance puzzle, Journal of Finance, 62, 731–764
Lyons, G., 2007, ‗State capitalism: The rise of SWF‘, Journal of Management
Research, 7, 3, 119–147
Madura, J., 2003, ‗Financial markets and institutions‘, 6/e, Thomson South-Western,
Ohio
Makadok, R., 2001, Toward a synthesis of the resource-based view and dynamic-
capability views of rent creation, Strategic Management Journal, 22, 5, 387–401
Megginson, W. L., Bortolotti, B., Fotak, V., Miracky, W., 2009, ‗SWF investment
patterns and performance‘, Working paper published on 6th
April, 2009, Available at
http://ssrn.com/abstract=1364862
Merrill Lynch report ,2007, The overflowing bathtub, the running tap and SWFs in
Global Economy, Merrill Lynch global economic and financial reports
Miles, N. B., Huberman, A. M., 1994, A handbook of qualitative data analysis,
London: Sage publications
Mintzberg, H., 1989, Inside our strange world of organizations, New York: Free Press
Mitchell, O. S., Piggott, J. and Kumru, C., 2008, ‗Managing public investment funds:
Best practices and new questions‘, PEF, 7, 3, 321–356, November issue, Cambridge
University Press , Also available as working paper at ttp://www.nber.org/papers/w14078
Mitchell, R. K., Agle, B. R., Wood, D. J., 1997, Toward a theory of stakeholder
identification and salience: defining the principle of who and what really counts,
Academy of Management Review, 22, 4, 853–886
Monk, A. H. B., 2009, Recasting the sovereign wealth fund debate: Trust, legitimacy
and governance, New Political Economy, 14, 4, 451–468
Monk, A. H. B., 2010, Sovereignty in the era of global capitalism: The rise of
sovereign wealth funds and the power of finance, Electronic copy available at:
http://ssrn.com/abstract=1587327

271
Morgan Stanley, 2007, How big could sovereign wealth funds be by 2015, New York
and London, Morgan Stanley, Available at http://www.morganstanley.com/
views/perspectives/files/soverign_2.pdf
Neuman, W. L., 2006, Social research methods: Qualitative and quantitative
approaches, Boston: A B Longman
Oman budget reports, 2006 and 2009
Oman report, 2007, Vision for Oman‘s Economy 2020, Ministry of National Economy,
Sultanate of Oman
Oppenheim, A. N., 1992, Questionnaire design, interviewing and attitude
measurement, London: Pinter publications
Pallant, J., 2010, SPPS survival manual, Maidenhead: McGraw Hill
Park, D., Estrada, G. E., 2011, Developing Asia‘s sovereign wealth funds: The
Santiago principles and the case for self regulation, Asian Journal of International Law,
1–20, doi:10.1017/S2044251310000445
Paulson, A. L., 2009, Raising capital: The role of sovereign wealth funds, Chicago Fed
Letter, The Federal Reserve Bank of Chicago, January 2009, 258
Partington, D., 2002, Essential skills for management research, London: Sage
publications
Patelis, A., 2007, The overflowing bathtub, the running tap and SWFs, Merrill Lynch
Global Economics Report
Peteraf, M. A., 1993, The cornerstones of competitive advantage: A resource-based
view, Strategic Management Journal, 14, 3, 179–191
Pfeffer, J., Salancik, G. R., 1978, The external control of organizations: A resource
dependence perspective, New York: Harper and Row
Phillips, E. M. and Pugh, D. S., 1994, How to get a PhD, Milton Keynes: Open
University Press
Pimco, 2007, Perils of plenty: Can foreign reserves grow forever, San Francisco,
Pimco Global Central Bank Focus November 2007, www.pimco.com
Pimco, 2007, When capital flows uphill: emerging markets as creditors, San Francisco,
Pimco. See also http://www.pimco.com
Pimco, 2008, Decoupling, Pimco Emerging Markets Watch April 2008, Available at
www.pimco.com
Pistor, K., 2009, Sovereign wealth funds, banks and governments in the global crisis:
Towards a new governance of Global Finance?, European Business Organization Law
Review, 10, 333–352

272
Pistor, K., Hatton, K., 2011, Maximizing autonomy in the shadow of great powers: The
political economy of sovereign wealth funds, Columbia Public Law & Legal Theory
working papers, Nellco Legal Scholarship Repository
Preqin report, 2009, Sovereign wealth fund review, London: Preqin Scotia House
Radhi, N., 2008, Driving Malaysian economy: GLC transformation and Iskandar
development region, Khazanah, Presentation for EmNet, OECD, March issue
Reed, B. J., 2009, Sovereign wealth funds: The new barbarians at the gate? – An
analysis of the legal and business implications of their ascendancy‘, Virginia Law and
Business Review, 4, 1, 97–138
Remenyi, D., Williams, B., Money, A., Swartz, E., 1998, Doing research in business
and management: An introduction to process and method, London: Sage publications
Robson, C., 2002, Real world research, Oxford: Blackwell publishing
Rose, P., 2008, Sovereigns as shareholders, North Carolina Law Review, 87,101–166
Rozanov, A., 2005, Who holds the wealth of nations, Central Banking Quarterly
Journal
Rozanov, A., 2010, Definitional challenges of dealing with sovereign wealth funds,
Asian Journal of International Law, doi: 10.1017/S2044251310000081, 1–17
Salancik, G. R., 1979, Inter-organizational dependence and responsiveness to
Affirmative Action: The case of women and defence contractors, Academy of
Management Journal, 22, 2, 375–394
Santiso, J., 2008, Sovereign wealth funds: Key financial actors of the shifting wealth
funds, OECD Emerging Markets Network (Em Net) working paper series, October
issue, 1–23
Sastry, M. A., 1997, Problems and paradoxes in a model of punctuated organisational
change, Administrative Science Quarterly, 42, 237–275
Saunders, M., Lewis, P., Thornhill, A., 2009, Research methods for business students,
3/e, London: FT Prentice Hall
Schumer, C. E., 2008, Opening statement, Do sovereign wealth funds make the US
economy stronger or pose national security risks?, Joint Economic Committee Hearing,
US Congress, February issue
Sekaran, U., 2003, Research methods for business: A skill building approach, 4/e, New
Jersey: John Wiley and Sons
Seth, A., Carlson, K. D., Hatfield, D. E., Lan, H., 2009, So What? Beyond statistical
significance to substantive significance in strategy research, in Bergh, D. D., Ketchen,
D. J., Research methodology in strategy and management, 5, 3–27

273
Setser, B., Ziemba, R, 2009, GCC sovereign funds: Reversal of fortune, Council on
Foreign Relations, Centre for Geo-Economic studies
Seznec, J. F., 2008, The gulf sovereign wealth funds: Myths and reality, Middle East
Policy, XV, 2, 97–110
Shleifer, A., Vishny, R., 1994, Politicians and firms, Quarterly Journal of Economics
109, 995–1025
Silverman, D., 2000, Doing qualitative research: A Practical handbook, London: Sage
publications
Simms, J., Tomisawa, A., 2007, Tokyo adds veto in some foreign deals, The Wall
Street Journal, 5th
October issue
Singh, K., 2008, ‗Frequently asked questions about sovereign wealth funds‘, Published
in October 2008 by Public Interest Research Centre and The Corner House, UK
Sirmon, D. G., Hitt, M. A., Ireland, R. D., 2007, Managing firm resources in dynamic
environments to create value: Looking inside the black box, The Academy of
Management Review, 32, 1, 273–292
Sloman, J., 2004, Economics, London: Penguin
Sornarajah, M., 2011, Sovereign Wealth Funds and the Existing Structure of the
Regulation of Investments, Asian Journal of International Law, 1–22
doi:10.1017/S2044251310000330
Stangor, C., 2006, Research methods for the behavioural sciences, Boston: Houghton
Mifflin
Stevens, J., 1996, Applied multivariate statistics for the social sciences, New Jersey:
Lawrence Erlbaum
Stiglitz, J. E., 1993, The role of the state in financial markets, Proceedings of the
World Bank Annual Conference on Economic Development, Washington, 19–56
Summers, L., 2007, Sovereign funds shake the logic of capitalism, Financial times, 30th
July issue
Summers, L., 2008, Opportunities in an era of large and growing official wealth, as
mentioned in Johnson-Calari, J. and Rietveld, M., Sovereign wealth management,
London: Central Banking Publications, 15–28
Sun, T., Hesse, H., Kodres, L., 2009, Sovereign wealth funds and financial stability—
An event study analysis, IMF working paper in Monetary and Capital Markets,
Working paper number: 09/239
Swenson, D., 2009, Pioneering portfolio management: An unconventional approach to
institutional investment, New York: Simon and Schuster

274
Tabachnick, B. G., Fidell, L. S., 2007, Using multivariate statistics, Boston: Pearson
Education
Ter-Minassian, T., 2007, The role of fiscal institutions in managing the oil revenue
boom, IMF publication in March2007, 15–17
Tirole, J., 1994, The internal organization of governments, Oxford Economic Papers,
46, 1–29
The Report OMAN, 2009, London: Oxford Business Group, London
Thomas, S., Chen, J., 2011, China's sovereign wealth funds: origins, development, and
future roles, Journal of Contemporary China, 20, 70, 467–478
Truman, E. M., 2007, A scoreboard for sovereign wealth funds, Peterson Institute for
International Economics, Paper presented at the conference on China's exchange rate
policy on October 19, 2007, at the Peterson Institute, Washington, DC
Truman, E. M., 2007, Sovereign wealth funds: the need for greater transparency and
accountability‘, Peterson Institute for International Economics, Available at
www.Petersoninstitute.org
Truman, E. M., 2007, Testimony before the Committee on Banking, Housing, and
Urban Affairs, United States Senate Available at www.senate.gov
Truman, E. M., 2008, A blueprint for sovereign wealth fund best practices, Pearson
Institute of International Economics, Washington DC, Pearson International
Economics Policy Review, 8–3 , April issue
US GAO Report, 2008, Sovereign wealth fund data, GAO-08-946, A report to the
Committee on Banking, Housing, and Urban Affairs, U.S. Senate, September issue
Watson Wyatt Worldwide, 2006, The world‘s 300 largest pension funds, Washington,
DC: Watson Wyatt Worldwide
Watson Wyatt Worldwide, 2007, The world‘s sovereign wealth funds, Washington,
DC: Watson Wyatt Worldwide
Wernerfelt, B., 1984, A resource based view of the firm, Strategic Management
Journal, 5, 2, 171–180
Whetten, D. A., 1989, What constitutes a theoretical contribution, Academy of
Management Review, 14, 490–495
Williams, M., May, T., 1996, Introduction to the philosophy of social research,
London: Routledge
Wolf, M., 2007, We are living in a brave new world of state capitalism, Financial
Times, October 17 issue
www.imf.org, [Last accessed July 2011]
Global financial stability report, October, 2007

275
www.moneoman.gov.om, Major economic and social indicators of Sultanate of Oman
from Ministry of national economy [Last accessed April 2009]
www.NBIM.no, Norway SWF Reports: [Last accessed January 2011]
GPF act, 2010
GPFG annual report, 2009
GPFG factsheet, 2010
GPFG global annual report, 2009
GPFG responsible investment strategy, 2010
GPFG strategy, 2010
Ministry of finance, Government of Norway National Budget, 2010
Ministry of finance GPFG management Report, 2010
Ministry of finance on GPFG management report, 2009
NBIM annual report, 2009
NBIM financial stability report, 2009
NBIM global annual report, 2008
NBIM global annual report, 2009
Norway annual budget fiscal policy, 2010
Norway GPFG Annual Report, 2007
Norway GPFG Annual Report, 2009
Strategy council report by Dimson et al, 2010
Sustainable strategy report, 2008
www.nytimes.com/2008/01/15/us/politics/15demdebate-transcript.html,[Last accessed
October 2008]
www.swiftinstitute.org, [Last accessed October 2010]
Yi-Chong, X., 2009, Who‘s afraid of sovereign wealth funds?, Australian Journal of
International Affairs, 63, 1, 1–21
Yin, R. K., 2009, Case study research: Design and methods, Thousand Oaks: Sage
publications
Zhang, M., He, F., 2009, China‘s sovereign wealth fund: weakness and challenges,
China and World Economy, 17, 1, 101 - 116

276
APPNEDIX A - Scale Reliability Test Results
Case Processing Summary
N %
Cases Valid 151 98.7
Excludeda 2 1.3
Total 153 100.0
a. Listwise deletion based on all variables in
the
b.
c. procedure.
Reliability Statistics
Cronbach's
Alpha
Cronbach's
Alpha Based on
Standardized
Items N of Items
.638 .692 158
Summary Item Statistics
Mean Minimum Maximum Range
Maximum /
Minimum Variance N of Items
Item Means 4.437 -.004 6.947 6.951 -1622.258 3.216 158
Item Variances .789 .007 2.852 2.845 430.600 .350 158
Inter-Item Covariances .009 -.670 1.532 2.202 -2.285 .010 158
Inter-Item Correlations .014 -.902 1.000 1.902 -1.108 .016 158
Scale Statistics
Mean Variance Std. Deviation N of Items
701.0798321 340.994 18.46601266 158

277
APPENDIX – B PRINCIPAL COMPONENT ANALYSIS
RESULTS
QUESTION 1 MAIN OBJECTIVES H6
KMO and Bartlett's Test
Kaiser-Meyer-Olkin Measure of Sampling Adequacy. .526
Bartlett's Test of Sphericity Approx. Chi-Square 674.231
Df 36
Sig. .000
Total Variance Explained
Component
Initial Eigenvalues Extraction Sums of Squared Loadings
Rotation
Sums of
Squared
Loadingsa
Total
% of
Variance
Cumulative
% Total % of Variance Cumulative % Total
1 2.395 26.611 26.611 2.395 26.611 26.611 2.277
2 2.167 24.074 50.685 2.167 24.074 50.685 2.025
3 1.477 16.409 67.094 1.477 16.409 67.094 1.770
4 .984 10.938 78.032
5 .950 10.552 88.584
6 .590 6.551 95.134
7 .196 2.174 97.309
8 .165 1.828 99.137
9 .078 .863 100.000
Extraction Method: Principal Component Analysis.
a. When components are correlated, sums of squared loadings cannot be added to obtain a total variance.

278
Un rotated Component Matrixa
Component
1 2 3
DVLEPOBJ .708 -.563
EXPENOBJ .675 -.541
STABLOBJ .653 .602 .332
BILTLOBJ .641 .506 .512
DEMNDOBJ -.551 .436
RETRNOBJ
CHANGOBJ .451 .718 -.478
PLTCLOBJ -.407 .882
REVENOBJ
Extraction Method: Principal Component Analysis.
a. 3 components extracted.
Communalities
Initial Extraction
EXPENOBJ 1.000 .773
REVENOBJ 1.000 .048
DVLEPOBJ 1.000 .839
CHANGOBJ 1.000 .947
RETRNOBJ 1.000 .149
STABLOBJ 1.000 .899
BILTLOBJ 1.000 .929
PLTCLOBJ 1.000 .949
DEMNDOBJ 1.000 .505
Extraction Method: Principal Component
Analysis.

279
Component Score Coefficient Matrix
Component
1 2 3
EXPENOBJ .389 -.014 -.013
REVENOBJ -.008 .114 .070
DVLEPOBJ .404 -.005 -.002
CHANGOBJ -.005 .102 -.491
RETRNOBJ -.172 .019 .007
STABLOBJ -.005 .446 -.058
BILTLOBJ -.003 .490 .063
PLTCLOBJ -.011 .231 .578
DEMNDOBJ -.313 .000 -.001
Extraction Method: Principal Component Analysis.
Rotation Method: Oblimin with Kaiser Normalization.
Component Scores.

280
QUESTION 2 STRUCTURE OF THE FUND H6
Total Variance Explained
Component
Initial Eigenvalues
Extraction Sums of Squared
Loadings Rotation Sums of Squared Loadings
Total
% of
Variance
Cumulative
% Total
% of
Variance
Cumulati
ve % Total
% of
Variance
Cumulative
%
1 2.014 28.771 28.771 2.014 28.771 28.771 1.770 25.288 25.288
2 1.423 20.323 49.094 1.423 20.323 49.094 1.508 21.546 46.834
3 1.169 16.707 65.800 1.169 16.707 65.800 1.328 18.967 65.800
4 .983 14.037 79.838
5 .683 9.758 89.595
6 .501 7.158 96.753
7 .227 3.247 100.000
Extraction Method: Principal Component Analysis.
KMO and Bartlett's Test
Kaiser-Meyer-Olkin Measure of Sampling Adequacy. .465
Bartlett's Test of Sphericity Approx. Chi-Square 202.744
Df 21
Sig. .000

281
Un-rotated Component Matrixa
Component
1 2 3
OBJCTSTR .811 .334
STYLESTR .796 .357
CNFLTSTR .559 -.453
SOURCSTR -.400 .753
PURPSSTR -.401 .746
DECISSTR
OWNERSTR .861
Extraction Method: Principal Component Analysis.
a. 3 components extracted.
Communalities
Initial Extraction
PURPSSTR 1.000 .731
OBJCTSTR 1.000 .825
OWNERSTR 1.000 .837
SOURCSTR 1.000 .742
STYLESTR 1.000 .814
DECISSTR 1.000 .073
CNFLTSTR 1.000 .584
Extraction Method: Principal Component
Analysis.
Component Score Coefficient Matrix
Component
1 2 3
PURPSSTR .013 .569 .029
OBJCTSTR .278 .032 .439
OWNERSTR -.217 -.025 .721
SOURCSTR .013 .574 .036
STYLESTR .506 .047 .005
DECISSTR -.022 -.134 -.155
CNFLTSTR .460 .002 -.220
Extraction Method: Principal Component Analysis.
Rotation Method: Varimax with Kaiser
Normalization.
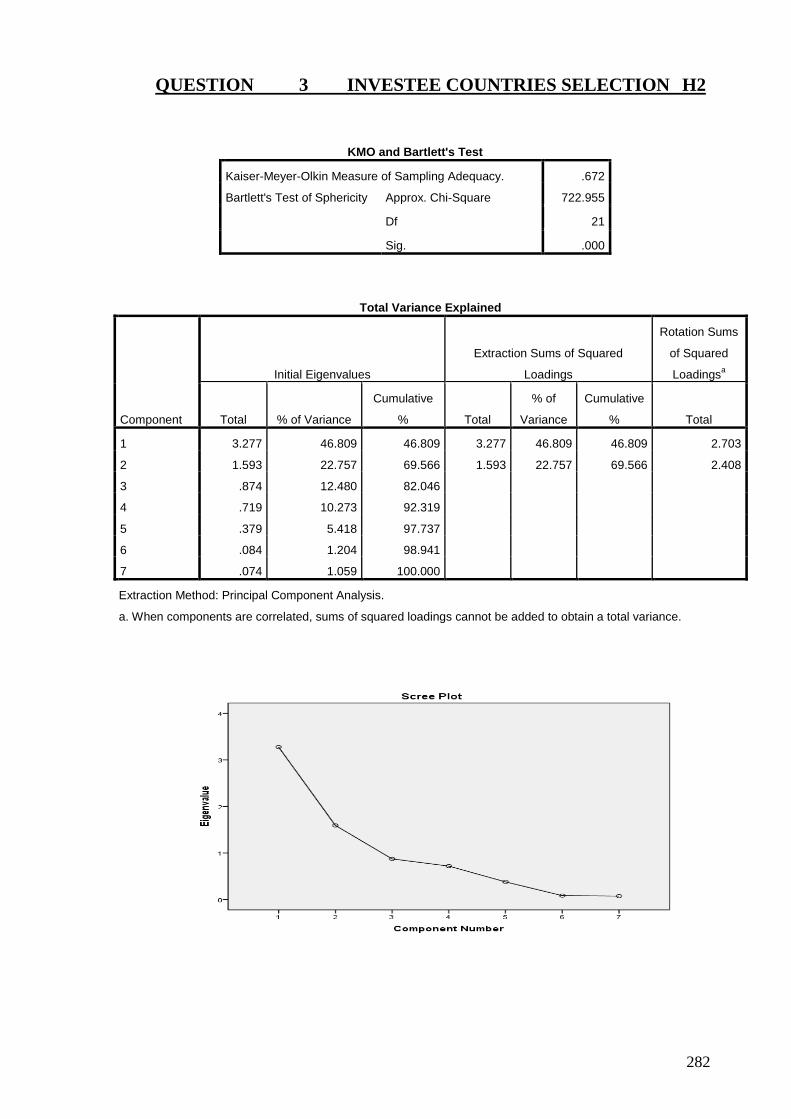
282
QUESTION 3 INVESTEE COUNTRIES SELECTION H2
KMO and Bartlett's Test
Kaiser-Meyer-Olkin Measure of Sampling Adequacy. .672
Bartlett's Test of Sphericity Approx. Chi-Square 722.955
Df 21
Sig. .000
Total Variance Explained
Component
Initial Eigenvalues
Extraction Sums of Squared
Loadings
Rotation Sums
of Squared
Loadingsa
Total % of Variance
Cumulative
% Total
% of
Variance
Cumulative
% Total
1 3.277 46.809 46.809 3.277 46.809 46.809 2.703
2 1.593 22.757 69.566 1.593 22.757 69.566 2.408
3 .874 12.480 82.046
4 .719 10.273 92.319
5 .379 5.418 97.737
6 .084 1.204 98.941
7 .074 1.059 100.000
Extraction Method: Principal Component Analysis.
a. When components are correlated, sums of squared loadings cannot be added to obtain a total variance.

283
Component Matrixa
Component
1 2
REASNINV .831 -.344
ALLNINV .821 -.413
INVESINV .781 .502
GROTHINV .754 .522
LNGRTINV .725 -.402
AVAILINV .380 .642
SECURINV .455
Extraction Method: Principal
Component Analysis.
a. 2 components extracted.
Communalities
Initial Extraction
REASNINV 1.000 .809
SECURINV 1.000 .269
INVESINV 1.000 .863
AVAILINV 1.000 .556
ALLNINV 1.000 .845
LNGRTINV 1.000 .687
GROTHINV 1.000 .841
Extraction Method: Principal
Component Analysis.

284
QUESTION 4 GOVERNANCE REFORM H1
KMO and Bartlett's Test
Kaiser-Meyer-Olkin Measure of Sampling Adequacy. .654
Bartlett's Test of Sphericity Approx. Chi-Square 273.999
Df 10
Sig. .000
Total Variance Explained
Component
Initial Eigenvalues Extraction Sums of Squared Loadings
Rotation Sums
of Squared
Loadingsa
Total % of Variance Cumulative % Total % of Variance Cumulative % Total
1 2.619 52.377 52.377 2.619 52.377 52.377 2.611
2 1.081 21.630 74.007 1.081 21.630 74.007 1.099
3 .695 13.902 87.909
4 .403 8.056 95.966
5 .202 4.034 100.000
Extraction Method: Principal Component Analysis.
a. When components are correlated, sums of squared loadings cannot be added to obtain a total variance.
Un – rotated Component Matrixa

285
Component
1 2
OVERARFM .852
ROLESRFM .844
DISCLRFM .802
DECISRFM .722 -.395
GOVERRFM .925
Extraction Method: Principal
Component Analysis.
a. 2 components extracted.
Communalities
Initial Extraction
GOVERRFM 1.000 .874
DISCLRFM 1.000 .654
DECISRFM 1.000 .677
ROLESRFM 1.000 .768
OVERARFM 1.000 .728
Extraction Method: Principal Component
Analysis.
Component Score Coefficient Matrix
Component
1 2
GOVERRFM -.009 .856
DISCLRFM .312 -.065
DECISRFM .301 -.334
ROLESRFM .306 .253
OVERARFM .321 .083
Extraction Method: Principal
Component Analysis.
Rotation Method: Oblimin with Kaiser
Normalization.

286
QUESTION 5 TRANSPARENCY H1
Total Variance Explained
Component
Initial Eigenvalues Extraction Sums of Squared Loadings
Total % of Variance Cumulative % Total % of Variance Cumulative %
1 3.206 53.440 53.440 3.206 53.440 53.440
2 1.296 21.607 75.047 1.296 21.607 75.047
3 .855 14.242 89.289
4 .417 6.946 96.235
5 .226 3.765 100.000
6 .000 .000 100.000
Extraction Method: Principal Component Analysis.
Rotation could not be converged within 25 rotations for Q5 of transparency.
Component Matrixa
Component
1 2
REGULTRN .844 .463
EVALUTRN .844 .463
RETRNTRN .835
RTNGSTRN .759 -.335
BNCMRTRN .710 -.541
ANOUNTRN .668
Extraction Method: Principal Component
Analysis.
a. 2 components extracted.

287
QUESTION 6 GLOBALLY ACCEPTED LAWS H1 & H5
Total Variance Explained
Component
Initial Eigenvalues Extraction Sums of Squared Loadings
Rotation Sums
of Squared
Loadingsa
Total % of Variance Cumulative % Total % of Variance Cumulative % Total
1 3.994 57.060 57.060 3.994 57.060 57.060 3.930
2 1.280 18.290 75.351 1.280 18.290 75.351 1.555
3 .999 14.269 89.620
4 .548 7.824 97.444
5 .179 2.556 100.000
6 .000 .000 100.000
7 .000 .000 100.000
Extraction Method: Principal Component Analysis.
a. When components are correlated, sums of squared loadings cannot be added to obtain a total variance.

288
Communalities
Initial Extraction
HMRGTLAW 1.000 .684
CHLDLLAW 1.000 .978
EQULTLAW 1.000 .822
FAIRGLAW 1.000 .481
POLUTLAW 1.000 .978
WEAPNLAW 1.000 .354
MLAUNLAW 1.000 .978
Extraction Method: Principal Component
Analysis.
Component Matrixa
Component
1 2
POLUTLAW .984
CHLDLLAW .984
MLAUNLAW .984
EQULTLAW .864
FAIRGLAW .649
HMRGTLAW .529 .636
WEAPNLAW -.592
Extraction Method: Principal
Component Analysis.
a. 2 components extracted.
Component Score Coefficient Matrix
Component
1 2
HMRGTLAW .054 .513
CHLDLLAW .255 .006
EQULTLAW .247 -.134
FAIRGLAW -.018 .500
POLUTLAW .255 .006
WEAPNLAW .058 -.443
MLAUNLAW .255 .006
Extraction Method: Principal
Component Analysis.
Rotation Method: Oblimin with Kaiser
Normalization.

289
QUESTION 7 INVESTMENT RIGHTS H4 & H2
KMO and Bartlett's Test
Kaiser-Meyer-Olkin Measure of Sampling Adequacy. .499
Bartlett's Test of Sphericity Approx. Chi-Square 5.633
Df 6
Sig. .466
Total Variance Explained
Component
Initial Eigenvalues Extraction Sums of Squared Loadings
Rotation Sums
of Squared
Loadingsa
Total % of Variance Cumulative % Total % of Variance Cumulative % Total
1 1.191 29.777 29.777 1.191 29.777 29.777 1.191
2 1.019 25.475 55.252 1.019 25.475 55.252 1.019
3 .981 24.529 79.781
4 .809 20.219 100.000
Extraction Method: Principal Component Analysis.
a. When components are correlated, sums of squared loadings cannot be added to obtain a total variance.

290
Component Matrixa
Component
1 2
VINVERGT .772
NOMINRGT .767
INFRMRGT .715
TRADERGT -.711
Extraction Method: Principal
Component Analysis.
a. 2 components extracted.
Communalities
Initial Extraction
VINVERGT 1.000 .596
NOMINRGT 1.000 .590
TRADERGT 1.000 .512
INFRMRGT 1.000 .511
Extraction Method: Principal Component
Analysis.
Component Score Coefficient Matrix
Component
1 2
VINVERGT .648 -.023
NOMINRGT .645 .024
TRADERGT .045 -.700
INFRMRGT .045 .700
Extraction Method: Principal
Component Analysis.
Rotation Method: Oblimin with Kaiser
Normalization.

291
QUESTION 8 TRADE BALANCES H3
KMO and Bartlett's Test
Kaiser-Meyer-Olkin Measure of Sampling Adequacy. .539
Bartlett's Test of Sphericity Approx. Chi-Square 8.543
Df 3
Sig. .036
Total Variance Explained
Component
Initial Eigenvalues Extraction Sums of Squared Loadings
Total
% of
Variance Cumulative % Total
% of
Variance Cumulative %
1 1.269 42.287 42.287 1.269 42.287 42.287
2 .935 31.156 73.443
3 .797 26.557 100.000
Extraction Method: Principal Component Analysis.

292
Component Matrixa
Component
1
BILATBAL .729
CURNCBAL .690
TRADEBAL -.511
Extraction Method: Principal
Component Analysis.
a. 1 components extracted.
a. Only one component was extracted. The
solution cannot be rotated.
Component Score Coefficient Matrix
Component
1
BILATBAL .574
CURNCBAL .544
TRADEBAL -.403
Extraction Method: Principal Component
Analysis.
Rotation Method: Oblimin with Kaiser
Normalization.

293
QUESTION 9 INVESTMENT PLANNING H4, H7, H8
Total Variance Explained
Compo
nent
Initial Eigenvalues Extraction Sums of Squared Loadings
Rotation Sums
of Squared
Loadingsa
Total % of Variance Cumulative % Total % of Variance
Cumulative
% Total
1 3.102 38.779 38.779 3.102 38.779 38.779 2.793
2 1.713 21.407 60.186 1.713 21.407 60.186 1.704
3 1.390 17.378 77.564 1.390 17.378 77.564 2.220
4 .668 8.354 85.918
5 .584 7.303 93.220
6 .323 4.040 97.260
7 .219 2.740 100.000
8 .000 .000 100.000
Extraction Method: Principal Component Analysis.
a. When components are correlated, sums of squared loadings cannot be added to obtain a total variance.
Component Matrixa
Component
1 2 3
APRSLPLN .871
ADMINPLN .858 -.474
SKILLPLN .858 -.474
TRAINPLN .582 .559
BIASSPLN .541 .499
ABSNCPLN .915
SHORTPLN .901
DPENDPLN .489 .563
Extraction Method: Principal Component Analysis.
a. 3 components extracted.

294
Communalities
Initial Extraction
SHORTPLN 1.000 .858
BIASSPLN 1.000 .565
APRSLPLN 1.000 .764
ABSNCPLN 1.000 .848
DPENDPLN 1.000 .573
ADMINPLN 1.000 .969
SKILLPLN 1.000 .969
TRAINPLN 1.000 .659
Extraction Method: Principal Component
Analysis.
Component Score Coefficient Matrix
Component
1 2 3
SHORTPLN .018 .545 -.029
BIASSPLN .001 .021 .388
APRSLPLN .277 -.001 .156
ABSNCPLN -.017 .539 .031
DPENDPLN -.033 .002 .406
ADMINPLN .397 .000 -.056
SKILLPLN .397 .000 -.056
TRAINPLN -.003 -.022 .421
Extraction Method: Principal Component Analysis.
Rotation Method: Oblimin with Kaiser Normalization.

295
QUESTION 10 INTEGRATE INVESTMENTS H5, H8
KMO and Bartlett's Test
Kaiser-Meyer-Olkin Measure of Sampling Adequacy. .649
Bartlett's Test of Sphericity Approx. Chi-Square 235.201
Df 15
Sig. .000
Total Variance Explained
Component
Initial Eigenvalues Extraction Sums of Squared Loadings
Rotation Sums
of Squared
Loadingsa
Total % of Variance Cumulative % Total % of Variance Cumulative % Total
1 2.597 43.285 43.285 2.597 43.285 43.285 2.090
2 1.011 16.853 60.138 1.011 16.853 60.138 1.934
3 .954 15.899 76.037
4 .655 10.921 86.958
5 .556 9.270 96.228
6 .226 3.772 100.000
Extraction Method: Principal Component Analysis.
a. When components are correlated, sums of squared loadings cannot be added to obtain a total variance.

296
Component Matrixa
Component
1 2
HELPLINT .815 .402
REASNINT .756
SULTNINT .689
DIFRNINT .676 -.389
SIZESINT .551 -.575
NGHBRINT .354 .546
Extraction Method: Principal
Component Analysis.
a. 2 components extracted.
Communalities
Initial Extraction
REASNINT 1.000 .619
DIFRNINT 1.000 .609
SULTNINT 1.000 .498
NGHBRINT 1.000 .423
HELPLINT 1.000 .825
SIZESINT 1.000 .634
Extraction Method: Principal Component
Analysis.
Component Score Coefficient Matrix
Component
1 2
REASNINT .119 .361
DIFRNINT .432 -.050
SULTNINT .303 .106
NGHBRINT -.193 .453
HELPLINT .034 .496
SIZESINT .497 -.206
Extraction Method: Principal
Component Analysis.
Rotation Method: Oblimin with Kaiser
Normalization.

297
QUESTION 11 SPECIFIC PLAN ABSENCE H4
KMO and Bartlett's Test
Kaiser-Meyer-Olkin Measure of Sampling Adequacy. .570
Bartlett's Test of Sphericity Approx. Chi-Square 195.576
Df 10
Sig. .000
Total Variance Explained
Component
Initial Eigenvalues Extraction Sums of Squared Loadings
Rotation Sums
of Squared
Loadingsa
Total % of Variance Cumulative % Total % of Variance Cumulative % Total
1 2.104 42.088 42.088 2.104 42.088 42.088 1.942
2 1.137 22.740 64.828 1.137 22.740 64.828 1.373
3 .951 19.022 83.850
4 .614 12.281 96.131
5 .193 3.869 100.000
Extraction Method: Principal Component Analysis.
a. When components are correlated, sums of squared loadings cannot be added to obtain a total variance.

298
Component Matrixa
Component
1 2
PLANSSPL .883
AGNDASPL .843 .381
DEPTSSPL .606 -.459
RISKSSPL .497 -.623
LQUDTSPL .551
Extraction Method: Principal
Component Analysis.
a. 2 components extracted.
Communalities
Initial Extraction
DEPTSSPL 1.000 .577
PLANSSPL 1.000 .869
RISKSSPL 1.000 .635
LQUDTSPL 1.000 .303
AGNDASPL 1.000 .857
Extraction Method: Principal Component
Analysis.
Component Score Coefficient Matrix
Component
1 2
DEPTSSPL .098 -.493
PLANSSPL .490 .022
RISKSSPL -.009 -.593
LQUDTSPL .199 .420
AGNDASPL .503 .094
Extraction Method: Principal
Component Analysis.
Rotation Method: Oblimin with Kaiser
Normalization.

299
QUESTION 12 SPONSORING COUNTRY LAWS H5
KMO and Bartlett's Test
Kaiser-Meyer-Olkin Measure of Sampling Adequacy. .509
Bartlett's Test of Sphericity Approx. Chi-Square 285.836
Df 10
Sig. .000
Total Variance Explained
Component
Initial Eigenvalues Extraction Sums of Squared Loadings
Rotation Sums
of Squared
Loadingsa
Total % of Variance Cumulative % Total % of Variance Cumulative % Total
1 1.968 39.368 39.368 1.968 39.368 39.368 1.958
2 1.272 25.437 64.806 1.272 25.437 64.806 1.289
3 .972 19.436 84.242
4 .701 14.026 98.268
5 .087 1.732 100.000
Extraction Method: Principal Component Analysis.
a. When components are correlated, sums of squared loadings cannot be added to obtain a total variance.

300
Component Matrixa
Component
1 2
CURNLSCL .968
FAVORSCL .961
UPDATSCL .743
OBJCTSCL -.660
OLDLSCL .510
Extraction Method: Principal
Component Analysis.
a. 2 components extracted.
Communalities
Initial Extraction
UPDATSCL 1.000 .632
OLDLSCL 1.000 .278
CURNLSCL 1.000 .946
FAVORSCL 1.000 .937
OBJCTSCL 1.000 .448
Extraction Method: Principal Component
Analysis.
Component Score Coefficient Matrix
Component
1 2
UPDATSCL .070 .600
OLDLSCL .018 .407
CURNLSCL .497 .001
FAVORSCL .496 -.013
OBJCTSCL .118 -.504
Extraction Method: Principal
Component Analysis.
Rotation Method: Oblimin with Kaiser
Normalization.

301
QUESTION 13 LAWS AND REGULATIONS
KMO and Bartlett's Test
Kaiser-Meyer-Olkin Measure of Sampling Adequacy. .632
Bartlett's Test of Sphericity Approx. Chi-Square 486.498
Df 10
Sig. .000
Total Variance Explained
Component
Initial Eigenvalues Extraction Sums of Squared Loadings
Rotation Sums
of Squared
Loadingsa
Total % of Variance Cumulative % Total % of Variance Cumulative % Total
1 2.641 52.826 52.826 2.641 52.826 52.826 2.639
2 1.029 20.587 73.412 1.029 20.587 73.412 1.058
3 .950 18.996 92.408
4 .335 6.699 99.107
5 .045 .893 100.000
Extraction Method: Principal Component Analysis.
a. When components are correlated, sums of squared loadings cannot be added to obtain a total variance.
Component Matrixa

302
Communalities
Initial Extraction
DIVRSLRG 1.000 .888
COMMNLRG 1.000 .935
MEANSLRG 1.000 .763
PENLTLRG 1.000 .647
CONDCLRG 1.000 .437
Extraction Method: Principal Component
Analysis.
Component
1 2
DIVRSLRG .936
COMMNLRG .967
MEANSLRG .873
PENLTLRG .802
CONDCLRG .611
Extraction Method: Principal Component
Analysis.
a. 2 components extracted.
Component Score Coefficient Matrix
Component
1 2
DIVRSLRG .358 -.059
COMMNLRG .366 .036
MEANSLRG .330 .054
PENLTLRG -.055 .769
CONDCLRG .071 .601
Extraction Method: Principal Component
Analysis.
Rotation Method: Oblimin with Kaiser
Normalization.

303
QUESTION 14 ALLOCATION H7
KMO and Bartlett's Test
Kaiser-Meyer-Olkin Measure of Sampling Adequacy. .531
Bartlett's Test of Sphericity Approx. Chi-Square 35.315
Df 6
Sig. .000
Total Variance Explained
Component
Initial Eigenvalues Extraction Sums of Squared Loadings
Total % of Variance Cumulative % Total % of Variance Cumulative %
1 1.514 37.846 37.846 1.514 37.846 37.846
2 .978 24.456 62.302
3 .941 23.525 85.827
4 .567 14.173 100.000
Extraction Method: Principal Component Analysis.

304
Component Matrixa
Component
1
CAPTLALO
INCMEALO .773
STATSALO .434
MRKTSALO .813
Extraction Method: Principal
Component Analysis.
a. 1 components extracted.
Communalities
Initial Extraction
CAPTLALO 1.000 .067
INCMEALO 1.000 .598
STATSALO 1.000 .188
MRKTSALO 1.000 .661
Extraction Method: Principal Component
Analysis.
Component Score
Coefficient Matrix
Component
1
CAPTLALO -.171
INCMEALO .511
STATSALO .287
MRKTSALO .537
Extraction Method: Principal
Component Analysis.
Rotation Method: Oblimin
with Kaiser Normalization.

305
QUESTION 15 FOREIGN INVESTMENTS REJECTION H5
KMO and Bartlett's Test
Kaiser-Meyer-Olkin Measure of Sampling Adequacy. .721
Bartlett's Test of Sphericity Approx. Chi-Square 276.867
Df 28
Sig. .000
Total Variance Explained
Component
Initial Eigenvalues Extraction Sums of Squared Loadings
Rotation Sums
of Squared
Loadingsa
Total % of Variance Cumulative % Total % of Variance Cumulative % Total
1 2.691 33.635 33.635 2.691 33.635 33.635 2.657
2 1.080 13.499 47.135 1.080 13.499 47.135 1.164
3 1.070 13.375 60.510 1.070 13.375 60.510 1.144
4 1.021 12.768 73.278 1.021 12.768 73.278 1.047
5 .815 10.188 83.465
6 .721 9.007 92.473
7 .388 4.851 97.323
8 .214 2.677 100.000
Extraction Method: Principal Component Analysis.
a. When components are correlated, sums of squared loadings cannot be added to obtain a total variance.

306
Component Score Coefficient Matrix
Component
1 2 3 4
LWTRNRJF -.044 .076 -.829 .010
PRIORRJF .005 -.017 .016 .913
CLOBJRJF .321 -.048 -.133 .054
SINFORJF .315 .202 .033 -.009
ABAGNRJF .344 -.039 .034 .069
CNSFIRJF .225 -.181 .218 -.344
WARSSRJF -.093 .379 .398 .008
BILATRJF .038 .820 -.056 .003
Extraction Method: Principal Component Analysis.
Rotation Method: Oblimin with Kaiser Normalization.
Component Matrixa
Component
1 2 3 4
LWTRNRJF .321 -.731 .406
PRIORRJF .606 .724
CLOBJRJF .887
SINFORJF .762
ABAGNRJF .891
CNSFIRJF .548 -.352
WARSSRJF -.452 .356 -.321
BILATRJF .859
Extraction Method: Principal Component Analysis.
a. 4 components extracted.
Communalities
Initial Extraction
LWTRNRJF 1.000 .821
PRIORRJF 1.000 .921
CLOBJRJF 1.000 .797
SINFORJF 1.000 .681
ABAGNRJF 1.000 .821
CNSFIRJF 1.000 .503
WARSSRJF 1.000 .497
BILATRJF 1.000 .821
Extraction Method: Principal Component
Analysis.

307
QUESTION 16 FOREIGN INVESTMENTS FAVOURED H7
KMO and Bartlett's Test
Kaiser-Meyer-Olkin Measure of Sampling Adequacy. .567
Bartlett's Test of Sphericity Approx. Chi-Square 135.485
Df 21
Sig. .000
Total Variance Explained
Component
Initial Eigenvalues
Extraction Sums of Squared
Loadings
Rotation
Sums of
Squared
Loadings
a
Total
% of
Variance
Cumulative
% Total
% of
Varianc
e
Cumulative
% Total
1 2.035 29.077 29.077 2.035 29.077 29.077 1.907
2 1.436 20.510 49.587 1.436 20.510 49.587 1.420
3 1.029 14.703 64.291 1.029 14.703 64.291 1.292
4 .835 11.929 76.219
5 .702 10.036 86.255
6 .539 7.700 93.955
7 .423 6.045 100.000
Extraction Method: Principal Component Analysis.
a. When components are correlated, sums of squared loadings cannot be added to obtain a total
variance.

308
Component Matrixa
Component
1 2 3
LRISKFIF -.582 -.485
SUBSTFIF .777
GRNTDFIF .809
DURABFIF .605
GDMNDFIF .754
COMPTFIF .757
TCTRNFIF -.396 .808
Extraction Method: Principal Component Analysis.
a. 3 components extracted.
Communalities
Initial Extraction
LRISKFIF 1.000 .592
SUBSTFIF 1.000 .620
GRNTDFIF 1.000 .718
DURABFIF 1.000 .455
GDMNDFIF 1.000 .647
COMPTFIF 1.000 .621
TCTRNFIF 1.000 .848
Extraction Method: Principal
Component Analysis.
Component Score Coefficient Matrix
Component
1 2 3
LRISKFIF -.422 .189 -.242
SUBSTFIF .104 .533 .046
GRNTDFIF -.075 .595 -.051
DURABFIF .359 .110 .040
GDMNDFIF .258 -.083 -.388
COMPTFIF .388 .117 -.095
TCTRNFIF .106 -.018 .787
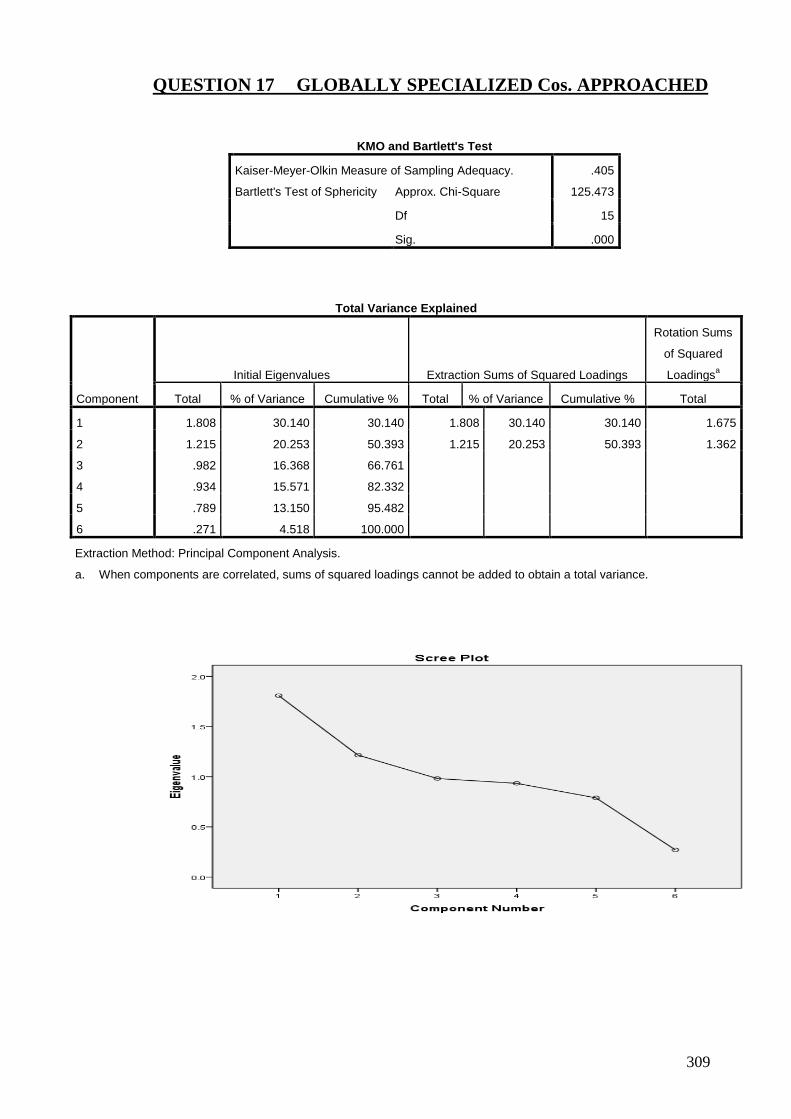
309
QUESTION 17 GLOBALLY SPECIALIZED Cos. APPROACHED
KMO and Bartlett's Test
Kaiser-Meyer-Olkin Measure of Sampling Adequacy. .405
Bartlett's Test of Sphericity Approx. Chi-Square 125.473
Df 15
Sig. .000
Total Variance Explained
Component
Initial Eigenvalues Extraction Sums of Squared Loadings
Rotation Sums
of Squared
Loadingsa
Total % of Variance Cumulative % Total % of Variance Cumulative % Total
1 1.808 30.140 30.140 1.808 30.140 30.140 1.675
2 1.215 20.253 50.393 1.215 20.253 50.393 1.362
3 .982 16.368 66.761
4 .934 15.571 82.332
5 .789 13.150 95.482
6 .271 4.518 100.000
Extraction Method: Principal Component Analysis.
a. When components are correlated, sums of squared loadings cannot be added to obtain a total variance.

310
Component Matrixa
Component
1 2
MKTRSGLC -.394
NAVILGLC .803 .455
INCRTGLC .471
STAFCGLC .831
ABTEMGLC -.800
LACPLGLC -.466
Extraction Method: Principal
Component Analysis.
a. 2 components extracted.
Component Score Coefficient Matrix
Component
1 2
MKTRSGLC -.291 .074
NAVILGLC .213 .546
INCRTGLC -.085 .392
STAFCGLC .420 .201
ABTEMGLC .432 -.503
LACPLGLC -.337 .074
Extraction Method: Principal Component Analysis.
Rotation Method: Oblimin with Kaiser Normalization.
Communalities
Initial Extraction
MKTRSGLC 1.000 .220
NAVILGLC 1.000 .852
INCRTGLC 1.000 .263
STAFCGLC 1.000 .692
ABTEMGLC 1.000 .700
LACPLGLC 1.000 .297
Extraction Method: Principal Component
Analysis

311
QUESTION 18 INVESTMENT DEAL PROCESS H7
KMO and Bartlett's Test
Kaiser-Meyer-Olkin Measure of Sampling Adequacy. .477
Bartlett's Test of Sphericity Approx. Chi-Square 234.140
Df 10
Sig. .000
Total Variance Explained
Component
Initial Eigenvalues Extraction Sums of Squared Loadings
Rotation Sums of
Squared Loadingsa
Total % of Variance
Cumulative
% Total
% of
Variance
Cumulative
% Total
1 1.894 37.881 37.881 1.894 37.881 37.881 1.885
2 1.172 23.448 61.329 1.172 23.448 61.329 1.178
3 1.115 22.295 83.624 1.115 22.295 83.624 1.135
4 .698 13.959 97.582
5 .121 2.418 100.000
Extraction Method: Principal Component Analysis.
a. When components are correlated, sums of squared loadings cannot be added to obtain a total variance.

312
Communalities
Initial Extraction
INCRFDEL 1.000 .936
DIVRSDEL 1.000 .940
ICINVDEL 1.000 .776
REDUCDEL 1.000 .726
CNSULDEL 1.000 .804
Extraction Method: Principal Component Analysis.
Component Score Coefficient Matrix
Component
1 2 3
INCRFDEL .514 -.004 -.024
DIVRSDEL .516 -.010 .032
ICINVDEL -.015 .720 .250
REDUCDEL .029 .572 -.444
CNSULDEL .006 .094 .789
Extraction Method: Principal Component Analysis.
Rotation Method: Oblimin with Kaiser
Normalization.
Component Matrixa
Component
1 2 3
INCRFDEL .962
DIVRSDEL .959
ICINVDEL .586 .652
REDUCDEL .821
CNSULDEL -.355 .823
Extraction Method: Principal Component Analysis.
a. 3 components extracted.

313
QUESTION 19 OPERATIONAL EFFICIENCY H8
KMO and Bartlett's Test
Kaiser-Meyer-Olkin Measure of Sampling Adequacy. .607
Bartlett's Test of Sphericity Approx. Chi-Square 350.600
Df 3
Sig. .000
Total Variance Explained
Component
Initial Eigenvalues Extraction Sums of Squared Loadings
Total % of Variance Cumulative % Total % of Variance Cumulative %
1 2.306 76.861 76.861 2.306 76.861 76.861
2 .627 20.907 97.768
3 .067 2.232 100.000
Extraction Method: Principal Component Analysis.

314
Component Matrixa
Component
1
SYSTEEFN .716
RELABEFN .953
RSRCHEFN .941
Extraction Method: Principal
Component Analysis.
a. 1 components extracted.
Communalities
Initial Extraction
SYSTEEFN 1.000 .513
RELABEFN 1.000 .908
RSRCHEFN 1.000 .885
Extraction Method: Principal Component
Analysis.
Component Score
Coefficient Matrix
Component
1
SYSTEEFN .311
RELABEFN .413
RSRCHEFN .408
Extraction Method: Principal
Component Analysis.
Rotation Method: Oblimin with
Kaiser Normalization.
Rotated Component Matrixa
a. Only one component was extracted. The solution
cannot be rotated.

315
QUESTION 20 INVESTMENT DECISION H8
KMO and Bartlett's Test
Kaiser-Meyer-Olkin Measure of Sampling Adequacy. .480
Bartlett's Test of Sphericity Approx. Chi-Square 97.530
Df 21
Sig. .000
Total Variance Explained
Component
Initial Eigenvalues Extraction Sums of Squared Loadings
Rotation Sums
of Squared
Loadingsa
Total % of Variance Cumulative % Total % of Variance Cumulative % Total
1 1.712 24.459 24.459 1.712 24.459 24.459 1.635
2 1.270 18.139 42.598 1.270 18.139 42.598 1.322
3 1.033 14.758 57.357 1.033 14.758 57.357 1.040
4 1.004 14.336 71.693 1.004 14.336 71.693 1.068
5 .972 13.887 85.580
6 .638 9.111 94.691
7 .372 5.309 100.000
Extraction Method: Principal Component Analysis.
a. When components are correlated, sums of squared loadings cannot be added to obtain a total variance.
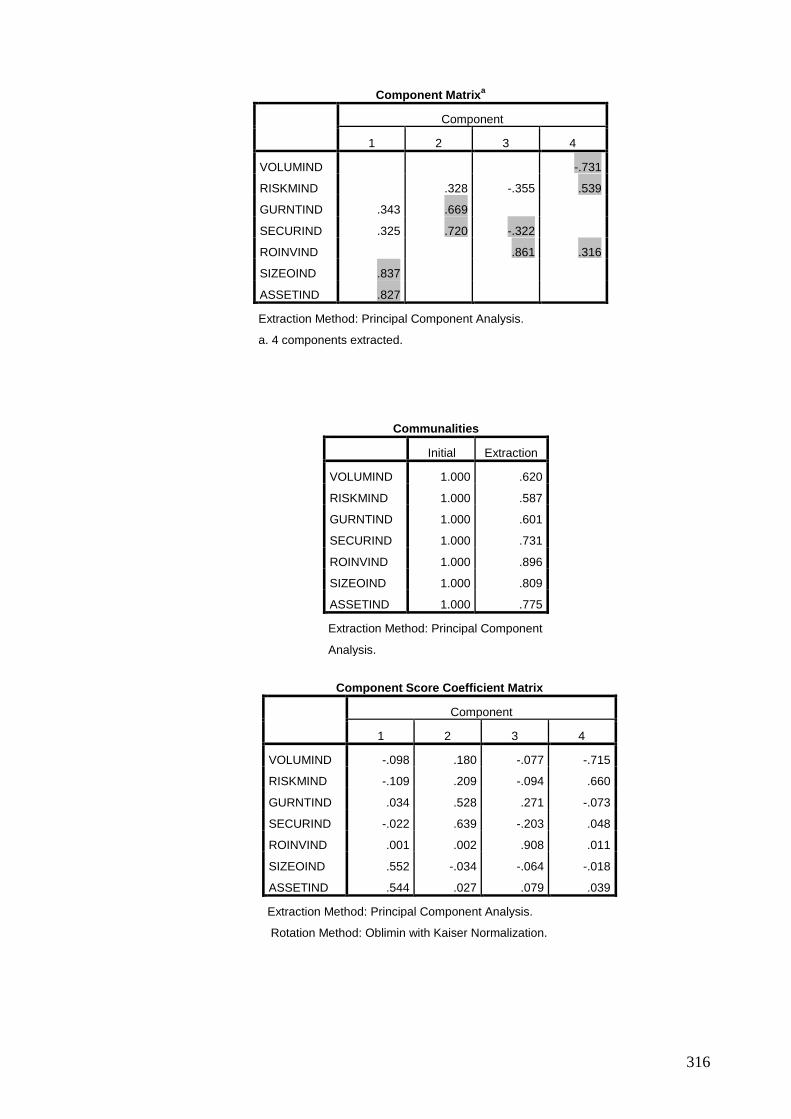
316
Component Matrixa
Component
1 2 3 4
VOLUMIND -.731
RISKMIND .328 -.355 .539
GURNTIND .343 .669
SECURIND .325 .720 -.322
ROINVIND .861 .316
SIZEOIND .837
ASSETIND .827
Extraction Method: Principal Component Analysis.
a. 4 components extracted.
Communalities
Initial Extraction
VOLUMIND 1.000 .620
RISKMIND 1.000 .587
GURNTIND 1.000 .601
SECURIND 1.000 .731
ROINVIND 1.000 .896
SIZEOIND 1.000 .809
ASSETIND 1.000 .775
Extraction Method: Principal Component
Analysis.
Component Score Coefficient Matrix
Component
1 2 3 4
VOLUMIND -.098 .180 -.077 -.715
RISKMIND -.109 .209 -.094 .660
GURNTIND .034 .528 .271 -.073
SECURIND -.022 .639 -.203 .048
ROINVIND .001 .002 .908 .011
SIZEOIND .552 -.034 -.064 -.018
ASSETIND .544 .027 .079 .039
Extraction Method: Principal Component Analysis.
Rotation Method: Oblimin with Kaiser Normalization.
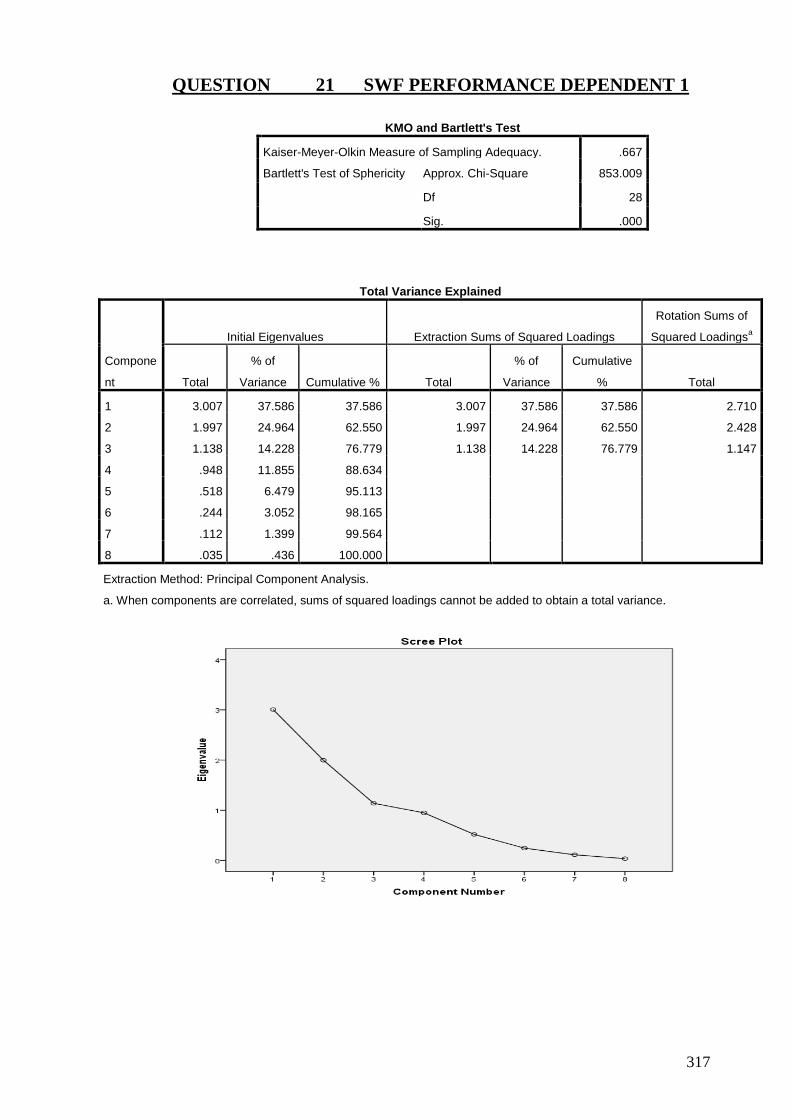
317
QUESTION 21 SWF PERFORMANCE DEPENDENT 1
KMO and Bartlett's Test
Kaiser-Meyer-Olkin Measure of Sampling Adequacy. .667
Bartlett's Test of Sphericity Approx. Chi-Square 853.009
Df 28
Sig. .000
Total Variance Explained
Compone
nt
Initial Eigenvalues Extraction Sums of Squared Loadings
Rotation Sums of
Squared Loadingsa
Total
% of
Variance Cumulative % Total
% of
Variance
Cumulative
% Total
1 3.007 37.586 37.586 3.007 37.586 37.586 2.710
2 1.997 24.964 62.550 1.997 24.964 62.550 2.428
3 1.138 14.228 76.779 1.138 14.228 76.779 1.147
4 .948 11.855 88.634
5 .518 6.479 95.113
6 .244 3.052 98.165
7 .112 1.399 99.564
8 .035 .436 100.000
Extraction Method: Principal Component Analysis.
a. When components are correlated, sums of squared loadings cannot be added to obtain a total variance.

318
Component Matrixa
Component
1 2 3
POLICCNF .846 -.454
GCSWFCNF .688
RETRNCNF .705 .642
CMPARCNF .714 .624
DEVLPCNF .722
DVRGECNF .769 -.519
CNTRBCNF .351 .677
RATERCNF .751 -.485
Extraction Method: Principal Component Analysis.
a. 3 components extracted.
Communalities
Initial Extraction
POLICCNF 1.000 .922
GCSWFCNF 1.000 .502
RETRNCNF 1.000 .930
CMPARCNF 1.000 .918
DEVLPCNF 1.000 .525
DVRGECNF 1.000 .864
CNTRBCNF 1.000 .645
RATERCNF 1.000 .836
Component Score Coefficient Matrix
Component
1 2 3
POLICCNF .360 .012 -.028
GCSWFCNF -.010 .064 .609
RETRNCNF .020 .398 -.097
CMPARCNF .028 .393 -.092
DEVLPCNF .013 -.036 .629
DVRGECNF .355 -.029 -.080
CNTRBCNF -.081 .330 .253
RATERCNF .345 -.023 .139
Extraction Method: Principal Component Analysis.
Rotation Method: Oblimin with Kaiser Normalization.

319
QUESTION 22 POSSIBLE SOLUTIONS
KMO and Bartlett's Test
Kaiser-Meyer-Olkin Measure of Sampling Adequacy. .426
Bartlett's Test of Sphericity Approx. Chi-Square 322.868
Df 36
Sig. .000
Total Variance Explained
Component
Initial Eigenvalues Extraction Sums of Squared Loadings
Rotation Sums
of Squared
Loadingsa
Total % of Variance Cumulative % Total % of Variance Cumulative % Total
1 2.023 22.473 22.473 2.023 22.473 22.473 1.953
2 1.910 21.224 43.697 1.910 21.224 43.697 1.889
3 1.193 13.260 56.956 1.193 13.260 56.956 1.238
4 1.077 11.969 68.926 1.077 11.969 68.926 1.170
5 .887 9.851 78.777
6 .769 8.540 87.317
7 .624 6.938 94.255
8 .374 4.154 98.409
9 .143 1.591 100.000
Extraction Method: Principal Component Analysis.
a. When components are correlated, sums of squared loadings cannot be added to obtain a total variance.
Component Matrixa
Component
1 2 3 4
INCRIPSS .682 -.459
PLANGPSS .569
NLAWPSS .414 -.357 .383
COOPPSS .699 .365 -.311
OUTSRPSS .911
DVLEPPSS .573 .676
RSRCHPSS .767
ASESSPSS -.324 .531 .427 .451
SANCTPSS -.449 .651
Extraction Method: Principal Component Analysis. 4 components extracted.

320
Communalities
Initial Extraction
INCRIPSS 1.000 .735
PLANGPSS 1.000 .351
NLAWPSS 1.000 .450
COOPPSS 1.000 .731
OUTSRPSS 1.000 .880
DVLEPPSS 1.000 .832
RSRCHPSS 1.000 .740
ASESSPSS 1.000 .773
SANCTPSS 1.000 .711
Extraction Method: Principal Component Analysis.
Component Score Coefficient Matrix
Component
1 2 3 4
INCRIPSS .176 .413 -.311 -.148
PLANGPSS .002 .285 .016 .166
NLAWPSS .214 -.099 -.024 .449
COOPPSS .438 .096 -.148 .094
OUTSRPSS .422 -.030 .203 -.054
DVLEPPSS .116 -.069 .635 -.125
RSRCHPSS -.062 .450 .110 -.117
ASESSPSS -.241 .235 .502 .241
SANCTPSS -.027 .026 -.016 .724
Extraction Method: Principal Component Analysis.
Rotation Method: Oblimin with Kaiser Normalization.

321
QUESTION 23 CHANGES
KMO and Bartlett's Test
Kaiser-Meyer-Olkin Measure of Sampling Adequacy. .455
Bartlett's Test of Sphericity Approx. Chi-Square 22.134
Df 10
Sig. .014
Total Variance Explained
Component
Initial Eigenvalues Extraction Sums of Squared Loadings
Rotation Sums
of Squared
Loadingsa
Total % of Variance Cumulative % Total % of Variance Cumulative % Total
1 1.331 26.623 26.623 1.331 26.623 26.623 1.195
2 1.139 22.771 49.394 1.139 22.771 49.394 1.206
3 1.017 20.345 69.738 1.017 20.345 69.738 1.097
4 .875 17.505 87.244
5 .638 12.756 100.000
Extraction Method: Principal Component Analysis.
a. When components are correlated, sums of squared loadings cannot be added to obtain a total variance.
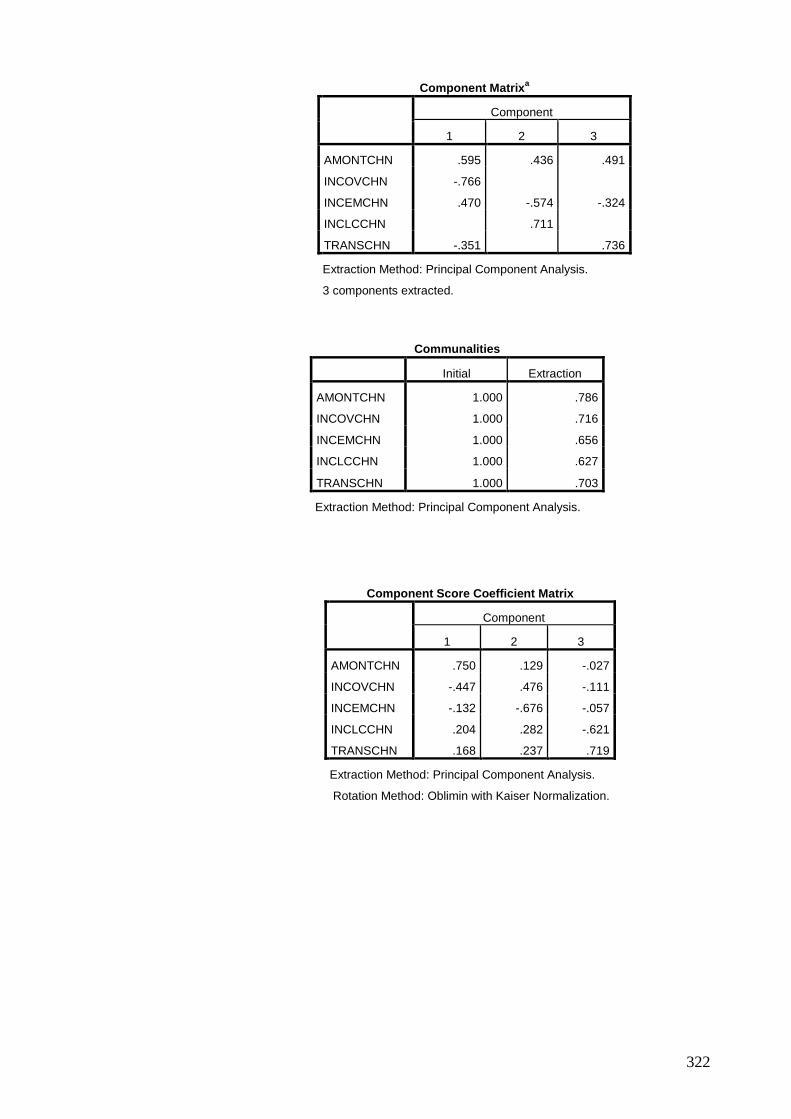
322
Component Matrixa
Component
1 2 3
AMONTCHN .595 .436 .491
INCOVCHN -.766
INCEMCHN .470 -.574 -.324
INCLCCHN .711
TRANSCHN -.351 .736
Extraction Method: Principal Component Analysis.
3 components extracted.
Communalities
Initial Extraction
AMONTCHN 1.000 .786
INCOVCHN 1.000 .716
INCEMCHN 1.000 .656
INCLCCHN 1.000 .627
TRANSCHN 1.000 .703
Extraction Method: Principal Component Analysis.
Component Score Coefficient Matrix
Component
1 2 3
AMONTCHN .750 .129 -.027
INCOVCHN -.447 .476 -.111
INCEMCHN -.132 -.676 -.057
INCLCCHN .204 .282 -.621
TRANSCHN .168 .237 .719
Extraction Method: Principal Component Analysis.
Rotation Method: Oblimin with Kaiser Normalization.

323
QUESTION 24 IMPACTS ON PROGRESS
KMO and Bartlett's Test
Kaiser-Meyer-Olkin Measure of Sampling Adequacy. .485
Bartlett's Test of Sphericity Approx. Chi-Square 36.898
Df 36
Sig. .427
Total Variance Explained
Component
Initial Eigenvalues Extraction Sums of Squared Loadings
Total % of Variance Cumulative % Total % of Variance Cumulative %
1 1.398 15.535 15.535 1.398 15.535 15.535
2 1.218 13.530 29.065 1.218 13.530 29.065
3 1.147 12.749 41.814 1.147 12.749 41.814
4 1.114 12.379 54.193 1.114 12.379 54.193
5 1.055 11.721 65.914 1.055 11.721 65.914
6 .860 9.561 75.475
7 .797 8.858 84.333
8 .751 8.340 92.673
9 .659 7.327 100.000
Extraction Method: Principal Component Analysis.
Component Matrix
a

324
Component Score Coefficient Matrix
Component
1 2 3 4 5
BUREAIMP .619 .115 -.079 .000 -.189
RSKAVIMP .595 -.041 .083 .021 .175
ABSPSIMP .115 -.189 -.056 .685 .162
LACSPIMP .006 -.045 .653 -.280 .204
SKILLIMP .005 -.038 -.004 -.059 -.754
DECISIMP -.074 -.594 .064 .099 .123
LOCALIMP .218 -.352 -.127 -.503 .175
SPENDIMP .003 .519 .046 -.008 .310
MNAGEIMP .011 .035 .615 .275 -.217
Extraction Method: Principal Component Analysis.
Rotation Method: Oblimin with Kaiser Normalization.
Component
1 2 3 4 5
BUREAIMP .460 .388 -.492
RSKAVIMP .590 .435
ABSPSIMP .811
LACSPIMP .329 .688 -.300
SKILLIMP .444 -.356 -.590
DECISIMP .436 -.485
LOCALIMP .364 -.545 -.401
SPENDIMP -.450 .535
MNAGEIMP .349 .535 .527
Extraction Method: Principal Component Analysis.
a. 5 components extracted.
Communalities
Initial Extraction
BUREAIMP 1.000 .670
RSKAVIMP 1.000 .600
ABSPSIMP 1.000 .723
LACSPIMP 1.000 .746
SKILLIMP 1.000 .729
DECISIMP 1.000 .591
LOCALIMP 1.000 .631
SPENDIMP 1.000 .535
MNAGEIMP 1.000 .707
Extraction Method: Principal
Component Analysis.

325
QUESTION 25 SUCCESS RATE DEPENDENT 2
KMO and Bartlett's Test
Kaiser-Meyer-Olkin Measure of Sampling Adequacy. .606
Bartlett's Test of Sphericity Approx. Chi-Square 60.539
Df 21
Sig. .000
Total Variance Explained
Component
Initial Eigenvalues Extraction Sums of Squared Loadings
Rotation Sums of
Squared Loadingsa
Total
% of
Variance
Cumulative
% Total % of Variance
Cumulative
% Total
1 1.719 24.552 24.552 1.719 24.552 24.552 1.708
2 1.303 18.614 43.166 1.303 18.614 43.166 1.313
3 .990 14.139 57.305
4 .861 12.304 69.609
5 .827 11.815 81.424
6 .682 9.736 91.160
7 .619 8.840 100.000
Extraction Method: Principal Component Analysis.
a. When components are correlated, sums of squared loadings cannot be added to obtain a total variance.

326
Component Matrixa
Component
1 2
DEVTLISR .474 -.405
CRINTISR .709
GCCRISR -.316 -.531
NLAWSISR .714
SORCEISR .661
INCCMISR .578
INGVTISR .592
Extraction Method: Principal
Component Analysis.
a. 2 components extracted.
Communalities
Initial Extraction
DEVTLISR 1.000 .389
CRINTISR 1.000 .525
GCCRISR 1.000 .382
NLAWSISR 1.000 .568
SORCEISR 1.000 .451
INCCMISR 1.000 .350
INGVTISR 1.000 .357
Extraction Method: Principal Component Analysis.
Component Score Coefficient Matrix
Component
1 2
DEVTLISR .323 -.263
CRINTISR .426 -.048
GCCRISR -.114 -.432
NLAWSISR .380 .249
SORCEISR -.014 .512
INCCMISR -.146 .426
INGVTISR .350 -.005
Extraction Method: Principal
Component Analysis.
Rotation Method: Oblimin with Kaiser
Normalization.

327
APPENDIX C–DESCRIPTIVE STATISTICS for all variables
Data set Normality Tests Results
Case Processing Summary
Cases
Valid Missing Total
N Percent N Percent N Percent
PERFORMACE 153 100.0% 0 .0% 153 100.0%
SUCCESSRATE 153 100.0% 0 .0% 153 100.0%
N Minimum Maximum Mean
Std.
Deviation Skewness Kurtosis
Statistic Statistic Statistic Statistic Statistic Statistic
Std.
Error Statistic
Std.
Error
GOVERNANCE 153 1.00 3.60 1.5477 .41408 1.257 .196 2.924 .390
TRANSPARENCY 153 1.00 2.83 1.4129 .34310 1.079 .196 .828 .390
ACCOUNTABILITY 153 1.00 4.00 3.6797 .56909 -3.246 .196 10.583 .390
INVESTEELAWS 153 2.88 4.80 3.9637 .28462 -1.042 .196 5.206 .390
TRADEBALANCE 153 4.00 5.00 4.1753 .20903 .961 .196 .721 .390
PLANNING 153 4.23 5.73 5.2886 .24292 -1.658 .196 3.713 .390
SPONSORLAWS 153 3.89 5.95 5.1876 .35126 -.727 .196 .648 .390
PURPOSE 153 3.92 6.00 5.3405 .39783 -2.209 .196 4.691 .390
INVESTRATEGY 153 2.62 3.93 3.4006 .23521 -.205 .196 .994 .390
DEALSIZE 153 1.00 4.00 2.6301 .46383 .254 .196 .807 .390
ASSETALLOCAT 153 1.00 4.00 1.5987 .43744 2.343 .196 9.241 .390
DECISIONMAKE 153 4.11 5.60 5.1329 .22686 -1.170 .196 3.473 .390
PERFORMACE 153 3.25 6.63 5.4859 .65296 -.888 .196 .695 .390
SUCCESSRATE 153 4.43 6.71 5.7800 .48915 -.431 .196 -.442 .390
POSSIBLESOLU 153 4.00 6.67 5.7645 .51182 -.734 .196 .640 .390
CHANGES 153 4.20 6.80 5.7699 .47227 -.468 .196 .118 .390
IMPACTS 153 4.22 6.33 5.3073 .45258 -.184 .196 -.450 .390
Valid N (listwise) 153

328
The data set is normal with no missing values, no extreme outliers and normally
distributed data from histograms.
Tests of Normality
Kolmogorov-Smirnov
a Shapiro-Wilk
Statistic df Sig. Statistic Df Sig.
PERFORMACE .136 153 .000 .944 153 .000
SUCCESSRATE .114 153 .000 .969 153 .002
a. Lilliefors Significance Correction

329
APPENDIX D MULTILE REGRESSION RESULTS
D 1: Between Independent variables and performance as a dependent variable
Correlations as above
PERFORMAC
E
GOVERNAN
CE
TRANSPAREN
CY
ACCOUNTABILITY
INVESTEELA
WS TRADEBALANCE
PLANNING
SPONSORLAWS
PURPOSE
INVESTRATE
GY
DEALSIZ
E
ASSETALLOC
AT
DECISIONMA
KE
Pearson Correlation
PERFORMACE
1.000 -.053 .042 -.070 -.015 .101 -.007 .029 .017 -.040 -.087 .005 .143
GOVERNANCE
-.053 1.000 .686 -.101 -.048 -.312 .094 .048 .002 .009 .211 -.027 .000
TRANSPARENCY
.042 .686 1.000 -.084 -.010 -.290 -.039 -.013 .111 -.019 .149 -.075 .007
ACCOUNTABILITY
-.070 -.101 -.084 1.000 .060 .098 .210 -.191 .016 .125 .005 .089 .244
INVESTEELAWS
-.015 -.048 -.010 .060 1.000 .093 .034 -.048 .699 .067 -.019 -.044 -.041
TRADEBALANCE
.101 -.312 -.290 .098 .093 1.000 -.464 -.196 .059 -.067 -.109 .058 .063
PLANNING
-.007 .094 -.039 .210 .034 -.464 1.000 .222 .321 .055 .054 .282 .378
SPONSORLAWS
.029 .048 -.013 -.191 -.048 -.196 .222 1.000 -.133 -.092 -.038 -.233 .239
PURPOSE .017 .002 .111 .016 .699 .059 .321 -.133 1.000 .037 .126 -.011 -.054
INVESTRATEGY
-.040 .009 -.019 .125 .067 -.067 .055 -.092 .037 1.000 .031 .101 -.109
DEALSIZE -.087 .211 .149 .005 -.019 -.109 .054 -.038 .126 .031 1.000 -.132 -.072
ASSETALLOCAT
.005 -.027 -.075 .089 -.044 .058 .282 -.233 -.011 .101 -.132 1.000 -.034
DECISIONMAKE
.143 .000 .007 .244 -.041 .063 .378 .239 -.054 -.109 -.072 -.034 1.000
Sig. (1-tailed)
PERFORMACE
. .259 .304 .193 .428 .107 .467 .363 .419 .314 .141 .477 .039
GOVERNANCE
.259 . .000 .108 .277 .000 .125 .278 .491 .456 .004 .371 .499
TRANSPARENCY
.304 .000 . .152 .453 .000 .315 .435 .085 .409 .033 .177 .466
ACCOUNTABILITY
.193 .108 .152 . .230 .115 .005 .009 .424 .062 .476 .138 .001
INVESTEELAWS
.428 .277 .453 .230 . .126 .338 .278 .000 .205 .405 .296 .309
TRADEBALANCE
.107 .000 .000 .115 .126 . .217 .008 .236 .207 .089 .238 .221
PLANNING
.467 .125 .315 .005 .338 .217 . .003 .400 .248 .253 .000 .000
SPONSORLAWS
.363 .278 .435 .009 .278 .008 .003 . .051 .129 .319 .002 .001
PURPOSE .419 .491 .085 .424 .000 .236 .400 .051 . .324 .060 .448 .254
INVESTRATEGY
.314 .456 .409 .062 .205 .207 .248 .129 .324 . .351 .107 .090
DEALSIZE .141 .004 .033 .476 .405 .089 .253 .319 .060 .351 . .052 .187
ASSETALLOCAT
.477 .371 .177 .138 .296 .238 .000 .002 .448 .107 .052 . .340
DECISIONMAKE
.039 .499 .466 .001 .309 .221 .000 .001 .254 .090 .187 .340 .

330
Coefficients as shown below
Unstandardized Coefficients
Standardized Coefficients
95.0%
Confidence
Interval for B Correlations
Collinearity Statistics
Model 1 B Std. Error Beta T Sig.
Lower Bound
Upper Bound
Zero-order Partial Part Tolerance VIF
(Constant) 2.501 2.371 1.055 0.293 -2.186 7.187
GOVERNANCE -0.189 0.186 -0.12 -1.016 0.312 -0.556 0.179
-0.053 -0.086
-0.08 0.48 2.08
TRANSPARENCY 0.279 0.223 0.147 1.25 0.213 -0.162 0.72 0.042 0.105 0.1 0.49 2.05
ACCOUNTABILITY -0.132 0.104 -0.115 -
1.265 0.208 -0.337 0.074 -0.07 -0.106 -0.1 0.82 1.23
INVESTEELAWS -0.111 0.271 -0.049 -
0.411 0.682 -0.647 0.424
-
0.015 -0.035
-
0.03 0.48 2.08
TRADEBALANCE 0.314 0.281 0.101 1.118 0.265 -0.242 0.87 0.101 0.094 0.09 0.83 1.21
PLANNING -0.074 0.271 -0.027 -
0.271 0.786 -0.609 0.462
-
0.007 -0.023
-
0.02 0.66 1.52
SPONSORLAWS 0.013 0.179 0.007 0.073 0.942 -0.341 0.367 0.029 0.006 0.01 0.72 1.39
PURPOSE 0.08 0.197 0.049 0.406 0.685 -0.31 0.47 0.017 0.034 0.03 0.46 2.16
INVESTRATEGY 0.02 0.234 0.007 0.085 0.932 -0.443 0.483 -0.04 0.007 0.01 0.94 1.06
DEALSIZE -0.089 0.123 -0.063 -
0.721 0.472 -0.332 0.155
-
0.087 -0.061
-
0.06 0.88 1.14
ASSETALLOCAT 0.032 0.139 0.021 0.229 0.82 -0.242 0.306 0.005 0.019 0.02 0.78 1.29
DECISIONMAKE 0.488 0.275 0.169 1.774 0.078 -0.056 1.031 0.143 0.148 0.15 0.73 1.36

331
The normal probability plot above is almost strainght line and scatter plot is
rectangularly distributed with most of the scores around zero point which collectievly
suggest that assumptions of outliers, normality, linearity, homoscedasticity and
indepedence of residuals are satisfied from the regression results (Tabachnik and
Fidell, 2007; Pallant, 2010).

332
D 2: Between Independent variables and success rate or growth as a dependent
variable
Correlations
Pearson Correlation
SUCCESSRATE
GOVERNANCE
TRANSPARENCY
ACCOUNTABILITY
INVESTEELAWS
TRADEBALANCE
PLANNING
SPONSORLAWS
PURPOSE
INVESTRATEGY
DEALSIZE
ASSETALLOCAT
DECISIONMAKE
SUCCESSRATE 1 0.508 0.086 -0256 0.478 0.038 -0.673 -0.108
0.389 -0.074
0.048 0.237 0.074
GOVERNANCE 0.508 1 0.686 -0.101 -0.048 -0.312 0.194 0.048
0.193 0.009
0.211
-0.027 0
TRANSPARENCY 0.086 0.686 1 -0.084 -0.01 -0.29 -0.039 -0.13
0.111 -0.019
0.149
-0.075 0.007
ACCOUNTABILITY -0.256
-0.101 -0.084 1 0.06 0.098 0.289 -0.191
0.016 0.125
0.005 0.089 0.244
INVESTEELAWS 0.478
-0.048 -0.01 0.06 1 0.093 0.034 -0.048
0.699 0.067
-0.01
9 -
0.044 -0.041
TRADEBALANCE 0.038
-0.312 -0.29 0.098 0.093 1 -0.464 -0.196
0.059 -0.067
-0.10
9 0.058 0.063
PLANNING -0.673 0.194 -0.039 0.289 0.034 -0.464 1 0.222 0.32
1 0.055 0.05
4 0.282 0.378
SPONSORLAWS -0.108 0.048 -0.13 -0.191 -0.048 -0.196 0.222 1
-0.13
3 -0.092
-0.03
8 -
0.233 0.239
PURPOSE 0.389 0.193 0.111 0.016 0.699 0.059 0.321 -0.133 1 0.037 0.12
6 -
0.011 -0.054
INVESTRATEGY -0.074 0.009 -0.019 0.125 0.067 -0.067 0.055 -0.092
0.037 1
0.031 0.101 -0.109
DEALSIZE 0.048 0.211 0.149 0.005 -0.019 -0.109 0.054 -0.038 0.12
6 0.031 1 -
0.132 -0.072
ASSETALLOCAT 0.237
-0.027 -0.075 0.089 -0.044 0.058 0.282 -0.233
-0.01
1 0.101
-0.13
2 1 -0.034
DECISIONMAKE 0.074 0 0.007 0.244 -0.041 0.063 0.378 0.239
-0.05
4 -0.109
-0.07
2 -
0.034 1
Sig. (1-tailed)
SUCCESSRATE . 0.092 0.145 0.246 0.412 0.329 0.56 0.459 0.48 0.181
0.276 0.325 0.381
GOVERNANCE 0.092 . 0 0.108 0.277 0 0.125 0.278
0.491 0.456
0.004 0.371 0.499
TRANSPARENCY 0.145 0 . 0.152 0.453 0 0.315 0.435
0.085 0.409
0.033 0.177 0.466
ACCOUNTABILITY 0.246 0.108 0.152 . 0.23 0.115 0.005 0.009
0.424 0.062
0.476 0.138 0.001
INVESTEELAWS 0.412 0.277 0.453 0.23 . 0.126 0.338 0.278 0 0.205
0.405 0.296 0.309
TRADEBALANCE 0.329 0 0 0.115 0.126 . 0.217 0.008
0.236 0.207
0.089 0.238 0.221
PLANNING 0.56 0.125 0.315 0.005 0.338 0.217 . 0.003 0.4 0.248 0.25
3 0 0
SPONSORLAWS 0.459 0.278 0.435 0.009 0.278 0.008 0.003 .
0.051 0.129
0.319 0.002 0.001
PURPOSE 0.48 0.491 0.085 0.424 0 0.236 0.4 0.051 . 0.324 0.06 0.448 0.254
INVESTRATEGY 0.181 0.456 0.409 0.062 0.205 0.207 0.248 0.129
0.324 .
0.351 0.107 0.09
DEALSIZE 0.276 0.004 0.033 0.476 0.405 0.089 0.253 0.319 0.06 0.351 . 0.052 0.187
ASSETALLOCAT 0.325 0.371 0.177 0.138 0.296 0.238 0 0.002
0.448 0.107
0.052 . 0.34
DECISIONMAKE 0.381 0.499 0.466 0.001 0.309 0.221 0 0.001
0.254 0.09
0.187 0.34 .

333
Coefficients(a)
Model
Unstandardized Coefficients
Standardized Coefficients
95.0% Confidence Interval for B
Correlations
Collinearity Statistics
1 B Std. Error Beta T Sig.
Lower Bound
Upper Bound
Zero-order Partial Part
Tolerance VIF
(Constant) 4.722 1.792 2.635 0.009 1.179 8.266
GOVERNANCE 0.391 0.141 0.351 0.884 0.068 0.154 0.402 0.108 0.074 0.07 0.482 2.075
TRANSPARENCY 0.258 0.169 0.267 0.222 0.240 -0.296 0.371 0.086 0.019 0.02 0.487 2.054
ACCOUNTABILITY -0.058 0.079 -0.067 -0.736 0.463 -0.213 0.098 -0.06 -0.062 -0.06 0.815 1.226
INVESTEELAWS 0.148 0.205 0.086 0.723 0.471 -0.257 0.553 0.018 0.061 0.06 0.481 2.081
TRADEBALANCE 0.149 0.213 0.064 0.701 0.185 -0.271 0.569 0.038 0.059 0.06 0.827 1.21
PLANNING -0.186 0.205 -0.092 -0.909 0.093 -0.591 0.219 -0.03 -0.077 -0.08 0.659 1.516
SPONSORLAWS -0.013 0.135 -0.009 -0.098 0.822 -0.281 0.254 -0.01 -0.008 -0.01 0.722 1.385
PURPOSE 0.378 0.149 0.391 -0.562 0.375 0.379 0.211 0 0.047 0.05 0.464 2.157
INVESTRATEGY -0.122 0.177 -0.059 -0.687 0.493 -0.472 0.228 -0.07 -0.058 -0.06 0.941 1.062
DEALSIZE 0.071 0.093 0.067 0.762 0.147 -0.113 0.255 0.048 0.064 0.06 0.876 1.141
ASSETALLOCAT 0.31 0.105 0.29 0.96 0.059 -0.107 0.308 0.037 0.081 0.08 0.776 1.288
DECISIONMAKE 0.269 0.208 0.125 1.296 0.117 0.142 0.68 0.074 0.109 0.11 0.734 1.362
a. Dependent Variable: SUCCESSRATE

334
The above plots of normality and scatter ploy explain that regressions results have met
conditions of normality, no outliers, linearity, homoscedasticity and indepedence of
residuals are satisfied from the regression results (Tabachnik and Fidell, 2007;
Pallant, 2010).

335
D 3: Between three possible intervening variables and performance as a
Casewise Diagnostics
Case Number Std. Residual PERFORMACE Predicted Value Residual
72 -3.908 3.25 5.7639 -2.51393
Dependent variable: performance
Collinearity Diagnostics
Model Dimension Eigenvalue Condition Index
Variance Proportions
(Constant)
POSSIBLESOL
U CHANGES IMPACTS
1 1 3.985 1.000 .00 .00 .00 .00
2 .007 23.470 .00 .67 .04 .31
3 .006 26.765 .00 .06 .70 .43
4 .002 42.589 1.00 .27 .26 .26
a. Dependent Variable: PERFORMACE
Correlations
PERFORMAC
E
POSSIBLESO
LU CHANGES IMPACTS
Pearson Correlation PERFORMACE 1.000 .214 .060 -.017
POSSIBLESOLU .214 1.000 .109 .048
CHANGES .060 .109 1.000 .178
IMPACTS -.017 .048 .178 1.000
Sig. (1-tailed) PERFORMACE . .004 .229 .417
POSSIBLESOLU .004 . .090 .279
CHANGES .229 .090 . .014
IMPACTS .417 .279 .014 .
N PERFORMACE 153 153 153 153
POSSIBLESOLU 153 153 153 153
CHANGES 153 153 153 153
IMPACTS 153 153 153 153

336
Coefficients(a)
Model
Unstandardized Coefficients
Standardized Coefficients
95.0% Confidence Interval for B
Correlations
Collinearity Statistics
B Std. Error Beta T Sig.
Lower Bound
Upper Bound
Zero-order Partial Part
Tolerance VIF
(Constant) 3.852 0.961 4.011 0 1.954 5.751
POSSIBLESOLU 0.27 0.103 0.21 2.627 0.01 0.067 0.472 0.214 0.21 0.21 0.987 1.013
CHANGES 0.06 0.113 0.04 0.533 0.595 -0.163 0.283 0.06 0.044 0.043 0.958 1.044
IMPACTS -0.05 0.117 -0.04 -0.43 0.668 -0.282 0.181 -0.02 -0.035 -0.034 0.968 1.033
a. Dependent Variable: PERFORMACE

337
D 4: Between three possible intervening variables and success rate or growth as
a dependent variable
Collinearity Diagnostics
Model
Dimen
sion Eigenvalue
Condition
Index
Variance Proportions
(Constant
)
POSSIBLE
SOLU CHANGES IMPACTS
1 1 3.985 1.000 .00 .00 .00 .00
2 .007 23.470 .00 .67 .04 .31
3 .006 26.765 .00 .06 .70 .43
4 .002 42.589 1.00 .27 .26 .26
a. Dependent Variable:
Correlations
SUCCESSRAT
E
POSSIBLESOL
U CHANGES IMPACTS
Pearson Correlation SUCCESSRATE 1.000 .464 .346 .264
POSSIBLESOLU .464 1.000 .109 .048
CHANGES .346 .109 1.000 .178
IMPACTS .264 .048 .178 1.000
Sig. (1-tailed) SUCCESSRATE . .215 .036 .000
POSSIBLESOLU .215 . .090 .279
CHANGES .036 .090 . .014
IMPACTS .000 .279 .014 .
N SUCCESSRATE 153 153 153 153
POSSIBLESOLU 153 153 153 153
CHANGES 153 153 153 153
IMPACTS 153 153 153 153

338
Coefficients(a)
Model
Unstandardized Coefficients
Standardized Coefficients
95.0% Confidence Interval for B
Correlations
Collinearity Statistics
B Std. Error Beta T Sig.
Lower Bound
Upper Bound
Zero-order
Partial
Part
Tolerance VIF
(Constant) 3.561 0.707 5.036 0 2.164 4.958
POSSIBLESOLU 0.46 0.076 0.41 0.531
0.096 -0.109 0.189
0.064
0.043
0.042
0.987 1.013
CHANGES 0.43 0.083 0.31 1.217 0.12
6 -0.063 0.265 0.14
6 0.09
9 0.096
0.958 1.044
IMPACTS 0.265 0.086 0.25 3.07 0.00
3 0.094 0.435 0.26
4 0.24
4 0.241
0.968 1.033
a. Dependent Variable: SUCCESSRATE

339

340
Appendix E - Interview transcripts
Interview 1
Date: 20.12.2010
Time: 9:30 am to 10:45 am
Interviewee: Al - Shura Council Speaker (Parliament)
This interviewee is president of parliament of Government of Oman. It was more of a
conversation regarding sovereign wealth fund of Oman and its current position rather
than structured interview about fund. The interview was not recorded so below are the
major points jotted down during this conversation.
The major tone of his answers was to say that Oman SWF completely lack proper
decision making and management system. The improvement changes are needed
across the board and there is a greater need right now to introduce professional
management and investment practices in Oman SWF. This is because, if one looks at
the other sovereign funds in the gulf co-operation council, Oman SWF has not
progressed even 10% of what other funds have done to grow a level of US$ 300 to
800bns in the assets. This is because Oman SWF is has only one person for decision
making. Oman SWF is also governed by Ministry of finance and not as a professional
separate entity. There is no fixed limit on how money will come to SWF from oil
income or how the return of SWF investments will be reinvested. There is no audit;
annual budget planning and investment return reconciliation process in managing
Oman SWF. Parliamentary committee for economy and finances in Oman should have
received separate reports, plans and budgetary details from SWF management but there
is none. There are so much irregularities in operations of Oman SWF as investment
appraisals are not properly done but investment money are disbursed based on political
agenda and trade relations decided by ministry of finance with other countries. So,
entire objective of profitability disappears from decision making for SWF.
What the president of parliament wants for Oman SWF is to have new organisation
design, and management reporting regularly to members of parliament where
representative of public will be able to decide benefits for their country. Right now, all
reporting is done to ministry of finance. There is nothing like a SWF as an organisation
but it is managed like a department within ministerial portfolio. The biggest mistake
has been done for Oman SWF is removal of economic ministry as it was able to exert

341
some regulatory pressure for SWF management being a separate committee from
formed by parliaments and its members. President of the parliament stated that a
detailed research study of this kind on sovereign wealth fund and its recommended
action plan will be crucial for restructuring and developing Oman SWF as a separate
investment agency of the Government of Oman.
Interview 2
Date: 1.11.2010
Time: 9:00 am to 10.40 am
Interviewee: General Secretary of the State Council
This interviewee is a general secretary of the state‘s council which one part of the
overall government structure. The state‘s general council is a separate body of
society‘s well known members like an upper house of parliament in democratic
government. The main function of the state council is to take part and to support better
governance through its operating mechanism and fundamental principles. Right now,
this state council has no control over SWF management because there is no change in
the decision by ministry of finance for improving SWF after this state council and
other parliament members made repeated requests and suggestions to government.
There is no answer from government or finance ministry with regard to any of these
suggestions.
General Secretary stated that council members want the fund to become a separate
government agency with complete autonomy and professional management without
any political and ministerial influence except laid down code of ethics and governance
conduct. On the other hand, they do not want fund to become the reserve bank of the
country. However, they wish that restructured SWF will report to government of Oman
parliament will be overseen by central bank and auditor general for investment strategy
and governance issues respectively. As of now, audit department of Oman government
does not receive any report from SWF. State council general secretary would like
Oman SWF to develop professional management structure, to have the international
level team of managers and compete with other GCC funds for growth in assets and
profits.

342
Interview 3
Date: 15.12.2010
Time: 9:00 am to 10:30 am
Interviewee: Deputy Chief Executive, State General Reserve Fund
This interviewee is a professional in economics and holds an authoritative position of
Dy. CEO in Oman SWF. However, in his own words, ―does not have any authority or
control over events, investments and decision making in the management of Oman
SWF.‖ He feels that organisation operates on totally centralized authority where there
is no employee participation. Thus in his opinion, Oman SWF has top –down
traditional approach in organisational hierarchy and communication. This is
complementing to lack of professional management in Oman SWF. At the same time,
ministry of finance does not want to avail any services from global consultants, asset
managers or investment banks for investment strategy and growth. Being a deputy
CEO of the state general reserve fund, the interviewee in general should have all data
and reports at his disposal including down the line employees. As confirmed by him,
Deputy CEO does not have any information regarding how much asset is owned by
Oman SWF and any reasons for investment decisions taken by Ministry of Finance.
This is the current status of Oman SWF as known to its deputy CEO that is the highest
senior most employee of the SWF
According to him, the future of Oman SWF is not clear without an appropriate
restructuring plan. The investment decisions are currently made randomly without any
appraisal techniques and without considering any market opportunities. This is what
makes a big difference between Oman SWF and other GCC funds which avail
professional services from global banks and asset managers. Also, in other project
Oman SWF have tried to be a partner or a strategic alliance in the investment bids in
the past but due to bilateral relations between the countries and other management
differences, it did not turn out well. Thus, Oman SWF cannot have that option of
alliance with other GCC funds.
The interviewee ended the interview with a suggestion that Oman SWF needs an
overhaul in the organisation in terms of its design, policy, organisational hierarchy,
communication, reporting, decision making and investment strategy.

343
Interview 4
Date: 5.1.2011
Time: 9:30 am to 11:30 am
Interviewee: General Director of Investment Development
This interviewee manages the investment development department in the SWF. He is a
professional to look after the investment development operations and complete end to
end procedures at SWF. According to his opinion, the complete system of SWF needs
an overhaul in terms of organisational structure and investment process. The most
important aspect which needs immediate change are short and long term investment
planning in addition to professional and international human capital development for
Oman SWF.
In his opinion, if Oman SWF can manage to create the pool of trustworthy and
knowledgeable employees who are competent enough to manage the current assets
worth approx.US$ 8bns then Oman SWF can look forward to grow profitably in the
future.
Another major change, he suggests is about reporting structure of Oman SWF.
Currently, all decisions are taken by finance minister and no where any profit – loss,
budget, assets are reported. No financial statements are prepared. This makes it
difficult to report about SWF to parliament or to disclose it to common public.
A major challenge for Oman SWF is to restructure within short time frame so when
assets are cheaper in the credit crisis time, it can make use of the opportunities
worldwide to invest. Because, this is such a long cycle of recession that growth cycle
after this might be quite long enough to earn profits from the assets purchased during
this credit crisis time. Thus, Oman board and two councils of ministers together with
auditor general should form a committee to take over the operations from
overburdened Ministry of Finance.
This interviewee also ends the discussion with praising the efforts of such a detailed
study on Oman SWF and says this is commendable project if results and
recommendations can help Oman SWF to start growing and developing professionally.

344
Interview 5
Date: 2.11.2010
Time: 9:30 am to 11:00 am
Interviewee: General director of Superintendence of Companies – A financial
audit
This interviewee works at a position where information has to be kept secure and
confidential for all the companies unless it is necessary to bring to parliament or other
government agencies‘ notice. He thinks that it is high time that Oman SWF is
restructured to international competition level. This restructuring is necessary because
as of now, there are no reports or information received by government audit
department. On the other hand, Audit department is not allowed to take initiative for
auditing Oman SWF. Unless parliament or Oman board takes a decision to re-organise
the reporting and auditing of Oman SWF, audit department cannot change or ask for
details.
Interviewee suggested that Oman SWF should avail the help of professional wealth and
asset managers from banks, investment banks or expert consulting companies to draft
an investment strategy and start using appraisal techniques for investment decisions.
This will allow Oman SWF to grow the asset base and profitability of the fund at the
same time. Interviewee does not have more details about Oman SWF so he can not
suggest more intricate changes required in Oman SWF.
Interview 6
Date: 15.12.2010
Time: 11:30 am to 12:45 pm
Interviewee: General Director of Investment Planning
This interviewee does not work for Oman SWF but he is part of the Ministry of finance
on senior position. He wants to know more in detail about Oman SWF as he has been
getting all these news about governance and transparency of Oman SWF from press
and working within ministry. He thinks how government can plan a budget without
having the information about how much money flows into SWF or investments and
how much is earned back from the SWF. There is no accounting for resource or
financial reserve allocation even in the finance ministry. All decisions are based on
minister‘s intuition. There is no planning or decision making process in the entire
system for oil income except national budget and allocation of money to various public

345
projects. Contracts are awarded many times without consultation or any technical or
commercial analysis and negotiations.
Both MoF and SWF do not have any strategic objectives laid out except vision 2020
planned by government. There are no ethical guidelines, no evaluations or audit of
actions – decisions taken, no risk management tools. Government of Oman still runs
finances based on old systems of central command chain and thumbs rules for decision
making whereas other GCC funds have turned themselves into professional investment
houses for example, Kuwait (approx.US$ 250bns assets) and UAE (approx.US$
850bns assets). Other funds have investment strategy, laws, regulations, disclosure
principles, annual reports and treaties with other countries to adhere to. These all make
them perform and score high on governance, transparency and accountability
measures. Oman SWF does not have any of these initiatives.
Finally, interviewee suggest that Oman SWF has a lot to change and to improve before
competing with other funds as within the country needs of resource allocation are
mounting every day. At the same time, oil reserves are not infinite to government must
develop other industries which can bring revenue for development or can attract
foreign investments to the country. This will create long term growth not only for
Oman SWF but for Oman as a sovereign country.
Interviewee wishes to see the results or recommendations of the project on the
completion and will be ready to extend any help required in future for this research
study.
Interview 7 Date: 20.12.2010
Time: 12:15 pm to 13:30 pm
Interviewee: Vice-chairman of the Shura Council
This interviewee is a member of Shura council which is parliament of elected
representatives of citizens of Oman. Being a public representative and having national
interests in Oman SWF, his Excellency stressed that two major issues for Oman SWF
to address immediately are information disclosure and decision making hierarchy.
Because of the low level of transparency and inadequate information disclosure, Oman
SWF is losing confidence of its own population and also the reputation in international

346
financial world. This practice must be stopped and Oman SWF as an investment
agency should start declaring information such as other global funds. Decision making
is completely managed by Ministry of Finance which has created less use of talent
available in the financial sector. This has led to the situation where Oman SWF
decision making has become weaker and having no control over any of its internal
functions. This is why we are 50 or 100 times behind other GCC region SWFs. Other
government departments have no information regarding how our SWF is operated.
The official disclosure of actual investment position, profits and return on portfolio
shall be known to other government departments such as auditor general, trade
ministry, central bank of Oman. This can help in such a way that these departments can
make suggestions to improve the growth of Oman SWF. The growth of Oman SWF
can become the growth engine of the country as the income or profit of the SWF can
be utilized to improve the economy of Oman state.
This interviewee has envisioned that researcher‘s recommendations would be really
helpful step in this regard to improve the Oman SWF performance. The adoption of
appropriate governance mechanisms and transparency by Oman‘s SWF will improve
its image, resulting in improvements in not only the profitability of Oman SWF, but
the whole country‘s economic status.
Interview 8 Date: 11.01.2011
Time: 11:30 am to 12:30 pm
Interviewee: Economic expert, Al Shura council
This interviewee is an active member of Shura council - the parliament of elected
representatives of citizens of Oman. He is also one of the few economic experts in the
council. He explained the advantages of SWF success rate and also explained the
downside of losing the capital through investments when world markets are in jittery
because of global recession and credit crunch.
He gave the examples that Abu Dhabi, Qatar and Kuwait had lost money in banking
sectors of USA in 2007–09 so any suggestion to SWF for the foreign equities
investment is a tricky issue. Also, he advised to adopt ‗wait and watch‘ approach
before recommending increase in the oil income allocation to SWF funds inflow for

347
making more investments. Such a decision making is crucial in two terms. The fund
allocated to SWF for foreign investments can alternatively be utilized for domestic
investments which can help for industrial and economic growth along with currency
stabilization within the country. And, foreign investments can be less profitable during
ongoing global recession which may prolong for another two or three years.
Therefore, the main message conveyed by this interviewee is about having appropriate
funds inflow to SWF, robust investment strategy and control over asset allocation in
decisions about foreign investments. Also, he voiced resentment about MoF being not
engaged in the appraisal of projects before making investment decisions. The
interviewee suggested that SWF can become major economic growth vehicle for
Oman.
Interview 9
Date: 11.01.2011
Time: 2:00 pm to 3:15 pm
Interviewee: Technical expert, Al Shura council
This interviewee is also an elected member of parliament and a technical expert.
Having been worked in the departments which are not directly related to sovereign
wealth fund of Oman, the interviewee has less information about SWF. However,
Dr.Al-Saidi was interested in conveying that how SWF can overcome the conflicting
interests between Oman SWF, MoF and other government departments and agencies
from his own experience as a departmental head.
Furthermore, Dr.Al–Saidi stressed for Oman SWF to make use of developing local
talent whilst currently deploying international experts or wealth managers for creating
robust investment strategy. In this manner, growth and creating human capital can be
managed by Oman SWF simultaneously.
Apart from this, Dr.Al-Saidi knew that there are no published reports and MoF
maintains total secrecy about transactions. Dr.Al-Saidi agrees that it is ok not to release
all strategic and vital information but to an extent like other companies prepare their
annual reports, Oman SWF must increase the transparency to that level where Omani
citizens and foreign investors can maintain their trust for Oman SWF.

348
Interview 10
Date: 04.01.2011
Time: 9:30 am to 11:00 am
Interviewee: Economic researcher, State council
This interviewee is an economic researcher who in the upper house of the parliament in
Oman. The upper house members are selected for a fixed term by His majesty Sultan
Qaboos with a consideration given to the council members‘ recommendations.
This interviewee is engaged in the research and administration so he stressed that MoF
and Oman SWF both do not have any specific planning and the policies of MoF
actually lacks the strategic vision and objectives. However, government of Oman has
prepared Vision 2020 for the whole country with contribution from other ministries,
budget committee and central bank of Oman. MoF could not provide any data in the
Vision 2020 for SWF.
This interviewee has found out by engaging herself previously with MoF that there are
no initiatives taken by MoF to improve the governance or profitability of Oman SWF.
Interviewee suggested that Oman SWF requires initiatives to develop mechanisms for
governance, transparency and investment strategy just like other large SWFs of
Norway, UAE or Singapore. The asset allocation and any strategic planning are
completely ignored by MoF.
When Oman SWF is in a situation which requires complete restructuring in terms of
laws, policies, decision making and governance frameworks and organisation re-
design. This interviewee agreed with the idea of incremental re-design of Oman SWF
as all aspects of SWF cannot be improved at the same time. The interviewee suggested
that developing employability of local talent is not crucial for SWF but for the whole
economy of Oman.
Interview 11
Date: 04.01.2011
Time: 11:40 am to 1:30 pm
Interviewee: Economic researcher, State council
This interviewee again is a member of state council which is upper house of the
parliament. Interviewee told the researcher that everyone is worried about Oman SWF
governance and transparency damaging the credibility of the SWF and country in the

349
financial world. However, the issue is not permanent as it is because right now there
are no mechanisms to monitor governance and transparency standards; and there is no
organisational structure or hierarchy except Minister of Finance to oversee decision
making or investments. Also, the developed countries worrying about security threat
due to strategic investments is not true because in the business world there are
components where countries and markets can not afford to lose each other.
This interviewee is confident that Oman SWF can be re-designed to develop as a world
class SWF with no issues of governance and credibility because the business and
national culture of Oman have good business ethics and high moral standards. This
can be seen from high score achieved by Oman as a state in the world competitiveness,
corruption index, business and investment confidence index ahead of other GCC
countries and developed nations. Thus, a problem is not within all department of
government but the major issue of concern is how does MoF manages Oman SWF
operations in an unplanned manner with single handed decision making. This allows
Oman SWF employees to become complacent and reduce the accountability for their
actions.
On the other hand, these employees are citizens of Oman so they have a duty towards
their country to perform better in the interests of Oman SWF. The interviewee told that
you may find surprising results of what employees feel about Oman SWF within the
SWF and other departments in the questionnaire survey.
Interview 12
Date: 03.01.2011
Time: 11:00 am to 12:45 pm
Interviewee: Dy. Chief Executive, Information Technology Authority
This interviewee is in a top management of IT authority which confirmed that MoF has
never sent any request to create a portal for Oman SWF as a separate entity. Also, MoF
has never consulted them for any information on IT developments or appraisal of
making investments in the technology companies for Oman SWF. Thus, for him MoF
manages a very much closed loop transactions for SWF and rest of their work as well.
Interviewee told that the issue of low credibility of Oman SWF in the form of very low
governance and transparency emerges from the main issues of ‗no information
350
availability about Oman SWF‘ to Omani people or any other government department.
Therefore, if the transparency or governance is the issue then it should be affecting to
Oman first; hence, deveveloped countries should not worry. The main objectives of
Oman SWF should be wealth creation and transferring the benefits of that wealth to
Omani people rather than any politically motivated investments in the foreign
countries. However, the SWF looks to adopts a policy under MoF management where
no one is ready to take any responsibility or accountability which ultimately reduce the
advantages SWF can bring for its employees Omani citizens, Omani government and
investors.
This interviewee suggested that main challenges for Oman SWF are self-image, self-
policing, leadership, reporting and disclosure transparency and decision making
autonomy from MoF. These challenges can be overcome by creating a distinction
between local and foreign investment departments and having one separate board and
two management teams. And, activities by these teams can be monitored and
controlled by this investment board by way of governance, ethics and investment limits
set out in the annual reviews of policy and strategic planning by this board. Board
representation can be chosen from various government departments. This way
autonomy in the professional decision making and management control both can be
maintained for Oman SWF.
Interview 13 Date: 09.01.2011
Time: 9:30 am to 11:30 am
Interviewee: Economic expert, State council
This interviewee is an economic expert in the upper house of parliament. According to
Dr.Al-Jabri, SWF can be a major stabilising force for the economy of Oman. SWF
profit mainly comes from buying undervalued foreign assets cheaply and then
generating yield on when the market prices go up or the same assets are valued high.
Since, global markets are in the down turn, Dr. Jabri does not advise for increased
foreign investments as Oman SWF may lose its investments. Also, Dr. Jabri advised to
create a local development fund separate from SWF which will be funded by SWF
profits so in the time of low oil prices, there are money available for development and
currency stabilization.

351
The only risk SWF poses to local people is over dependence on the profit of SWF for
doing everything in the country. If SWF make Omani people rich with comforts then
there may be implications on GDP growth in the long run as Omanis may become
complacent in their work culture.
Dr. Jabri discarded any national security threats posed by western governments saying
that GCC region countries know how precious is the money received from Oil and
Petrol export then it would not be wise to spend that money through SWF for political
or security motives rather than financial goals by GCC central bankers.
As an economic advisor for state council, Dr. Jabri told that SWF can not only benefit
from Western govt. bonds or stock markets but SWF should take advantage of alternate
assets, emerging markets‘ financial and technology firms, agricultural businesses in
Africa and Latin America; thus increasing the geographical spread of the investments
to reduce the risk of the investments.
Interview 14 Date: 16.12.2010
Time: 1:00 pm to 2:45 pm
Interviewee: Economic Researcher, Ministry of Finance
Since this interviewee works within MOF, he has more information regarding SWFs.
Mr. Badran said the problems cited by other departments such as governance,
transparency and investment strategy are not the real problems to manage SWF. The
major issue for MOF is to single handled manage the SWF attracts problems of
allocating ministerial resources to SWF, creating international standards, having due
diligence procedures, and delegating financial control to young employees.
This type of problem requires support from other government departments such as
central bank of Oman and human resource ministry (HRM). There is no written
agreement between other government departments regarding how much they can
contribute or so-operate to manage SWFs. There is no asset allocation limits specified
by MOF; thus all investments happened on random basis and first come first serve
basis.

352
There is no annual cap on how much can be invested locally or in foreign assets. The
reciprocity from the other government departments is necessary to leverage the
resources to manage SWF.
Thus the interviewee confirmed that there are issues within the management of SWF
by MOF, however, the resources for MOF are not adequate and there are no
agreements between the departments therefore other departments should not be
criticising MOF for managing SWF on its own. MOF has on its part, issues in not
being transparent and taking decisions for large investments without any appraisal.
Because of this, employees of the SWF have no accountability for their actions and
they are left with no active role in deciding what is good or bad for Oman SWF. The
pressure is on MOF for creating a management board composition, ethical guidelines,
avoiding political oversights, and linking the SWF to government budgets. However,
there are issues of constitutional or policy restraints which do not allow MOF to make
independent disclosures and create further implications.
Interview 15 Date: 16.12.2010
Time: 9:30 am to 11:30 am
Interviewee: Political researcher of Oman News Agency
Dr. Aluraimi as a researcher and journalist confirmed that governance and transparency
are not problems of only Oman SWF but to an extent every SWF around the world has
been caught up in the same debate. From the perspective of information availability to
investors, the problem of information not being available from SWF to investee
companies or governments is a small issue. Companies around the world manipulate
their accounts and publish forward looking statements to attract investments and
maintain public confidence in their stocks. The transparency is 100% in that case but
the legitimacy of the information is very low. No one is arguing about this legitimacy
issue but everyone is criticising SWFs which are actually helping companies in the
recession times to survive and stabilise. Therefore this interviewee suggested that
governments of top multinational companies should not be lobbying for governance
and transparency of SWFs.
As for Oman SWF the real issue is not the transparency or governance, but robust
investment strategy and financial control. This can be achieved by deploying

353
international experts and developing local talent to international standards. There is a
lot of competition between GCC region countries to create stable non oil dependent
economies. As one can see, Kuwait, UAE, Qatar, Saudi Arabia and Bahrain are in a
race to develop their countries and follow the debt economy principles to attract every
single company in their cities. Dubai is one of the best examples of this, however, debt
economy development has its own perils so Oman government should find a balance
between the two and appropriately utilise the SWF solely for economic and financial
objectives.
Interview 16 Date: 16.01.2011
Time: 10:00 am to 11:45 am
Interviewee: Director of Investment Planning, Ministry of National Economy
Mr. Albuloshi works as a CXO level executive for national economy and planning. He
suggested that main function of the state council is to take part and to support better
governance through its operating mechanism and fundamental principles such as to
provide base for governance and transparency within the Oman SWF but there seems
to be no one willing to do this job. Therefore, Oman SWF has governance and
transparency is at the lowest possible level. In such situation, we can no pick up any
employees and make them accountable or responsible for anything. Therefore, it is
collective responsibility of MoF and other government agencies to make improvements
in Oman SWF.
As for national economic and investment planning, they have never received any
information from MoF or SWF regarding the holdings in foreign assets. As an
economic and investment planning expert, Mr. Albuloshi suggested that any shift from
Europe and US markets to Asian and MENASA markets may look promising for now
but not in the long run as these developing countries may sooner or later would be in
the recession cycle as a result of global recession and credit crunch.
The restructuring of Oman SWF requires detailed work and need two to five years of
time to completely change the SWF.

354
Interview 17 Date: 13.11.2010
Time: 1:30 pm to 3:00 pm
Interviewee: Al Shura council member
This interviewee member in the parliament and debated the previous response of MoF
of IMF call for GCC region SWFs to increase the governance and transparency. In his
opinion, Oman SWF should not wait for the SWFs to take a lead either in the making
foreign investments or creating world class standards.
He suggested that Omani culture and values are famous around the world so this time
we can make SWF also famous by creating international standards. Interviewee
suggested that there is no need to create protectionism barriers as we would like to reap
rewards of globalization. Oman is already global in terms of having more than 60% of
its workforce from countries around the world as far as Canada and Japan. The Oman
SWF‘s response to IMF and Santiago principles should have been positive and
welcoming. However, Oman SWF should have conveyed that it is better to reduce
protectionism by both parties: investee countries and SWF sponsoring countries.
Oman SWF should take leadership of any international developments for SWF and set
the standards even for the developed countries SWF. Interviewee agreed about setting
up a common body to oversee all SWFs. This would reduce the number of laws and
barriers prepared by respective governments of SWFs and investee countries.
Interviewee is not suggesting changing the existing system all of a sudden; however
recommends an incremental transition for Oman SWF to become a separate entity
rather than being a department of MoF.
Interview 18 Date: 14.12.2010
Time: 9:00 am to 11:00 am
Interviewee: Royal Office
Interviewee works with the royal office which looks after departments managed
directly by His Majesty Sultan Qaboos. Interviewee has no access to MoF documents;
however confirms that final decision for large investments are approved by Sultan
having trust in the MoF proposals. On a random basis, work is delegated to see the
facts and figures of the capital investments.

355
Mr.Albusaidi suggested that around the globe many SWFs are managed by finance
ministries (MoF) and central banks, hence, MoF manages our Oman SWF is not a
problem at all. The problem is how we control our finances and employee turnover.
The cost of operating SWF is so high that MoF does not have resources to disburse
only for SWF. This might be the reason why MoF is not utilizing the international
experts or wealth management consulting from well known banks or investment banks.
Interviewee confirms that MoF should be handling this inflow of finds to SWF
appropriately as this money belongs to all Omani citizens. Therefore, MoF should have
at least proper investment strategy so that profits can be realised on these investments.
Our oil wealth is limited so planning should be done considering the future generations
of Oman. The interviewee agreed that Oman SWF lacks the vision like Norway and
Singapore who has accumulated more than 300bn within the last two decades.
Therefore, it is up to policy makers in the Al-Shura and States council to decide how to
preserve the benefits of oil wealth in terms of SWF profits or trade balances.
Interview 19 Date: 14.12.2010
Time: 1:00 pm to 2:45 pm
Interviewee: Royal Office
This interviewee works in the royal office and is not direct stakeholder of SWF or
MoF. However, once he was conveyed what are SWF and what benefits it can bring to
Oman. He suggested that he wants Oman SWF to be restructured and the responsibility
of Oman SWF to be given to trusted and knowledgeable officers in the government.
Interviewee favoured that there should be independent counsel to manage the money
which is almost 8 to 13 billion. This amount of money can change the face of the
country or every industry within the Oman in few minutes. The industry developments
is very much necessary as Interviewee confirmed that oil wealth is limited and must be
used appropriately for years to come. This wealth is not owned by any one person and
thus, any one managing SWF should have Oman and future Omani generations‘
interests.
The interviewee was surprised to understand that Oman started SWF in same time with
UAE and still have only US$ 8 to 13bn whereas ADIA has 100 times more assets than
Oman SWF. Thus, interviewee suggested that we should restructure and govern the

356
Oman SWF far better than its current status. Our credibility should be improved as we
are one of the well known in the GCC region and around the world for our values and
quality of the culture. Interviewee stressed that governance, talent development and
investment strategy should be the first priorities for making improvements or changes
in the Oman SWF.
Interview 20 Date: 17.12.2010
Time: 10:00 am to 11:45 am
Interviewee: Internal Security
This interviewee has not much information regarding SWF; however he works for an
internal security of the majesty and country so understand the implications of what
MoF is doing.
He explained that any multi-million transaction has to be approved by either panel
designated by Sultan or be approved by central bank of Oman. If MoF is not following
this procedure then it is violation of constitution of Oman and existing laws.
According to him, MoF should be not delegated authority to manage SWF anymore as
they have created an issue of credibility out of it. First of all, a committee formed by
Al-shura, states council, royal office and auditor general should take charge of SWF
from MoF and then create a basic framework of how and who will be the governing
and management team of SWF. This would automatically bring the governance,
transparency and accountability to SWF. In this manner, SWF will be administered by
many public figures and it will not be any more single decision maker‘s portfolio. This
type of restructuring also will bring the trust of employees and Omani citizen in their
SWF just like other countries population is proud of their SWFs, for example Norway,
UAE and Saudi Arabia.

357
Appendix F Final Questionnaire
Dear Participant
Ref.: ‗Analytical study of Sovereign Wealth Funds‘ Policies and Strategies: A Case of
Sultanate of Oman‘
This is a group of questions related to my doctoral thesis about „Sovereign Wealth
Fund in the Sultanate of Oman‟. The information you provide will help to analyse the critical
issues for improvement of the quality of sovereign wealth funds operations and management
for Oman.
Please respond to the question as frankly and honestly as possible since, your response
will be kept strictly confidential. To ensure the utmost privacy, only the research team will
have access to the information you provide as responses in the attached questionnaire.
A formal approval has been already sought to launch this questionnaire within
financial institutions in the sultanate of Oman. On the completion of the project, a set of
recommendations would be prepared for Oman wealth funds‘ management to improve returns.
Thank you very much for your time and co-operation. I greatly appreciate your
organizations and your help in furthering this research endeavour.
Kind regards
Majid Al-Saidi

358
‘Analytical study of Sovereign Wealth Funds’ (SWF) Policies and Strategies:
A Case of Sultanate of Oman’
This study is about the SWF of Oman. The following questions are designed to assess the
factors and their impact on working of SWF.
For most of the questions, a general Likert scale of 1 to 7 is adopted. Scale of 1 to 7 is
categorised as
1 = Strongly disagree with the statement given
2 = Disagree
3 = Disagree to an extent
4 = Can not say
5 = Agree to an extent
6 = Agree
7 = Strongly agree with the statement given
Where there is no Likert scale option, other choices are given to select. Please mark your
responses using cross, tick or circle marks on the number.
There are no right or wrong answers for any questions so please do not have any fright to
provide the answer based on your understanding, knowledge and experience. The questions are
designed in the easy to understand words. However, feel free to seek any assistance for
responding to any question.
Your details are collected to analyse the responses for each management level and
organizational groups. To maintain the confidentiality, it is collected separately on the next
page 3.
On completion, please keep the questionnaire in the reply envelope provided and seal it. This
would be collected from you by a member authorised as part of the research team.

359
Respondent’s information
Name: ------------------------------------------------------------------------------------------------------
(optional)
Ministry/ Unit: --------------------------------------------------------------------------------------------
Reserved Funds' Related handled tasks: --------------------------------------------------------------
----------------------------------------------------------------------------------------------------------------
Your designation in the company: -----------------------------------------------------------------------

360
Questionnaire
Section A : Current Status of Oman SWF
1. You agree that following are the Main Objectives of Oman Sovereign Wealth Fund.
(H6)
To fund public expenditure 1 2 3 4 5 6 7
To promote long term consideration of oil revenues 1 2 3 4 5 6 7
To develop economy and industry within the country 1 2 3 4 5 6 7
To bring change through responsible investments 1 2 3 4 5 6 7
To increase return and value of foreign investments 1 2 3 4 5 6 7
To stabilize the currency of Oman 1 2 3 4 5 6 7
To increase the bilateral trade with selected countries 1 2 3 4 5 6 7
To achieve any political objective through investments 1 2 3 4 5 6 7
To meet the strategic demand of developed countries 1 2 3 4 5 6 7
2. Following is true in case of the present Structure of the fund: (H6)
Purpose of setting up fund in unclear 1 2 3 4 5 6 7
Objectives of operating SWF are ambiguous 1 2 3 4 5 6 7
Ownership of the fund is of Govt. of Oman but it is
largely controlled by Ministers in the Government
1 2 3 4 5 6 7
Sources of funds for SWF are many but are not monitored
or controlled
1 2 3 4 5 6 7
Management style of the SWF is like govt. body and not
like a professionally managed company
1 2 3 4 5 6 7
All decisions are superseded by Ministers and
professional knowledge or experience is not utilized
1 2 3 4 5 6 7
Conflicts are left unresolved within SWF 1 2 3 4 5 6 7
3. Currently, Investee Countries are selected based on: (H2) & (H5)
Political reasons 1 2 3 4 5 6 7
National security 1 2 3 4 5 6 7
Investment environment 1 2 3 4 5 6 7
Availability of investment laws and regulations 1 2 3 4 5 6 7
Strategic alliance with common interests 1 2 3 4 5 6 7
Meaningful on long-term 1 2 3 4 5 6 7
Strong growth and development 1 2 3 4 5 6 7

361
Section B : Factors Affecting Oman SWF
4. The following aspects form the major Governance Reform agenda for Oman SWF:
(H1)
Good Governance procedures are in place 1 2 3 4 5 6 7
Appropriate Disclosure of information is in place within
and outside the fund
1 2 3 4 5 6 7
Decisions makers are fully accountable for investment
decisions they make
1 2 3 4 5 6 7
Managerial roles are clearly defined 1 2 3 4 5 6 7
SWF managers take overall responsibility of SWF
considering it as wealth of national population
1 2 3 4 5 6 7
5. You agree to following statements in terms of Transparency surrounding the
investment process: (H1)
Government investments are regularly announced 1 2 3 4 5 6 7
Investment returns are present in state public budget 1 2 3 4 5 6 7
Regulators can review wealth fund reports 1 2 3 4 5 6 7
Investment strategy use benchmarks 1 2 3 4 5 6 7
Strategy limits the investments based on ratings 1 2 3 4 5 6 7
Regular evaluation and follow-up is reported
6. Oman SWF invests in the companies which follow Globally Accepted Laws of: (H1)
& (H5)
Human rights 1 2 3 4 5 6 7
Child labour laws 1 2 3 4 5 6 7
Equality and diversity laws 1 2 3 4 5 6 7
Fair employee treatment criteria 1 2 3 4 5 6 7
Pollution control limits 1 2 3 4 5 6 7
Weapon control limits 1 2 3 4 5 6 7
Money laundering regulations 1 2 3 4 5 6 7
7. You agree that following are true in case of Oman SWF Investments Rights in foreign
companies as an investor: (H2) & (H4)
Having the right to vote 1 2 3 4 5 6 7
Having the right to nominate and elect directors 1 2 3 4 5 6 7
Having the right to trade shares freely 1 2 3 4 5 6 7
Having the right to open and timely information 1 2 3 4 5 6 7
8. You agree that following attributes of Trade Balances affect SWF significantly. (H3)
Volume of bi-lateral trade 1 2 3 4 5 6 7
Currency value changes through trade balances 1 2 3 4 5 6 7
Trade balance effects on gross domestic production 1 2 3 4 5 6 7

362
9. Lack of Investment Planning affects the investment strategy in the form of: (H4), (H7),
and (H8)
Short term planning 1 2 3 4 5 6 7
Decisions contain personal bias 1 2 3 4 5 6 7
Decisions appraisals are merit based 1 2 3 4 5 6 7
Absence of development plans and goals 1 2 3 4 5 6 7
Over dependence on specific persons for decisions 1 2 3 4 5 6 7
Administration system is un-organized 1 2 3 4 5 6 7
There is lack of professional skills 1 2 3 4 5 6 7
Lack of training funds for talent development 1 2 3 4 5 6 7
10. Oman doesn‘t Integrate Investments with other Gulf countries, especially their
leading investors (Abu Dhabi, Dubai, Qatar and Kuwait) due to: (H5), (H8)
Political reasons 1 2 3 4 5 6 7
Administrative and financial differences 1 2 3 4 5 6 7
Unwillingness of the Sultanate 1 2 3 4 5 6 7
Unwillingness of neighbouring countries 1 2 3 4 5 6 7
It is not helpful 1 2 3 4 5 6 7
Difference in Size of investments and experience 1 2 3 4 5 6 7
11. Absence of a specific plan in place to shape the foreign investment is due to: (H4)
Govt. departments have overlapping responsibilities 1 2 3 4 5 6 7
Lack of interest from Govt. 1 2 3 4 5 6 7
Fear of risky foreign investment 1 2 3 4 5 6 7
Liquidity needed within the country 1 2 3 4 5 6 7
Political agenda is stronger 1 2 3 4 5 6 7
12. Following drawback of Sponsoring Country Laws in Oman affect the growth of fund.
(H5)
It requires updating 1 2 3 4 5 6 7 Old laws are inappropriate with global markets 1 2 3 4 5 6 7
Current laws are very general 1 2 3 4 5 6 7
Favours local investments over foreign investments 1 2 3 4 5 6 7
Based on political objectives rather than investments 1 2 3 4 5 6 7
12. The following changes to Laws & Regulations will improve the investment process:
(ST D1)
Diversifying Investment options 1 2 3 4 5 6 7
Applying common objectives to all funds 1 2 3 4 5 6 7
Identifying means of follow-up & assessment 1 2 3 4 5 6 7
Determining penalties for accountability 1 2 3 4 5 6 7
Conducting specialized research studies 1 2 3 4 5 6 7
14. The foreign investments Allocation is done with the following objectives: (H7)
Capital utilization 1 2 3 4 5 6 7
Diversification of income sources 1 2 3 4 5 6 7
The achievement of sovereign status 1 2 3 4 5 6 7
Integration with world markets 1 2 3 4 5 6 7

363
15. Rejection of Foreign Investments is resulted from the following: (H5)
Risk of low return 1 2 3 4 5 6 7
Priority towards local investment 1 2 3 4 5 6 7
Lack of clear objectives 1 2 3 4 5 6 7
Lack of sufficient information on global markets 1 2 3 4 5 6 7
Absence of agencies in investment decision-making 1 2 3 4 5 6 7
Risk of confiscation of capital invested 1 2 3 4 5 6 7
Wars and unrest 1 2 3 4 5 6 7
Bi-lateral trade relations 1 2 3 4 5 6 7
16. Foreign Investments are favoured on the basis of: (H7)
Low risk 1 2 3 4 5 6 7
Substantial financial returns 1 2 3 4 5 6 7
Guaranteed growth potential 1 2 3 4 5 6 7
Level of durability 1 2 3 4 5 6 7
Carrying global demand 1 2 3 4 5 6 7
Preferred by competing funds 1 2 3 4 5 6 7
Technology transfer objective 1 2 3 4 5 6 7
17. Globally Specialized Companies are approached for an investment opinion due to:
(H4), (H7)
To do market research about global trends and
competitors
1 2 3 4 5 6 7
Non-availability of sufficient expertise 1 2 3 4 5 6 7
To increase returns on investments made 1 2 3 4 5 6 7
To reduce internal staff costs 1 2 3 4 5 6 7
Absence of dedicated team to manage the process 1 2 3 4 5 6 7
Lack of clear policies and investment objectives 1 2 3 4 5 6 7
If any other reason, please mention here ______________________________
18. Following scenarios are designed to develop the Investment Deal process further.
(H7)
Increase the volume of foreign investments 1 2 3 4 5 6 7
Diversification of investments 1 2 3 4 5 6 7
Investment in new countries 1 2 3 4 5 6 7
Reduce the overall number of investment holdings 1 2 3 4 5 6 7
Help of specialized firms like Banks and Consultants 1 2 3 4 5 6 7
19. Following dimensions affect the Operational Efficiency of the fund: (H7), (H8)
Systematic Decision making process 1 2 3 4 5 6 7
Reliable decision making using professional managerial
expertise
1 2 3 4 5 6 7
Research based decision making 1 2 3 4 5 6 7

364
20. The criteria upon which the Investment Decision is based are: (H8)
Volume of interest 1 2 3 4 5 6 7
Margin of risk 1 2 3 4 5 6 7
Financial guarantees 1 2 3 4 5 6 7
Security and stability of the country invested in 1 2 3 4 5 6 7
Return on investment 1 2 3 4 5 6 7
Size of the deal 1 2 3 4 5 6 7
Asset class of the investment 1 2 3 4 5 6 7
Section C : Change and Future of Oman SWF
21. Oman SWF investment performance is evaluated based on : (D)
Oman's policy towards Investment functions 1 2 3 4 5 6 7
Oman's performance compared to other GCC funds 1 2 3 4 5 6 7
The proportion of funds invested against returns 1 2 3 4 5 6 7
Comparisons with global financial institutions 1 2 3 4 5 6 7
Performance of funds in the fields of development 1 2 3 4 5 6 7
Divergence from plans 1 2 3 4 5 6 7
Contribution of the fund in reducing budget deficit 1 2 3 4 5 6 7
Rate of return achieved by fund 1 2 3 4 5 6 7
22. Below are Possible Solutions to develop investment strategy which would make Oman
SWF competitive and growing. (IST)
Increasing importance of investment objectives 1 2 3 4 5 6 7
Creating plans and specific goals 1 2 3 4 5 6 7
Developing new laws and regulations 1 2 3 4 5 6 7
Cooperation and integration with GCC countries 1 2 3 4 5 6 7
Outsourcing global expertise from companies 1 2 3 4 5 6 7
Developing specialized human resources 1 2 3 4 5 6 7
Increase research for world markets 1 2 3 4 5 6 7
Adopting the system of assessment 1 2 3 4 5 6 7
A heavy sanctions for transgressors 1 2 3 4 5 6 7
23. Following Changes may improve the Fund‘s current success rate: (IST)
Increase the amount available to invest from current
allocation limit of ‗15% of Oil revenue‘ to SWF
1 2 3 4 5 6 7
Increase the overseas investments 1 2 3 4 5 6 7
Increase the investment in emerging markets 1 2 3 4 5 6 7
Increase the local industry's investment 1 2 3 4 5 6 7
Bring Transparency level to international standards 1 2 3 4 5 6 7

365
24. You agree that following issues have significant Impacts on the Progress of Oman
sovereign wealth fund. And, we shall remove these weakening aspects. (IST)
Bureaucratic decision making hierarchy 1 2 3 4 5 6 7
Risk aversion policy 1 2 3 4 5 6 7
Absence of any regulatory system 1 2 3 4 5 6 7
Lack of strategic planning 1 2 3 4 5 6 7
No usage of fund management skills 1 2 3 4 5 6 7
Non-research based investment decisions 1 2 3 4 5 6 7
Heavy emphasis on local investments 1 2 3 4 5 6 7
Spending investments money for budget deficit 1 2 3 4 5 6 7
Managing SWF from the finance ministry 1 2 3 4 5 6 7
25. You agree that following attributes may help to Improve the Success Rate of Oman
SWF: (D)
Development of local talent 1 2 3 4 5 6 7
Strong cultural and religion integration of population 1 2 3 4 5 6 7
Improving trade relations within GCC region 1 2 3 4 5 6 7
Introducing new laws and regulations 1 2 3 4 5 6 7
Availability of multi sources of funds 1 2 3 4 5 6 7
Increasing consumer markets in Oman 1 2 3 4 5 6 7
Increasing governance and transparency of SWF 1 2 3 4 5 6 7

366
Section D: Investment Decision Making Process
Please select the most appropriate answers to decision making system of Oman SWF for
each question from the alternatives provided. You may select more than one answer, in that mention
your comments for selection.
No Attribute 1
Do recipient country clients approach SWF first to start the negotiation? A: Yes, this happens in most cases B: No, it is very rare that they approach fund directly C: It depends on the opportunity and needs of either side.
2
Whom does the client contact first in case the amount involved is large? A: Government Ministry B: Top Management or Decision makers in SWF C: Departmental Managers in SWF D: Client‘s representative like consultant or investment banks contacts SWF
3
What documents are required to be submitted by clients initially? A: Project report B: Company report C: Annual report D: Investor presentations
4
Based on which criteria the opportunities are scanned for investment? A: Continuous stable income B: Short term liquidity and profit C: Currency stabilization D: Strategic assets
5
Which factors influenced the appraisal of the investment proposals? A: Strategic advantage over other competing SWFs B: Financial returns C: Bilateral trade with that country D: Political motives
6
What is the organizational hierarchy to finalize the investment? A: Client --> SWF top management --> Ministry --> SWF managers -->
Client B: Client --> Ministry --> SWF top management --> Client C: SWF top management --> Ministry --> Client --> SWF managers D: SWF managers --> Client --> Ministry --> SWF top management
7
Who manages the account post-investment?
A: Government Finance Ministry
B: SWF managers
C: Professional consultant / appointed advisor
8
Who is responsible for making Decision Making of investment deals?
A:Each investment unit E: Specialized organization
B: An ad-hoc committee F: Minister
C: Special taskforce team G: Professional Manager
D: Financial institutions H: External Portfolio Consultant
9
What is the reporting structure for deal monitoring or divestment? A: Ministry informs SWF management B: SWF management submits approval request to Government C: If other, please specify.
10
What is re-investment or utilization of return or profit from the
investments?

367
A: Addition to SWF assets for re-investment B: Transfer to other Government accounts C: Direct allocation to government sponsored projects within the country
11
Why do SWF carry out divestment? A: Social responsibility reasons like pollution by that company B: Trade regulations in that country C: Trade relations with that country D: Political relations with that country E: Decreasing Assets value F: Decreasing currency exchange rate of that country
You may provide your responses to the following last question in the space provided.
Could you tell me about recent specific incidents of a sovereign wealth fund that you feel went
very well and went badly? Describe these two incidents and explain that why did you choose
this incident.
A. Incident that went well:
B. Incident that could have been improved:
I would like to thank you for your valuable time and contribution in the research for
Sovereign Wealth Fund of Sultanate of Oman and other countries. Your response is
critical to further development and is really important.

368
Appendix G Global Sovereign Wealth Funds
Country & Fund Name Amount US$ bn Inception Main source
United Arab Emirates Abu Dhabi Investment Authority (ADIA) 875 1976 Oil
Singapore Government of Singapore Investment Corporation (GIC) 330 1981 Non-commodity
Norway Government Pension Fund - Global (GPFG) 322 1990 Oil
Saudi Arabia Various funds 300 NA Oil
Kuwait Investment Authority (KIA) 250 1953 Oil
China China Investment Company Ltd. 200 2007 Non-commodity
Hong Kong Hong Kong Monetary Authority Investment Portfolio 140 1998 Non-commodity
Russia Stabilization Fund of the Russian Federation (SFRF) 127 2003 Oil
China Central Hujin Investment Corp. 100 2003 Non-commodity
Singapore Temasek Holdings 108 1974 Non-commodity
Australia Australian Government Future Fund (AGFF) 50 2004 Non-commodity
Libya Reserve Fund 50 NA Oil
Qatar Qatar Investment Authority (QIA) 40 2000 Oil
United States Alaska Permanent Reserve Fund Corporation (APRF) 40 1976 Oil
Brunei Brunei Investment Agency (BIA) 35 1983 Oil
Ireland National Pensions Reserve Fund (NPRF) 29 2001 Non-commodity
Algeria Reserve Fund 25 NA Oil
South Korea Korea Investment Corporation (KIC) 20 2006 Non-commodity
Malaysia Khazanah National BHD (KNB) 18 1993 Non-commodity
Kazakhstan Kazakhstan National Fund (KNF) 18 2000 Oil, gas, metals
Canada Alberta Heritage Fund (AHF) 17 1976 Oil
Taiwan Taiwan National Stabilisation Fund (TNSF) 15 2000 Non-commodity
United States New Mexico State Investment Office Trust Funds 15 1958 Non-commodity
Iran Foreign Exchange Reserve Fund 15 1999 Oil
Nigeria Excess Crude Account 11 2004 Oil
New Zealand New Zealand Superannuation Fund 10 2003 Non-commodity
Oman State General Stabilisation Fund (SGSF) 8.2 1980 Oil, gas
Chile Economic and Social Stabilization Fund (ESSF) 6.0 2007 Copper
Botswana Pula Fund 4.7 1993 Diamonds et al.
United States Permanent Wyoming Mineral Trust Fund (PWMTF) 3.2 1974 Minerals
Norway Government Petroleum Insurance Fund (GPIF) 2.6 1986 Oil
Azerbaijan State Oil Fund 1.5 1999 Oil
East Timor Timor-Leste Petroleum Fund 1.2 2005 Oil, gas
Venezuela Investment Fund for Macroeconomic Stabilization (FIEM) 0.8 1998 Oil
Kiribati Revenue Equalisation Reserve Fund (RERF) 0.6 1956 Phosphates
Chile Pension Reserves Fund 0.6 2007 Copper
Uganda Poverty Action Fund 0.4 1998 Aid
Papua New Guinea Mineral Resources Stabilization Fund (MRSF) 0.2 1974 Minerals
Mauritania National Fund for Hydrocarbon Reserves 0.0 2006 Oil, gas
United Arab Emirates Dubai Intern. Financial Centre Investments (DIFC) NA 2002 Oil
Angola Reserve Fund for Oil NA 2007 Oil
Total 3,190.00
Memorandum items: Planned SWF projects
China State Foreign Exchange Investment Corporation (SFEIC) 200 2007e Non-commodity
Russia Future Generations Fund of the Russian Federation (SFRF) 32 2008e Oil
Bolivia (Establishment of SWF planned) NA 2008e Oil
Japan (Establishment of SWF presumed) NA Non-commodity
Source: Kern (2007) at www.dbresearch.com