overview importance of preserving muscle mass/function optimal nutrition positively influences...
TRANSCRIPT


Overview
• Importance of preserving muscle mass/function
• Optimal nutrition positively influences subsequent physical function
• Role of early rehabilition/mobilization
• Need both optimal nutrition and optimal mobilization to optimize outcome!

Clinical Scenario
79 yo male admitted to hospital with AMI Progressive respiratory failure Aspirates ARDS Low volume ventilation, high PEEP, NO Course complicated by line sepsis resulting in
need for pressors and renal failure• @ 3 weeks, family asks “how much longer do we
prolong this?”• “not just about survival; what will he be like?”
Moving Beyond Survival!


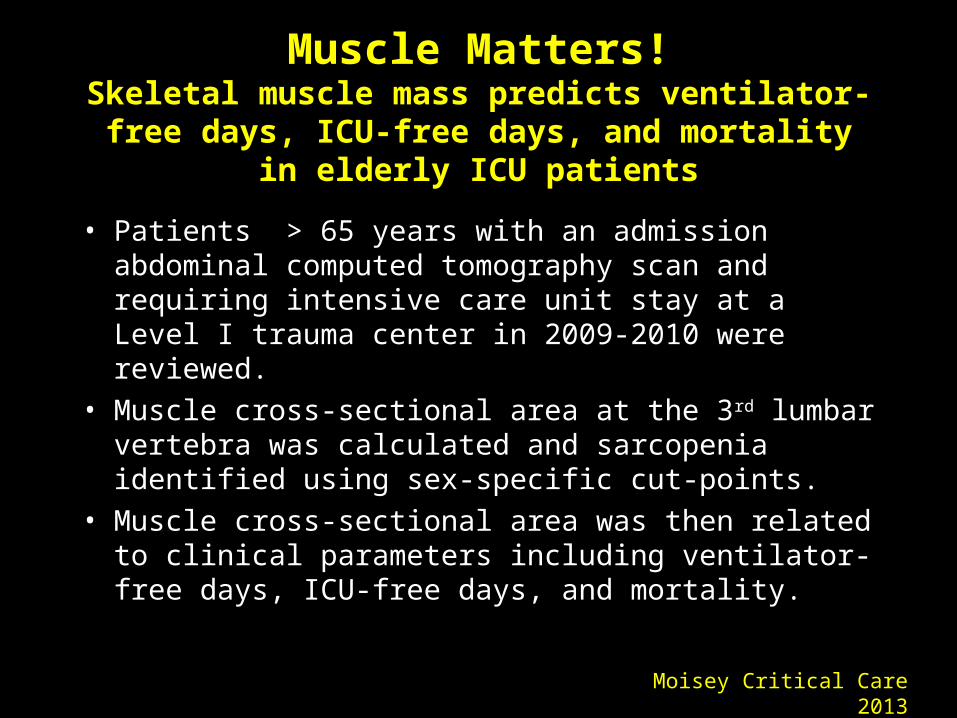
Muscle Matters!Skeletal muscle mass predicts ventilator-free days, ICU-
free days, and mortality in elderly ICU patients
• Patients > 65 years with an admission abdominal computed tomography scan and requiring intensive care unit stay at a Level I trauma center in 2009-2010 were reviewed.
• Muscle cross-sectional area at the 3rd lumbar vertebra was calculated and sarcopenia identified using sex-specific cut-points.
• Muscle cross-sectional area was then related to clinical parameters including ventilator-free days, ICU-free days, and mortality.
Moisey Critical Care 2013

Skeletal Muscle
Adipose Tissue

Physical Characteristics of Patients
• N=149 patients
• Median age: 79 years old
• 57% males
• ISS: 19
• Prevalence of sarcopenia: 71%

BMI CharacteristicsAll Patients Sarcopenic
Patients (n=106)Non-sarcopenic Patients (n=43)
BMI (kg/m2) 25.8 (22.7, 28.2) 24.4 (21.7, 27.3) 27.6 (25.5, 30.4)
Underweight, % 7 9 2
Normal Weight, % 37 44 19
Overweight, % 42 38 51
Obese, % 15 9 28
Not all sarcopenics underweight!!
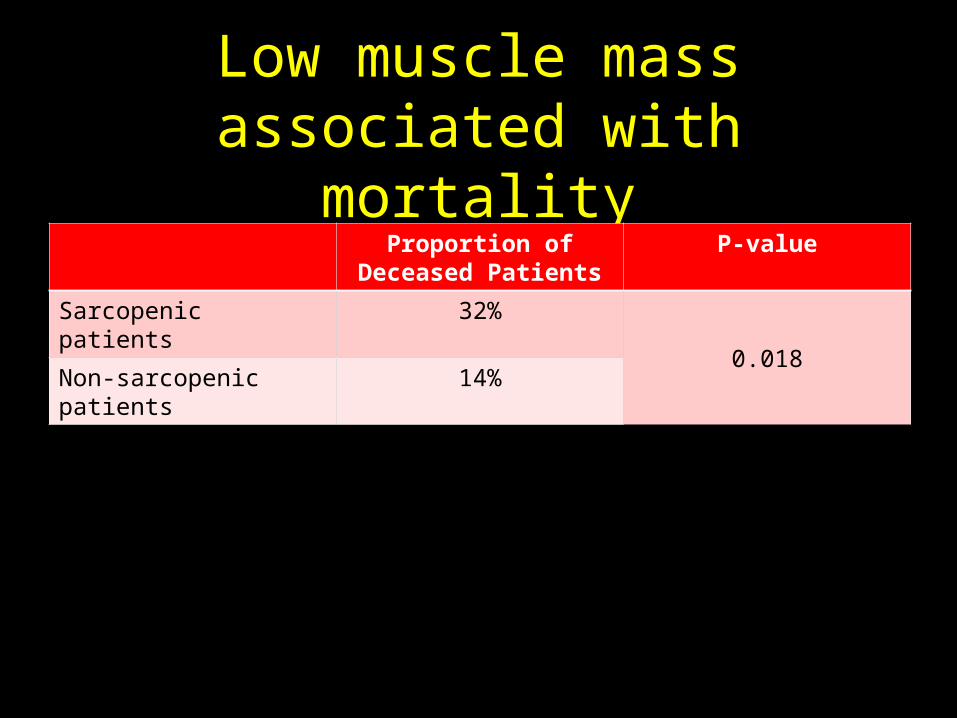
Low muscle mass associated with mortality
Proportion of Deceased Patients
P-value
Sarcopenic patients 32%0.018
Non-sarcopenic patients 14%
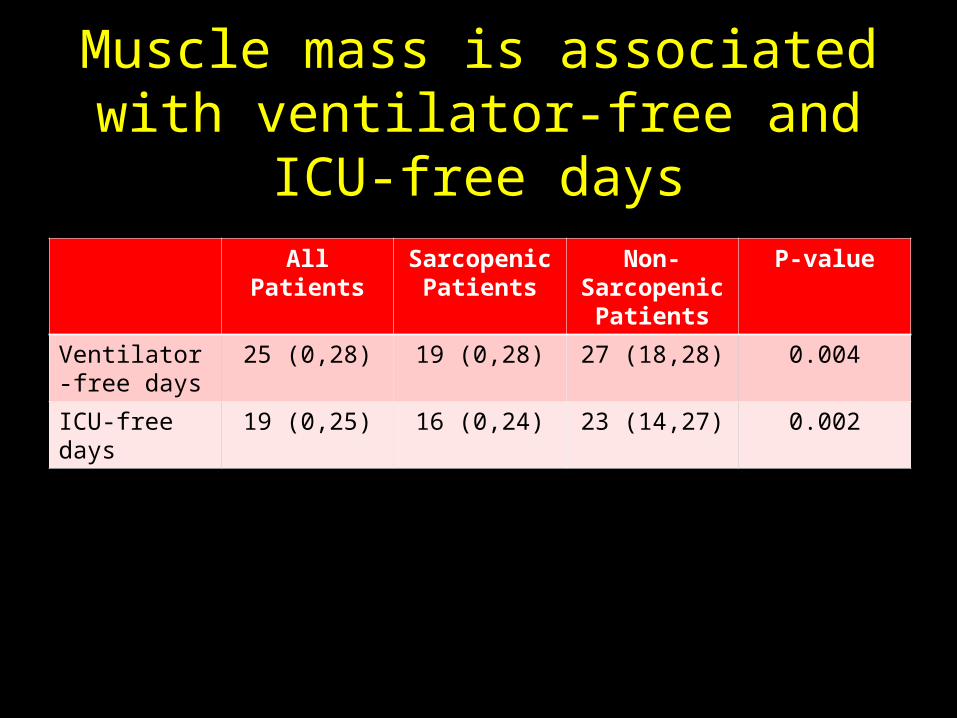
Muscle mass is associated with ventilator-free and ICU-free
daysAll Patients Sarcopenic
PatientsNon-
Sarcopenic Patients
P-value
Ventilator-free days
25 (0,28) 19 (0,28) 27 (18,28) 0.004
ICU-free days 19 (0,25) 16 (0,24) 23 (14,27) 0.002

Determinants to Lean Body Mass
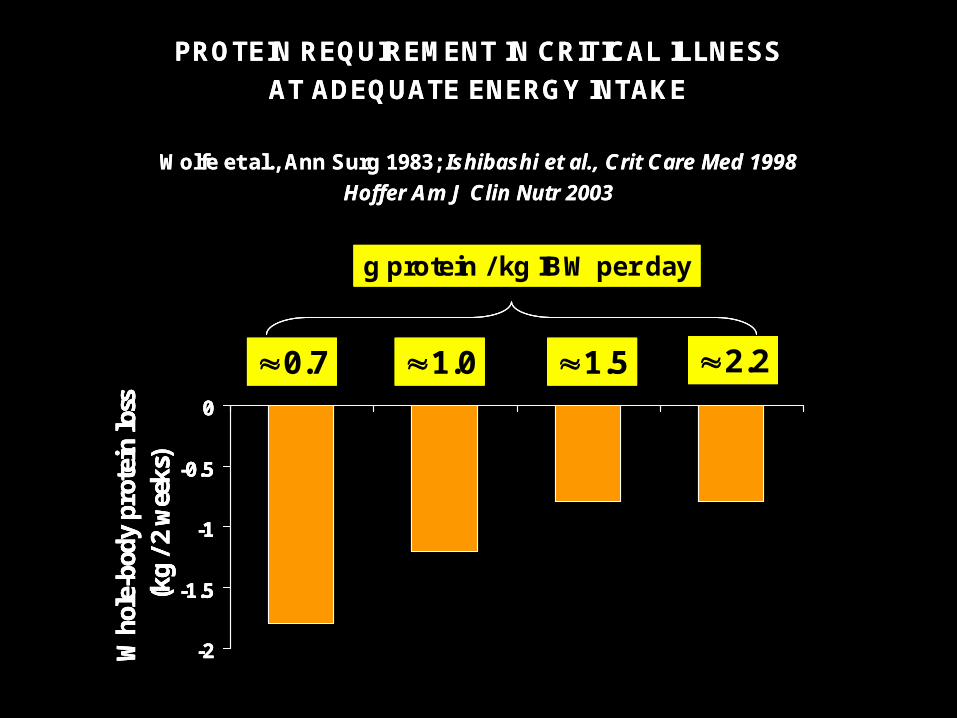
PROTEIN REQUIREMENT IN CRITICAL ILLNESS
AT ADEQUATE ENERGY INTAKE
Wolfe et al., Ann Surg 1983; Ishibashi et al., Crit Care Med 1998
Hoffer Am J Clin Nutr 2003
-2
-1.5
-1
-0.5
0
Who
le-b
ody
prot
ein
loss
(kg
/ 2 w
eeks
)
g protein / kg IBW per day
0.7 1.0 1.5 2.2
PROTEIN REQUIREMENT IN CRITICAL ILLNESS
AT ADEQUATE ENERGY INTAKE
Wolfe et al., Ann Surg 1983; Ishibashi et al., Crit Care Med 1998
Hoffer Am J Clin Nutr 2003
-2
-1.5
-1
-0.5
0
Who
le-b
ody
prot
ein
loss
(kg
/ 2 w
eeks
)
g protein / kg IBW per day
0.7 1.0 1.5 2.2
-2
-1.5
-1
-0.5
0
Who
le-b
ody
prot
ein
loss
(kg
/ 2 w
eeks
)
g protein / kg IBW per day
0.7 1.0 1.5 2.2

Protein balance improved with optimal caloric feeding
Berg Crit Care 2013;17:R158
Whole body protein synthesis Whole body protein degradation
Phenylalanine oxidation Whole body protein balance

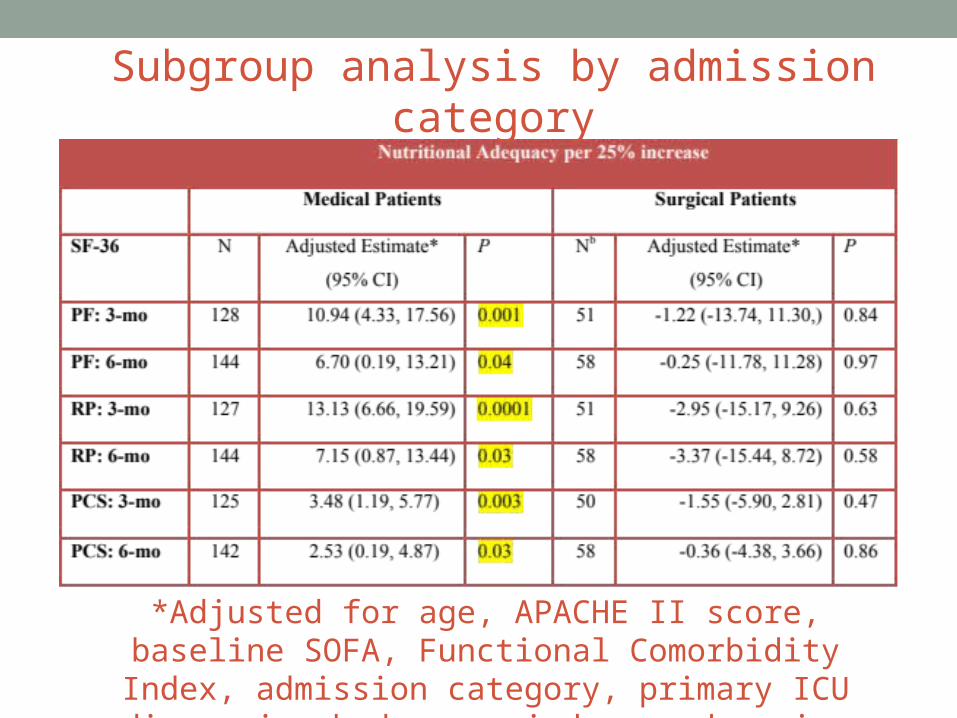
Nutritional Adequacy and Health-related Quality of Life in Critically Ill
Patients Requiring Prolonged Mechanical Ventilation
• Sub study of the REDOXS study• 302 patients survived to 6-months follow-up and were
mechanically ventilated for more than eight days in the intensive care unit were included.
• Nutritional adequacy was obtained from the average proportion of prescribed calories received during the first eight days of mechanical ventilation in the ICU.
• HRQoL was prospectively assessed using Short-Form 36 Health Survey (SF-36) questionnaire at three-months and six-months post ICU admission.

Estimates of association between nutritional adequacy and SF-36 scores
*Adjusted for age, APACHE II score, baseline SOFA, Functional Comorbidity Index, admission category, primary ICU diagnosis, body mass index, and region
*Adjusted for age, APACHE II score, baseline SOFA, Functional Comorbidity Index, admission category, primary
ICU diagnosis, body mass index, and region
Subgroup analysis by admission category

More (and Earlier) is Better!
If you feed them (better!)They will leave (sooner!)

• 63 critically ill patients
• Muscle loss determined by serial US of rectus femoris (CSA) on days 1, 3, 5, 7 and 10
• Histopathologic analysis also performed
• Protein signal pathways analyzed
JAMA Published online Oct 9, 2013

JAMA Published online Oct 9, 2013

• “In a multivariable linear analysis, change in rectus femoris CSA was positively associated with the degree of organ failure, CRP level and amount of protein delivered”
JAMA Published online Oct 9, 2013

• “…increasing protein delivery was associated with increased muscle wasting.”
JAMA Published online Oct 9, 2013
Clinical Implications

Guilty by Association
• Patients who stay longer in the ICU has worse outcomes
• Patients who stay longer in the ICU will have more muscle loss
• Patients in the ICU will have greater opportunity to tolerate more protein/calories
Error to assume that protein causes muscle loss or adverse outcomes

Optimal Amount of Calories for Critically Ill Patients:
Depends on how you slice the cake!
• Objective: To examine the relationship between the amount of calories recieved and mortality using various sample restriction and statistical adjustment techniques and demonstrate the influence of the analytic approach on the results.
• Design: Prospective, multi-institutional audit
• Setting: 352 Intensive Care Units (ICUs) from 33 countries.
• Patients: 7,872 mechanically ventilated, critically ill patients who remained in ICU for at least 96 hours.
Heyland Crit Care Med 2011

Association between 12 day average caloric adequacy and
60 day hospital mortality(Comparing patients rec’d >2/3 to those who rec’d
<1/3)A. In ICU for at least 96 hours. Days after permanent progression to exclusive oral feeding are included as zero calories*
B. In ICU for at least 96 hours. Days after permanent progression to exclusive oral feeding are excluded from average adequacy calculation.*
C. In ICU for at least 4 days before permanent progression to exclusive oral feeding. Days after permanent progression to exclusive oral feeding are excluded from average adequacy calculation.*
D. In ICU at least 12 days prior to permanent progression to exclusive oral feeding*
*Adjusted for evaluable days and covariates,covariates include region (Canada, Australia and New Zealand, USA, Europe and South Africa, Latin America, Asia), admission category (medical, surgical), APACHE II score, age, gender and BMI.
0.4 0.6 0.8 1.0 1.2 1.4 1.6
UnadjustedAdjusted
Odds ratios with 95% confidence intervals

Association Between 12-day Caloric Adequacy and 60-Day Hospital
Mortality
Heyland CCM 2011
Optimal amount= 80-85%

Early vs. Late Parenteral Nutrition in Critically ill Adults
• 4620 critically ill patients
• Randomized to early PN
– Rec’d 20% glucose 20 ml/hr then PN on day 3
• OR late PN
– D5W IV then PN on day 8
• All patients standard EN plus ‘tight’ glycemic control
Cesaer NEJM 2011
• Results:
Late PN associated with
• 6.3% likelihood of early discharge alive from ICU and hospital
• Shorter ICU length of stay (3 vs 4 days)
• Fewer infections (22.8 vs 26.2 %)
• No mortality difference

Early Nutrition in the ICU: Less is more!
Post-hoc analysis of EPANIC
Casaer Am J Respir Crit Care Med 2013;187:247–255
Treatment effect persisted in all subgroups

Early Nutrition in the ICU: Less is more!
Post-hoc analysis of EPANIC
Casaer Am J Respir Crit Care Med 2013;187:247–255
Protein is the bad guy!!
Indication bias: 1) patients with longer
projected stay would have been fed more aggressively;
hence more protein/calories is associated with longer lengths of stay. (remember this is an
unblinded study). 2) 90% of these patients are elective surgery. there would have been little effort to feed them and they would have
categorically different outcomes than the longer stay
patients in which their were efforts to feed
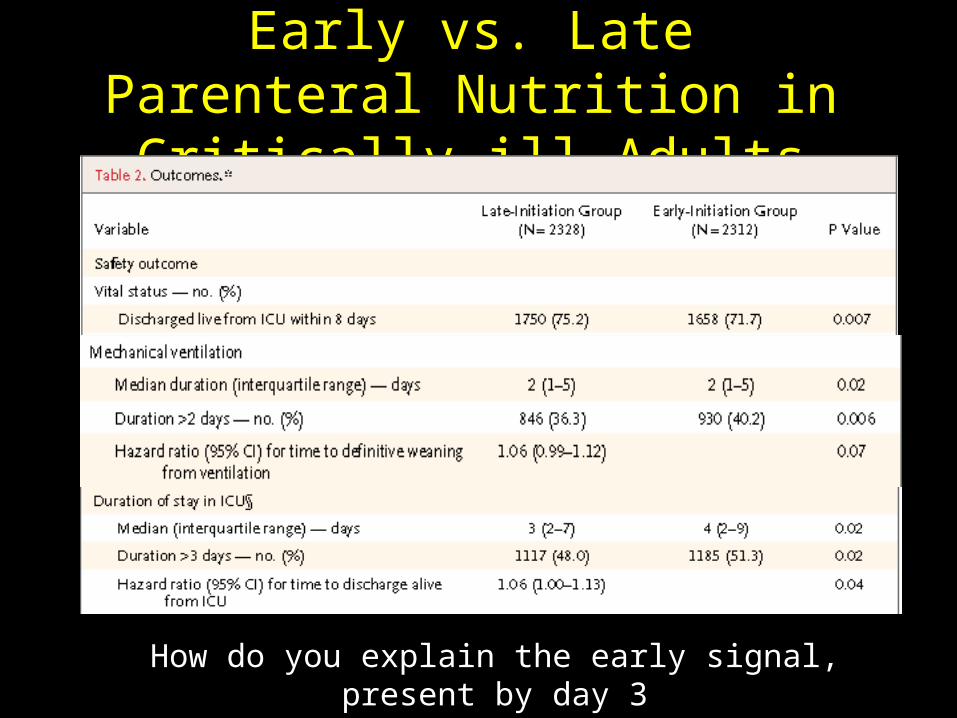
Early vs. Late Parenteral Nutrition in Critically ill Adults
How do you explain the early signal, present by day 3
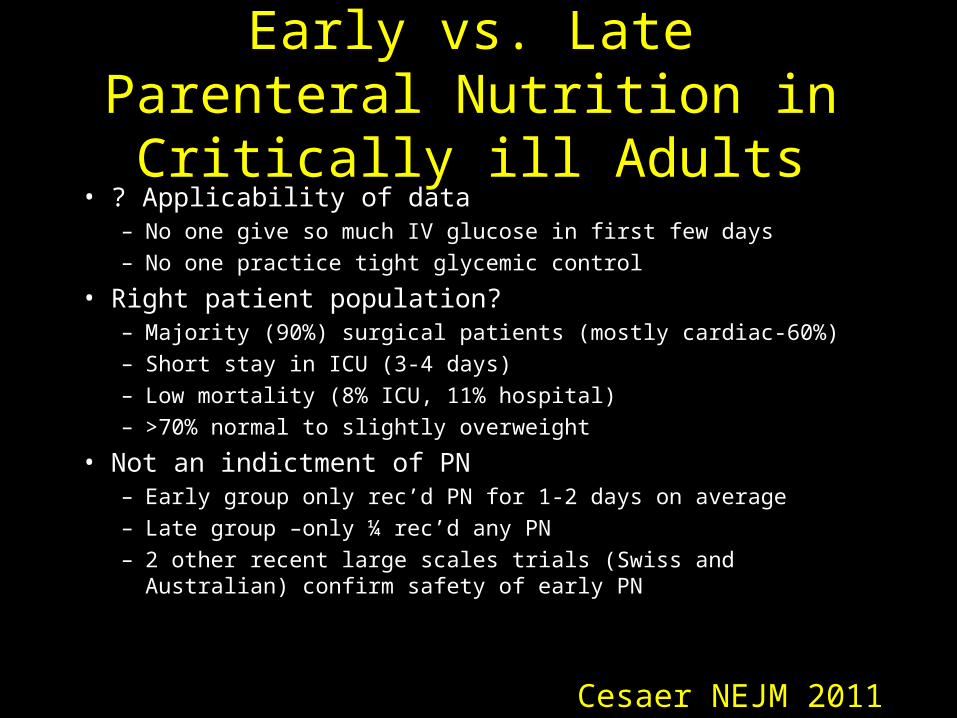
Early vs. Late Parenteral Nutrition in Critically ill Adults• ? Applicability of data
– No one give so much IV glucose in first few days
– No one practice tight glycemic control
• Right patient population?– Majority (90%) surgical patients (mostly cardiac-60%)
– Short stay in ICU (3-4 days)
– Low mortality (8% ICU, 11% hospital)
– >70% normal to slightly overweight
• Not an indictment of PN– Early group only rec’d PN for 1-2 days on average
– Late group –only ¼ rec’d any PN
– 2 other recent large scales trials (Swiss and Australian) confirm safety of early PN
Cesaer NEJM 2011

Rice et al. JAMA 2012;307
No comment on protein intakeFactorialized with OMEGA where half patients
received extra 20 grams/day

Rice et al. JAMA 2012;307
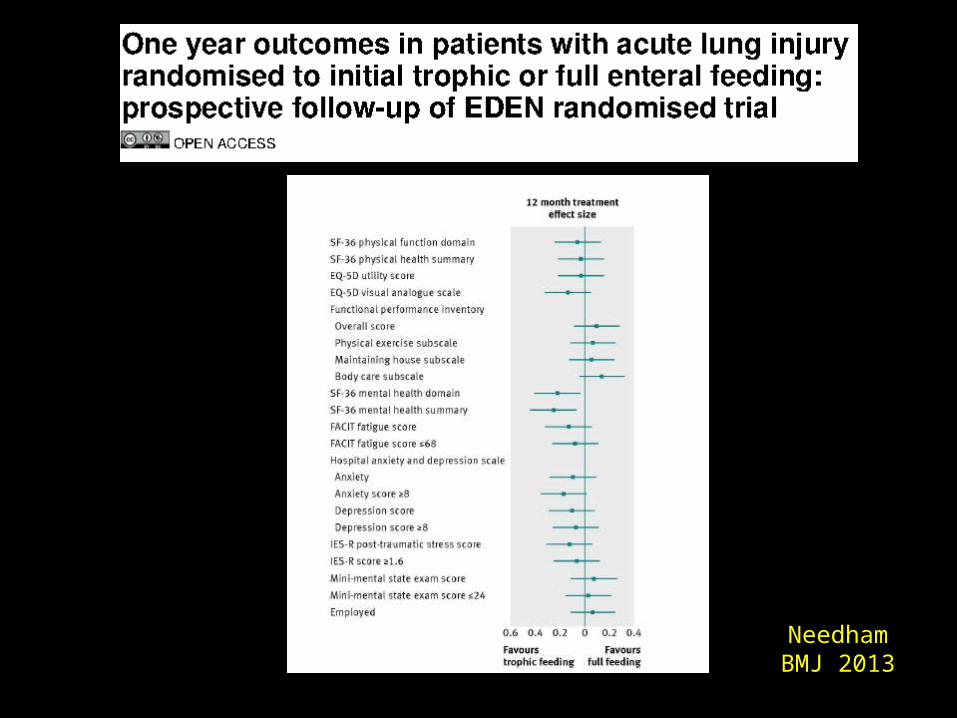
Needham BMJ 2013

Rice et al. JAMA 2012;307
Enrolled 12% of patients screened

Trophic vs. Full enteral feeding in critically ill patients with acute respiratory failure
• Average age 52
• Few comorbidities
• Average BMI 29-30
• All fed within 24 hrs (benefits of early EN)
• Average duration of study intervention 5 days
No effect in young, healthy, overweight patients who
have short stays!

Not all ICU Patient the same!
• Low Risk– 34 year former football
player,
– BMI 35
– otherwise healthy
– involved in motor vehicle accident
– Mild head injury and fractured R leg requiring ORIF
• High Risk– 79 women
– BMI 35
– PMHx COPD, poor functional status, frail
– Admitted to hospital 1 week ago with CAP
– Now presents in respiratory failure requiring intubation and ICU admission

Who might benefit the most from nutrition therapy?
• High NUTRIC Score?
• Clinical– BMI– Projected long length of stay
• Nutritional history variables
• Sarcopenia
• Medical vs. Surgical
• Others?

More (and Earlier) is Better!
Particularly in ‘High-risk’ patients
If you feed them (better!)They will leave (sooner!)

Failure Rate
Unpublished observations. Results of 2011 International Nutrition Survey (INS).
75.6 78.1
91.2
75.1
87.0
69.8
79.9

• Different feeding options based on hemodynamic stability and suitability for high volume intragastric feeds.
• In select patients, we start the EN immediately at goal rate, not at 25 ml/hr.
• We target a 24 hour volume of EN rather than an hourly rate and provide the nurse with the latitude to increase the hourly rate to make up the 24 hour volume.
• Start with a semi elemental solution, progress to polymeric
• Tolerate higher GRV threshold (300 ml or more)• Motility agents and protein supplements are started
immediately, rather than started when there is a problem.
The Efficacy of Enhanced Protein-Energy Provision via the Enteral Route in Critically Ill Patients:
The PEP uP Protocol!
A Major Paradigm Shift in How we Feed Enterally
Heyland Crit Care 2010; see www.criticalcarenutrition.com for more information on the PEP uP collaborative

Yes
YESAt 72 hrs
>80% of Goal Calories?
No
NO
No problem
Anticipated Long Stay?
Yes No
Maximize EN with motility agents and small bowel feeding
No
YESTolerating
EN at 96 hrs? Yes
NO
Start PEP UP within 24-48 hrs
High Risk?
Carry on!
Supplemental PN? No problem

Lancet 2009;273:

Critical Illness
Inflammation Nutrition
Muscle Atrophy&
Muscular Weakness
Duration of mechanical ventilation
ICU/hospital LOS
Functional status
QOL
Mobility
NutritionTherapy
? ?
?
EarlyRehabilitation

Questions?